Abstract
We demonstrate for the first time high-precision differential microwave spectroscopy, achieving sub-Hz precision by coupling a cryogenic buffer gas cell with a tunable microwave Fabry–Perot cavity. We report statistically limited sub-Hz precision of (0.08 ± 0.72) Hz, observed between enantiopure samples of (R)-1,2-propanediol and (S)-1,2-propanediol at frequencies near 15 GHz. We confirm highly repeatable spectroscopic measurements compared to traditional pulsed-jet methods, opening up new capabilities in probing subtle molecular structural effects at the 10−10 level and providing a platform for exploring sources of systematic error in parity-violation searches. We discuss dominant systematic effects at this level and propose possible extensions of the technique for higher precision.
1. Introduction
Molecules have been recently added to the selection of tools to test the standard model of particle physics to its limits and beyond [1,2,3,4,5,6,7,8,9,10]. Among the fundamental forces included in the standard model is the electroweak force, which has been observed to produce parity violating (PV) effects, emerging from the exchange of virtual Z0 bosons between electrons and nuclei. PV effects have been observed in a number of different atomic systems [11,12,13,14,15] but have yet to be observed in a molecular system. An experimental measurement of such a shift can provide new information towards answering fundamental questions about homochirality and the origins of life [16,17,18].
This electroweak symmetry breaking is theorized to lift degeneracy between the right and left versions (enantiomers) of chiral molecules, leading to very slight energy differences in spectroscopic transitions. These differences scale with frequency and are calculated to be at the Hz to mHz level for ∼30 THz vibrational transitions and approximately a factor of 1000 smaller for microwave transitions around 20 GHz [19,20]. Chemical theory predicts that the scaling of this energy difference is ∼Z5, where Z is the nuclear charge of the heaviest atom in the molecule, with additional scaling factors up to ∼Z6 as the neutron to proton ratio grows [21]. Thus, there is a large benefit to employing tailor-made chiral molecules with very heavy atoms close to the chiral center [22,23], yielding a shift on the order of = 10−15. However, enantiopure samples of chiral molecules with heavy atoms are rather challenging to produce and are yet more challenging to vaporize [24]. For this reason, 1,2-propanediol was selected as the molecule of interest for these measurements. Small organic molecules with atoms no heavier than oxygen-16 exhibit a PV effect = 10−19 [25], far beyond proposed future experimental capabilities.
Several groups, summarized in Table 1, [26,27,28,29,30,31,32] have proposed or carried out experiments to detect this parity violation effect in the aforementioned tailor-made molecules selected to have large parity-violation effects, but experimental verification of the theoretical result remains elusive. The most convincing effort, by Chardonnet and colleagues, reached sensitivities of = 2.5 × 10⁻¹³ in the molecule CHFClBr, with an absolute uncertainty of ≲ 8 Hz. This effort was limited by systematic errors due to collisional shifts and residual impurities in the samples used and ultimately obtained measurements 104 times less accurate than the computed PV shift for their molecule of interest [19]. Since then, significant improvements have been made and the same group has proposed a new experiment with a buffer gas cell apparatus, which with appropriate molecule selection should be able to detect the energy shift [28].

Table 1.
Comparison of this work to selected previous efforts and one proposed measurement.
We present the first differential measurement of rotational transitions reaching sub-Hz precision with the light chiral molecule, (R/S)-1,2-propanediol. We discuss relevant systematics towards measuring parity-violating effects and provide additional confirmation that (R) and (S)-1,2-propanediol are structurally identical at the 10−10 level. While this limit is modest compared to the = 10−19 mentioned above, it represents the most precise measurement done with microwave spectroscopy to date. We show that our sub-Hz standard deviation of frequency shifts and highly controlled systematics can be a useful probe for subtle effects at this level. Some systematic effects are largely frequency-independent and appear at the same absolute magnitude in both vibrational and rotational experiments. In particular, Stark broadening from stray fields are a well-documented problem in cryogenic experiments, and an experiment with lower fractional precision but better absolute resolution such as the present work provides a valuable test-bed to probe these effects. In addition, we report the coupling of a tunable microwave frequency Fabry–Perot resonator to a cryogenic buffer gas cell. While Fabry–Perot resonators are commonplace in supersonic expansion experiments [35,36,37], and cryogenic optical frequency resonators have some uses [38,39], this had not yet been applied to microwave spectroscopy in a buffer gas cell. Our technique could be applied to a wide variety of chemical species, including species with high-Z atoms which are expected to exhibit a large parity violating shift.
2. Materials and Methods
The buffer gas cell employed in this experiment is a heavily modified version of a previously reported apparatus [40]. The cell is 45 cm × 25 cm × 27 cm with an aperture for sample introduction and three more apertures for cavity adjustment (Figure 1). The additional volume of the buffer gas cell allows for lower buffer gas pressure and thus narrower linewidths in our collisionally broadened resonances. Importantly, it also allows for design flexibility and rapid prototyping of modifications to the cryogenic environment in which spectroscopy takes place. As compared to the previously reported apparatus, the mean free time under typical buffer gas densities is roughly 30 µs versus 10 µs in the smaller cell. The transmission and receiving circuits are largely identical to that reported in [40].
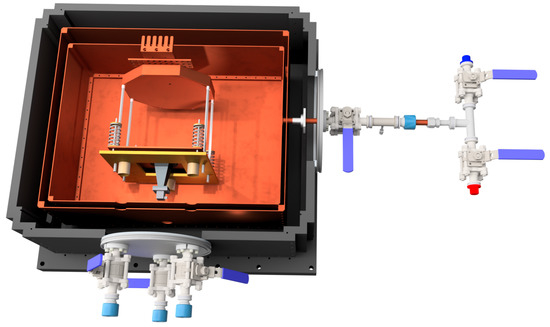
Figure 1.
Half section view of the apparatus, with the 4 K buffer gas cell on the inside, radiation shield, and vacuum chamber on the outside. Visible is the Fabry–Perot cavity, its three adjustment screws, and the springs holding it against the screws. The backing plate and curved mirror are mounted to the ceiling of the buffer gas cell (not shown). The airlocks that allow a screwdriver to be inserted to adjust the screws and the sample introduction manifold to be removed are also visible. The sample introduction manifold has two blind bored KF-16 stubs stuffed with 1,2-propanediol soaked glass wool, one enantiomer in each. The ball valves are alternately opened and closed to change samples. There is a fixed impedance in the tube fitting to moderate sample flow.
The additional volume inside the buffer gas cell allowed the coupling of a tunable plano-concave Fabry–Perot cavity to the experiment, allowing for highly sensitive spectroscopy [35]. Our cavity was constructed with two 20 cm diameter copper mirrors approximately 18 cm apart. One of the mirrors has a spherical concave cutout with a 23.5 cm radius of curvature. The cavity can be tuned by adjusting the mirror spacing, as described below. A benefit of the cavity being in a cryogenic setting is the significant reduction in resistance of the copper mirror surfaces, greatly reducing reflective losses within the cavity [41].
Microwaves, generated from a synthesizer (Hittite HMC-T2220) locked to a rubidium clock (SRS FS725), are coupled into the cavity from a WR62 waveguide through a sub-wavelength 0.5 cm diameter circular aperture in the concave mirror. Microwaves are coupled out through an array of circular sub-wavelength apertures in the planar mirror, designed to transmit radiation proportional to the Gaussian intensity profile of the TEM00 resonant modes of the cavity. An unloaded Q factor of up to 1.4 × 10⁵ was measured, although the planar mirror was modified for improved signal and tunability yielding operational Q factors of approximately 3 × 10⁴. Our molecular signals typically exhibit ≈ 5 × 10⁵.
The cavity, being inside the buffer gas cell, is held at 6 K and can be tuned while cold. This was accomplished by mounting the planar mirror on spring-loaded rods opposing three brass screws with a spherical tip for a single point of contact on each screw. These screws have a throw of ∼2 cm, allowing the cavity to be tuned over a full free spectral range, enabling any transition within our 12–18 GHz instrumental range to be observed. For this measurement, the 19th TEM00 Gaussian–Hermite mode was tuned to the transition in question.
Circulating power in an off-resonant cavity can pull a molecular resonance towards the cavity resonance [42,43,44]. To explore this, we detuned our cavity by 200 kHz and saw a pull of = 30 Hz. The ringdown of the cavity is recorded with every signal acquisition plotted in Figure 2, and the cavity frequency remained unchanged at the 1 kHz level over the course of the 2.5 h of measurement, which corresponds to a pulling of approximately 0.15 Hz. However, because this is a differential measurement, the relevant figure is the shot-to-shot cavity stability.
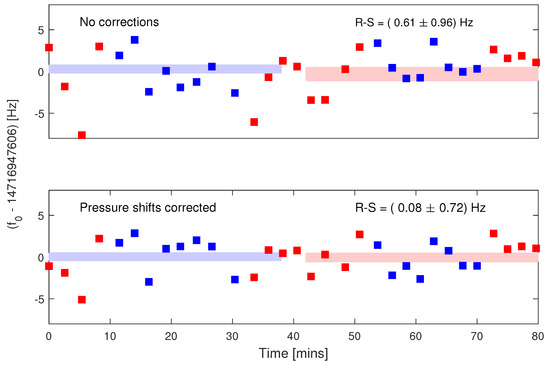
Figure 2.
Repeated measurements of of (R)-1,2-propanediol (blue squares) and (S)-1,2-propanediol (red squares). Top: uncorrected measurements. Bottom: measurements with the pressure shift corrected. Pressures are measured from the ringdown time , as described under Analysis of Systematics.
Our experimental run consisted of repeatedly alternating between flowing (R)-1,2-propanediol and (S)-1,2-propanediol into the buffer gas cell and taking high signal-to-noise spectra of the transition at 14,716.9476 MHz. Sample introduction was accomplished by evaporation of sample from one of two small chambers packed with glass wool for higher surface area, and alternation between samples was done by opening and closing ball valves in front of these chambers. There was an impedance downstream of the two ball valves, so that the two samples were subjected to a common impedance, rather than the ball valves setting the impedance. The sample inlet tube (Figure 1) was heated to maintain 23 °C over the course of the run. Pressure in the inlet tube was used as a proxy for molecular flow and was monitored by an MKS 925 Micro Pirani vacuum transducer.
Once the time-domain data was acquired, the resulting free induction decay was fit to a decaying exponential, and the frequency of this fit function was used as the center frequency of the line under observation. The envelope of the fit is used as an in situ pressure measurement, allowing for a precise correction for pressure shifts as described below. A typical free induction decay and fit is shown in Figure 3.
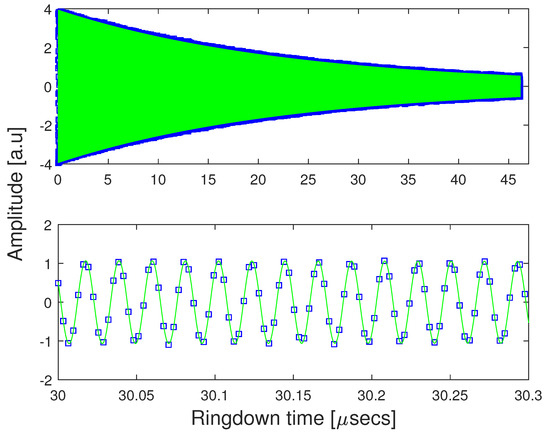
Figure 3.
A typical free induction decay of R-1,2 propanediol. The FID is fit to the decaying exponential . is the intermediate frequency of the transition being probed, and provides an in situ measurement of the pressure. The bottom panel is an expanded view of the top panel.
3. Results
In Figure 2, we show the residuals of repeated frequency measurements alternating between samples of (R)-1,2-propanediol (blue squares) and (S)-1,2-propanediol (red squares). The red and blue rectangles show the frequency spead within each enantiopure sample. The transition frequency measured was 14716.9476 MHz, corresponding to excitation between the rotational levels. The molecular transition and timing of the cryogenic run were selected to minimize drifts stemming from DC Stark shifts. The top panel shows the uncorrected differential precision data. The lower panel shows the statistically limited differential data after the pressure shift systematic is subtracted. Pressure shifts caused by pressure variations between each measurement had to be corrected during data analysis. Small (∼few Hz) corrections to these frequencies were made by using the exponential decay coefficient as an in situ pressure measurement. Table 2 summarizes the systematic error budget. (S)-1,2-propanediol was measured to have a transition center frequency of 14,716,947,606.36 ± 0.5 Hz, and (R)-1,2-propanediol was measured to have a transition center frequency of 14,716,947,606.44 ± 0.5 Hz, yielding statistically limited agreement of center frequencies to within 0.08 ± 0.72 Hz. This tight limit is realized in about 2.5 h of data acquisition.
Table 2.
Error budget for the precision measurement of (R)- and (S)-1,2-propanediol. The two dominant systematics were caused by Stark shifts and pressure shifts. DC Starks shifts and amplitude shifts including contaminants and flow variations between samples were successfully managed experimentally to the 0.01 and 0.1 Hz level respectively.
3.1. Analysis of Systematics
Our frequency suffers from poorly controlled drifts from two effects: pressure shifts arising from interactions with the cold helium buffer gas and Stark shifts arising from slowly varying electric fields. If left uncorrected, each of these effects leads to stochastic errors on the 1–2 Hz level in our raw frequency measurements.
A major strength of our method is that it provides a convenient platform for analyzing systematic effects. Both Stark shifts and pressure shifts would be expected to exist at similar absolute magnitudes in a microwave and in an infrared (vibrational) spectroscopic search for parity violation. Because of the similar absolute magnitude and smaller absolute uncertainty of a microwave measurement, a microwave measurement is more sensitive to these systematic effects than a higher frequency measurement. In our work, both of these effects were mitigated by careful experimental design and, in the case of pressure shifts, in situ measurements.
3.1.1. DC Stark Shifts
The frequency varies with time, and we have strong evidence that this shift arises from slowly varying electric fields within the cell. This shift was small (≤0.5 Hz) in the data run shown in Figure 2, and we did not correct for it. However, after many hours of running, the drift can accelerate to ∼100 Hz/h. Even in this regime, the effect of this drift on our differential spectroscopy is largely mitigated by switching enantiomers rapidly compared to any change in the dynamics of this effect and subtracting the drift from our measured frequencies. Figure 4 highlights the effect of those Stark shifts over a longer time period on an earlier experimental run. Subtracting the smoothly varying drift resulted in a net differential measurement error of less than 2 Hz even on runs where the Stark shift varied by ∼200 Hz over the course of the run.
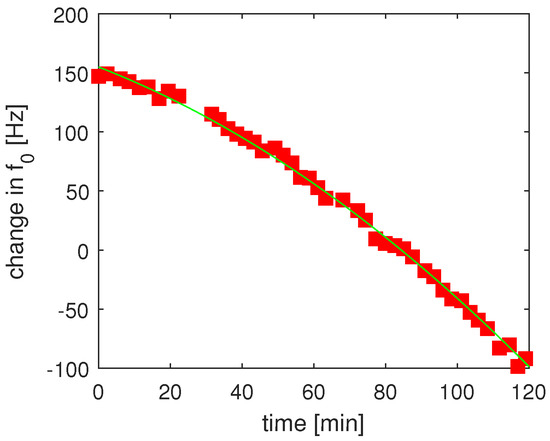
Figure 4.
Repeated measurements of of R-1,2 propanediol showing the drift of over time. Although the uncorrected data shows a significant uncontrolled shift of ∼200 Hz, residual measurements of show a standard deviation of ∼2 Hz when the overall drift and measured pressure shifts are subtracted. The data used for our primary result, taken early in a cryogenic run, showed a drift about 100 times smaller than what is shown here.
We first became aware of this effect while studying transitions with anomolously high Stark shifts involved in microwave three-wave mixing [45], where lineshapes consistent with the presence of a strong DC field appeared. This effect has been observed in polarizable transitions of 1,2-propanediol, fenchone, and a number of other chiral molecules. The effect is much stronger in highly polarizable transitions (transitions with large Stark shifts), and can be partially, although not completely, mitigated by introducing free electrons into the chamber via laser ablation. We believe these free charges drift towards charge patches on the icy walls, much like in an anti-static gun, such as those used to eliminate static charges from vinyl records.
We surmise that these fields are produced by the spontelectric effect [46,47]. According to spontelectrics, gas-phase polar molecules deposited onto a cryogenic surface tend to align dipoles with already deposited molecules, yielding a net polarization which results in a strong, non-uniform electric field. These fields can be positive or negative depending on the molecular species and grow linearly with film thickness [48,49]. Though our experimental conditions are quite different than the conditions under which these effects were first observed, this growing net polarization seems to be consistent with the observed drift of the center frequency of our line. It takes roughly an hour of flowing sample into the buffer gas cell for this effect to become the dominant systematic effect. In our apparatus, the distribution of the monolayers is almost certainly nonuniform, thus the dc field is highly anisotropic, so we can only provide a rough estimate of the order of the electric fields. Stark shifts for various observed transitions were simulated using the PGOPHER [50] package, putting an upper bound on the spontelectric field at 1500 V/m.
3.1.2. Pressure Shifts
Changes in buffer gas pressure introduce further variations in via the pressure shift. Our free induction decay signals provide an in situ measurement of the local pressure via the ringdown time of the FID, which is measured for each data point. While efforts were made to stabilize the helium flow, we observed small (∼2%) uncontrolled fluctuations in the ringdown time and thus the pressure. The pressure shift for each point was calculated and subtracted from our measured . Even when the helium pressure was intentionally decreased by 30%, this procedure resulted in corrected transition frequencies with a spread of less than 3 Hz. This change in buffer gas pressure shifted the uncorrected frequencies by 35 ± 5 Hz.
3.1.3. Systematic Shifts between Samples
Any frequency shift induced by impurities or difference in sample delivery between R-1,2 propanediol and S-1,2 propanediol would show up as a parity violation. Our samples (Sigma Aldrich) are each described as “96% pure”, and there is no guarantee that the impurities are identical. It is possible to imagine mechanisms by which an impurity—and even a non-polar impurity, which is invisible to our microwave spectrometer—might induce such a shift. For example, if one enantiomer was corrupted by a volatile contaminant, the flux of molecules from that contaminant could heat the buffer gas while it was being injected, which could in turn induce a pressure shift that was now correlated with enantiomer. Worryingly, we did in fact see an unexplained signal amplitude difference of about 5% between S- and R- enantiomers.
As a probe of this type of dynamics, we observed while adjusting the flux of incoming R-1,2 propanediol by about 200%. This dramatic level adjustment induced no observable shift in the measured ( Hz). Using a conservative model where contaminants comprise 10% of the total molecular flux into the cell, we thus limit the hypothetical shift from such an effect to <0.1 Hz.
4. Discussion
Straightforward improvements can be suggested for improving both spectral resolution and systematic shifts. The current measurement, 0.08 Hz ± 0.72 Hz, could be reduced with more measurement time. The standard deviation of the measurement scales is , where N is the number of points in the measurement, so a factor of 4 in data collection time yields a factor of two in increased precision. This scaling is effective until another systematic source of error dominates, which would not reveal itself until such a precision is reached. The uncertainty of the determined center frequency of a given line is on the order where is the linewidth and SNR is signal-to-noise ratio, so improving resolution and signal-to-noise ratios are obvious pathways to higher precision [27,51].
The spectral resolution in the current experiment, at 22 kHz, is limited by collisional broadening. For future experiments, operating with a heavier buffer gas such as Neon (at 20 K) can reduce the number of collisions needed to thermalize the hot molecular sample introduced to the cell and thus reduce both collisional broadening and collisional shifts. The Doppler broadening would increase by less than 2 kHz, resulting in a net reduction in linewidth.
The spectral resolution would be further increased if the molecules were removed from the buffer gas in a collimated buffer gas beam. Buffer gas beams tend to have very low collisional environments, and with moderate collimation, very low Doppler broadening [52,53,54,55]. In combination with the Fabry–Perot cavity, which enables Doppler-free spectroscopy in one axis, this could provide very long coherence times and narrow linewidths. Additionally, the cavity design could be changed to have a larger mode waist by increasing the mirror radius and mirror size. This would provide longer interaction times and thus narrower, more intense lines. This change would also significantly reduce Stark shifts arising from spontelectric effects, as the molecules would be much further from surfaces and total molecular flux would be reduced. Preliminary results using a neon buffer gas beam give linewidths in the 3 kHz range and signal-to-noise ratios of around 2000. With further averaging, this could provide two orders of magnitude better precision in this measurement. While this is still far short of predicted PV shifts, it would represent a very precise probe into unexplored systematic effects at this level. Cournol and co-workers are currently developing a similar buffer-gas beam experiment which will use Ramsay interferometry and cavity-enhanced detection for precise measurement of energy differences [28].
5. Conclusions
We have demonstrated differential frequency measurements with 0.08 ± 0.72 Hz precision in the microwave regime. The experiment was conducted in a cryogenic buffer gas cell equipped with a microwave Fabry–Perot resonator and provided important insight into Hz-level systematic effects, such as pressure and Stark shifts, adding to the toolset that will eventually be used to measure parity-violating effects in chiral molecules. The current iteration of this experiment also provides tools to measure changes in molecular structure at the 10−10 level. To our knowledge, this is the first and most precise differential measurement of molecular samples using microwave spectroscopy.
Author Contributions
Conceptualization, L.S., D.P. and G.K.; investigation, L.S., G.K., D.S. and D.P.; resources, L.S. and D.S.; formal analysis, D.P.; visualization, L.S., G.K. and D.P.; supervision, D.P.; writing—original draft preparation, L.S., G.K. and D.S.; writing—review and editing, L.S., G.K., D.S. and D.P. All authors have read and agreed to the published version of the manuscript.
Funding
This research was funded by NSF award #1555781 and the David and Lucille Packard foundation.
Data Availability Statement
Data presented in this article is available upon request.
Acknowledgments
The authors would like to acknowledge Andy Segale for machine work on the Fabry–Perot cavity.
Conflicts of Interest
The authors declare no conflict of interest.
References
- Fukuyama, T. Searching for new physics beyond the standard model in electric dipole moment. Int. J. Mod. Phys. A 2012, 27, 1230015. [Google Scholar] [CrossRef]
- Hudson, J.; Sauer, B.; Tarbutt, M.; Hinds, E. Measurement of the electron electric dipole moment using YbF molecules. Phys. Rev. Lett. 2002, 89, 023003. [Google Scholar] [CrossRef] [PubMed] [Green Version]
- Andreev, V.; Hutzler, N. Improved limit on the electric dipole moment of the electron. Nature 2018, 562, 355–360. [Google Scholar]
- Tarbutt, M.R.; Hudson, J.J.; Sauer, B.E.; Hinds, E.A. Preparation and manipulation of molecules for fundamental physics tests. arXiv 2008, arXiv:0803.0967. [Google Scholar]
- DeMille, D.; Cahn, S.B.; Murphree, D.; Rahmlow, D.A.; Kozlov, M.G. Using molecules to measure nuclear spin-dependent parity violation. Phys. Rev. Lett. 2008, 100, 023003. [Google Scholar] [CrossRef] [Green Version]
- Wall, T. Preparation of cold molecules for high-precision measurements. J. Phys. B At. Mol. Opt. Phys. 2016, 49, 243001. [Google Scholar] [CrossRef]
- Tarbutt, M.; Sauer, B.; Hudson, J.; Hinds, E. Design for a fountain of YbF molecules to measure the electron’s electric dipole moment. New J. Phys. 2013, 15, 053034. [Google Scholar] [CrossRef]
- Safronova, M.; Budker, D.; DeMille, D.; Kimball, D.F.J.; Derevianko, A.; Clark, C.W. Search for new physics with atoms and molecules. Rev. Mod. Phys. 2018, 90, 025008. [Google Scholar] [CrossRef] [Green Version]
- Lemeshko, M.; Krems, R.V.; Doyle, J.M.; Kais, S. Manipulation of molecules with electromagnetic fields. Mol. Phys. 2013, 111, 1648–1682. [Google Scholar] [CrossRef] [Green Version]
- Doyle, J.; Friedrich, B.; Krems, R.; Masnou-Seeuws, F. Quo vadis, cold molecules? Eur. Phys. J. D-At. Mol. Opt. Plasma Phys. 2004, 31, 149–164. [Google Scholar]
- Wu, C.S.; Ambler, E.; Hayward, R.W.; Hoppes, D.D.; Hudson, R.P. Experimental test of parity conservation in beta decay. Phys. Rev. 1957, 105, 1413. [Google Scholar] [CrossRef]
- Edwards, N.; Phipp, S.; Baird, P.; Nakayama, S. Precise measurement of parity nonconserving optical rotation in atomic thallium. Phys. Rev. Lett. 1995, 74, 2654. [Google Scholar] [CrossRef] [PubMed]
- Meekhof, D.; Vetter, P.; Majumder, P.; Lamoreaux, S.; Fortson, E. Optical-rotation technique used for a high-precision measurement of parity nonconservation in atomic lead. Phys. Rev. A 1995, 52, 1895. [Google Scholar] [CrossRef]
- Macpherson, M.; Zetie, K.; Warrington, R.; Stacey, D.; Hoare, J. Precise measurement of parity nonconserving optical rotation at 876 nm in atomic bismuth. Phys. Rev. Lett. 1991, 67, 2784. [Google Scholar] [CrossRef]
- Tsigutkin, K.; Dounas-Frazer, D.; Family, A.; Stalnaker, J.E.; Yashchuk, V.V.; Budker, D. Observation of a large atomic parity violation effect in ytterbium. Phys. Rev. Lett. 2009, 103, 071601. [Google Scholar] [CrossRef] [PubMed]
- Chandrasekhar, S. Molecular homochirality and the parity-violating energy difference. A critique with new proposals. Chirality 2008, 20, 84–95. [Google Scholar] [CrossRef]
- Stevenson, C.D.; Davis, J.P. Magnetars and Magnetic Separation of Chiral Radicals in Interstellar Space: Homochirality. J. Phys. Chem. A 2019, 123, 9587–9593. [Google Scholar] [CrossRef]
- Bonner, W.A. Parity violation and the evolution of biomolecular homochirality. Chirality 2000, 12, 114–126. [Google Scholar] [CrossRef]
- Darquié, B.; Stoeffler, C.; Shelkovnikov, A.; Daussy, C.; Amy-Klein, A.; Chardonnet, C.; Zrig, S.; Guy, L.; Crassous, J.; Soulard, P.; et al. Progress toward the first observation of parity violation in chiral molecules by high-resolution laser spectroscopy. Chirality 2010, 22, 870–884. [Google Scholar] [CrossRef] [Green Version]
- Quack, M.; Stohner, J.; Willeke, M. High-resolution spectroscopic studies and theory of parity violation in chiral molecules. Annu. Rev. Phys. Chem. 2008, 59, 741–769. [Google Scholar] [CrossRef]
- Laerdahl, J.K.; Schwerdtfeger, P. Fully relativistic ab initio calculations of the energies of chiral molecules including parity-violating weak interactions. Phys. Rev. A 1999, 60, 4439. [Google Scholar] [CrossRef]
- Schwerdtfeger, P.; Gierlich, J.; Bollwein, T. Large Parity-Violation Effects in Heavy-Metal-Containing Chiral Compounds. Angew. Chem. Int. Ed. 2003, 42, 1293–1296. [Google Scholar] [CrossRef] [PubMed]
- Darquié, B.; Saleh, N.; Tokunaga, S.K.; Srebro-Hooper, M.; Ponzi, A.; Autschbach, J.; Decleva, P.; Garcia, G.A.; Crassous, J.; Nahon, L. Valence-shell photoelectron circular dichroism of ruthenium (III)-tris-(acetylacetonato) gas-phase enantiomers. Phys. Chem. Chem. Phys. 2021, 23, 24140–24153. [Google Scholar] [CrossRef]
- Schnell, M.; Küpper, J. Tailored molecular samples for precision spectroscopy experiments. Faraday Discuss. 2011, 150, 33–49. [Google Scholar] [CrossRef]
- Schwerdtfeger, P.; Kühn, A.; Bast, R.; Laerdahl, J.K.; Faglioni, F.; Lazzeretti, P. The vibrational spectrum of camphor from ab initio and density functional theory and parity violation in the C–C*–CO bending mode. Chem. Phys. Lett. 2004, 383, 496–501. [Google Scholar] [CrossRef]
- Lahamer, A.; Mahurin, S.; Compton, R.; House, D.; Laerdahl, J.; Lein, M.; Schwerdtfeger, P. Search for a parity-violating energy difference between enantiomers of a chiral iron complex. Phys. Rev. Lett. 2000, 85, 4470. [Google Scholar] [CrossRef]
- Tokunaga, S.K.; Stoeffler, C.; Auguste, F.; Shelkovnikov, A.; Daussy, C.; Amy-Klein, A.; Chardonnet, C.; Darquié, B. Probing weak force-induced parity violation by high-resolution mid-infrared molecular spectroscopy. Mol. Phys. 2013, 111, 2363–2373. [Google Scholar] [CrossRef] [Green Version]
- Cournol, A.; Manceau, M.; Pierens, M.; Lecordier, L.; Tran, D.; Santagata, R.; Argence, B.; Goncharov, A.; Lopez, O.; Abgrall, M.; et al. A new experiment to test parity symmetry in cold chiral molecules using vibrational spectroscopy. Quantum Electron. 2019, 49, 288. [Google Scholar] [CrossRef] [Green Version]
- Quack, M.; Stohner, J. Influence of parity violating weak nuclear potentials on vibrational and rotational frequencies in chiral molecules. Phys. Rev. Lett. 2000, 84, 3807. [Google Scholar] [CrossRef]
- Blanchard, J.W.; King, J.P.; Sjolander, T.F.; Kozlov, M.G.; Budker, D. Molecular parity nonconservation in nuclear spin couplings. Phys. Rev. Res. 2020, 2, 023258. [Google Scholar] [CrossRef]
- Eills, J.; Blanchard, J.W.; Bougas, L.; Kozlov, M.G.; Pines, A.; Budker, D. Measuring molecular parity nonconservation using nuclear-magnetic-resonance spectroscopy. Phys. Rev. A 2017, 96, 042119. [Google Scholar] [CrossRef] [Green Version]
- Senami, M.; Ito, K. Asymmetry of electron chirality between enantiomeric pair molecules and the origin of homochirality in nature. Phys. Rev. A 2019, 99, 012509. [Google Scholar] [CrossRef]
- Arimondo, E.; Glorieux, P.; Oka, T. Observation of inverted infrared lamb dips in separated optical isomers. Opt. Commun. 1977, 23, 369–372. [Google Scholar] [CrossRef]
- Ziskind, M.; Daussy, C.; Marrel, T.; Chardonnet, C. Improved sensitivity in the search for a parity-violating energy difference in the vibrational spectrum of the enantiomers of CHFClBr. Eur. Phys. J. D-At. Mol. Opt. Plasma Phys. 2002, 20, 219–225. [Google Scholar] [CrossRef]
- Balle, T.; Flygare, W. Fabry–Perot cavity pulsed Fourier transform microwave spectrometer with a pulsed nozzle particle source. Rev. Sci. Instrum. 1981, 52, 33–45. [Google Scholar] [CrossRef]
- Grabow, J.U.; Palmer, E.S.; McCarthy, M.C.; Thaddeus, P. Supersonic-jet cryogenic-resonator coaxially oriented beam-resonator arrangement Fourier transform microwave spectrometer. Rev. Sci. Instrum. 2005, 76, 093106. [Google Scholar] [CrossRef]
- Schnell, M.; Banser, D.; Grabow, J.U. Coaxially aligned electrodes for Stark-effect applied in resonators using a supersonic jet Fourier transform microwave spectrometer. Rev. Sci. Instrum. 2004, 75, 2111–2115. [Google Scholar] [CrossRef]
- Richard, J.P.; Hamilton, J. Cryogenic monocrystalline silicon Fabry–Perot cavity for the stabilization of laser frequency. Rev. Sci. Instrum. 1991, 62, 2375–2378. [Google Scholar] [CrossRef]
- Kuvshinskii, M.V.; Oreshkin, S.I.; Popov, S.M.; Rudenko, V.N.; Yudin, I.S.; Azarova, V.V.; Blagov, S.V. Tests of cryogenic Fabry–Perot cavity with mirrors on different substrates. Appl. Sci. 2019, 9, 230. [Google Scholar] [CrossRef] [Green Version]
- Porterfield, J.P.; Satterthwaite, L.; Eibenberger, S.; Patterson, D.; McCarthy, M.C. High sensitivity microwave spectroscopy in a cryogenic buffer gas cell. Rev. Sci. Instrum. 2019, 90, 053104. [Google Scholar] [CrossRef] [PubMed] [Green Version]
- White, G. The thermal and electrical conductivity of copper at low temperatures. Aust. J. Phys. 1953, 6, 397–404. [Google Scholar] [CrossRef] [Green Version]
- Bize, S.; Sortais, Y.; Mandache, C.; Clairon, A.; Salomon, C. Cavity frequency pulling in cold atom fountains. IEEE Trans. Instrum. Meas. 2001, 50, 503–506. [Google Scholar] [CrossRef]
- Viennet, J.; Audoin, C.; Desaintfuscien, M. Cavity pulling in passive frequency standards. IEEE Trans. Instrum. Meas. 1972, 21, 204–209. [Google Scholar] [CrossRef]
- Godone, A.; Micalizio, S.; Levi, F.; Calosso, C. Microwave cavities for vapor cell frequency standards. Rev. Sci. Instrum. 2011, 82, 074703. [Google Scholar] [CrossRef]
- Patterson, D.; Doyle, J.M. Sensitive chiral analysis via microwave three-wave mixing. Phys. Rev. Lett. 2013, 111, 023008. [Google Scholar] [CrossRef] [Green Version]
- Field, D.; Plekan, O.; Cassidy, A.; Balog, R.; Jones, N.; Dunger, J. Spontaneous electric fields in solid films: Spontelectrics. Int. Rev. Phys. Chem. 2013, 32, 345–392. [Google Scholar] [CrossRef]
- Balog, R.; Cicman, P.; Jones, N.; Field, D. Spontaneous Dipole Alignment in Films of N2O. Phys. Rev. Lett. 2009, 102, 073003. [Google Scholar] [CrossRef] [Green Version]
- Plekan, O.; Cassidy, A.; Balog, R.; Jones, N.C.; Field, D. A new form of spontaneously polarized material. Phys. Chem. Chem. Phys. 2011, 13, 21035–21044. [Google Scholar] [CrossRef] [PubMed]
- Plekan, O.; Rosu-Finsen, A.; Cassidy, A.M.; Lasne, J.; McCoustra, M.R.; Field, D. A review of recent progress in understanding the spontelectric state of matter. Eur. Phys. J. D 2017, 71, 1–8. [Google Scholar] [CrossRef]
- Western, C.M. PGOPHER: A program for simulating rotational, vibrational and electronic spectra. J. Quant. Spectrosc. Radiat. Transf. 2017, 186, 221–242. [Google Scholar] [CrossRef] [Green Version]
- Reed, Z.; Long, D.; Fleurbaey, H.; Hodges, J. SI-traceable molecular transition frequency measurements at the 10–12 relative uncertainty level. Optica 2020, 7, 1209–1220. [Google Scholar] [CrossRef]
- Patterson, D.; Doyle, J.M. Bright, guided molecular beam with hydrodynamic enhancement. J. Chem. Phys. 2007, 126, 154307. [Google Scholar] [CrossRef] [Green Version]
- Hutzler, N.R.; Lu, H.I.; Doyle, J.M. The buffer gas beam: An intense, cold, and slow source for atoms and molecules. Chem. Rev. 2012, 112, 4803–4827. [Google Scholar] [CrossRef] [PubMed] [Green Version]
- Patterson, D.; Rasmussen, J.; Doyle, J.M. Intense atomic and molecular beams via neon buffer-gas cooling. New J. Phys. 2009, 11, 055018. [Google Scholar] [CrossRef]
- Xiao, D.; Lancaster, D.M.; Allen, C.H.; Taylor, M.J.; Lancaster, T.A.; Shaw, G.; Hutzler, N.R.; Weinstein, J.D. Shaped nozzles for cryogenic buffer-gas beam sources. Phys. Rev. A 2019, 99, 013603. [Google Scholar] [CrossRef] [Green Version]
Publisher’s Note: MDPI stays neutral with regard to jurisdictional claims in published maps and institutional affiliations. |
© 2021 by the authors. Licensee MDPI, Basel, Switzerland. This article is an open access article distributed under the terms and conditions of the Creative Commons Attribution (CC BY) license (https://creativecommons.org/licenses/by/4.0/).