Article

Analysis of Urban Visual Memes Based on Dictionary Learning: An Example with Urban Image Data

1
School of Geosciences and Info-Physics, Central South University, Changsha 410083, China
2
Research and Development Center, China Academy of Launch Vehicle Technology, Beijing 100076, China
3
Hunan Aerospace Yuanwang Science & Technology Company Ltd., Changsha 410092, China
4
School of Architecture, Changsha University of Science and Technology, Changsha 410004, China
*
Author to whom correspondence should be addressed.
Symmetry 2022, 14(1), 175; https://doi.org/10.3390/sym14010175
Submission received: 19 October 2021 / Revised: 1 December 2021 / Accepted: 1 January 2022 / Published: 17 January 2022

Abstract

:
The coexistence of different cultures is a distinctive feature of human society, and globalization makes the construction of cities gradually tend to be the same, so how to find the unique memes of urban culture in a multicultural environment is very important for the development of a city. Most of the previous analyses of urban style have been based on simple classification tasks to obtain the visual elements of cities, lacking in considering the most essential visual elements of cities as a whole. Therefore, based on the image data of ten representative cities around the world, we extract the visual memes via the dictionary learning method, quantify the symmetric similarities and differences between cities by using the memetic similarity, and interpret the reasons for the similarities and differences between cities by using the memetic similarity and sparse representation. The experimental results show that the visual memes have certain limitations among different cities, i.e., the elements composing the urban style are very similar, and the linear combinations of visual memes vary widely as the reason for the differences in the urban style among cities.

1. Introduction

With the acceleration of urbanization and the deepening of cultural exchanges around the world, the construction of cities gradually tends to be together, and the coexistence of multiple cultures has become a distinctive feature of human society. Battiston [1] believes that it is very important for a society or a group to find the unique urban style of a city in a multicultural environment to maintain the uniqueness of the culture itself. The urban style is a comprehensive embodiment of the city’s culture, heritage, history and image, and is an important symbol of city culture. As the previous research on the characteristics of urban style was in the initial stage, it neglected to combine its own historical monuments, humanistic style and other important elements, which made the city construction lose its proper characteristics. Therefore, how to find the unique elements of the urban style and explore the reasons for the differences and similarities of urban style is especially important for the construction of the characteristic culture of cities.
Previous research on the urban style has mainly gone through two stages: qualitative and quantitative. In the first stage, people relied more on subjective discrimination for qualitative analysis, combined with questionnaires and interviews [2] to condense the characteristics of the urban style, but this method not only requires a lot of human and material resources but also the obtained results are not objective and accurate. With the advent of the era of big data, the use of quantitative models can excavate rich information from big data [3,4], and the image data recording the appearance of the city as a source of information that directly responds to the urban style, enables quantitative analysis of the urban style. With the advanced data collection systems, huge storage functions, various visualization methods, and broad data acquisition channels, people can obtain urban image data more conveniently and comprehensively, making a qualitative leap in the quantitative study of urban landscape.
The study of the urban style involves the similarity determination of urban architectural style and the identification of urban elements [5]. However, most of them analyze the similarities and differences of urban style from a simple image classification task to quantify the visual differences between cities, which not only ignores the important role of style features of images for urban style studies, but also lacks the analysis of the reasons for their similarities and differences.
Therefore, in order to analyze the causes of the visual similarities and differences in cities, based on the “memes” theory proposed by Richard Dawkins [6], we propose that urban style is an important manifestation of urban culture, which is also composed of “memes” just like culture. From the perspective of visual memes, it is important to grasp the style of urban architectural images accurately for urban style cognition. At the same time, in order to obtain the style features of the whole city, we use dictionary learning to obtain the smallest components of urban style from a large number of urban architectural images.
In this paper, firstly, images of ten different urban architecture classes located around the world were selected as the base study data by GMM clustering [7] and data cleaning. The style features of the images are obtained through the ResNet50 network, thus replacing the traditional convolutional layer features. Secondly, the dictionary learning method of DPC [8] is used to uniformly extract dictionaries that represent the overall style features of different cities, and such dictionaries are used as visual memes for characterizing the overall style features of cities. Finally, based on the dictionary learning to discern the similarity of urban styles, the cultural similarities and differences among cities are numerically specified using the style similarity, and the reasons for the similarities and differences of urban styles are interpreted by combining the memetic similarity and sparse representation. The innovative points of this paper are:
  • We compute style features based on the deep-level features derived from the ResNet50 network, rather than employing convolutional layer features directly as in traditional methods, to better characterize urban styles.
  • We employ dictionary learning methods to extract the visual memes that are the basic components of urban styles in order to interpret the similarities and differences among urban styles at a finer granularity.
  • To further understand and quantify how urban styles differ, we define the symmetric memetic similarity and the style similarity based on sparse representations, which measure differences among urban styles from multi-levels.
The rest of the paper is organized as follows. Section 2 describes the work related to this study, Section 3 discusses the data sources for the experiments and the associated processing and error analysis. Section 4 provides a detailed description of the methods and related theories used in this study. Section 5 is an analytical description of the experimental results. Section 6 presents the relevant conclusions of this paper and the outlook for future work.

2. Relation Work

2.1. Urban Style Analysis

The urban style is a kind of portrait of urban culture, in which historical sites, urban buildings, and street names are specific representations of the urban style. Data sources for studies on urban style are text-based data and image-based data. Text-based methods tend to be obtained and analyzed through attributes such as names of specific representations of urban style. Daniel [9] found that street names with religious beliefs are closely related to the cultural factors it captures and can be closely linked to local economic development, which can reflect its social and urban style. Livia [10] collected georeferenced and tagged metadata associated with eight million Flickr images to explore the terms used to describe urban centers, explore where urban cultural centers are concentrated, and also explore the boundaries of urban cultural center communities at the level of individual cities. Zhou [11] analyzed the visual similarity of different urban styles by describing the identity of a city through attribute analysis of 2 million geo-tagged images from 21 cities on three continents.
Compared with text-based data, image-based data contains rich visual information and is a more intuitive representation of urban landscape. Abhimanyu [12] used a convolutional neural network approach to quantify the perception of urban appearance by looking at six perceptual attributes: safe, lively, boring, rich, frustrated, and beautiful, to obtain the relationship between the appearance of a city and the behavior and health of its inhabitants. Carl [13] argued that windows, balconies, and street signs are the most distinctive geographic visual elements for Paris and the unique signs that can distinguish it from other cities. Therefore, a discriminative clustering method was used to identify and classify them from streetscape images to find representative urban style elements. Abraham [5] used convolutional neural networks to identify images of Mexican architectural cultural heritage to obtain its architectural style and the type of style. Most of the above studies on the urban style are about the identification of urban elements, and although there are also analyses of the similarity of style between different cities, they lack the consideration of the overall style characteristics of cities, and they cannot explain the reasons for the differences and similarities of the urban style.

2.2. Meme Theory

Richard Dawkins first introduced the term meme in their book “The Selfish Gene” [6], which is a cultural unit and the most essential feature of culture. Therefore, the meme theory provides a new way of thinking to find the essential characteristics of the urban style and to interpret the reasons for the dissimilarity of the urban style. Jesse [14] calls meme a genome of tags that enhances the form of user interaction through an extended traditional tagging data structure, and Krzysztof [15] considers meme as the frequency of culinary experiences and related comments. Qiu Yan extracted factors such as ornamentation and color in Qiang embroidery and defined them as memes. The definition of memes is different according to different environments and forms of representation, and there are various ways of extracting memes. Memes can be extracted from texts. Neil Malhotra [15] extracted cultural memes from a data collection of “tort stories” and used them to explore the influence of attitudes toward tort reform. Shin S [16] argued that the label of a movie is a brief description of the characteristics of a movie, and extracted movie memes through movie labels, just like the inheritance and variation of biological genes movie, memes also have their specific rise and fall changes. Robert Walker [17] extracted music memes from western music behaviors as a representation of the cultural assimilation of western individuals or groups, a mechanism for the transmission of western culture. Memes can be extracted not only from texts but also from images. Theisen W [18] used a visual recognition pipeline that automates the discovery of political memetic types with different appearances to explore the extraction of their political memetic types using general election images with particular contexts. Jia Keng-Yun [19] used dictionary learning to automatically annotate Ming and Qing court dress images to study them from the perspective of memes. Through the review of the above studies, it can be found that the combination of memes and urban style research can well realize the quantitative analysis of the urban style, explore the essential characteristics of the urban style as a whole, and be able to interpret the reasons for their similarities and differences.

2.3. Dictionary Learning

Just as a finite dictionary can represent a large volume of knowledge, a large dataset can be represented by a limited number of low-dimensional features. The goal of dictionary learning is to extract the most essential features of things, which is refered as dictionary atom, to be able to reduce the dimensionality while preserving the information in the data. Class-specific dictionary learning is a class of dictionary learning methods, its main purpose is to learn the relationship between atoms and class labels, which can be achieved in different ways by adding appropriate penalty and constraint term. It has applications in different areas of classification tasks. On the basis of constructing the sparse representations of the training samples used for classification in each category into a dictionary separately, Binjie Gu et al. [20] considered the combination of the representation-constrained term and the coefficients incoherence term and input theses two jointly into the classification model, then get the cognition of human action.Incoherence promoting term is used to make the dictionaries associated to the different category as independent as possible [8]. A modified Gaussian mixture model is used to model the prior distribution for learned dictionary atom [21]. To satisfy the aim of learning shared dictionaries in different expressions of the same knowledge, cross-lingual dictionary learning method is used to implement text classification for different languages [22]. For image tasks, dictionary learning has very mature applications in image recovery and denoising [23,24,25], texture synthesis [26,27] and texture classification [28], and face recognition [29,30,31,32]. It has been shown that dictionary learning is able to learn essential features from image data and performs well on a variety of visual tasks.

3. Data

3.1. Data Resource

Urban image data is mainly used in the YFCC-100M (Yahoo Flickr Creative Commons 100 Million) dataset, with a total of nearly 100 million pieces of data, mainly image data, which contains rich attribute information such as shooting locations, user tags, latitude and longitude. The data is available in a variety of scenes, both indoor and outdoor, and the amount of data is very rich due to the multiple camera angles. The images of these city street scenes highlight the style of a city and indirectly reflect the culture of a city. A partial example is shown in Figure 1.

3.2. Data Processing

The urban image data is too rich and contains a lot of information that is not useful for the study of this paper, so a basic pre-processing of the data is required, and the amount of data variation in the processing is shown in Table 1 below.
The number of images for each city after three steps of processing is shown in Table 1, respectively. First, the images were classified into images of 10 cities (Beijing, Shanghai, Hong Kong, Tokyo, Toronto, New York, Montreal, Paris, London, and Sydney) located in four continents (Asia, Europe, North America, and Oceania) using the image latitude and longitude information. Second, based on this, the GMM clustering algorithm was used to cluster the images, eliminating images related to people, flowers, food, etc., which do not have a special representation of the city style, and only images about buildings were retained. Third, since the same image involves multiple angles, the screened image samples contain many duplicate samples, so this paper performs similarity screening on the data and keeps the images that are not duplicated as much as possible.

3.3. Data Error Analysis

Since the data used in this paper belongs to social network data, people have certain preferences and randomness for the data taken, mainly favoring some ancient buildings and iconic buildings with the special city, etc., and cannot analyze the whole appearance of the city more comprehensively. Based on such a basis, this paper only selects the images of architecture, and the study of the urban style is specific to the architectural style. Second, the division of data spatial attributes in this paper is based on the geographic location uploaded by users or manually edited geographic location, but both of them will lead to inaccurate or wrong positioning, which will affect the spatial categorization of image data to a certain extent. However, due to the very large amount of data in this paper, such an error will not affect the overall results. Third, the results obtained by GMM clustering [7] do not completely screen out the building class samples, and there will still be misclassification of the remaining samples, but the number of images in this part is very small and will not affect the overall results. Finally, the screening of duplicate samples can only reduce duplicate samples as much as possible and cannot be completely avoided, and there will still be a certain problem of sample bias, but there is no necessary impact on the conclusions obtained in this paper, so the impact caused by sample bias is ignored in this paper.

4. Method

4.1. Research Framework

The research idea of this part can be mainly composed of four parts: data pre-processing, obtaining style features, dictionary learning and city culture analysis, as shown in Figure 2.
1.
Data pre-processing: In this paper, some images of flowers and grasses that are not related to buildings are deleted and categorized according to cities. Because of the large sample size, this paper adopts the way of random sampling to select samples, for each city randomly sampled 5000 images each time, resize them to the size of the uniform specifications, and divide the training set and test set according to the ratio of 6:4, this paper sampled a total of five times, and the test set with the highest accuracy as the final result.
2.
Obtaining style features: After dividing the test set and training set, the style features are extracted from the samples and the style vector of each sample is obtained.
3.
Dictionary learning: Using the DPC method [8] to learn the dictionary of the style vectors of the training set, the dictionary and sparse matrix of each city are obtained, and the style vectors of the test set are tested to detect the similarity and difference of style between cities, and then the memetic similarity between cities is calculated by the dictionary to analyze the reasons for the similarity and difference of style between cities.
4.
Urban style analysis: it includes three aspects of style similarity, meme type and sparse representation, respectively, among which style similarity is used to quantify the similarity and difference of style between cities; meme type is to detect the composition of memes; and sparse representation can not only detect the style between cities as a whole but also analyze the linear combination of vs. factors of the style of building images of a city, as well as the difference between two images of buildings from different cities. The sparse representation can not only detect the inter-city style as a whole but also analyze the linear combination of the meme factors of the style of a city’s architectural images and the reasons for the similarity of the style between two architectural images from different cities.

4.2. Style Feature

It is well known that images are composed of individual pixel points, and deep learning makes it very convenient to obtain shallow features or deep features of images, and the commonly used convolutional neural networks are Resnet [33,34,35] series networks, VGG [36,37] series networks, CNN [38,39,40] networks, etc. However, with the deepening and interpretation of the network structure, it has been found that deep neural networks encode not only the content features of images, but more importantly, the style information of images [41], that is, the style information, and the style and content of images have separability. In the past, people generally used the mid-level features of images for style recognition, but Sergey [42] found that the features learned in multilayer networks outperformed the mid-level features, which means that the rise of deep neural networks allows us to obtain deeper image features more conveniently. Based on the knowledge of Gatys [41] that deep-level images can be divided into content and style, we found that style information among the features of images is an important element that more directly reflects the urban style. Among them, Huang [43] et al., each channel corresponding to that layer of feature map is expanded into a one-dimensional vector, and the mean and standard deviation of each channel is calculated separately, which is defined as the style feature of the image, both the style feature of the image.
In this paper, the ResNet-50 deep convolutional neural network is used to extract the style features of urban images. The fourth layer of the ResNet-50 network is selected to obtain 2048 feature maps of corresponding size, and the one-dimensional representation of each feature map is: A = a 1 , a 2 , , a 14 × 14 T , and the mean and standard deviation of the corresponding feature maps are calculated as A *   =   a m e a n , a s t d , so the vector feature composed of all feature maps in this layer is the style feature vector of the image, which can be written as: s t y l e = A 1 * , A 2 * , , A n *   =   a m e a n 1 , a m e a n 2 , , a m e a n n , a s t d 1 , a s t d 2 , , a s t d n .

4.3. Dictionary Learning

Understanding dictionary learning is inseparable from the interpretation of the two words dictionary and sparse. Dictionaries can be composed of sentences, and all human knowledge, whether existing or to be discovered, can be represented by sentences. Furthermore, knowledge is endless, the sentences forming knowledge are also varied, but the essence of such a huge amount of knowledge is composed of relatively limited dictionaries, and dictionaries are the most essential feature of knowledge, that is, the smallest element constituting knowledge. Conversely, the dictionary is essentially a reduced dimensional representation of a huge data set, which also contains its most essential features. The sparse understanding of dictionary learning is similar to the familiarity of knowledge. After learning and accumulating a large amount of knowledge, one can be more proficient when facing similar problems, that is, one can perform the same efficient computation with less energy. Therefore, for an important signal, such as audio and natural images, it can be approximated as a linear combination of several atoms with some redundant basis, and the matrix composed of these atoms is usually called a dictionary, while the sparse coefficients corresponding to these atoms are obtained as a sparse representation, and the process of finding this dictionary is called dictionary learning. There are three basic conditions for dictionary learning: first, it is necessary to learn the most essential features behind the sample as much as possible; second, the learned dictionary should have a sparse representation for the specified signal, and third, the number of atoms in the learned dictionary should be as small as possible. Since dictionary learning can obtain the most essential features behind the image signal, this paper obtains the dictionary of different cities and the sparse representation of the dictionary of different cities based on the acquisition of the image style features by dictionary learning of urban architecture images.

4.4. Sparse Representation

For an image, the information involved is very complex and redundant. In order to obtain a more concise representation of the image signal, the signal is generally converted into a set of vectors with very few atoms being non-zero and most of the atoms being equal to zero or close to zero for representation, which is the sparse representation of the signal. A sparse representation means that the signal is represented as a linear combination of a few atoms in a given super-complete dictionary.
The essence of sparse representation is to describe as much knowledge as possible with as little information as possible, which is usually used in large datasets to speed up operations and improve the efficiency of classification. Suppose we use a two-dimensional matrix M × N to represent the data set X, where each row represents a sample and each column represents a feature of the sample, the meaning of sparse representation is to select the appropriate number of atoms K, learn a M × K size dictionary matrix D and a K × N size coefficient matrix A, while ensuring that A is as sparse as possible, the error between D × A and X is minimized to restore X as much as possible. The sparse representation usually consists of two steps: the encoding stage is the encoding of a dictionary of learned atomic features; the classification stage is the process of learning to classify a new signal using the learned sparse matrix and the dictionary.
The traditional sparse representation classification is to directly use samples as dictionaries, but such a method is easy to introduce sample noise, and the learning efficiency and computational speed are low under large datasets. Therefore, this paper mainly adopts the dictionary learning method based on sparse representation for classification learning, which can better improve the classification accuracy and efficiency by uniformly learning dictionaries for samples of each category and using them for sparse representation. The dictionary classification process based on sparse representation is as follows.
A i = arg min y D i A i 2 2 + γ A i 1 ,
L y = arg min y D i A i 2 ,
where A i = A i 1 , A i 2 , , A i n , n refers to the number of samples in category i, A = A 1 , A 2 , A c , A i is the vector of coefficients associated with category i, c refers to category number and Y refers to new test sample signal.

4.5. Memetic Similarity

A dictionary is a representation of a city style. By selecting the same values of different city style images for dictionary learning, the corresponding dictionaries are obtained to discern the similarity and difference of culture between cities. In order to be able to quantitatively analyze urban culture, the similarity of dictionaries between cities is called memetic similarity in this paper, and its calculation formula is as follows.
S i m m e m e ( X , Y ) = S i m m e m e ( Y , X ) = 1 2 * a r r X a r r Y a r r X + a r r Y ,
where · represent the sum of the absolute values of the squared elements of the solution matrix, a r r X , a r r Y represent the vectors after the conversion of D X , D Y into one-dimensional vectors.

4.6. Style Similarity

Opposite to the memetic similarity is the style similarity of the city, which is finite by the essential characteristics of the dictionary, but the sparse representation of its dictionary is varied, and is an important factor for the difference of the city culture. Therefore, in this paper, the sparse matrix of the whole city is summed and re-averaged by columns to obtain the sparse representation of the style characteristics of the city as a whole, and the formula is shown as follows:
A i ¯ = k = 1 n A i k n ,
where, in order to facilitate the quantification of the style between different cities, this paper defines the Euclidean distance between different cities A i ¯ as the style similarity to measure the difference and similarity of the style between different cities, as follows:
D i s t s t y l e ( X , Y ) = D i s t s t y l e ( Y , X ) = i = 1 n x i y i 2 ,
S i m s t y l e ( X , Y ) = S i m s t y l e ( Y , X ) = 1 / D i s t s t y l e ( X , Y )
x i , y i represent the component of vector A X , A Y , respectively.

5. Results

5.1. Parameter Settings

The Resnet50 is trained in the following manner. The data set is divided into three parts: training, validation, and testing, with a 6:2:2 ratio. The validation set is mostly used to adjust parameters during model training in order to determine when training should be stopped. The image scale feed to the network for training is 256 because the original images vary in size and the batch size is set to 1024. We use stochastic gradient descent to update the network’s parameters, with momentum = 0.9, learning rate = 0.001, and weight decay = 10. Using a cosine annealing technique, we train the Resnet50 over 800 iterations. Finally, we compute the style features using the feature map of the fourth layer, which results in a dimension of 4096.

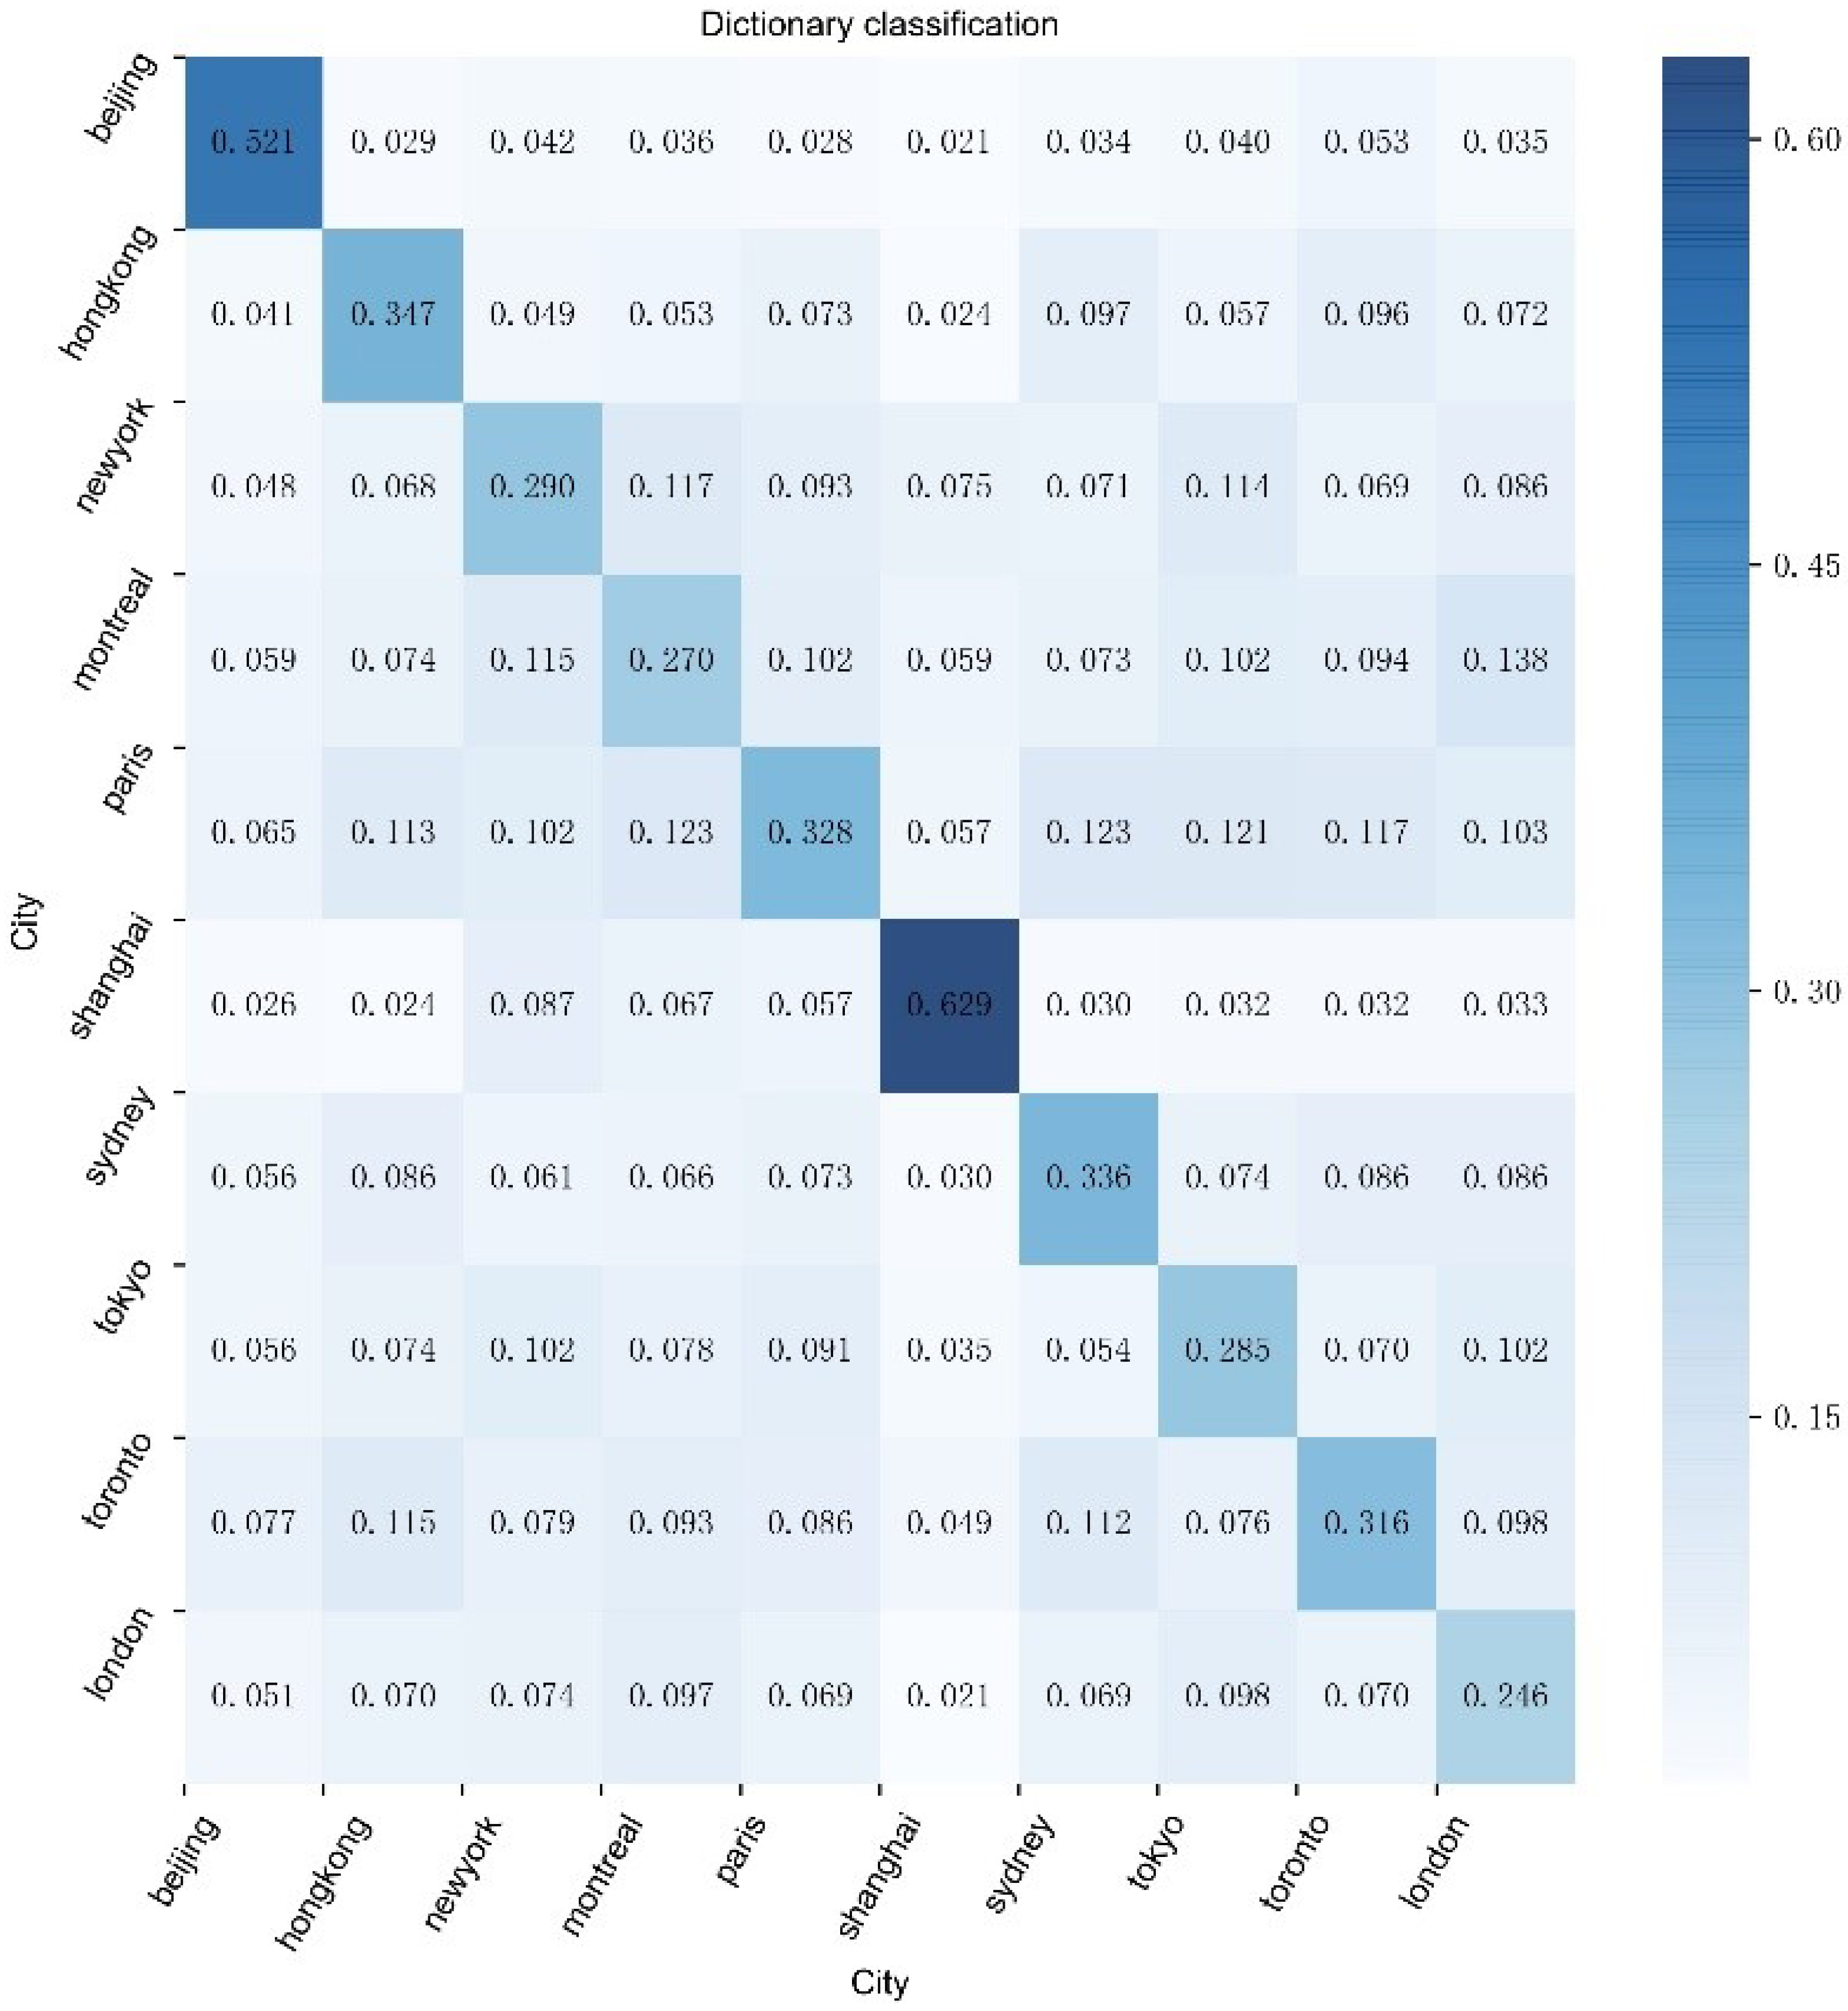
5.2. Dictionary Classification

Dictionary learning based on urban classification task not only can generate urban visual memes but also can roughly discern the similarities and differences among urban cultures. The samples in this research were generated using random sampling, and the training and test sets were divided in a 6:4 ratio, with 30 iterations and a dictionary K atomic number of 300. In order to avoid the randomness of the experimental results, this paper randomly samples five times, and the best accuracy of the test set is taken as the final classification result, as shown in Table 2. It can be found that the accuracy difference of the five random samplings visual style classification is not too large, which ensures the generality of the random sampling results, and its average accuracy is 0.351, with the fifth random sampling classification result having the highest accuracy. Therefore, the subsequent paper is elaborated with the fifth result.
The classification results of the fifth random sampling are presented in a confusion matrix, as shown in Figure 3. The value located on the diagonal line refers to the proportion of samples in which urban images are correctly classified, reflecting the uniqueness of urban style; while the off-diagonal value denotes resemblance to other urban cultures, and the higher value represents the more similar style among cities. From Figure 3, we can see that the value on the diagonal is the highest, indicating that urban styles can be distinguished using the urban dictionary. Beijing (0.52) and Shanghai (0.63) have the highest classification accuracy, implying better uniqueness compared with other cities. Meanwhile, London (0.246), Montreal (0.270), Tokyo (0.285) are less distinguishable from other cities.
In addition to discovering the uniqueness of cities, more crucially, we can trace the reasons for the similarity between cities through the misclassified samples. We visualize three exemplary sets of misclassified samples in Figure 4 to provide a better understanding of why misclassification occurs. The first and second sets are Beijing and Tokyo, Hong Kong and Tokyo, respectively, to demonstrate how Tokyo misclassified as Beijing and Hong Kong. The third set contains London, Montreal, New York and Paris, four cities that are easily confused with each other in terms of style. The comparison of Beijing and Tokyo reveals that Tokyo’s architecture is very similar to Beijing’s, owing to similar eaves architectural styles; the comparison of Hong Kong and Tokyo reveals that Hong Kong’s architectural complex is famous for being crowded, and images of Tokyo city being misclassified to Hong Kong also reflect the characteristics of crowding, as well as some images having similar shooting perspectives; and the comparison of London, Montreal, and New York reveals similar Gothic architecture and special domed buildings style.

5.3. Memetic Similarity

After obtaining the visual memes of different cities, we calculate the Memetic similarity between cities, the result is shown in Figure 5, where the similarity between the city and itself is set to 0.74 for the sake of visualization. We can observe that the memetic similarity between cities is fairly large, implying that the differences in styles between cities are not due to differences in the visual memes, i.e., differences in the basic components of urban style. For example, the memetic similarity (0.743) between Beijing and Shanghai, two cities with distinct urban styles (which cannot be easily misclassified into each other as shown in Figure 3), has the largest memetic similarity, indicating that the visual meme is not the cause of the stylistic differences. Actually, urban style is a linear combination of visual memes, and the differences in styles between cities may be related to the way the visual memes are combined.

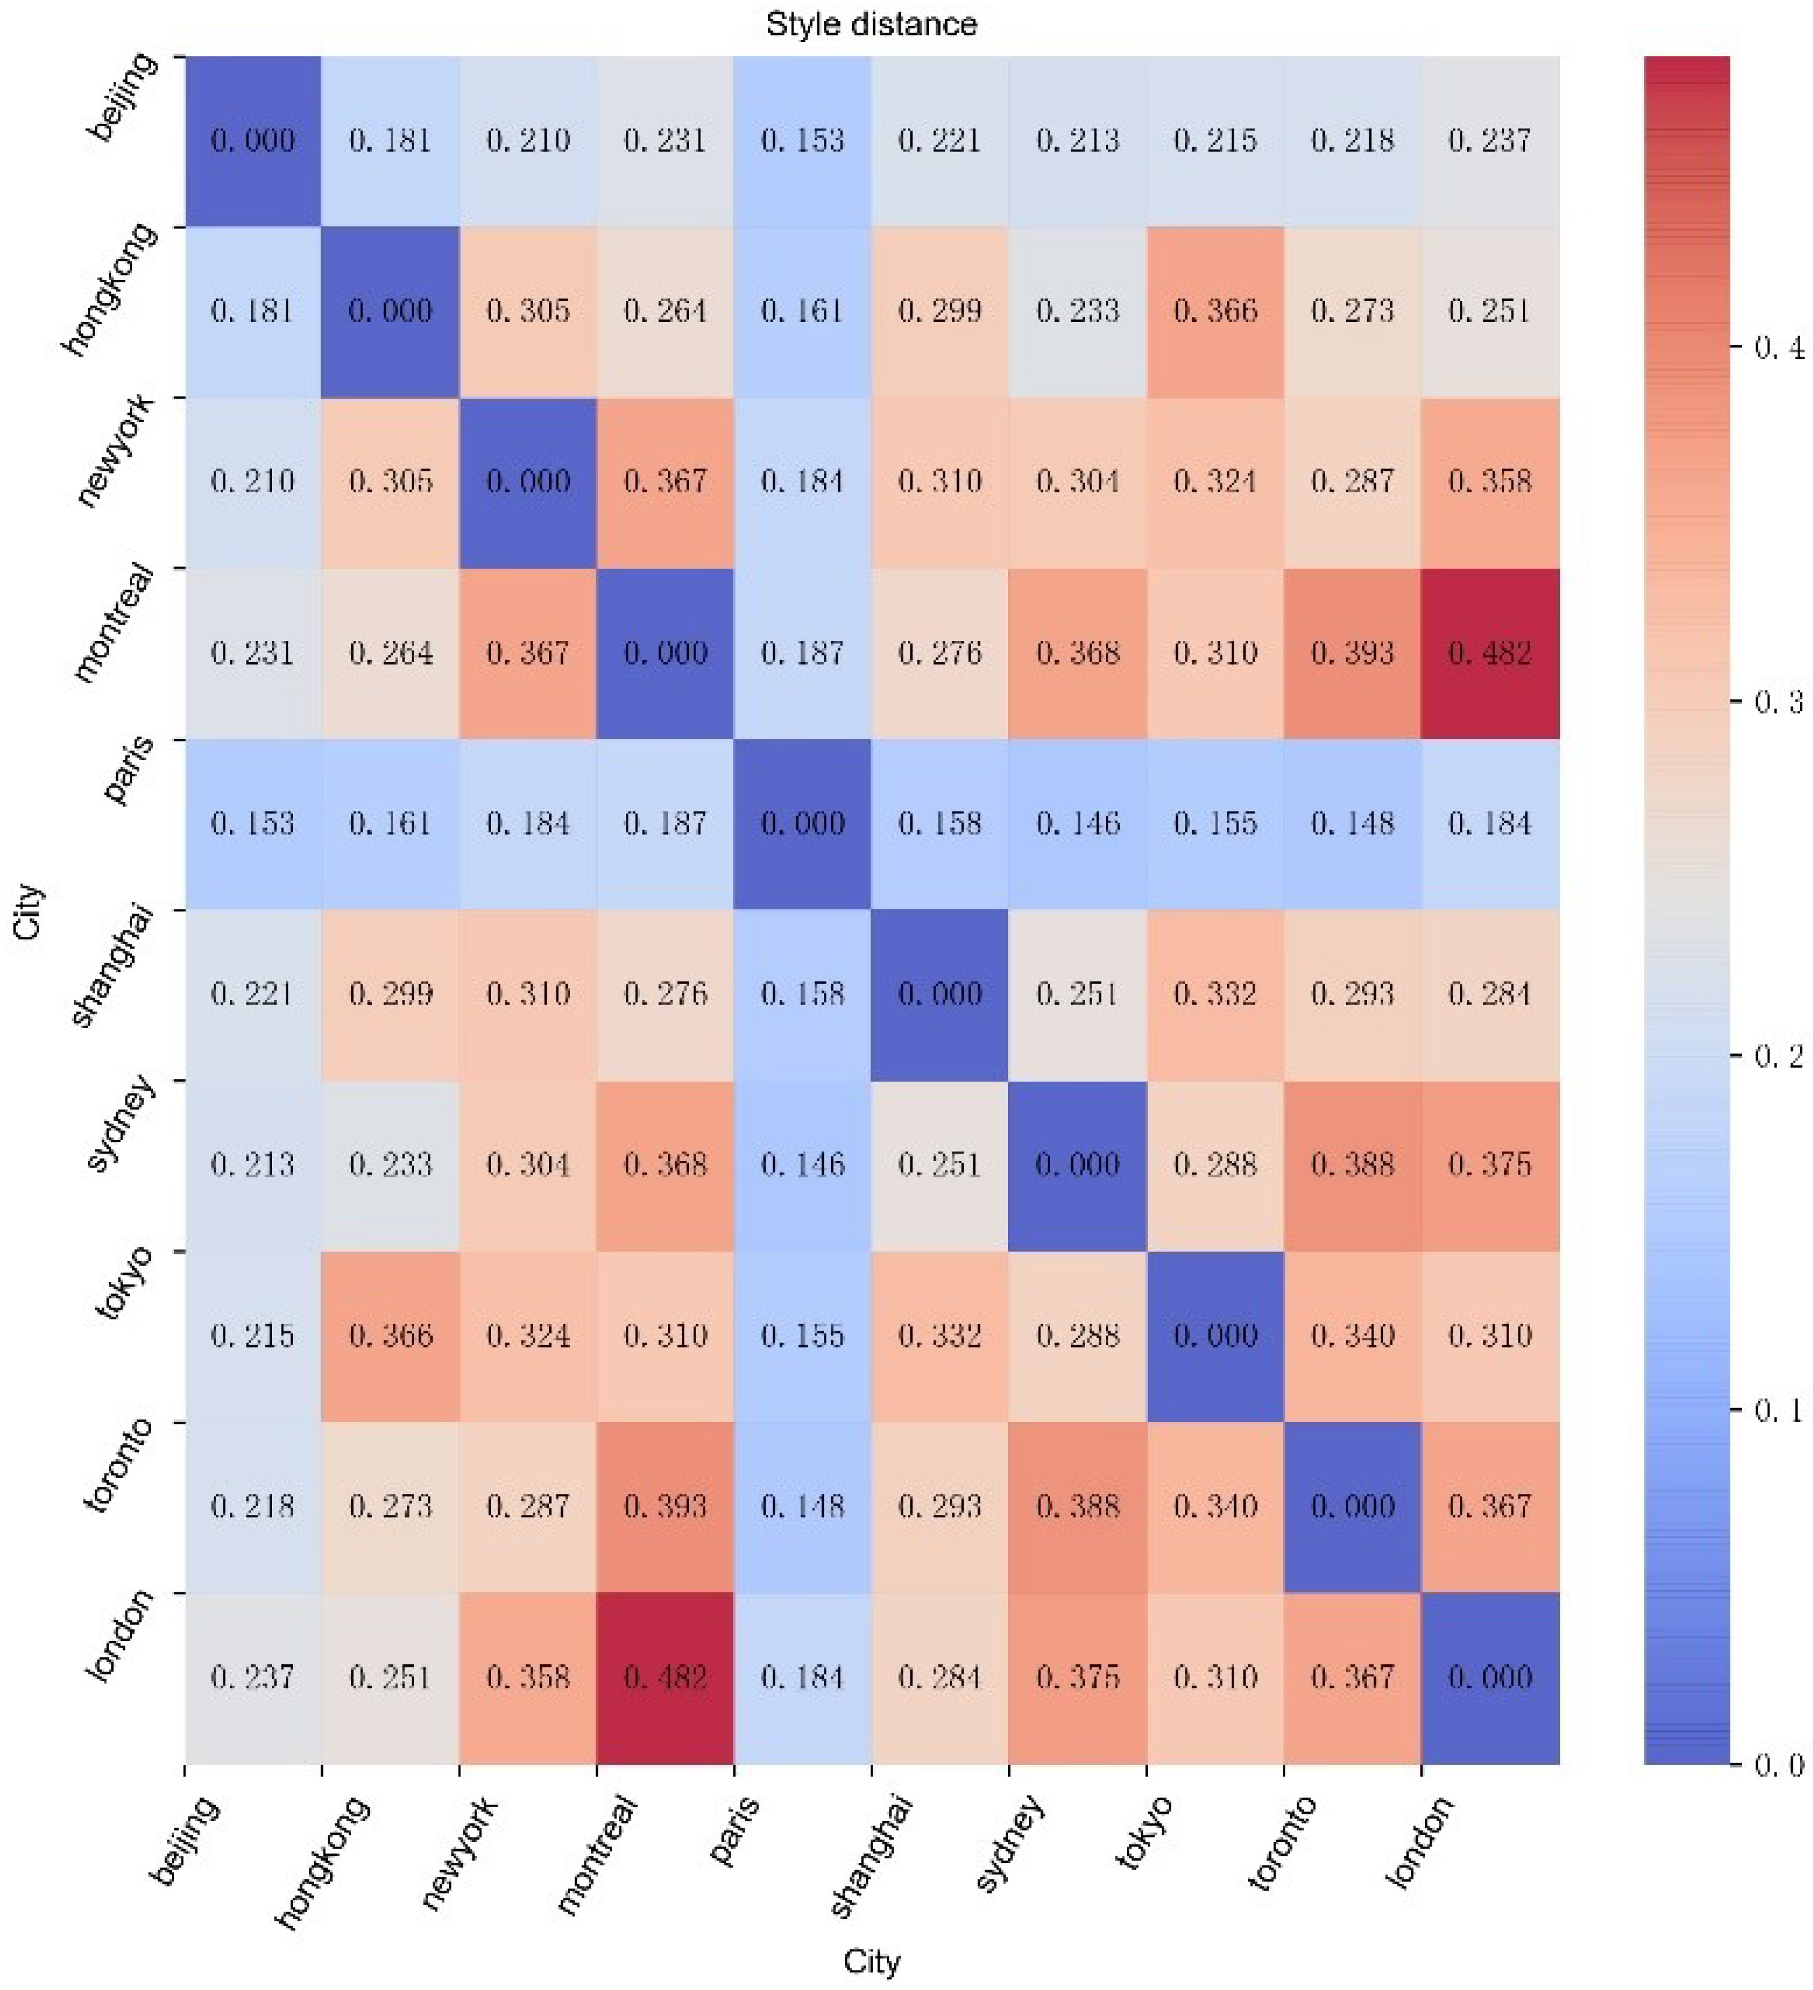
5.4. Style Similarity

To further verify that the linear combination of visual memes is the root cause of cultural differences between cities, we calculated the style similarity between different cities using the average value of the overall sparse representation of cities as an expression of the urban style, which is shown in Figure 6, where the larger value indicates the more comparable culture between cities, and diagonal entries are set to 0. Montreal and Toronto have the highest level of style similarity (0.48), indicating that their cultures are more comparable. At the same time, Beijing has a rather low degree of style similarity with other cities, which is in accordance with its urban uniqueness. Moreover, the style similarity between Beijing and Shanghai is small, which, when combined with the large memetic similarity shown in Figure 5, confirms that the reason for the difference in city cultures does not lie in visual memes but in whether the sparse representation of visual memes is similar.
Combining the results of memetic similarity, dictionary classification, and style similarity, it is found that a visual meme itself has certain limitations, i.e., the elements of the style that make up a city are relatively certain, and the cultural differences among cities are mainly attributed to the different sparse expressions of a visual meme in different cities, while style similarity can effectively measure the cultural differences among cities.

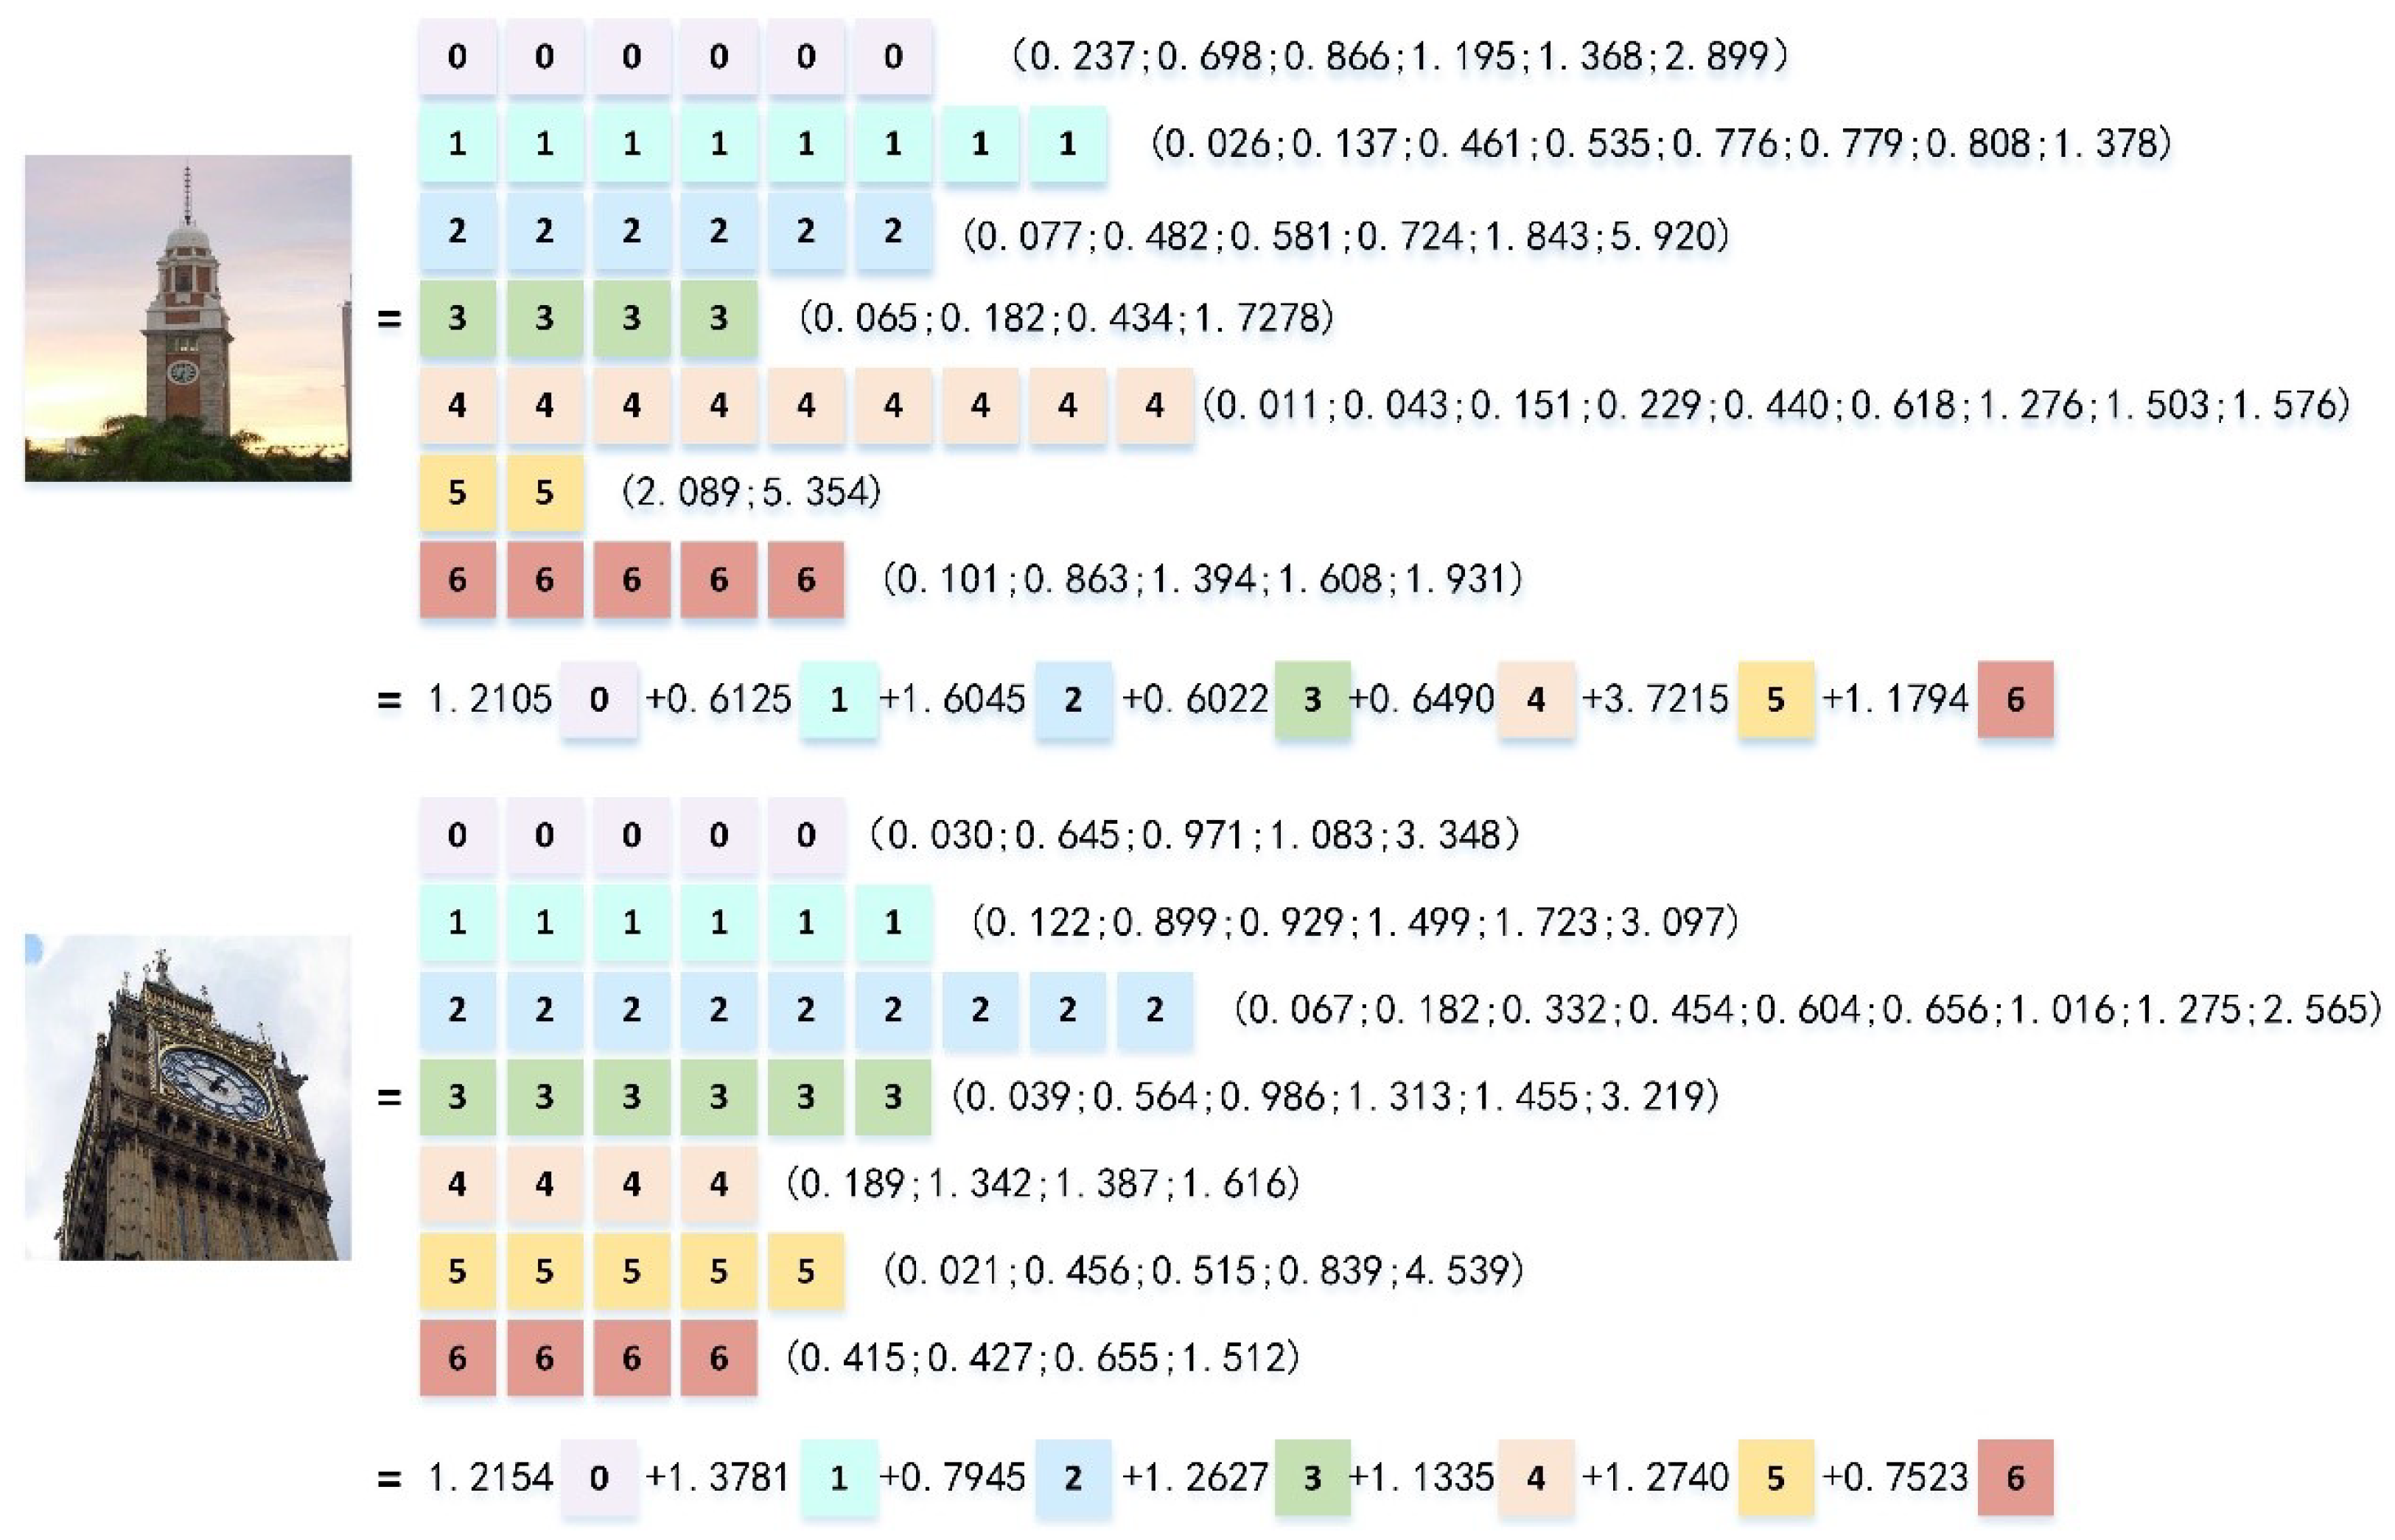
5.5. Meme Type and Sparse Representation

The above study uncovers the reasons for cultural disparities between cities. Although the visual meme itself has some limitations, the exploration for the differences between cities can be benefit from the study of visual memetic types. Therefore, we feed the visual memes into the K-means clustering algorithm to generate diverse memetic types. The clustering results with the number of clusters of seven are selected for visualization and analysis, based on the calinsko harabaz index and the principle of classification balance, as shown in Figure 7.
Table 3 provides statistics on the composition of visual meme types in different cities, where each column represents a visual meme type and each row represents the distribution of visual meme types in a city.
It can be found that the distribution of visual meme types is relatively balanced for each city, which further indicates that the styles of cities can be represented by several different visual meme types, but there is very little difference between the visual memes that are the stylistic constituents of cities.
Then, we can represent every image as a linear combination of visual memes and convert it into a combination of meme types so that we can explore how two images from different cities are alike in terms of meme types. The sparse representations of Hong Kong and London are given in Figure 8 below. Visual memes belonging to the same type are grouped in the same row, and the numbers in parentheses are the corresponding coefficients. The final coefficients of meme types are obtained by calculating the average of the coefficients of the same type of visual meme.
We can see that for the two different images of Hong Kong and London, the sparse expressions of type 0 visual memes are very close, at 1.2105 and 1.2154, respectively, while the sparse expressions of the other visual memes differ greatly. As a result of the type 0 visual meme, these two images have comparable characteristics, and the causes of the differences in image styles in other cities may also be investigated by quantifying the distinct types of visual memes.

6. Conclusions

The urban style is a key emblem of urban culture, so it is critical to acknowledge the characteristics of the urban style for the dissemination of urban culture and the construction of distinctive cities.In this paper, we explore how urban styles are similar and different in terms of their overall style and basic components. First, we compute style features based on deep-level features derived by the Resnet50 network, and then extract visual memes that represent the style composition of the city by the dictionary learning method. To measure how urban styles differ quantitatively, we define style similarity and memetic similarity.
Using the Yahoo Flickr dataset, we investigated the similarities and differences in urban styles across ten cities, and the following are the primary findings. The city classification based on the learned dictionaries shows that Beijing (0.52) and Shanghai (0.63) are the two most distinct cities among the ten; they are more easily distinguished from other cities and classified into the right categories, while the differences in the styles of other cities are less obvious. We also found that the memetic similarities between cities are large, indicating that the visual memes that make up the urban style are alike, and the small style similarities (determined by the coefficients of sparse representations) between cities further confirm that the differences in style between cities are due to different combinations of visual memes. Moreover, similar images from two different cities can be compared by comparing the combination coefficients of different types of visual memes, allowing researchers to investigate the types of memes that produce similarity and difference, as well as decipher the finer reasons for urban style differences.
When memes and urban style research are coupled, it becomes possible to comprehend not only the overall urban style, but also the reasons for similarities between cities at a finer granularity. Our work, however, has a number of drawbacks. We know how many different elements compose the urban style without understanding what they are since the visual memes obtained through dictionary learning in this research are unlabeled and hence lack interpretability. The urban style is also a complicated blend, and photos of urban buildings from Flickr alone can not adequately convey it. We can expand our research in the future by combining multi-source and multi-class urban images to extract visual memes with labels for a more accurate interpretation of urban style.

Author Contributions

Conceptualization, M.Z. and Z.S.; methodology, M.Z. and Z.S.; validation, X.G.; formal analysis, Z.S.; data curation, J.X. and P.Z.; writing—review and editing, Z.S. and S.H.; visualization, M.Z. and Z.S.; supervision, H.L. and S.L. All authors read and approved the final manuscript.

Funding

This work was supported by the National Natural Science Foundation of China under Grant 42171458.

Data Availability Statement

Publicly available datasets were analyzed in this study. This data can be found here: [https://bit.ly/yfcc100md], accessed on 18 October 2021.

Conflicts of Interest

The authors declare no conflict of interest.

References

  1. Battiston, F.; Nicosia, V.; Latora, V.; San Miguel, M. Layered social influence promotes multiculturality in the Axelrod model. Sci. Rep. 2017, 7, 1809. [Google Scholar] [CrossRef] [PubMed] [Green Version]
  2. Paasi, A. Region and place: Regional identity in question. Prog. Hum. Geogr. 2003, 27, 475–485. [Google Scholar] [CrossRef]
  3. Zhao, J.H.; Zeng, D.L.; Zhou, T.W.; Zhu, Z.C. Data Mining of Urban New Energy Vehicles in an Intelligent Government Subsidy Environment Using Closed-Loop Supply Chain Pricing Model. Comput. Syst. Sci. Eng. 2020, 35, 151–172. [Google Scholar] [CrossRef]
  4. Romeu, J. On Operations Research and Statistics Techniques: Keys to Quantitative Data Mining. Am. J. Math. Manag. Sci. 2006, 26, 293–328. [Google Scholar] [CrossRef]
  5. Obeso, A.M.; Vázquez, M.S.G.; Acosta, A.A.R.; Benois-Pineau, J. Connoisseur: Classification of styles of Mexican architectural heritage with deep learning and visual attention prediction. In Proceedings of the 15th International Workshop on Content-Based Multimedia Indexing, Florence, Italy, 19–21 June 2017; pp. 1–7. [Google Scholar]
  6. Dawkins, R.; Davis, N. The Selfish Gene, 1st ed.; Macat Library: London, UK, 2017. [Google Scholar]
  7. Reynolds, D.A. Gaussian mixture models. Encycl. Biom. 2009, 741, 659–663. [Google Scholar]
  8. Ramirez, I.; Sprechmann, P.; Sapiro, G. Classification and clustering via dictionary learning with structured incoherence and shared features. In Proceedings of the 2010 IEEE Computer Society Conference on Computer Vision and Pattern Recognition, San Francisco, CA, USA, 13–18 June 2010; pp. 3501–3508. [Google Scholar]
  9. Oto-Peralías, D. What do street names tell us? The ‘city-text’as socio-cultural data. J. Econ. Geogr. 2018, 18, 187–211. [Google Scholar] [CrossRef]
  10. Hollenstein, L.; Purves, R. Exploring place through user-generated content: Using Flickr tags to describe city cores. J. Spat. Inf. Sci. 2010, 2010, 21–48. [Google Scholar]
  11. Zhou, B.; Liu, L.; Oliva, A.; Torralba, A. Recognizing city identity via attribute analysis of geo-tagged images. In Proceedings of the European Conference on Computer Vision, Zurich, Switzerland, 6–12 September 2014; pp. 519–534. [Google Scholar]
  12. Dubey, A.; Naik, N.; Parikh, D.; Raskar, R.; Hidalgo, C.A. Deep learning the city: Quantifying urban perception at a global scale. In Proceedings of the European Conference on Computer Vision, Amsterdam, The Netherlands, 8–16 October 2016; pp. 196–212. [Google Scholar]
  13. Doersch, C.; Singh, S.; Gupta, A.; Sivic, J.; Efros, A. What makes paris look like paris? Commun. ACM 2015, 58, 103–110. [Google Scholar] [CrossRef]
  14. Stepaniuk, K. Visualization of expressing culinary experience in social network, memetic approach. Entrep. Sustain. Issues 2018, 5, 693–702. [Google Scholar] [CrossRef]
  15. Malhotra, N. An Empirical Analysis of “Tort Tales” How Cultural Memes Influence Attitudes on Tort Reform. J. Law Court. 2015, 3, 149–166. [Google Scholar] [CrossRef]
  16. Shin, S.; Park, J. Evolutionary Dynamics of Cultural Memes and Application to Massive Movie Data. arXiv 2019, arXiv:1903.02197. [Google Scholar]
  17. Walker, R. Cultural memes, innate proclivities and musical behaviour: A case study of the western traditions. Psychol. Music 2004, 32, 153–190. [Google Scholar] [CrossRef]
  18. Theisen, W.; Brogan, J.; Thomas, P.B.; Moreira, D.; Phoa, P.; Weninger, T.; Scheirer, W. Automatic discovery of political meme genres with diverse appearances. arXiv 2020, arXiv:2001.06122. [Google Scholar]
  19. Jia, G. Research on Dictionary Learning Based Ming and Qing Palace Dress Image Multi-Label Annotation for Cultural Gene. Master’s Thesis, Beijing University of Posts and Telecommunications, Beijing, China, 2018. [Google Scholar]
  20. Gu, B.; Xiong, W.; Bai, Z. Human Action Recognition Based on Supervised Class-Specific Dictionary Learning with Deep Convolutional Neural Network Features. Comput. Mater. Contin. 2020, 63, 243–262. [Google Scholar] [CrossRef]
  21. Geng, L.; Cui, C.; Guo, Q.; Niu, S.; Zhang, G.; Fu, P.; Geng, L.; Cui, C.; Guo, Q.; Niu, S.; et al. Robust Core Tensor Dictionary Learning with Modified Gaussian Mixture Model for Multispectral Image Restoration. Comput. Mater. Contin. 2020, 65, 913–928. [Google Scholar] [CrossRef]
  22. Hong, X.; Zheng, X.; Xia, J.; Wei, L.; Xue, W. Cross-Lingual Non-Ferrous Metals Related News Recognition Method Based on CNN with A Limited Bi-Lingual Dictionary. Comput. Mater. Contin. 2019, 58, 379–389. [Google Scholar] [CrossRef]
  23. Liu, Q.; Wang, S.; Ying, L.; Peng, X.; Zhu, Y.; Liang, D. Adaptive dictionary learning in sparse gradient domain for image recovery. IEEE Trans. Image Process. 2013, 22, 4652–4663. [Google Scholar] [CrossRef] [PubMed]
  24. Ma, L.; Moisan, L.; Yu, J.; Zeng, T. A dictionary learning approach for Poisson image deblurring. IEEE Trans. Med. Imaging 2013, 32, 1277–1289. [Google Scholar]
  25. Du, D.; Pan, Z.; Zhang, P.; Li, Y.; Ku, W. Compressive sensing image recovery using dictionary learning and shape-adaptive DCT thresholding. Magn. Reson. Imaging 2019, 55, 60–71. [Google Scholar] [CrossRef] [PubMed]
  26. Tartavel, G.; Gousseau, Y.; Peyré, G. Variational texture synthesis with sparsity and spectrum constraints. J. Math. Imaging Vis. 2015, 52, 124–144. [Google Scholar] [CrossRef]
  27. Quan, Y.; Huang, Y.; Ji, H. Dynamic texture recognition via orthogonal tensor dictionary learning. In Proceedings of the IEEE International Conference on Computer Vision, Santiago, Chile, 11–18 December 2015; pp. 73–81. [Google Scholar]
  28. Gangeh, M.J.; Ghodsi, A.; Kamel, M.S. Dictionary learning in texture classification. In Proceedings of the International Conference Image Analysis and Recognition, Burnaby, BC, Canada, 22–24 June 2011; pp. 335–343. [Google Scholar]
  29. Chen, Y.; Su, J. Sparse embedded dictionary learning on face recognition. Pattern Recognit. 2017, 64, 51–59. [Google Scholar] [CrossRef]
  30. Ou, W.; You, X.; Tao, D.; Zhang, P.; Tang, Y.; Zhu, Z. Robust face recognition via occlusion dictionary learning. Pattern Recognit. 2014, 47, 1559–1572. [Google Scholar] [CrossRef]
  31. Luo, X.; Xu, Y.; Yang, J. Multi-resolution dictionary learning for face recognition. Pattern Recognit. 2019, 93, 283–292. [Google Scholar] [CrossRef]
  32. Lin, G.; Yang, M.; Yang, J.; Shen, L.; Xie, W. Robust, discriminative and comprehensive dictionary learning for face recognition. Pattern Recognit. 2018, 81, 341–356. [Google Scholar] [CrossRef]
  33. Szegedy, C.; Ioffe, S.; Vanhoucke, V.; Alemi, A.A. Inception-v4, inception-resnet and the impact of residual connections on learning. In Proceedings of the Thirty-First AAAI Conference on Artificial Intelligence, San Francisco, CA, USA, 4–9 February 2017. [Google Scholar]
  34. Wu, Z.; Shen, C.; Van Den Hengel, A. Wider or deeper: Revisiting the resnet model for visual recognition. Pattern Recognit. 2019, 90, 119–133. [Google Scholar] [CrossRef] [Green Version]
  35. Rezende, E.; Ruppert, G.; Carvalho, T.; Ramos, F.; De Geus, P. Malicious software classification using transfer learning of resnet-50 deep neural network. In Proceedings of the 2017 16th IEEE International Conference on Machine Learning and Applications (ICMLA), Cancun, Mexico, 18–21 December 2017; pp. 1011–1014. [Google Scholar]
  36. Sengupta, A.; Ye, Y.; Wang, R.; Liu, C.; Roy, K. Going deeper in spiking neural networks: VGG and residual architectures. Front. Neurosci. 2019, 13, 95. [Google Scholar] [CrossRef]
  37. Mateen, M.; Wen, J.; Song, S.; Huang, Z. Fundus image classification using VGG-19 architecture with PCA and SVD. Symmetry 2019, 11, 1. [Google Scholar] [CrossRef] [Green Version]
  38. Shin, H.C.; Roth, H.R.; Gao, M.; Lu, L.; Xu, Z.; Nogues, I.; Yao, J.; Mollura, D.; Summers, R.M. Deep convolutional neural networks for computer-aided detection: CNN architectures, dataset characteristics and transfer learning. IEEE Trans. Med. Imaging 2016, 35, 1285–1298. [Google Scholar] [CrossRef] [Green Version]
  39. Li, X.; Yang, J.; Ma, J. Large scale category-structured image retrieval for object identification through supervised learning of CNN and SURF-based matching. IEEE Access 2020, 8, 57796–57809. [Google Scholar] [CrossRef]
  40. Feng, Y.; Zeng, S.; Yang, Y.; Zhou, Y.; Pan, B. Study on the optimization of CNN based on image identification. In Proceedings of the 2018 17th International Symposium on Distributed Computing and Applications for Business Engineering and Science (DCABES), Wuxi, China, 19–23 October 2018; pp. 123–126. [Google Scholar]
  41. Gatys, L.A.; Ecker, A.S.; Bethge, M. Image style transfer using convolutional neural networks. In Proceedings of the IEEE Conference on Computer Vision and Pattern Recognition, Las Vegas, NV, USA, 27–30 June 2016; pp. 2414–2423. [Google Scholar]
  42. Karayev, S.; Trentacoste, M.; Han, H.; Agarwala, A.; Darrell, T.; Hertzmann, A.; Winnemoeller, H. Recognizing image style. arXiv 2013, arXiv:1311.3715. [Google Scholar]
  43. Huang, X.; Belongie, S. Arbitrary style transfer in real-time with adaptive instance normalization. In Proceedings of the IEEE International Conference on Computer Vision, Venice, Italy, 22–29 October 2017; pp. 1501–1510. [Google Scholar]
Figure 1. A part of urban image data example.
Symmetry 14 00175 g001
Figure 2. Research framework.
Symmetry 14 00175 g002
Figure 3. Urban dictionary classification result.
Symmetry 14 00175 g003
Figure 4. Visualization of comparison on similarity of urban dictionary classification results.
Symmetry 14 00175 g004
Figure 5. Urban visual memetic similarity.
Symmetry 14 00175 g005
Figure 6. Urban style similarity.
Symmetry 14 00175 g006
Figure 7. Visual memetic type.
Symmetry 14 00175 g007
Figure 8. Overall sparse representation of cities.
Symmetry 14 00175 g008
Table 1. Statistical results of urban image data processing.
CityImage VolumeBuilding VolumeDuplicate Sample Screening
Beijing29,60418,2886190
Hong Kong37,72417,1667617
London121,72474,30022,964
Montreal11,14892526182
New York107,96763,88724,066
Paris73,48710,8655728
Shanghai15,37614,5005655
Sydney23,10810,9045262
Tokyo86,04433,70113,938
Toronto28,58517,7167184
Table 2. Statistics of urban image dictionary classification result.
Time of Random SampleAccuracy
10.3565
20.3552
30.3504
40.3562
50.3567
Average accuracy0.351
Table 3. Visual memetic type.
City0123456
Beijing45276942413541
Hong Kong37316955542727
London46278051333528
Montreal41347743353832
New York46298047393227
Paris21608344403418
Shanghai41267345413440
Sydney51327758233524
Tokyo43267664392626
Toronto43328261292726
Total414324766510374323289
Publisher’s Note: MDPI stays neutral with regard to jurisdictional claims in published maps and institutional affiliations.

