Article

Coupling between Trigeminal-Induced Asymmetries in Locus Coeruleus Activity and Cognitive Performance

by
Maria Paola Tramonti Fantozzi
1,†,
Ottavia Marconi
2,†,
Federica Simoni
2,†,
Vincenzo De Cicco
1,
Davide De Cicco
3,
Enrico Cataldo
4,
Massimo Barresi
5,
Luca Bruschini
1,
Paola d’Ascanio
1,
Ugo Faraguna
1,6,‡ and
Diego Manzoni
1,*,‡
1
Department of Translational Research and of New Surgical and Medical Technologies, University of Pisa, 56127 Pisa, Italy
2
Department of Surgical, Medical, Molecular Pathology and Critical Care Medicine, University of Pisa, 56124 Pisa, Italy
3
Department of Neurosciences, Reproductive and Odontostomatological Sciences, University of Naples “Federico II”, 80138 Naples, Italy
4
Department of Physics, University of Pisa, 56127 Pisa, Italy
5
Comprehensive Middle School Albano, Albano S. Alessandro, 24122 Bergamo, Italy
6
Department of Developmental Neuroscience, IRCCS Fondazione Stella Maris, 56128 Pisa, Italy
*
Author to whom correspondence should be addressed.
The authors contributed equally to the work.
These authors shared senior co authorship.
Symmetry 2021, 13(9), 1676; https://doi.org/10.3390/sym13091676
Submission received: 29 June 2021 / Revised: 27 August 2021 / Accepted: 8 September 2021 / Published: 11 September 2021
(This article belongs to the Special Issue Brain, Behavior and Cognition)

Abstract

:
In humans, the asymmetry in the masseter electromyographic (EMG) activity during clenching is positively correlated with the degree of pupil size asymmetry (anisocoria) at rest. Anisocoria reveals an asymmetry in LC activity, which may lead to an imbalance in cortical excitability, detrimental to performance. Hereby, we investigated, in individual subjects, the possibility that occlusal correction, which decreases EMG asymmetry, improves performance by balancing LC activity. Cognitive performance, task-related mydriasis, and pupil size at rest were modified by changing the occlusal condition. Occlusal-related changes in performance and mydriasis were negatively correlated with anisocoria changes in only 12/20 subjects. Within this population, spontaneous fluctuations in mydriasis and anisocoria also appeared negatively coupled. Occlusal-related changes in performance and mydriasis were negatively correlated with those in average pupil size (a proxy of average LC activity) in 19/20 subjects. The strongest association was observed for the pupil changes occurring on the side with higher EMG activity during clenching. These findings indicate that the effects of occlusal conditions on cognitive performance were coupled to changes in the asymmetry of LC activity in about half of the subjects, while they were related to changes in the average tonic LC activity in virtually all of them.

1. Introduction

It is known that the deficits in spatial cognition observed following unilateral brain lesions can be more severe than those induced by bilateral symmetric injuries [1]. This suggests that the impairment depends upon the imbalance created by the lesion rather than on the extent of the damage itself. Accordingly, deficits may be greatly attenuated by depressing the activity of the intact hemisphere [2,3] as well as by asymmetrical counterbalancing stimulation of visual, vestibular, and neck proprioceptive afferents [4]. There is also evidence that asymmetries in vestibular input such as otic capsule dehiscence and unilateral vestibular loss may induce severe cognitive deficits, particularly involving spatial abilities [5,6].
These observations suggest that spatial representation in the brain relies on a balanced activity of specific central structures and peripheral afferents.
Recent evidence points to the trigeminal system as a source of potential sensorimotor asymmetries that may elicit deficits in cognitive behavior. A balanced development of occlusal forces is in fact associated with better cognitive conditions in older people [7]. It has also been shown, in subjects between 25 and 35 years with right molar loss that restoration of occlusal surface modifies EEG alpha rhythm, thus interfering with the mechanisms of attentive control [8]. Animal studies indicated that unilateral chewing is detrimental to spatial learning and leads to a decrease in the levels of serotonin and BDNF at the hippocampal level [9].
Subtle cognitive deficits associated with asymmetry in pupil size (anisocoria) at rest have been observed in subjects (either normal, bearing masticatory deficits or showing unilateral molar loss) characterized by an asymmetry in masseter electromyographic (EMG) activity during clenching [10,11,12,13]. Both the EMG asymmetry during clenching and the pupil asymmetry at rest disappeared when the occlusion was corrected by an appropriate orthotic device (bite) [10,12,13] or when the edentulism was corrected by artificial crowns [11]. In these subjects, when the dental arches were closed (without effort), the cognitive performance was impaired and task-related mydriasis was reduced. In contrast, the former improved and the latter increased by a bite application [12,13]. These modifications were negatively correlated to changes in anisocoria and average pupil size at rest [12,13].
Since (a) pupil size is currently considered as a proxy of the noradrenergic Locus Coeruleus (LC) neurons activity [14,15,16,17,18,19], (b) the trigeminal system is strongly connected to the LC [20,21,22,23,24,25,26,27,28,29] and (c) the effects of trigeminal activation are stronger on the ipsilateral side [29], it can be proposed that an asymmetry in sensorimotor trigeminal activity during clenching may be associated with an asymmetric LC activity at rest. Due to the widespread tonic LC effects on the brain [30], the imbalance in LC activity would induce an imbalance in the hemispheric excitability, leading to performance deterioration.
Regarding the relation between changes in performance and average pupil size, readout of the average LC activity, it has to be reminded that, according to the “adaptive gain theory” of Aston-Jones and Cohen [31], performance is related to the tonic LC activity by an inverted-U shaped relation. Thus, a negative correlation between performance/mydriasis and pupil size should be expected when the basal level of noradrenergic activity is high [13].
The present study further clarifies the relation between trigeminal asymmetries, LC activity, and cognitive performance by shifting the focus of attention from population to the behavior of individual subjects. For this purpose, we modified the trigeminal input in subjects showing an asymmetry of their masseter EMG activity during clenching by changing the arches position and the occlusal condition. Then, we investigated the correlation between the changes in performance/mydriasis and those (1) in anisocoria (proxy of LC imbalance) and (2) in average pupil size at rest (proxy of tonic LC activity).
These correlative analyses were repeated at population level (pooling together individual data) and extended to the spontaneous fluctuations of task-related parameters, pupil size, and anisocoria observed when the arches position and occlusal condition were kept constant.
Finally, the latter cumulative approach was utilized to study the relation of task-related parameters to the changes in the size of both pupils.

2. Materials and Methods

2.1. Subjects

The experiments were performed in 20 right-handed subjects of both sex (age 35.2 ± 12.6, range 20–54 years, 13 females), showing an asymmetry of masseter EMG activity during clenching larger than 20% of the average left-right value. In particular, 10 subjects (eight females) showed a right, while 10 (5 females) a left masseter predominance. None of the subjects were affected by metabolic, endocrine, neurological, or psychiatric disorders. Fifteen of them (10 females) had a complete dentition, while five suffered loss of 1–4 molar teeth (three females). Although none of the subjects complained masticatory/occlusal dysfunction, at the objective gnathologic examination, three of them (one female) showed signs of temporomandibular joint (TMJ) dysfunction, revealed by a click as soon as the mandible started lowering (one subject) and/or in pain when it reached the extreme opening position (two subjects). The protocol was approved by the Bioethical Committee of the Pisa University (Protocol No: 12–2019) and all participants signed an informed consent.

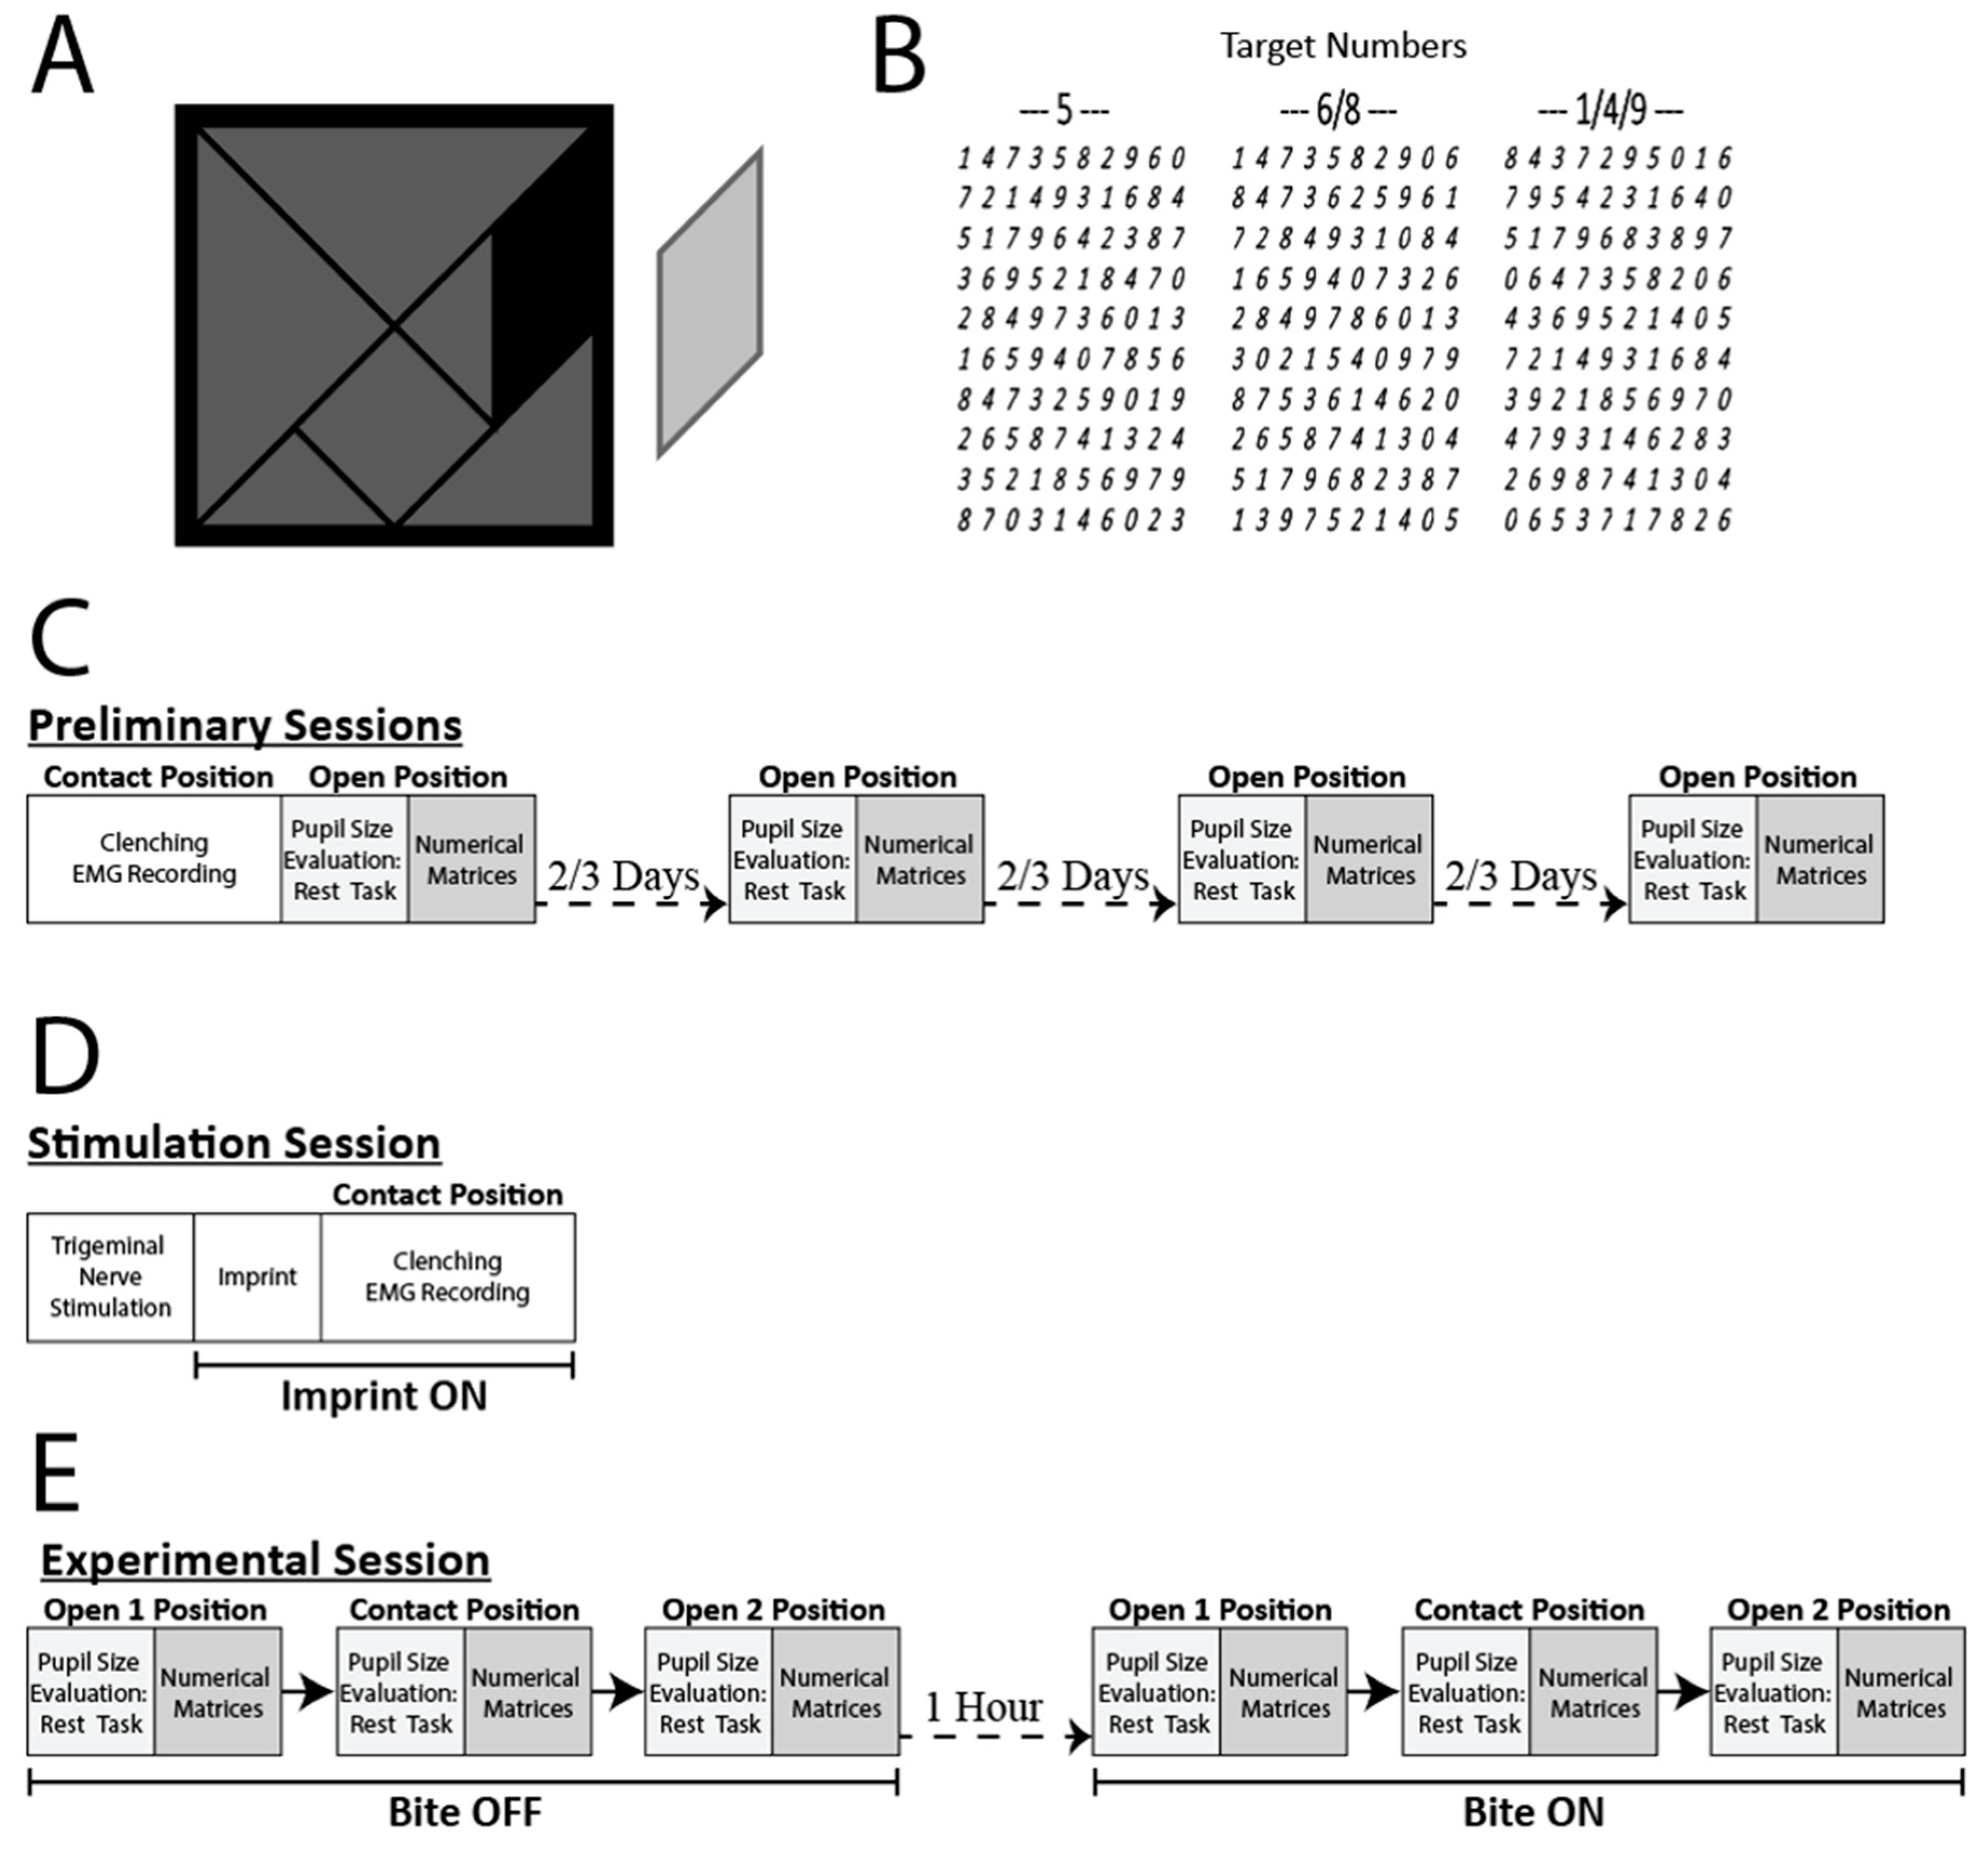
2.2. Experimental Protocol

In the initial session (Figure 1C), subjects underwent recording of the left and right masseter EMG activity during clenching. The sides of higher and lower EMG activity will be addressed in the text as the hypertonic and the hypotonic side, respectively. Soon after, while the subjects kept the arches slightly apart and the elevator muscles relaxed, measurements of pupil size at rest and during a haptic task (Figure 1A) were performed.
Moreover, keeping the arches in the same position, the subjects had to scan three numerical matrices line by line for fifteen seconds (Figure 1B), ticking the target number(s) indicated above each matrix (Spinnler–Tognoni test, [32]).
Pupil dilatation during the haptic task (task-related mydriasis) and the difference in diameter between the two pupils (anisocoria) at rest were evaluated off-line. Anisocoria was calculated as the difference between the hypertonic and the hypotonic side, defined according to an EMG-based nomenclature.
Performance in the numerical matrices test was described by the following indicators: the target numbers retrieved per second (performance index, PI), all the numbers scanned per second (scanning rate, SR) and the number of errors (missed targets + non targets wrongly ticked) per second (error rate, ER). Performance-indicators and pupil size (but not EMG activity) were measured in three further sessions, spaced by 2–3 days. These four initial sessions will be referred to as preliminary sessions 1–4 (Figure 1C).
In the fifth session (stimulation session), transcutaneous, bilateral stimulation of trigeminal motor branches was applied for 5 min to the subjects, in order to induce relaxation of masticatory muscles [33] and to determine the position of myocentric occlusion, captured by a dental impression (imprint, Figure 1D). When subjects kept this imprint in their mouths, the EMG asymmetry during clenching was greatly reduced (see Results section). The dental impression allowed us to manufacture (in 4–7 days) a bite splint modeled on the inferior dental arch [34] that the subjects wore continuously (including at night) across the following two weeks, except during meal time.
Finally, in the last (sixth) session, defined as the experimental session (Figure 1E), pupil size at rest and during task as well as performance in the matrices test were evaluated again without bite splint (Bite OFF), with the arches slightly apart (Open1), in contact (Contact), and once more apart (Open2). One hour later, the subjects repeated the sequence Open1–Contact–Open2 while wearing the bite splint (Bite ON).
The six matrices sequentially presented in the subsequent tests differed in the position of target numbers in each line to minimize possible learning due to task repetition.

2.3. Trigeminal Nerve Stimulation

The trigeminal mandibular branches were stimulated by couples of electrodes (IACER, I-Tech Medical Division, stimulating surface of each electrode: 164 mm2) applied on the incisura sigmoidea and the submental region and connected with two I.A.C.E.R stimulators (Martellago, Venice, Italy). Biphasic (cathodal/anodal) current pulses (0.54 ms, 21–25 mA) were applied at a stimulation frequency of 0.618 Hz (incisura sigmoidea) and 40 Hz (submental region), leading to contraction/relaxation of elevator and tonic contraction of the depressor muscles. Left and right current intensity was adjusted to obtain symmetric EMG responses and visually detectable mandibular movements (about 1 mm).

2.4. Haptic Task

The haptic task, based on the Tangram puzzle, was performed while the subject’s head was restrained by the pupilometer and they could not see the puzzle. The piece shaped as a parallelogram was placed in their right hand. Using the same hand, the subject had to reposition it back into the puzzle frame [10].

2.5. Pupil Size and EMG Data Acquisition

A corneal topographer-pupillographer (MOD i02, with chin support, CSO, Florence, Italy), working at the constant artificial lighting condition of 40 lux (photopic condition), measured pupil size. During the measurement, subjects fixed a light spot generated by the instrument. A camera sensor CCD1/3” (working distance: 56 mm) allowed for shots to be taken of the iris image of both sides (acquisition time: 33 ms), which were displayed on the instrument monitor together with the measurements of pupil diameter and stored on disk for off-line analysis.
Duo-trode surface Ag/AgCl electrodes (interelectrode distance 19.5 mm (MyoTronics, Seattle, WA, USA) were placed on the masseter belly [10] in order to record its EMG activity, which was sampled at 720 Hz, high passed (cutoff frequency 15 Hz), notch (50 Hz) filtered, and full-wave rectified by a K6-I MyoTronics system. The EMG bursts produced during clenching were displayed on the instrument monitor together with the corresponding average voltage values.

2.6. Statistical Analysis

The significance of changes in task-related parameters (PI, SR, average mydriasis) induced by changing mandible position (Open, Contact, Open2) and occlusal condition (Bite ON, Bite OFF) was assessed by the paired t-test.
The changes in pupil size, anisocoria, task-related mydriasis, and performance parameters (PI, SR, ER) were evaluated as differences between Contact and Open1, Open2 and Contact, Open2 and Open1 (in Bite ON and Bite OFF conditions) as well as between Bite ON and Bite OFF (in Open1, Contact, and Open2 positions). Nine values were therefore obtained for each subject and individual correlations between the changes in task-related parameters and in anisocoria/pupil size were computed.
The spontaneous variability of all the recorded parameters was evaluated by calculating all the possible differences (2-1, 3-1, 4-1, 3-2, 4-2, 4-3) between the four measurements acquired during the four preliminary sessions (all performed in Open position and Bite OFF condition). This procedure led to six values for each subject.
Correlations between the changes in task-related parameters, anisocoria and pupil size were assessed by linear regression analysis. Statistical Package for Social Sciences (SPSS, v.20) was used for the analysis and significance was set at p < 0.05. Correlation coefficients were compared by the test of equality for paired and unpaired data [35,36]. Comparisons of slopes were performed according to Cohen and colleagues [37,38].

3. Results

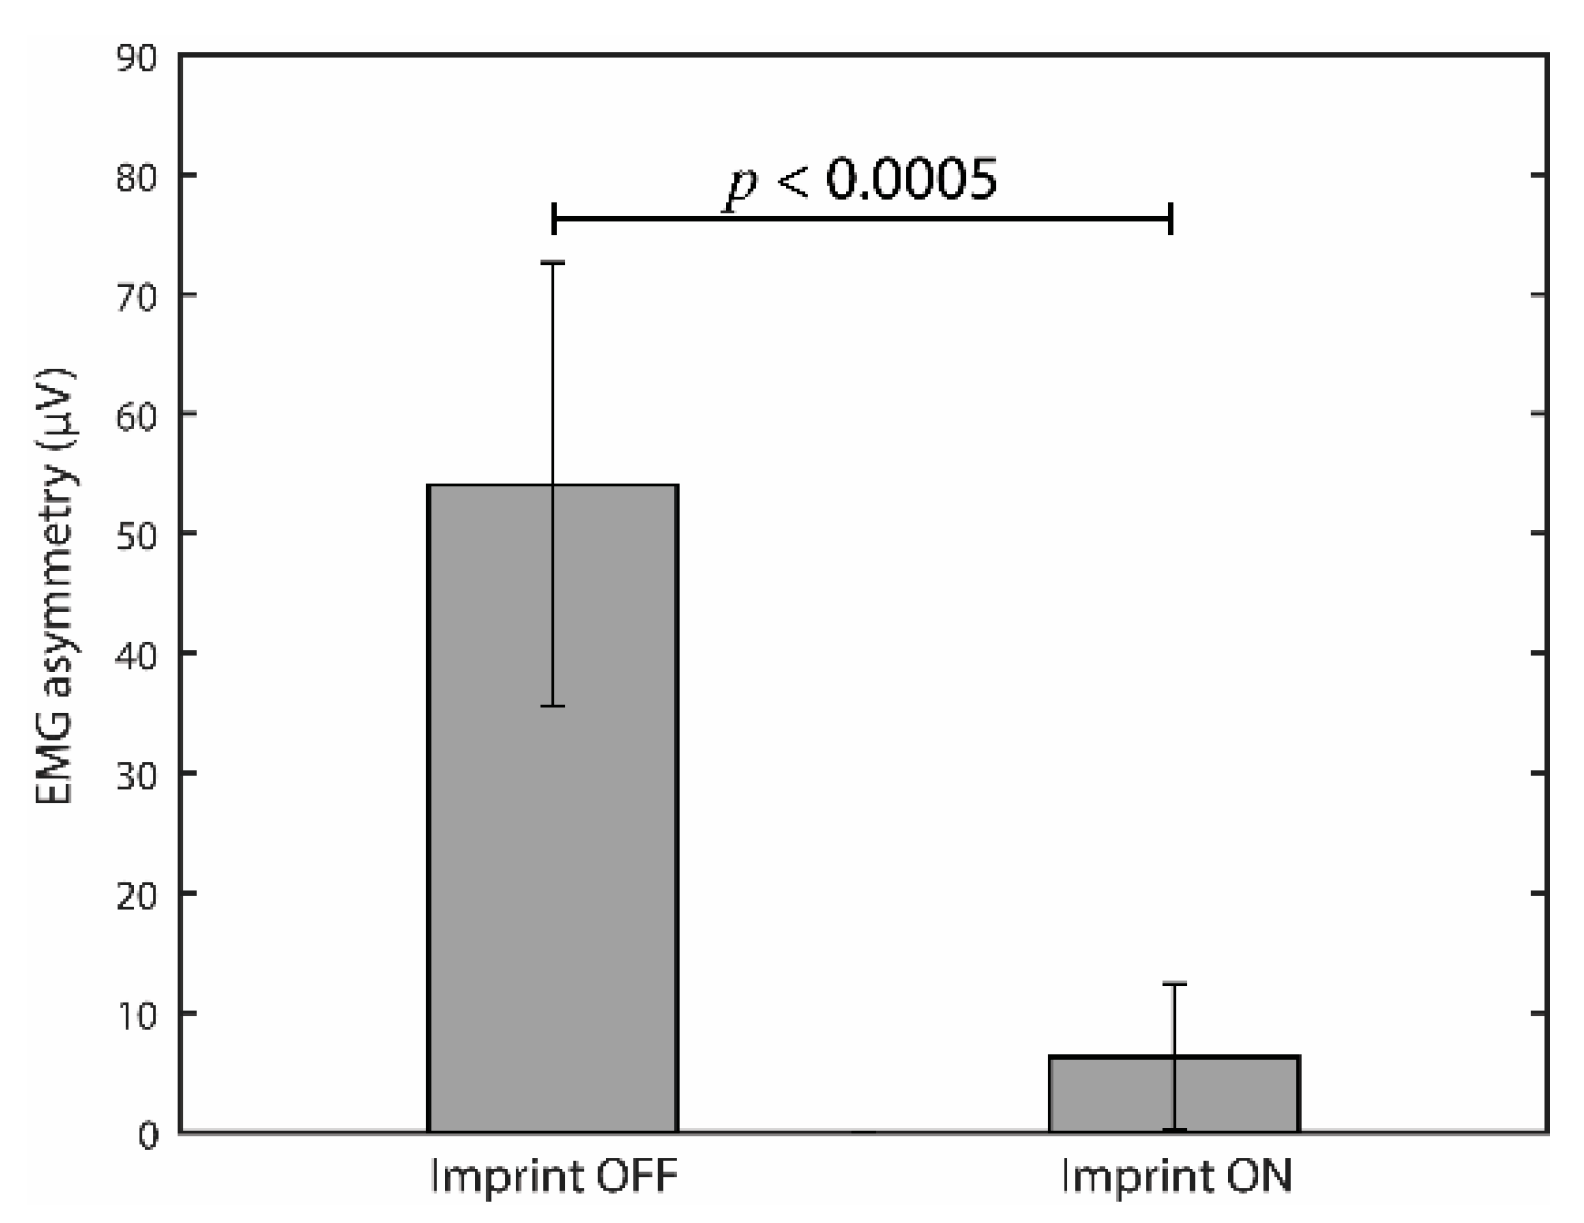
3.1. Effects of Occlusal Correction on EMG Asymmetry during Clenching

In the whole population analyzed (n = 20), the asymmetry in EMG activity (absolute value of the left-right difference) observed during clenching in the first preliminary session (Figure 1C) corresponded to 54.1 ± 18.5 μV. In the stimulation session (Figure 1D), when subjects wore the imprint correcting the occlusal contact, this asymmetry was significantly reduced to 6.3 ± 6.1 μV (paired t-test, p < 0.0005). These data are summarized in Figure 2. The imprint allowed us to manufacture the bite splint that was utilized in order to correct the occlusal contact during the experimental session.

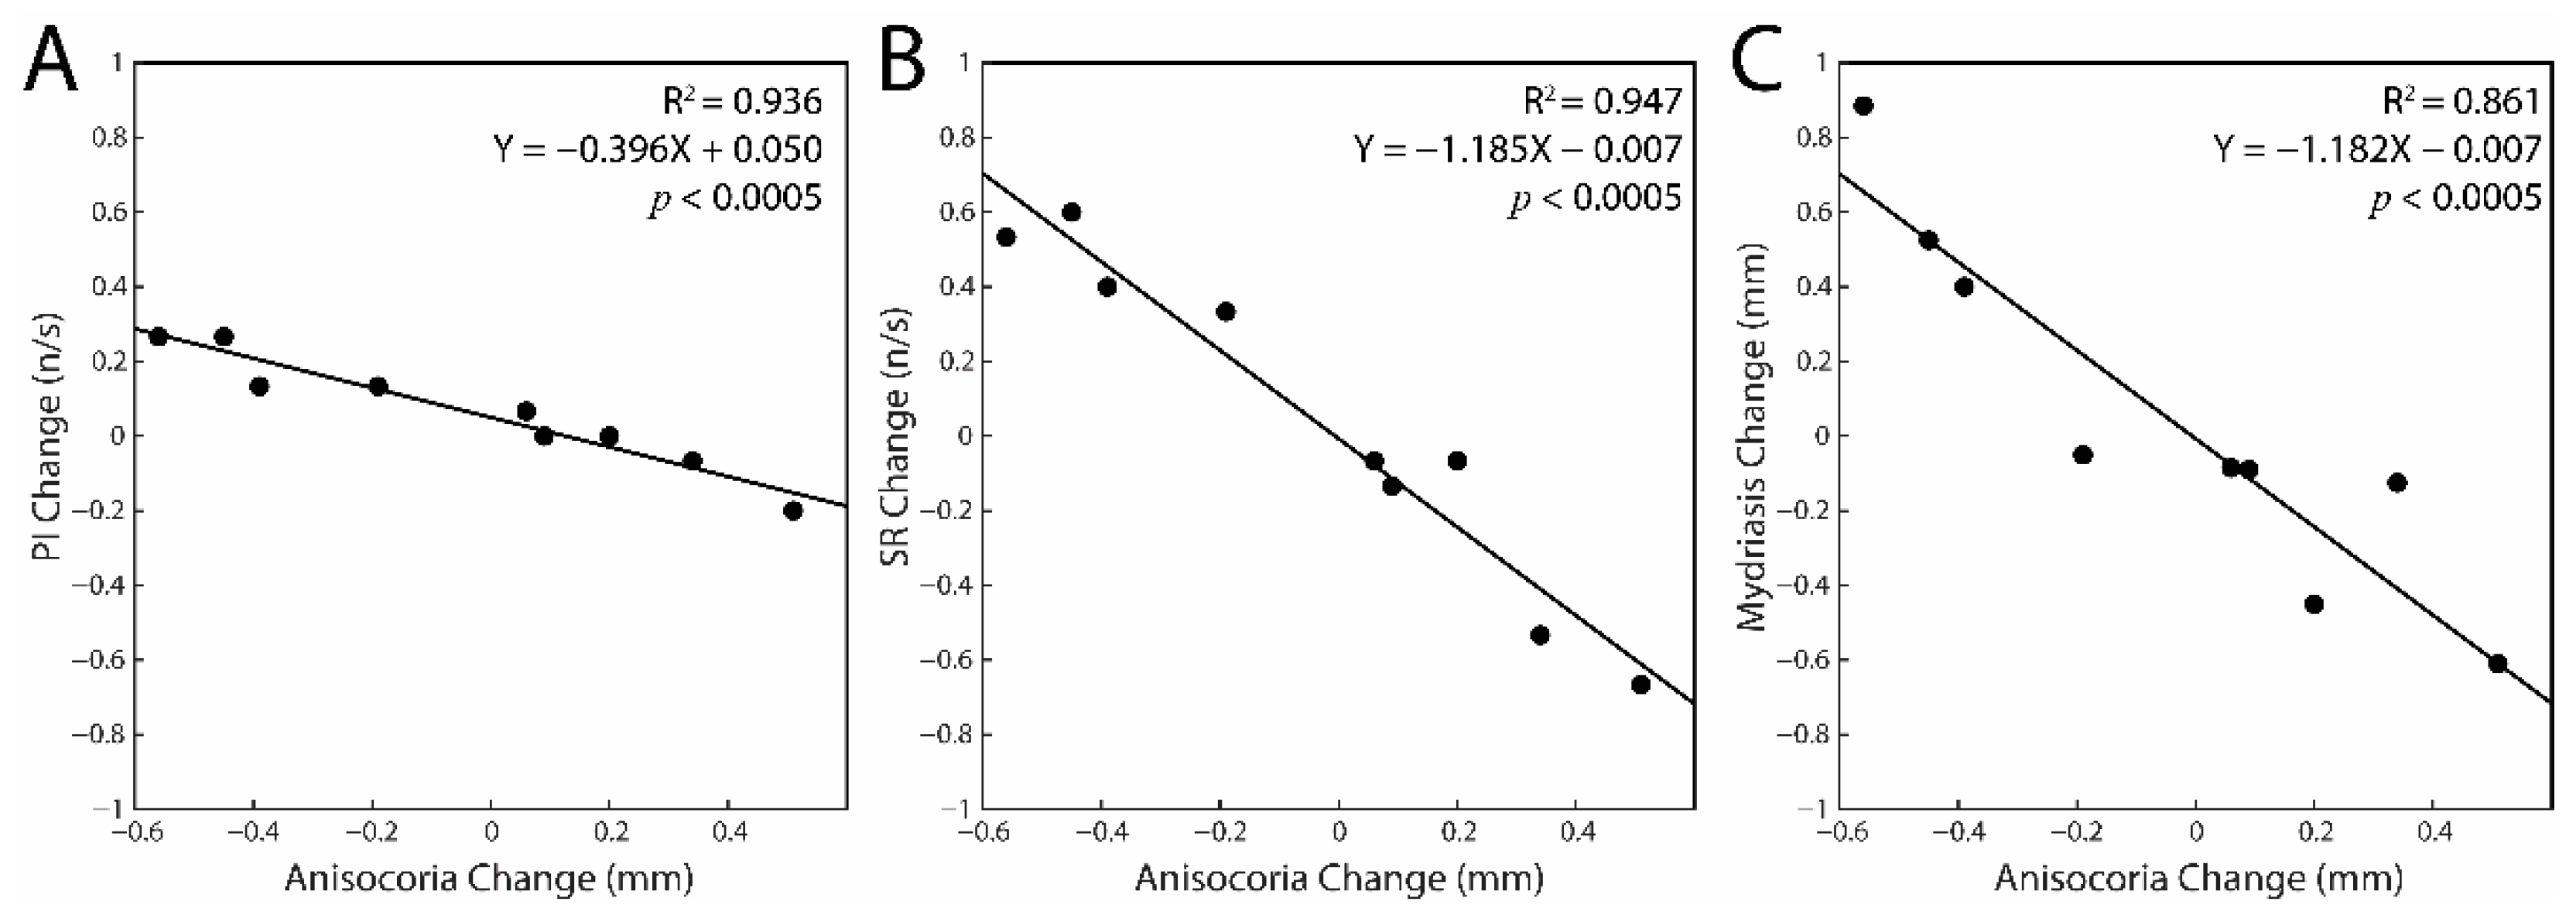
3.2. Correlations between the Changes in Task-Related Parameters and Anisocoria Observed in the Experimental Session: Single Subjects Analysis

During the experimental session, the modifications in arches position (Open1, Contact, Open2) and occlusal condition (Bite ON, Bite OFF) elicited changes in PI, SR, mydriasis, and anisocoria. In many subjects (n = 12), at least one of the changes in task-related parameters covaried with those in anisocoria. These individuals will be referred to as anisocoria dependent (AD) subjects, while the remaining eight subjects will be indicated as anisocoria independent (AI).
Table 1 shows, for each subject, the strength of these correlations (R2 coefficients) and the related significance (p) values.
It can be observed that, among AD subjects, the average R2 values indicated that anisocoria accounted for a sizeable fraction (from 59 to 70%) of the variability observed in task-related parameters.
All the significant correlations between task-related parameters and anisocoria changes were negative, as shown in Figure 3 for a representative subject.
Regression slopes and R2 coefficients of task-related parameters were independent of age, gender, and clenching predominance. Moreover, they did not differ between normal and TMJ disorders/edentulous subjects. Figure 4 shows the values of the slopes as a function of the R2 values obtained from the corresponding regressions. The vertical, dotted lines indicate the threshold for significance (R2 = 0.444, p = 0.05). It can be observed that slopes were also negative for most of the non-significant correlations.
This correlative analysis on single subjects could not be performed on data relative to the preliminary sessions since there were only four data points for subject.

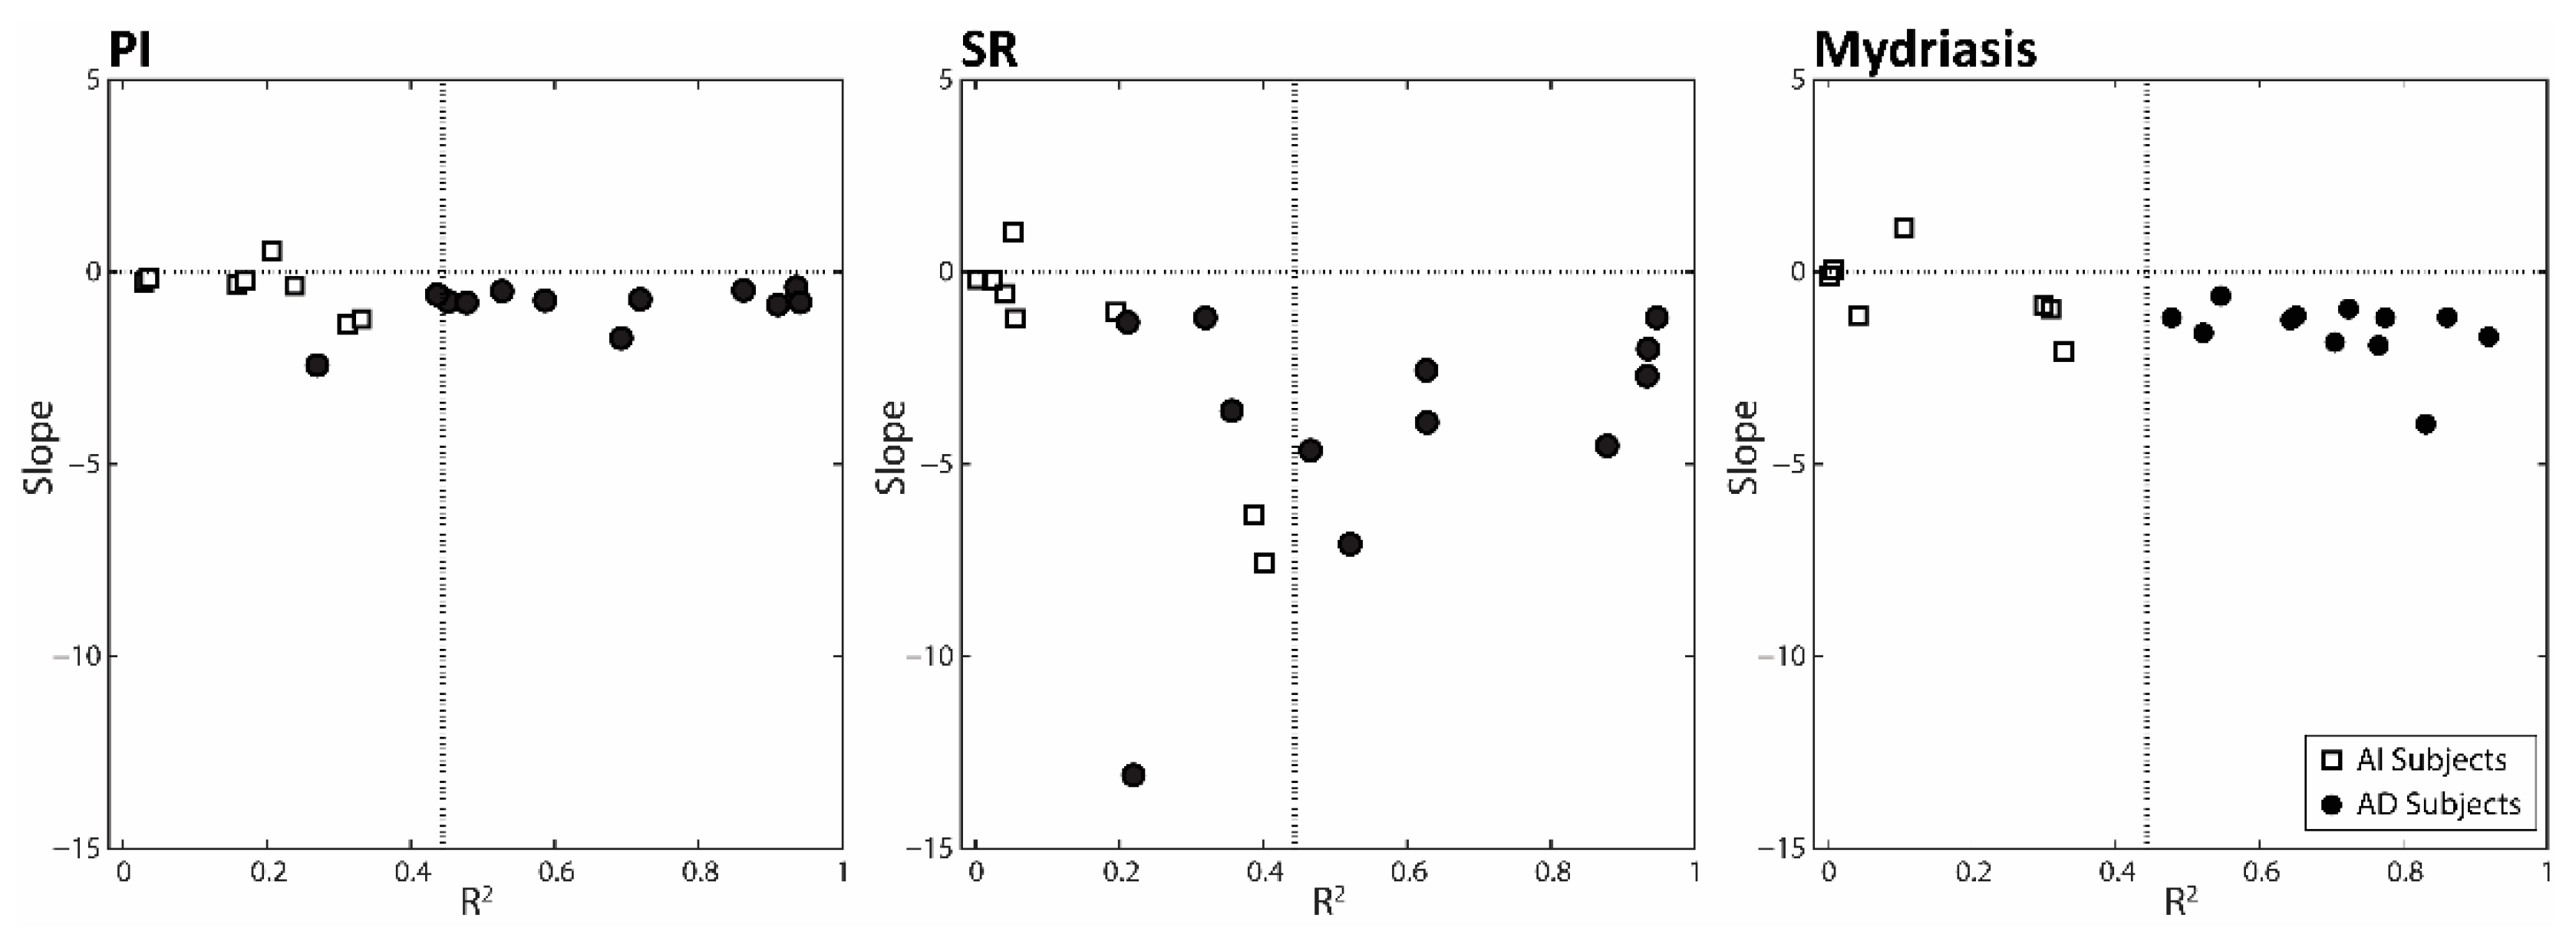
3.3. Changes in Anisocoria and Task-Related Parameters Induced by Changing Arches Position and Occlusal Condition: Differences between AD and AI Subjects

Table 2 shows, in AD and AI subjects, the changes observed in average pupil size/anisocoria at rest and task-related parameters when arches position and occlusal condition were modified. In both populations, PI, SR, and mydriasis decreased, while average pupil size increased when the arches were touching in Bite OFF. Opposite modifications were observed when AD and AI subjects changed from the Open1 to the Contact position in Bite ON.
Only anisocoria displayed a group difference. When arches went from Open1 to Contact position in Bite OFF, AD subjects increased anisocoria values, while AI subjects did not show significant changes. In both groups, anisocoria significantly decreased when the arches touched in Bite ON.
AD subjects were characterized by a significantly larger asymmetry of the masseter EMG activity during clenching than AI subjects (AD: 52.9 ± 23.3, %; AI: 34.4 ± 8.4, %, p = 0.025, data not shown in the table): subjects with a degree of EMG asymmetry ranging between 20 and 60% could be either AD or AI, while those showing EMG asymmetries larger than 60% (n = 4) were invariably AD. Interestingly, only one of the four individuals with EMG asymmetry larger than 60% showed signs of TMJ disorders (and edentulism).
The samples of AD and AI subjects did not differ in terms of gender (AD: n = eight females; AI: five females), EMG side predominance (AD: n = six right predominant; AI: four right predominant) and TMJ/dentition (AD: n = seven normal subjects; AI: n = six normal subjects). In addition, the average age of AD subjects (36.0 ± 12.3, years) was not significantly different than that of AI subjects (34.0 ± 13.7, years).

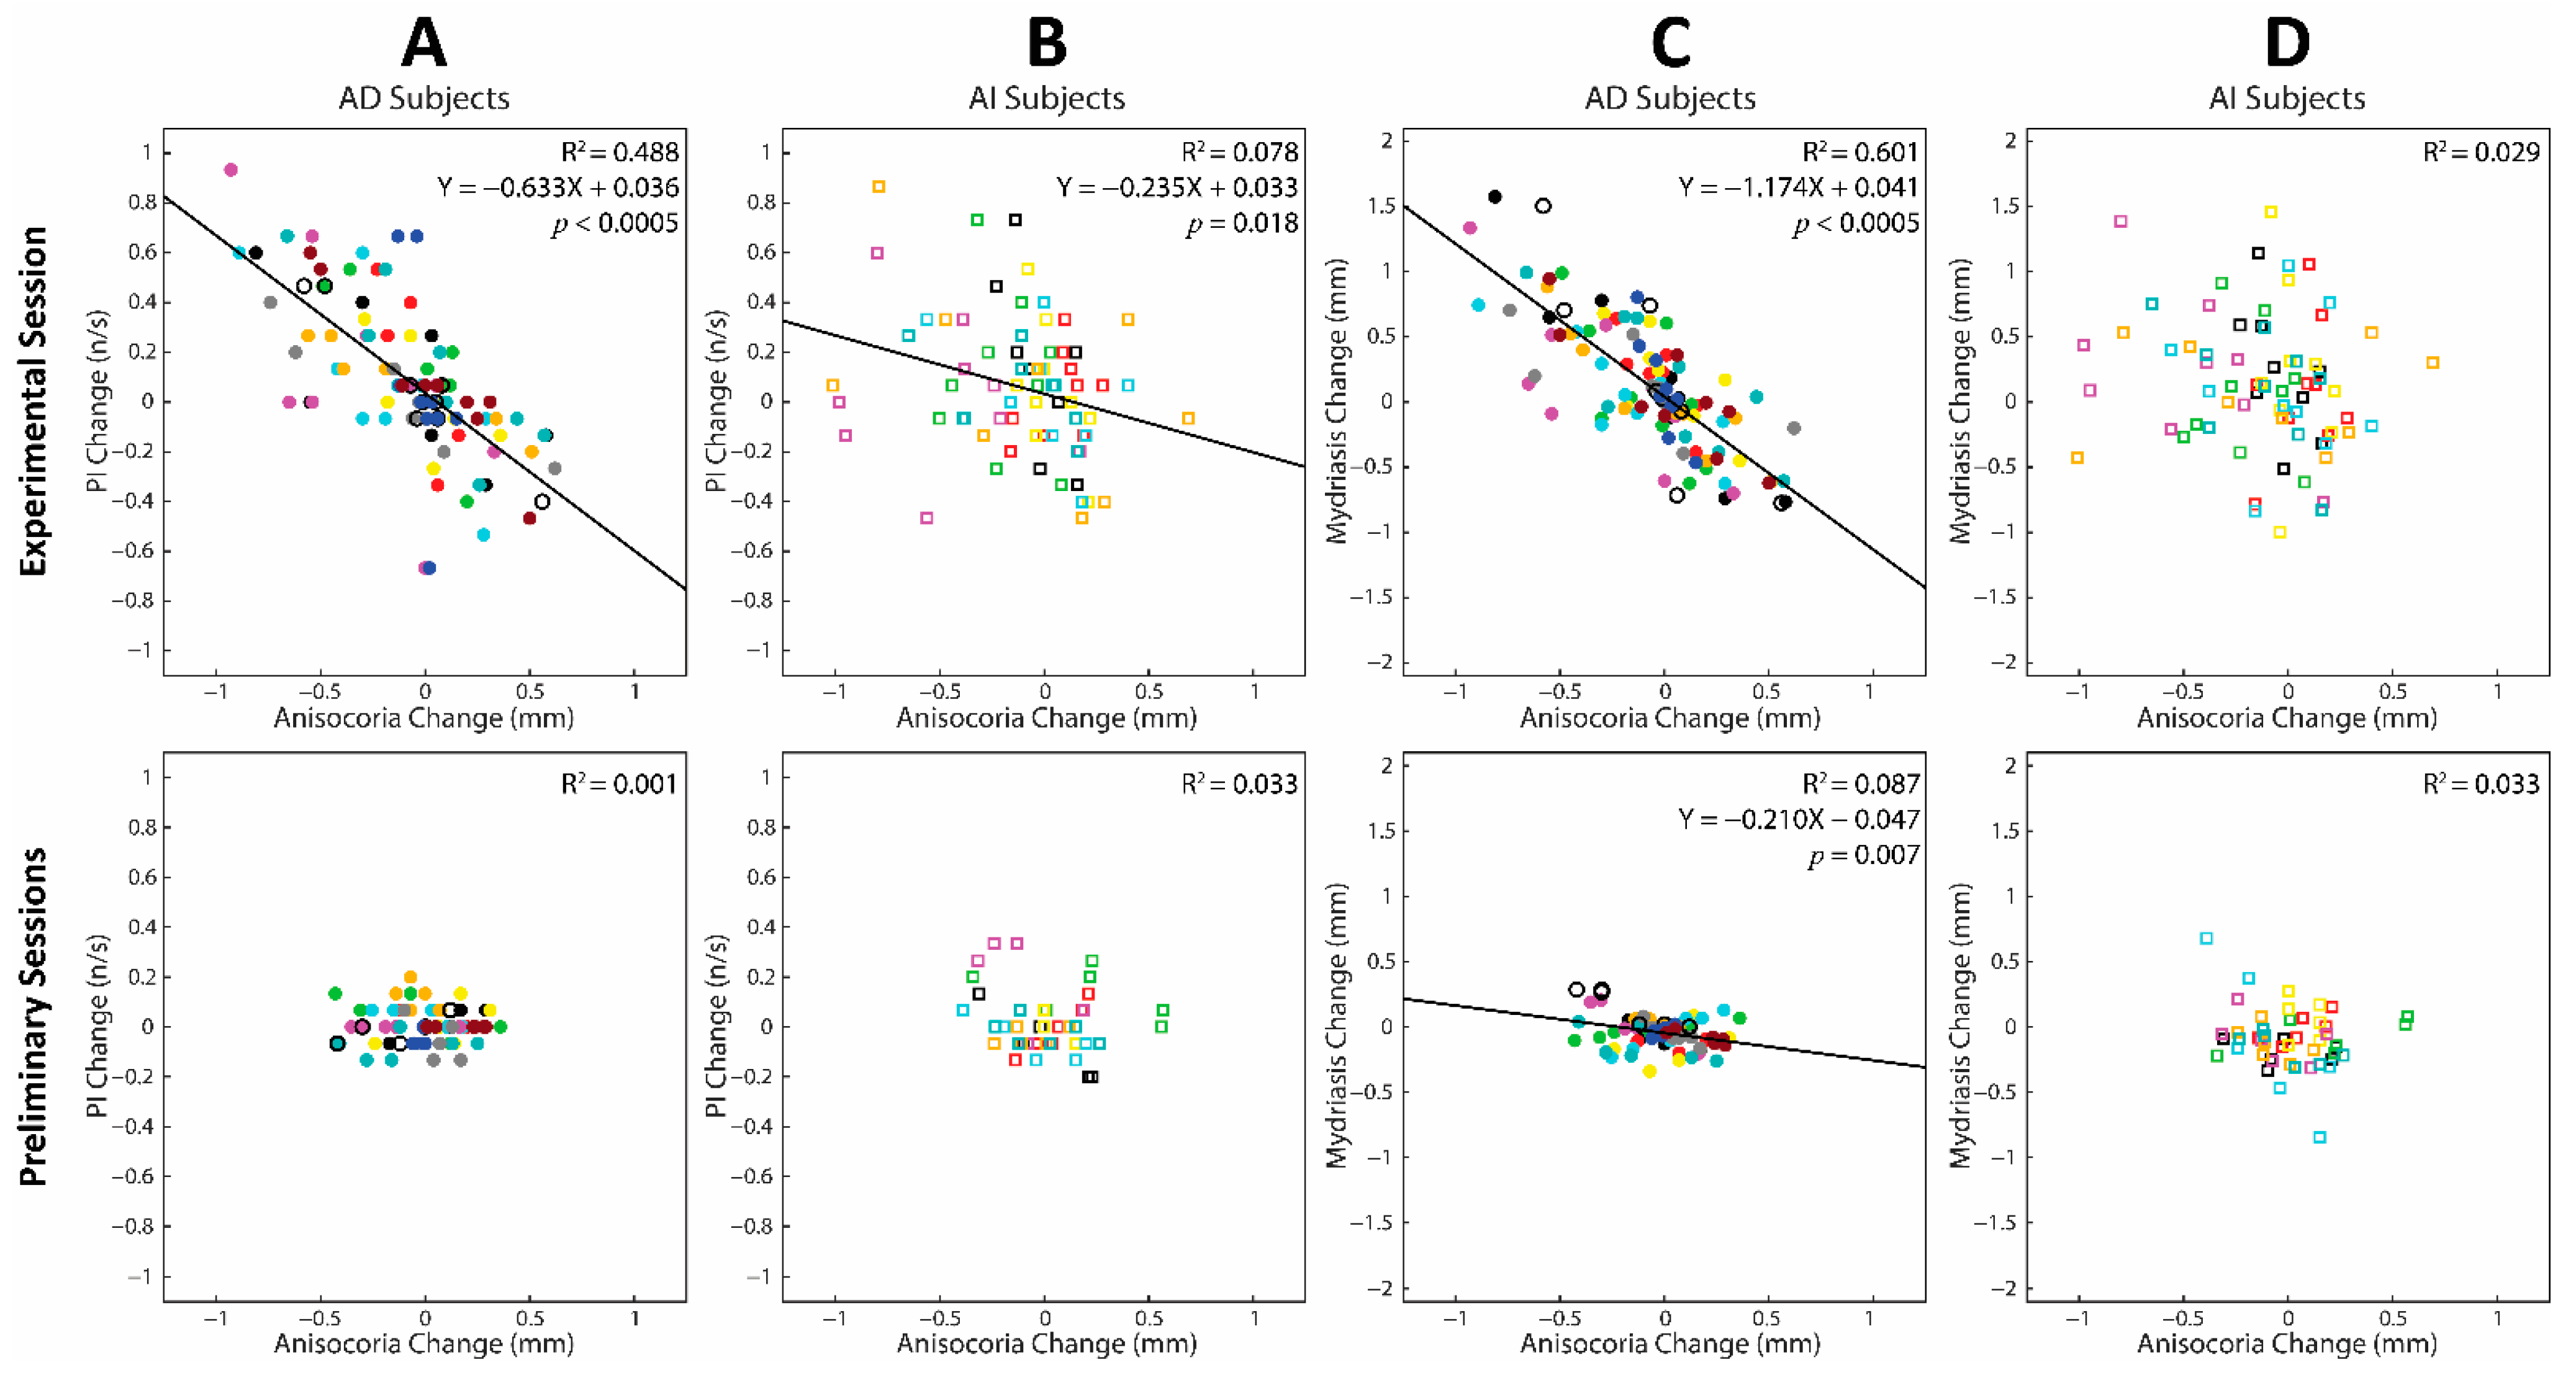
3.4. Correlations between Changes in Task-Related Parameters and Anisocoria Observed during the Experimental and Preliminary Sessions: Cumulative Regression Analysis

As shown in Figure 5, pooling data points of the different AD subjects confirmed the presence of significant, negative correlations between changes in PI and anisocoria during the experimental session (Figure 5A, upper row: R2 = 0.488, Y = −0.633X + 0.036, p < 0.0005). The same held true for SR (R2 = 0.324, Y = −2.354X − 0.097, p < 0.0005, data not shown) and mydriasis changes (Figure 5C, upper row: R2 = 0.601, Y = −1.174X + 0.041, p < 0.0005).
When the same cumulative analysis was applied to the preliminary sessions of AD subjects, no correlation with anisocoria changes could be found for PI (Figure 5A, lower row) and SR (data not shown) changes, while a significant, negative correlation was observed between mydriasis and anisocoria changes (Figure 5C, lower row; R2 = 0.087, Y = −0.210X − 0.047, p = 0.007).
Pooling experimental session data of different AI subjects revealed weak, negative correlations with anisocoria changes for both PI (Figure 5B, upper row: R2 = 0.078, Y = −0.235X + 0.033, p = 0.018) and SR (R2 = 0.065, Y = −0.870X − 0.096, p = 0.031, data not shown) changes, but not for mydriasis changes (Figure 5D, upper row).
When the same cumulative analysis was applied to the preliminary sessions of AI subjects, no significant correlation with anisocoria changes was observed for PI (Figure 5B, lower row), SR (data not shown), and mydriasis changes (Figure 5D, lower row).
The correlation between mydriasis and anisocoria changes observed in AD subjects (Figure 5C) was further investigated by distinguishing the mydriasis relative to the hypertonic and hypotonic side pupils. This analysis, displayed in Figure 6, revealed that changes in mydriasis at the hypertonic side were strongly correlated with anisocoria changes during the preliminary sessions (Figure 6A, lower row: R2 = 0.311, Y = −0.587X − 0.021, p < 0.0005), while this was not the case for the hypotonic side (Figure 6B, lower row: R2 = 0.030, p = 0.15).
As to the experimental session, the strength of correlation between mydriasis and anisocoria changes was higher at the hypertonic (Figure 6A, upper row: R2 = 0.727, Y = −1.513X + 0.025, p < 0.0005) than at the hypotonic (Figure 6B, upper row: R2 = 0.364, Y = −0.825X + 0.058, p < 0.0005) side (Z = 2.16, p = 0.030).

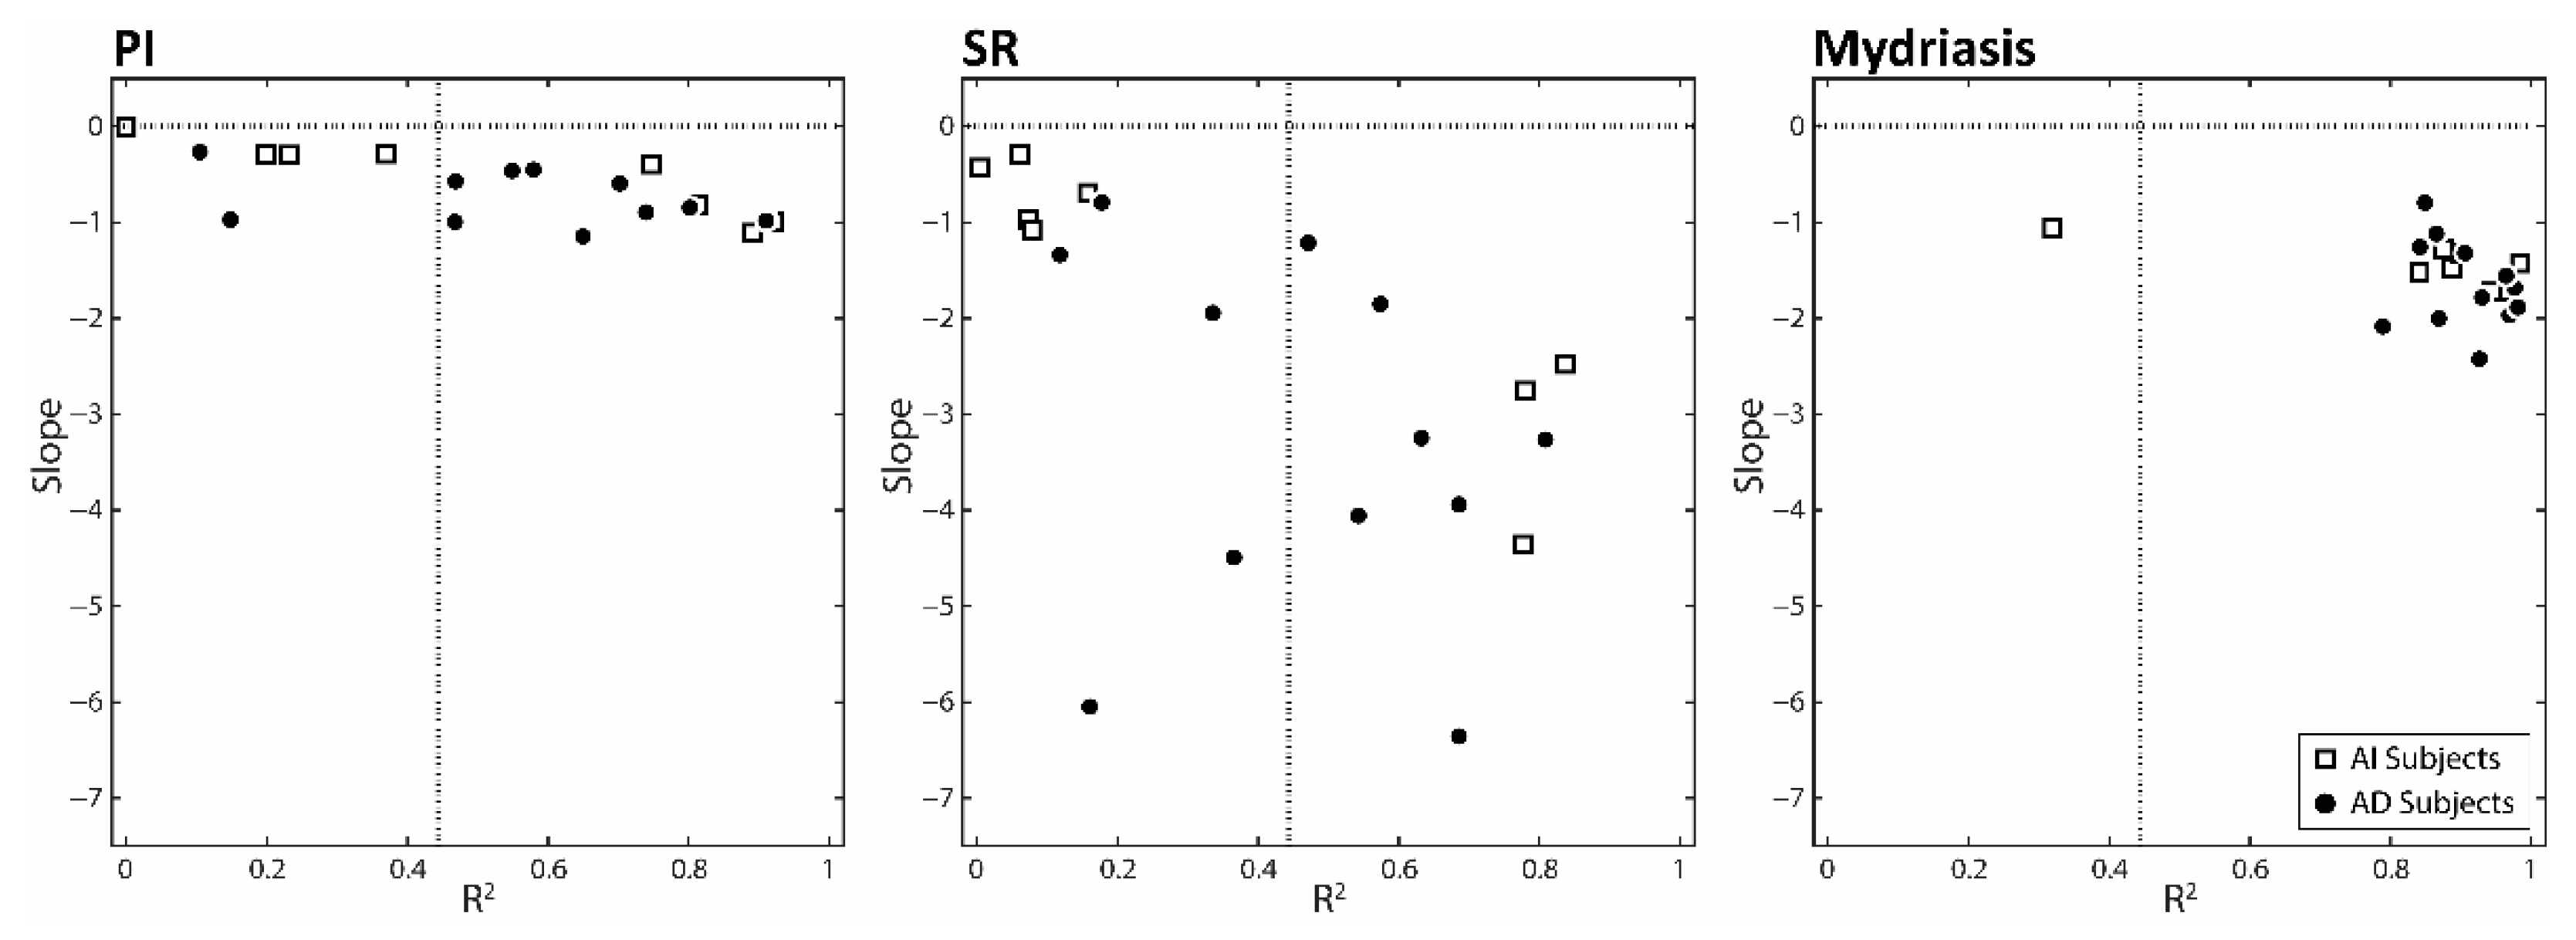
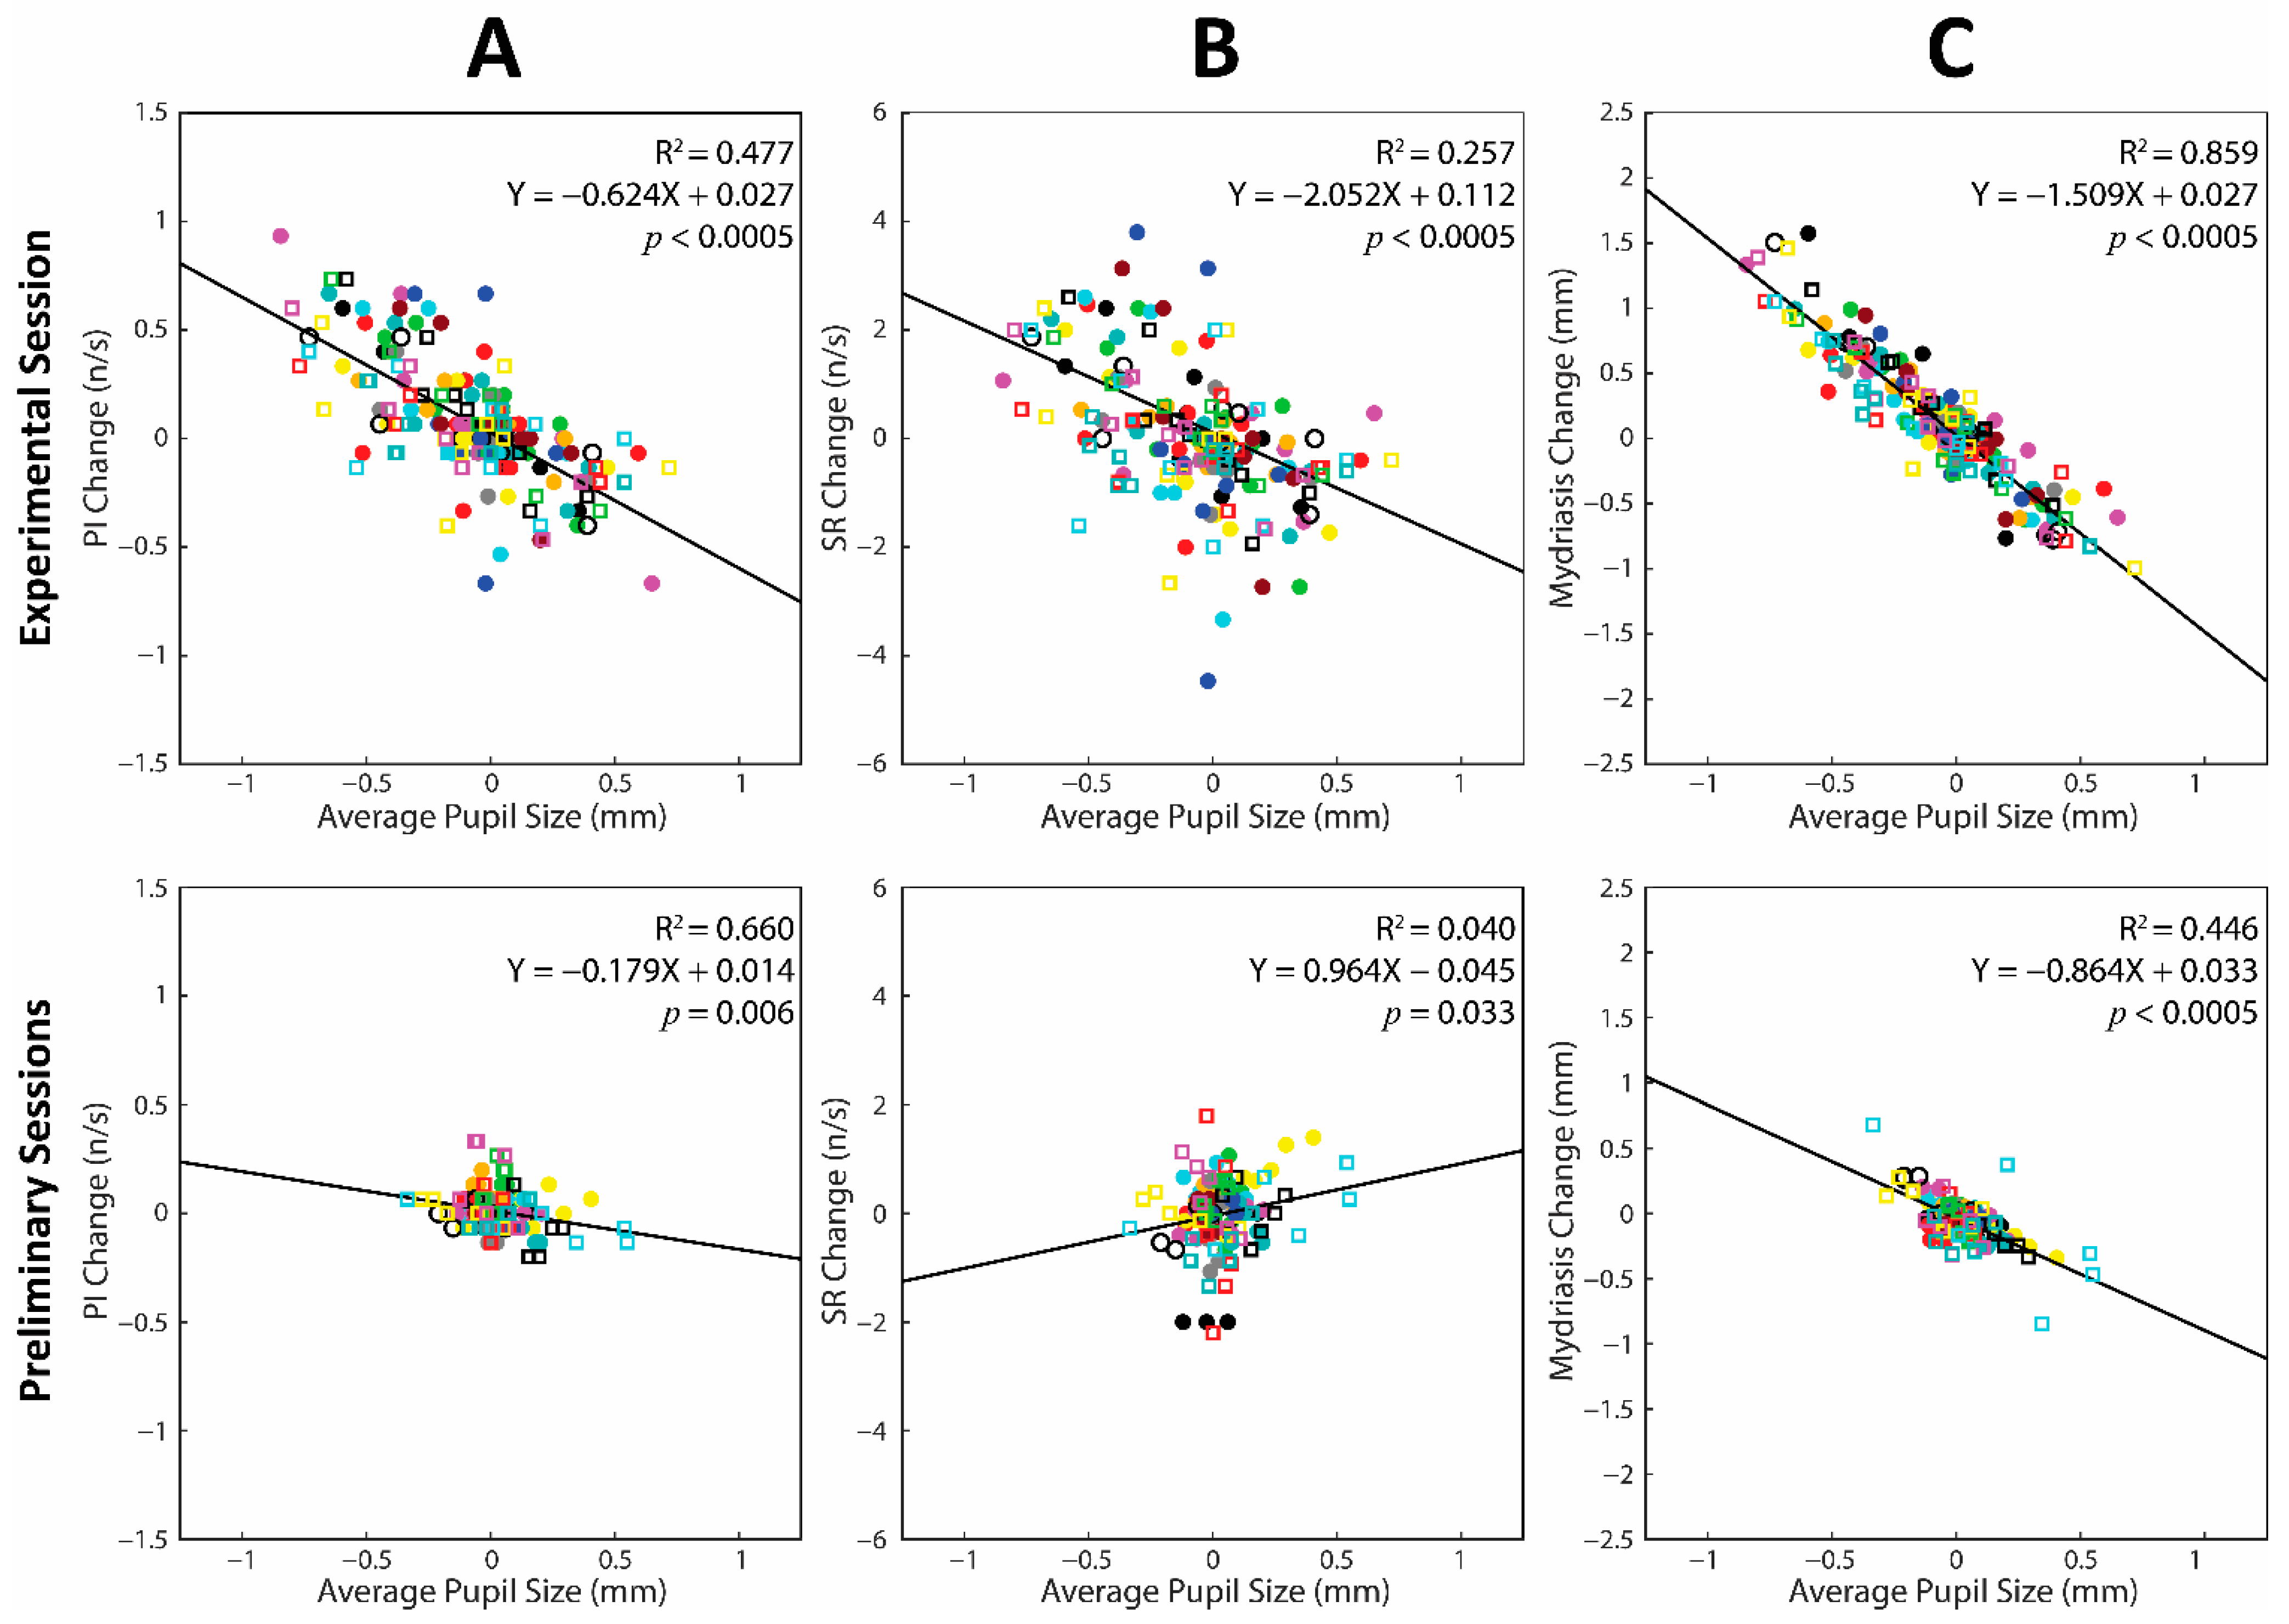
3.5. Relation between Changes in Task-Related Parameters and Average Pupil Size during the Experimental Session: Single Subject Analysis

As shown in Table 3, in 19/20 subjects at least one of the changes in task-related parameters was significantly correlated with the changes in the average pupil size at rest (pupil size-dependent subjects).
Figure 7 shows scatterplots of slopes and R2 values observed for regressions of changes in task-related parameters and pupil size. Slopes were in general negative, even when R2 values were well below significance (vertical dotted lines).
Moreover, the dependence of the changes in task-related parameters upon those in average pupil size was present in both AI and AD subjects. No major differences between these groups were observed in R2 and slopes values.

3.6. Changes in Average Pupil Size and Task-Related Parameters during the Experimental and the Preliminary Sessions: A Cumulative Regression Analysis

Pooling data from different subjects showed that the correlations between changes in task-related parameters and in average pupil size observed in the experimental session were present in both AI (PI: R2 = 0.336, Y = −0.490X + 0.014, p < 0.0005; SR: R2 = 0.179, Y = −1.451X − 0.135, p < 0.0005; mydriasis: R2 = 0.843, Y = −1.445X + 0.004, p < 0.0005) and AD subjects (PI: R2 = 0.511, Y = −0.725X + 0.041, p < 0.0005; SR: R2 = 0.299, Y = −2.540X − 0.069, p < 0.0005; mydriasis: R2 = 0.846, Y = −1.557X + 0.040, p < 0.0005).
When the cumulative analysis was applied to the 19 pupil-size dependent subjects, (see Table 3) significant correlations between changes in task-related parameters and in average pupil size was disclosed not only in the experimental (Figure 8, upper row), but also in the preliminary sessions (Figure 8, lower row), where mandible position and occlusal condition were kept constant. In this instance, the changes in task-related mydriasis and PI were negatively correlated with changes in pupil size, while only a loose positive correlation was observed for SR.
The changes in the average pupil size depend upon modifications on both the hypertonic and the hypotonic side: for this reason, the changes in task-related parameters were correlated with those in the size of both pupils. As shown in Table 4, in both AD and AI subjects, R2 values obtained for changes in pupil size at the hypertonic side were significantly higher than those at the hypotonic side for all the task-related parameters. At variance, differences in R2 values between AD and AI subjects did not reach the level of statistical significance.

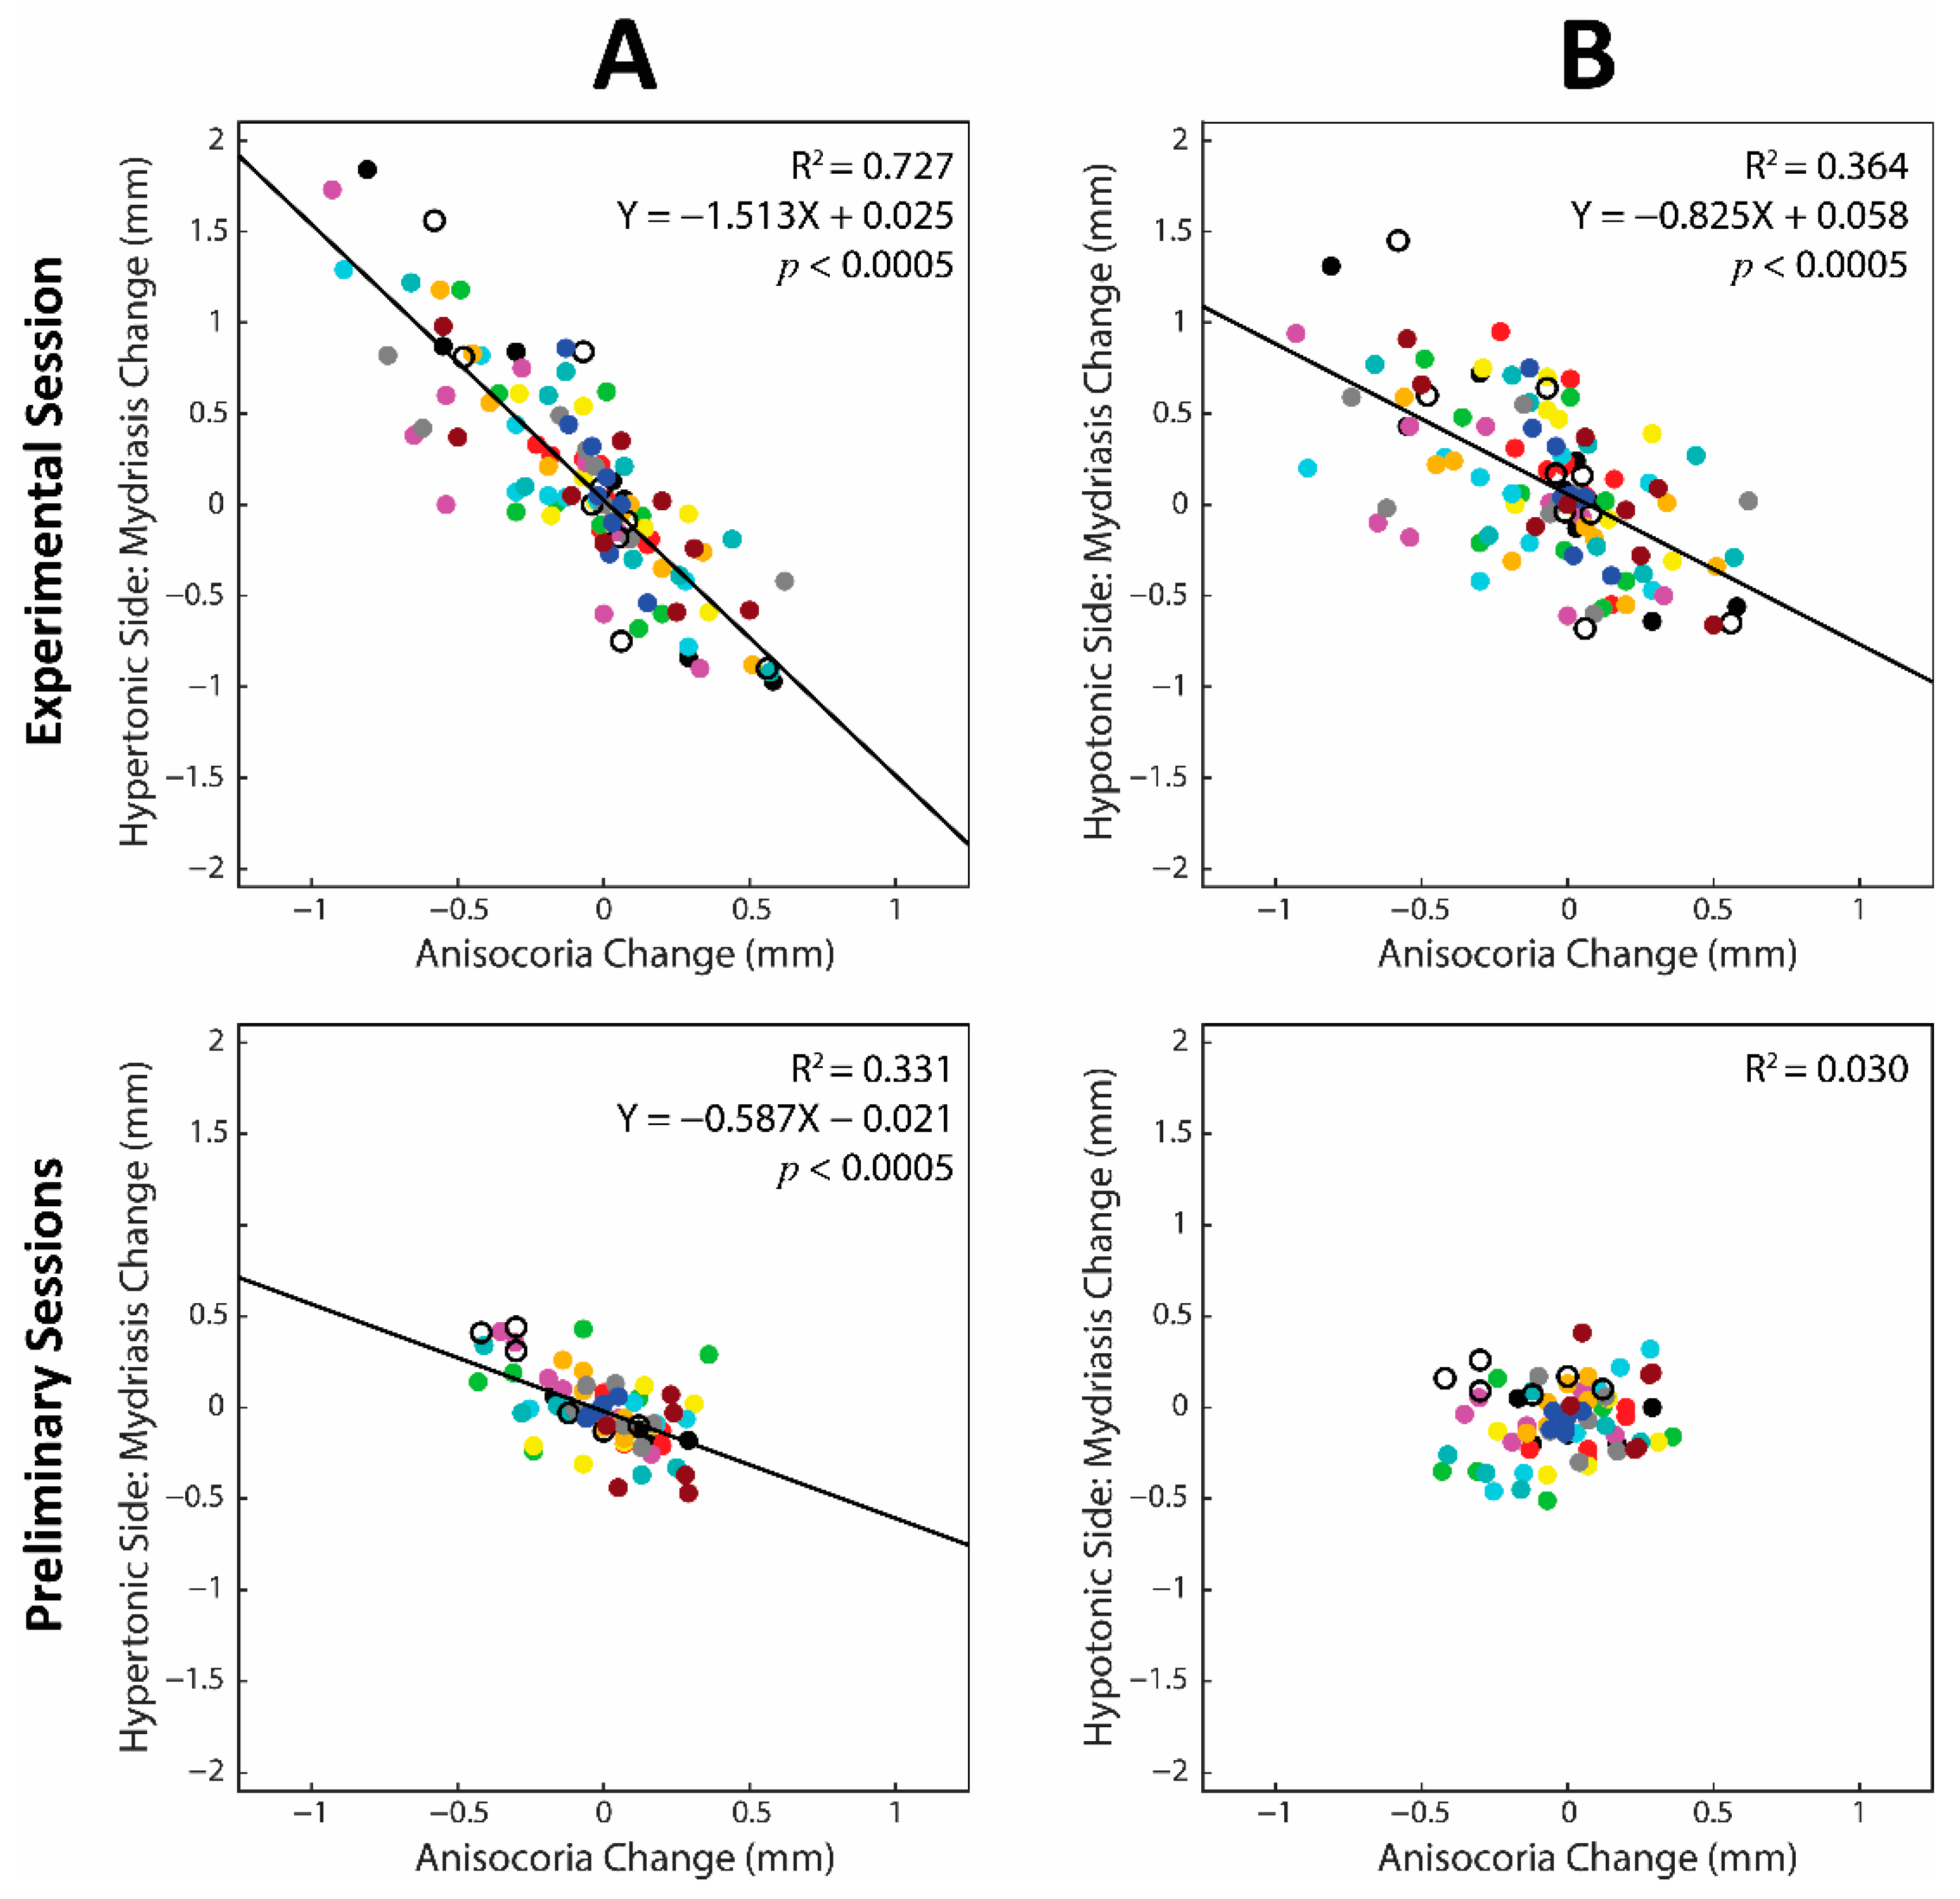
3.7. Contribution of the Hypertonic and Hypotonic Side to Changes in Anisocoria and Average Pupil Size

In the experimental session, anisocoria changes were strongly dependent upon pupil changes on the hypertonic side (R2 = 0.533, Y = 0.591X − 0.020, p < 0.0005), but not on the hypotonic one (R2 = 0.013, NS), while the changes in average pupil size were well correlated with those in the size of both pupils (hypertonic side: R2 = 0.867, Y = 0.705X + 0.010, p < 0.0005; hypotonic side: R2 = 0.718, Y = 0.933X − 0.044, p < 0.0005). It is of interest that the degree of change (irrespectively of the sign) in pupil size at the hypertonic side (0.32 ± 0.27) was significantly larger than the contralateral one (0.20 ± 0.19, p < 0.0005). At variance, in the preliminary sessions, there were no significant differences in pupil size changes at the hypertonic versus the hypotonic side.

4. Discussion

4.1. Effects of Imprint/Bite Wearing on EMG Asymmetry and Anisocoria

An asymmetric EMG activity during clenching corresponds to asymmetric levels of trigeminal motor and sensory activities. Periodontal receptors and spindle discharge is expected to be higher on the hypertonic side. As previously documented [10,11,12,13], the correction of EMG asymmetry by imprint/bite wearing (Figure 2) also reduces the associated anisocoria with the teeth in contact, but without occlusal effort (Table 2, compare Bite OFF and Bite ON Contact values). This observation suggests that the presence of a sensorimotor trigeminal asymmetry during clenching biases the circuits controlling pupil size at rest, inducing an asymmetry in LC discharge when masticatory muscles are not developing occlusal forces. It is likely, therefore, that imprint/bite wearing balances not only the force development during clenching, but also trigeminal sensory discharge at rest.

4.2. Correlation between Changes in Task-Related Parameters and Anisocoria

Several studies have documented that performance increases when subjects keep in their mouth, without occlusal effort, a bite splint able to reduce the trigeminal sensorimotor asymmetry during clenching [10,11,12,13]. The changes in trigeminal imbalance may modify performance-related parameters by affecting the balance of hemispheric activity. In fact, hemispheric imbalance induces major cognitive deficits [1], which are reduced by asymmetric cortical activation/deactivation [2,3]. The trigeminal imbalance is associated with anisocoria: since pupil size is a proxy of LC activity, it is likely that trigeminal imbalance elicits an asymmetric LC activity via the chemical and electrical coupling with the contiguous mesencephalic nucleus [39]. This may lead to an asymmetric cortical excitability and to a worsening of cognitive performance. According to this hypothesis, previous studies have shown that, at population level, trigeminal-induced changes in cognitive performance and task-related mydriasis are negatively correlated with the corresponding changes in anisocoria [12,13].
Present findings indicate that, at the individual level, these correlations are not always detectable, so that the sample can be divided in two groups: anisocoria dependent (12/20, AD subjects, see Figure 3 and Table 1) and anisocoria independent (8/20, AI subjects, see Table 1).
Within both groups, subjects could either be males or females, young or adult. They could show right or left masseter dominance during clenching, loss of 1–3 molars or compete dentures, TMJ disorders, or else be apparently normal at the objective stomatognathic evaluation. The only statistically significant difference observed between these groups was in masseter EMG asymmetry during clenching, mostly driven by a few AD subjects (n = 4) with a very large EMG asymmetry.
Moreover, task-related parameters of AI and AD subjects were similarly sensitive to changes in arches positions and occlusal conditions: in both groups, in fact, PI, SR, and mydriasis decreased when the arches were touching in Bite OFF condition, while increased when touching in Bite ON (see Table 2). The only difference between the groups was that AI subjects did not show any change in anisocoria when arches were touching in Bite OFF (see Table 2).
We may propose that, in the subjects showing very large (>60%) trigeminal asymmetries, the reduced performance is mainly attributable to an asymmetric LC discharge [36], while the LC contribution could be minor, if any, for subjects with mild trigeminal asymmetries.
In this respect, it must be pointed out that the trigeminal input may modify the activity of the reticular formation and other structures belonging to the ascending reticular activating system, whose relation to pupil size is less compelling. These neural networks may include the orexinergic [40] and the histaminergic hypothalamic neurons as well as the serotoninergic raphe and the cholinergic peduncolopontine/laterodorsal tegmental neurons [39]. Although in AI subjects the manipulations of the trigeminal input did not change anisocoria (when arches were touching in Bite OFF), the parallel increase in average pupil size indicated the presence of trigeminal influences on the LC activity.
This finding could be tentatively attributed to individual differences in the reciprocal influences exerted between the left and right LC complexes. To the best of our knowledge, these influences have not been investigated yet.
However, also in the AI group, when different subjects were pooled together, individual trends reinforced each other giving rise to weak, but significant correlations between changes in PI/SR and anisocoria (see Figure 5B, upper row). This observation suggests that the changes in LC discharge asymmetry may also affect cognitive performance in AI subjects, although to a minor extent compared to the AD subjects.
Strikingly, in AD subjects, the dependence of changes in task-related mydriasis on the hypertonic side upon those in anisocoria was observed not only when the trigeminal input was manipulated (experimental session, Figure 6A, upper row), but also when it did not vary (preliminary sessions, Figure 6A, lower row). This observation suggests that in these subjects, the spontaneous fluctuations in LC asymmetry and task-related mydriasis at the hypertonic side are coupled to each other.

4.3. Dependence of Changes in Task-Related Parameters upon Pupil Size Changes

All the investigated subjects but one showed a significant, negative correlation between the changes in at least one of the task-related parameters and those in average pupil size (see Table 3). This finding indicates that the average LC tonic activity (underlying average pupil size) affects cognitive performance more than its asymmetry (underlying anisocoria). A negative correlation between the changes in task-related parameters and average pupil size has already been described at a population level [41,42,43,44], although inverted U-shaped relations have also been observed [31,45]. However, considering the basal level of LC activity, both results are consistent with the “adaptive gain theory”. In particular, a negative correlation is expected when the LC activity is high. This might have occurred during pupil size measurements, as the subjects were forced to fixate on a light spot and the head was restrained by the pupilometer.
It must be pointed out that, at the single subject level, the influences of anisocoria and average pupil size on task-related parameters were independent of each other (compare Table 1 and Table 3), thus indicating that the relative effects of tonic LC activity and of its imbalance on performance varies among subjects.
At the population level, the dependence of changes in task-related parameters on average pupil size was present not only when the trigeminal input was modified, but also during the preliminary sessions, where the spontaneous fluctuations of pupil size and performance were observed with constant arches position and occlusal condition (Figure 8, lower row). In this instance, however, the negative correlation was maintained for mydriasis and PI, but not for SR, which showed a weak positive correlation. These data suggest that spontaneous fluctuations in tonic LC activity exert opposite effects on quality and speed of neural integration.
Finally, in the experimental session, changes in task-related parameters showed a stronger correlation with changes in pupil size at the hypertonic side rather than at the hypotonic one (see Table 4). This finding can be explained by taking into account that performance and task-related mydriasis depend upon the resting levels of average tonic LC activity [31] and, likely, of its asymmetry [12,13]. The hypertonic side pupil changes were strongly associated with both average pupil size and anisocoria, proxies of the average level of LC activity and of its asymmetry, respectively. At variance, pupil changes at the hypotonic side were significantly correlated only to average pupil size.

5. Conclusions

In conclusion, we propose the following model: occlusal influences on cognitive performance imply changes in hemispheric excitability via LC activity modulation. The LC activity modulation can be achieved by modifying (a) its average tonic activity and/or (b) its imbalance between sides. In virtually all subjects, tonic LC activity modulation (described by changes in average pupil size) was coupled to performance, while only about half of the subjects showed a coupling between LC imbalance (anisocoria) and performance. In the remaining subjects, the trigeminal-induced asymmetries in cortical excitability possibly also depend on structures other than the LC. The excitability of the LC on the hypertonic side, which influences both average tonic LC activity and LC imbalance, is the best readout of cognitive performance and task-related mydriasis. Finally, it has to be reminded that animal studies have shown that teeth removal may induce degenerative phenomena in the brain [39]. In this respect, occlusal correction could be exploited for rehabilitative and therapeutic purposes.

Author Contributions

Conceptualization, D.M. and V.D.C.; Methodology, V.D.C. and E.C.; Software, M.P.T.F.; Validation, M.P.T.F. and D.M.; Formal analysis, F.S., O.M., M.P.T.F. and D.M.; Investigation, V.D.C. and D.D.C.; Resources, V.D.C.; Data curation, M.B., F.S., O.M., M.P.T.F. and D.M.; Writing—original draft preparation, F.S., O.M., M.P.T.F. and D.M; Writing—review and editing, F.S., O.M., M.P.T.F., M.B., P.d., U.F. and D.M.; Visualization, F.S., O.M., M.P.T.F. and D.M.; Supervision, M.P.T.F., U.F. and D.M.; Project administration, P.d., L.B., D.M. and V.D.C.; Funding acquisition, L.B. and U.F. All authors have read and agreed to the published version of the manuscript.

Funding

This research was funded by the University of Pisa (Ateneo 2019 to U.F.) and by the Italian Ministry of Health (GRANT 2011-02348998 to U.F.).

Institutional Review Board Statement

The study was conducted according to the guidelines of the Declaration of Helsinki and approved by the Ethics Committee of the Pisa University (protocol code 12-2019, date of approval 3 May 2019).

Informed Consent Statement

Informed consent was obtained from all subjects involved in the study.

Data Availability Statement

Data are available at: https://osf.io/mnx4c/ from 28/6/2021. (accessed on 10 September 2021).

Acknowledgments

We thank Paolo Orsini, Francesco Montanari, and Cristina Pucci for their valuable technical assistance.

Conflicts of Interest

The authors declare no conflict of interest. The funders had no role in the design of the study; in the collection, analyses, or interpretation of data; in the writing of the manuscript, or in the decision to publish the results.

References

  1. Lomber, S.G.; Payne, B.R. Removal of two halves restores the whole: Reversal of visual hemineglect during bilateral cortical or collicular inactivation in the cat. Vis. Neurosci. 1996, 13, 1143–1156. [Google Scholar] [CrossRef]
  2. Koch, G.; Bonni, S.; Giacobbe, V.; Bucchi, G.; Basile, B.; Lupo, F.; Versace, V.; Bozzali, M.; Caltagirone, C. Theta-burst stimulation of the left hemisphere accelerates recovery of hemispatial neglect. Neurology 2012, 78, 24–30. [Google Scholar] [CrossRef]
  3. Andres, M.; Masson, N.; Larigaldie, N.; Bonato, M.; Vandermeeren, Y.; Dormal, V. Transcranial electric stimulation optimizes the balance of visual attention across space. Clin. Neurophysiol. 2020, 131, 912–920. [Google Scholar] [CrossRef]
  4. Kerkhoff, G. Spatial hemineglect in humans. Prog. Neurobiol. 2001, 63, 1–27. [Google Scholar] [CrossRef]
  5. Wackym, P.A.; Balaban, C.D.; Mackay, H.T.; Wood, S.J.; Lundell, C.J.; Carter, D.M.; Siker, D.A. Longitudinal Cognitive and Neurobehavioral Functional Outcomes Before and After Repairing Otic Capsule Dehiscence. Otol. Neurotol. 2016, 37, 70–82. [Google Scholar] [CrossRef] [PubMed] [Green Version]
  6. Ayar, D.A.; Kumral, E.; Celebisoy, N. Cognitive functions in acute unilateral vestibular loss. J. Neurol. 2020, 267, 153–159. [Google Scholar] [CrossRef]
  7. Cho, M.-J.; Shin, H.-E.; Amano, A.; Song, K.-B.; Choi, Y.-H. Effect of Molar Occlusal Balance on Cognitive Function in the Elderly. Int. Dent. J. 2021. [Google Scholar] [CrossRef] [PubMed]
  8. Saikia, U.P.; Chander, N.G.; Balasubramanian, M. Effect of fixed dental prosthesis on the brain functions of partially edentulous patients—Pilot study with power spectrum density analysis. Eur. Oral Res. 2020, 54, 114–118. [Google Scholar] [CrossRef] [PubMed]
  9. Jiang, Q.-S.; Liang, Z.-L.; Wu, M.-J.; Feng, L.; Liu, L.-L.; Zhang, J.-J. Reduced brain-derived neurotrophic factor expression in cortex and hippocampus involved in the learning and memory deficit in molarless SAMP8 mice. Chin. Med. J. 2011, 124, 1540–1544. [Google Scholar]
  10. De Cicco, V.; Cataldo, E.; Barresi, M.; Parisi, V.; Manzoni, D. Sensorimotor trigeminal unbalance modulates pupil size. Arch. Ital. Biol. 2014, 152, 1–12. [Google Scholar] [PubMed]
  11. De Cicco, V.; Barresi, M.; Tramonti Fantozzi, M.P.; Cataldo, E.; Parisi, V.; Manzoni, D. Oral Implant-Prostheses: New Teeth for a Brighter Brain. PLoS ONE 2016, 11, e0148715. [Google Scholar] [CrossRef] [Green Version]
  12. Tramonti Fantozzi, M.P.; De Cicco, V.; Argento, S.; De Cicco, D.; Barresi, M.; Cataldo, E.; Bruschini, L.; D’Ascanio, P.; Faraguna, U.; Manzoni, D. Trigeminal input, pupil size and cognitive performance: From oral to brain matter. Brain Res. 2021, 1751, 147194. [Google Scholar] [CrossRef] [PubMed]
  13. Tramonti Fantozzi, M.P.; Lazzarini, G.; De Cicco, V.; Briganti, A.; Argento, S.; De Cicco, D.; Barresi, M.; Cataldo, E.; Bruschini, L.; D’Ascanio, P.; et al. The path from trigeminal asymmetry to cognitive impairment: A behavioral and molecular study. Sci. Rep. 2021, 11, 1–17. [Google Scholar] [CrossRef]
  14. Silvetti, M.; Seurinck, R.; Van Bochove, M.E.; Verguts, T. The influence of the noradrenergic system on optimal control of neural plasticity. Front. Behav. Neurosci. 2013, 7, 160. [Google Scholar] [CrossRef] [PubMed] [Green Version]
  15. Hoffing, R.C.; Seitz, A.R. Pupillometry as a Glimpse into the Neurochemical Basis of Human Memory Encoding. J. Cogn. Neurosci. 2015, 27, 765–774. [Google Scholar] [CrossRef] [Green Version]
  16. Kihara, K.; Takeuchi, T.; Yoshimoto, S.; Kondo, H.M.; Kawahara, J.I. Pupillometric evidence for the locus coeruleus-noradrenaline system facilitating attentional processing of action-triggered visual stimuli. Front. Psychol. 2015, 6, 827. [Google Scholar] [CrossRef] [Green Version]
  17. Joshi, S.; Li, Y.; Kalwani, R.M.; Gold, J.I. Relationships between Pupil Diameter and Neuronal Activity in the Locus Coeruleus, Colliculi, and Cingulate Cortex. Neuron 2016, 89, 221–234. [Google Scholar] [CrossRef] [Green Version]
  18. Reimer, J.; McGinley, M.J.; Liu, Y.; Rodenkirch, C.; Wang, Q.; McCormick, D.A.; Tolias, A.S. Pupil fluctuations track rapid changes in adrenergic and cholinergic activity in cortex. Nat. Commun. 2016, 7, 13289. [Google Scholar] [CrossRef]
  19. Einhäuser, W. The Pupil as Marker of Cognitive Processes. In Computational and Cognitive Neuroscience of Vision; Zhao, Q., Ed.; Cognitive Science and Technology; Springer: Singapore, 2017; pp. 141–169. ISBN 978-981-10-0213-7. [Google Scholar]
  20. Cedarbaum, J.M.; Aghajanian, G.K. Afferent projections to the rat locus coeruleus as determined by a retrograde tracing technique. J. Comp. Neurol. 1978, 178, 1–15. [Google Scholar] [CrossRef] [PubMed]
  21. Luo, P.F.; Wang, B.R.; Peng, Z.Z.; Li, J.S. Morphological characteristics and terminating patterns of masseteric neurons of the mesencephalic trigeminal nucleus in the rat: An intracellular horseradish peroxidase labeling study. J. Comp. Neurol. 1991, 303, 286–299. [Google Scholar] [CrossRef]
  22. Craig, A.D. Spinal and trigeminal lamina I input to the locus coeruleus anterogradely labeled with Phaseolus vulgaris leucoagglutinin (PHA-L) in the cat and the monkey. Brain Res. 1992, 584, 325–328. [Google Scholar] [CrossRef]
  23. Zerari-Mailly, F.; Buisseret, P.; Buisseret-Delmas, C.; Nosjean, A. Trigemino-solitarii-facial pathway in rats. J. Comp. Neurol. 2005, 487, 176–189. [Google Scholar] [CrossRef]
  24. Couto, L.B.; Moroni, C.R.; dos Reis Ferreira, C.M.; Elias-Filho, D.H.; Parada, C.A.; Pelá, I.R.; Coimbra, N.C. Descriptive and functional neuroanatomy of locus coeruleus-noradrenaline-containing neurons involvement in bradykinin-induced antinociception on principal sensory trigeminal nucleus. J. Chem. Neuroanat. 2006, 32, 28–45. [Google Scholar] [CrossRef] [PubMed]
  25. Dauvergne, C.; Smit, A.E.; Valla, J.; Diagne, M.; Buisseret-Delmas, C.; Buisseret, P.; Pinganaud, G.; VanderWerf, F. Are locus coeruleus neurons involved in blinking? Neurosci. Res. 2008, 61, 182–191. [Google Scholar] [CrossRef]
  26. Fujita, K.; Matsuo, K.; Yuzuriha, S.; Kawagishi, K.; Moriizumi, T. Cell bodies of the trigeminal proprioceptive neurons that transmit reflex contraction of the levator muscle are located in the mesencephalic trigeminal nucleus in rats. J. Plast. Surg. Hand Surg. 2012, 46, 383–388. [Google Scholar] [CrossRef] [PubMed]
  27. Matsuo, K.; Ban, R.; Hama, Y.; Yuzuriha, S. Eyelid Opening with Trigeminal Proprioceptive Activation Regulates a Brainstem Arousal Mechanism. PLoS ONE 2015, 10, e0134659. [Google Scholar] [CrossRef]
  28. Schwarz, L.A.; Luo, L. Organization of the Locus Coeruleus-Norepinephrine System. Curr. Biol. 2015, 25, R1051–R1056. [Google Scholar] [CrossRef] [Green Version]
  29. Mercante, B.; Enrico, P.; Floris, G.; Quartu, M.; Boi, M.; Serra, M.P.; Follesa, P.; Deriu, F. Trigeminal nerve stimulation induces Fos immunoreactivity in selected brain regions, increases hippocampal cell proliferation and reduces seizure severity in rats. Neuroscience 2017, 361, 69–80. [Google Scholar] [CrossRef]
  30. Berridge, C.W.; Waterhouse, B.D. The locus coeruleus–noradrenergic system: Modulation of behavioral state and state-dependent cognitive processes. Brain Res. Rev. 2003, 42, 33–84. [Google Scholar] [CrossRef]
  31. Aston-Jones, G.; Cohen, J.D. An Integrative Theory of Locus Coeruleus-Norepinephrine Function: Adaptive Gain and Optimal Performance. Annu. Rev. Neurosci. 2005, 28, 403–450. [Google Scholar] [CrossRef] [Green Version]
  32. Spinnler, H.; Tognoni, G.; The Italian Group on the Neuropsychological Study of Aging. Italian standardization and classification of Neuropsychological tests. Ital. J. Neurol. Sci. 1987, 6 (Suppl. S8), 1–120. [Google Scholar]
  33. Nnoaham, K.E.; Kumbang, J. Transcutaneous electrical nerve stimulation (TENS) for chronic pain. Cochrane Database Syst. Rev. 2008, CD003222. [Google Scholar] [CrossRef] [Green Version]
  34. Dao, T.T.; Lavigne, G.J.; Charbonneau, A.; Feine, J.S.; Lund, J.P. The efficacy of oral splints in the treatment of myofascial pain of the jaw muscles: A controlled clinical trial. Pain 1994, 56, 85–94. [Google Scholar] [CrossRef]
  35. Steiger, J.H. Tests for comparing elements of a correlation matrix. Psychol. Bull. 1980, 87, 245–251. [Google Scholar] [CrossRef]
  36. Lenhard, W.; Lenhard, A. Testing the Significance of Correlations; ResearchGate: Belin, Germany, 2014. [Google Scholar]
  37. Cohen, J.; Cohen, P. Applied Multiple Regression/Correlation Analysis for the Behavioral Sciences, 3rd ed.; Lawrence Erlbaum Associates: Mahwah, NJ, USA, 2003. [Google Scholar]
  38. Soper, D.S. Significance of the Difference between Two Slopes References—Analytics Calculators. Available online: https://www.analyticscalculators.com/references.aspx?id=103 (accessed on 31 March 2021).
  39. De Cicco, V.; Tramonti Fantozzi, M.P.; Cataldo, E.; Barresi, M.; Bruschini, L.; Faraguna, U.; Manzoni, D. Trigeminal, Visceral and Vestibular Inputs May Improve Cognitive Functions by Acting through the Locus Coeruleus and the Ascending Reticular Activating System: A New Hypothesis. Front. Neuroanat. 2018, 11, 130. [Google Scholar] [CrossRef]
  40. Zheng, Y.; Wu, S.; Yang, Q.; Xu, Z.; Zhang, S.; Fan, S.; Liu, C.; Li, X.; Ma, C. Trigeminal nerve electrical stimulation: An effective arousal treatment for loss of consciousness. Brain Res. Bull. 2021, 169, 81–93. [Google Scholar] [CrossRef]
  41. Gilzenrat, M.S.; Nieuwenhuis, S.; Jepma, M.; Cohen, J.D. Pupil diameter tracks changes in control state predicted by the adaptive gain theory of locus coeruleus function. Cogn. Affect. Behav. Neurosci. 2010, 10, 252–269. [Google Scholar] [CrossRef]
  42. Murphy, P.R.; Robertson, I.H.; Balsters, J.H.; O’Connell, R.G. Pupillometry and P3 index the locus coeruleus-noradrenergic arousal function in humans. Psychophysiology 2011, 48, 1532–1543. [Google Scholar] [CrossRef] [PubMed]
  43. Kucewicz, M.T.; Dolezal, J.; Kremen, V.; Berry, B.M.; Miller, L.R.; Magee, A.L.; Fabian, V.; Worrell, G.A. Pupil size reflects successful encoding and recall of memory in humans. Sci. Rep. 2018, 8, 4949. [Google Scholar] [CrossRef]
  44. Oliva, M. Pupil size and search performance in low and high perceptual load. Cogn. Affect. Behav. Neurosci. 2019, 19, 366–376. [Google Scholar] [CrossRef] [Green Version]
  45. Van den Brink, R.L.V.; Murphy, P.R.; Nieuwenhuis, S. Pupil Diameter Tracks Lapses of Attention. PLoS ONE 2016, 11, e0165274. [Google Scholar] [CrossRef]
Figure 1. Methods. (A) Tangram puzzle utilized for performing the haptic task. The subject had to reposition the parallelogram-shaped piece within the frame, in the absence of visual control. (B) Numerical matrices utilized for the Spinnler–Tognoni test. The subject had to sequentially scan each line ticking the target number(s) indicated above each matrix. (C) Flowchart of the preliminary sessions. Evaluation of the EMG asymmetry during clenching, pupil size measurements, and numerical matrices test performance occurred as described in the text. Open and Contact positions refer to the dental arches. (D) Stimulation session included an initial period of bilateral trigeminal stimulation that allowed to position the dental arches in the myocentric occlusion. This arches position was captured by a dental impression (imprint) and followed by an EMG evaluation during clenching with the imprint in the mouth. (E) Flowchart of the final experimental session. The boxes indicate the measurements taken for each mandibular position (Open1, Contact, Open2) and occlusal condition (Bite ON, Bite OFF). See text for further explanations.
Symmetry 13 01676 g001
Figure 2. Modifications in the EMG asymmetry observed during clenching with (imprint ON) and without (imprint OFF) an imprint in the mouth that allowed the subjects to achieve the myocentric occlusion. The error bars represent SD.
Symmetry 13 01676 g002
Figure 3. Correlation between changes in task-related parameters and anisocoria: a representative example. The changes in task-related parameters elicited by modifying mandible position and occlusal condition in an anisocoria dependent (AD) subject were plotted as a function of the corresponding anisocoria modifications. Anisocoria is defined as a difference between the pupil size on the hypertonic and that on the hypotonic side. (A) Changes in PI; (B) changes in SR; (C) changes in task-related mydriasis. The continuous lines are the regression lines of the plotted points, whose equations are illustrated for each graph.
Symmetry 13 01676 g003
Figure 4. Scatterplots of slopes and R2 coefficients of the regression between changes in task-related parameters and anisocoria. PI: performance index. SR: scanning rate. Mydriasis: task-related mydriasis, average of both pupils. In all panels, the vertical dotted lines indicate the R2 value corresponding to p = 0.05. White squares: AI subjects; black circles: AD.
Symmetry 13 01676 g004
Figure 5. Trigeminal-elicited and spontaneous fluctuations in task-related parameters and anisocoria within the populations of AD and AI subjects. Labels A, B, C and D identify both upper and lower subfigures of the corresponding column. Columns A, C and B, D refer to AD and AI subjects, respectively. Upper row: scatterplots of the changes in PI (A,B) and mydriasis (C,D) as a function of anisocoria changes observed when modifying mandibular and occlusal conditions (experimental session). Lower row: correlations in the spontaneous fluctuations of the same variables observed under constant mandibular and occlusal conditions (Open, Bite OFF, preliminary sessions). Different subjects are represented by circles (AD) or squares (AI) of different colors. Continuous lines represent the regression lines relative to all the plotted points.
Symmetry 13 01676 g005
Figure 6. Correlations between changes in mydriasis and anisocoria for both hypertonic and hypotonic side in AD subjects only. Labels A and B identify both upper and lower subfigures of the corresponding column. The changes in mydriasis on the hypertonic (A) and hypotonic (B) side are plotted as a function of the corresponding changes in anisocoria. Upper row and lower row panels display data obtained during the experimental and the preliminary sessions, respectively. Continuous lines represent the regression lines relative to all the plotted points. Different subjects are represented by circles of different colors.
Symmetry 13 01676 g006
Figure 7. Slopes and R2 coefficients of the regression between changes in task-related parameters and in average pupil size. PI: performance index. SR: scanning rate. Mydriasis: task-related mydriasis, average of both pupils. In all the panels, dots and squares refer to AD and AI subjects, respectively, while the vertical dotted lines indicate the R2 value (0.444) corresponding to significance (p = 0.05).
Symmetry 13 01676 g007
Figure 8. Relation between changes in task-related parameters and average pupil size in the experimental and preliminary sessions. Labels A, B and C identify both upper and lower subfigures of the corresponding column. (A) PI, (B) SR, (C) mydriasis. Upper row: experimental session. Lower row: preliminary sessions. In each graph, circles and squares refer to AD and AI subjects, respectively, individual subjects being represented by a color code. The continuous line represents the regression line for all the plotted points.
Symmetry 13 01676 g008
Table 1. Values of R2 and p relative to the correlation of the changes in performance index (PI), scanning rate (SR), and task-related mydriasis with respect to the changes in anisocoria at rest. Average and SD values have been given for anisocoria dependent (AD) and anisocoria independent (AI) subjects separately, as well as for the whole sample. p values < 0.05 are highlighted in gray.
GroupID
Subject
PI
(p)
SR
(p)
Mydriasis
(p)
PI
(R2)
SR
(R2)
Mydriasis
(R2)
Average
(R2)
AD
Subjects
120.0010.0050.005 0.9360.9470.8610.915
180.0010.0050.002 0.9420.9340.7650.880
200.0010.0050.002 0.9110.8780.7750.855
170.0010.0050.023 0.8630.9350.5460.781
150.0040.0110.009 0.7190.6270.6510.666
90.0160.0110.004 0.5870.6280.7240.646
30.0050.0280.005 0.6930.5210.7050.639
20.0270.2130.005 0.5270.2110.9190.552
110.0390.1130.009 0.4780.3190.6430.480
80.0530.0430.039 0.4370.4660.4780.460
40.0470.0900.028 0.4520.3560.5220.443
190.1520.2030.001 0.2700.2190.8310.440
Mean ± SD0.651 ± 0.2270.587 ± 0.2830.702 ± 0.1390.647 ± 0.177
AI
Subjects
10.1180.0740.107 0.3120.3870.3280.342
70.1050.0670.598 0.3310.4020.0420.259
160.2720.6990.12 0.1690.0230.3100.167
140.1830.2340.822 0.2380.1950.0080.147
130.6210.6020.127 0.0370.0410.3000.126
50.2190.5560.394 0.2060.0520.1060.121
100.2880.5420.888 0.1590.0560.0030.073
60.6630.9060.899 0.0290.0020.0020.011
Mean ± SD0.185 ± 0.1120.145 ± 0.1650.137 ± 0.1490.156 ± 0.104
AD + AI Subjects Mean ± SD0.465 ± 0.2990.410 ± 0.3250.476 ± 0.3160.450 ± 0.288
Table 2. Average ± SD values obtained for pupil size/anisocoria at rest and task-related parameters in the different arches positions and occlusal conditions in both AI and AD subjects.
AD SubjectsAI Subjects
BITE OFFBITE ONBITE OFFBITE ON
Open1Open1 vs. ContactContactOpen1Open1 vs. ContactContactOpen1Open1 vs. ContactContactOpen1Open1 vs. ContactContact
Average
Pupil Size
3.97 ± 0.70p < 0.00054.32 ± 0.674.01 ± 0.72p < 0.00053.79 ± 0.654.18 ± 0.71p < 0.00054.62 ± 0.674.21 ± 0.74p = 0.0314.04 ± 0.64
Anisocoria0.43 ± 0.32p < 0.00050.71 ± 0.320.46 ± 0.27p < 0.00050.14 ± 0.100.42 ± 0.21NS0.46 ± 0.350.37 ± 0.23p = 0.0210.13 ± 0.06
PI1.74 ± 0.51p = 0.0011.64 ± 0.451.73 ± 0.50p < 0.00052.18 ± 0.421.98 ± 0.66p = 0.0021.77 ± 0.572.03 ± 0.72p < 0.00052.33 ± 0.74
SR12.92 ± 2.24p = 0.00912.33 ± 2.1712.65 ± 2.09p < 0.000514.32 ± 1.5213.68 ± 2.30p < 0.000512.98 ± 2.1313.73 ± 2.45p = 0.01314.73 ± 2.59
Average
Mydriasis
1.41 ± 0.35p < 0.00050.85 ± 0.281.37 ± 0.34p < 0.00051.83 ± 0.481.37 ± 0.29p < 0.00050.67 ± 0.321.41 ± 0.31p = 0.0011.71 ± 0.36
Table 3. R2 coefficients obtained in individual subjects by correlating the changes in task-related parameters with the changes in average pupil size. Significant correlations are highlighted in gray.
ID
Subjects
PI
(R2)
SR
(R2)
Mydriasis
(R2)
10.8910.7770.965
20.9090.6320.926
30.1050.1180.849
40.7390.5430.969
50.7470.1590.875
60.9220.8370.887
70.1980.0730.841
80.5490.6860.865
90.4670.3660.976
100.2320.0780.984
110.9100.1780.906
120.5790.4710.930
130.8140.7810.944
140.0000.0040.319
150.8020.8080.964
160.3690.0610.900
170.4680.3360.842
180.7020.5740.981
190.1480.1610.789
200.6500.6860.869
Mean ± SD0.560 ± 0.2980.416 ± 0.2940.879 ± 0.143
Table 4. R2, p values, and slopes obtained by correlating the changes in task-related parameters with those in pupil size on the hypertonic and hypotonic side within the AD and AI groups. Asterisks refer to significant differences between R2 values relative to pupil size changes on the hypertonic and the hypotonic side. * p < 0.05, ** p < 0.01, *** p < 0.0005.
AD SubjectsAI Subjects
Dependent Variable (Y)Independent Variable (X)R2SlopepR2Slopep
PIPupil Size,
Hypertonic Side
0.589−0.540<0.00050.382−0.448<0.0005
SR0.361−1.933<0.00050.224−1.394<0.0005
Mydriasis0.882−1.102<0.00050.744−1.166<0.0005
PIPupil Size,
Hypotonic Side
0.189 ***−0.595<0.00050.168 **−0.323<0.0005
SR0.094 ***−1.9260.0010.076 *−0.8810.019
Mydriasis0.428 ***−1.494<0.00050.603 *−1.140<0.0005
Publisher’s Note: MDPI stays neutral with regard to jurisdictional claims in published maps and institutional affiliations.

