
Comprehensive Study of Li+/Ni2+ Disorder in Ni-Rich NMCs Cathodes for Li-Ion Batteries

 ,
,
Abstract
:1. Introduction
2. Materials and Methods
3. Results and Discussion
4. Conclusions
Supplementary Materials
Author Contributions
Funding
Institutional Review Board Statement
Informed Consent Statement
Data Availability Statement
Acknowledgments
Conflicts of Interest
References
- Whittingham, M.S. Ultimate limits to intercalation reactions for lithium batteries. Chem. Rev. 2014, 114, 11414–11443. [Google Scholar] [CrossRef]
- Goodenough, J.B.; Kim, Y. Challenges for rechargeable Li batteries. Chem. Mater. 2009, 22, 587–603. [Google Scholar] [CrossRef]
- Manthiram, A.; Knight, J.C.; Myung, S.-T.; Oh, S.-M.; Sun, Y.-K. Nickel-rich and lithium-rich layered oxide cathodes: Progress and perspectives. Adv. Energy Mater. 2015, 6. [Google Scholar] [CrossRef]
- Delmas, C.; Fouassier, C.; Hagenmuller, P. Structural classification and properties of the layered oxides. Physica 1980, 99, 81–85. [Google Scholar] [CrossRef]
- Shannon, R.D. Revised effective ionic radii and systematic studies of interatomic distances in halides and chalcogenides. Acta Crystallogr. Sect. A Cryst. Phys. Diffr. Theor. Gen. Crystallogr. 1976, 32, 751–767. [Google Scholar] [CrossRef]
- Gao, A.; Sun, Y.; Zhang, Q.; Zheng, J.; Lu, X. Evolution of Ni/Li antisites under the phase transition of a layered LiNi1/3Co1/3Mn1/3O2 cathode. J. Mater. Chem. A 2020, 8, 6337–6348. [Google Scholar] [CrossRef]
- Zheng, J.; Ye, Y.; Liu, T.; Xiao, Y.; Wang, C.; Wang, F.; Pan, F. Ni/Li disordering in layered transition metal oxide: Electrochemical impact, origin, and control. Acc. Chem. Res. 2019, 52, 2201–2209. [Google Scholar] [CrossRef]
- Xu, J.; Lin, F.; Doeff, M.; Tong, W. A review of Ni-based layered oxides for rechargeable Li-ion batteries. J. Mater. Chem. A 2016, 5, 874–901. [Google Scholar] [CrossRef] [Green Version]
- Kang, K.; Meng, Y.S.; Bréger, J.; Grey, C.P.; Ceder, G. Electrodes with high power and high capacity for rechargeable lithium batteries. Science 2006, 311, 977–980. [Google Scholar] [CrossRef]
- Yu, H.; Qian, Y.; Otani, M.; Tang, D.; Guo, S.; Zhu, Y.; Zhou, H. Study of the lithium/nickel ions exchange in the layered LiNi0.42Mn0.42Co0.16O2 cathode material for lithium ion batteries: Experimental and first-principles calculations. Energy Environ. Sci. 2014, 7, 1068–1078. [Google Scholar] [CrossRef]
- Zhang, S.S. Problems and their origins of Ni-rich layered oxide cathode materials. Energy Storage Mater. 2019, 24, 247–254. [Google Scholar] [CrossRef]
- Bianchini, M.; Roca-Ayats, M.; Hartmann, P.; Brezesinski, T.; Janek, J. There and back again—The journey of LiNiO 2 as a cathode active material. Angew. Chem. Int. Ed. 2018, 58, 10434–10458. [Google Scholar] [CrossRef]
- Yan, P.; Nie, A.; Zheng, J.; Zhou, Y.; Lu, D.; Zhang, X.; Xu, R.; Belharouak, I.; Zu, X.; Xiao, J.; et al. Evolution of lattice structure and chemical composition of the surface reconstruction layer in Li1.2Ni0.2Mn0.6O2 cathode material for lithium ion batteries. Nano Lett. 2014, 15, 514–522. [Google Scholar] [CrossRef]
- Yan, P.; Zheng, J.; Lv, D.; Wei, Y.; Zheng, J.; Wang, Z.; Kuppan, S.; Yu, J.; Luo, L.; Edwards, D.; et al. Atomic-resolution visualization of distinctive chemical mixing behavior of Ni, Co, and Mn with Li in layered lithium transition-metal oxide cathode materials. Chem. Mater. 2015, 27, 5393–5401. [Google Scholar] [CrossRef]
- Lin, F.; Markus, I.M.; Nordlund, D.; Weng, T.-C.; Asta, M.D.; Xin, H.; Doeff, M. Surface reconstruction and chemical evolution of stoichiometric layered cathode materials for lithium-ion batteries. Nat. Commun. 2014, 5, 3529. [Google Scholar] [CrossRef]
- Li, T.; Yuan, X.-Z.; Zhang, L.; Song, D.; Shi, K.; Bock, C. Degradation mechanisms and mitigation strategies of nickel-rich NMC-based lithium-ion batteries. Electrochem. Energy Rev. 2019, 3, 43–80. [Google Scholar] [CrossRef] [Green Version]
- Liu, W.; Oh, P.; Liu, X.; Lee, M.-J.; Cho, W.; Chae, S.; Kim, Y.; Cho, J. Nickel-rich layered lithium transition-metal oxide for high-energy lithium-ion batteries. Angew. Chem. Int. Ed. 2015, 54, 4440–4457. [Google Scholar] [CrossRef]
- Zheng, J.X.; Liu, T.C.; Hu, Z.X.; Wei, Y.; Song, X.H.; Ren, Y.; Wang, W.D.; Rao, M.M.; Lin, Y.; Chen, Z.H.; et al. Tuning of thermal stability in layered Li(NixMnyCoz)O2. J. Am. Chem. Soc. 2016, 138, 13326–13334. [Google Scholar] [CrossRef] [PubMed]
- Meng, Y.; Ceder, G.; Grey, C.; Yoon, W.-S.; Jiang, M.; Breger, J.; Shao-Horn, Y. Cation ordering in layered O3 Li[NixLi1/3−2 x/3Mn2/3-x/3]O2 (0 ⩽ x⩽ 1/2) compounds. Chem. Mater. 2005, 17, 2386–2394. [Google Scholar] [CrossRef]
- Sun, G.; Yin, X.; Yang, W.; Song, A.; Jia, C.; Yang, W.; Du, Q.; Ma, Z.; Shao, G. The effect of cation mixing controlled by thermal treatment duration on the electrochemical stability of lithium transition-metal oxides. Phys. Chem. Chem. Phys. 2017, 19, 29886–29894. [Google Scholar] [CrossRef] [PubMed]
- Kong, F.; Liang, C.; Wang, L.; Zheng, Y.; Perananthan, S.; Longo, R.C.; Ferraris, J.P.; Kim, M.; Cho, K. Kinetic stability of bulk LiNiO2 and surface degradation by oxygen evolution in LiNiO2 based cathode materials. Adv. Energy Mater. 2018, 9. [Google Scholar] [CrossRef]
- Tian, C.; Nordlund, D.; Xin, H.; Xu, Y.; Liu, Y.; Sokaras, D.; Lin, F.; Doeff, M.M. Depth-dependent redox behavior of LiNi0.6Mn0.2Co0.2O2. J. Electrochem. Soc. 2018, 165, A696–A704. [Google Scholar] [CrossRef] [Green Version]
- Zou, L.; Zhao, W.; Liu, Z.; Jia, H.; Zheng, J.; Wang, G.; Yang, Y.; Zhang, J.-G.; Wang, C. Revealing cycling rate-dependent structure evolution in ni-rich layered cathode materials. ACS Energy Lett. 2018, 3, 2433–2440. [Google Scholar] [CrossRef]
- Xiao, Y.; Liu, T.; Liu, J.; He, L.; Chen, J.; Zhang, J.; Luo, P.; Lu, H.; Wang, R.; Zhu, W.; et al. Insight into the origin of lithium/nickel ions exchange in layered Li(NixMnyCoz)O2 cathode materials. Nano Energy 2018, 49, 77–85. [Google Scholar] [CrossRef] [Green Version]
- Yin, L.; Mattei, G.S.; Li, Z.; Zheng, J.; Zhao, W.; Omenya, F.; Fang, C.; Li, W.; Li, J.; Xie, Q.; et al. Extending the limits of powder diffraction analysis: Diffraction parameter space, occupancy defects, and atomic form factors. Rev. Sci. Instrum. 2018, 89, 093002. [Google Scholar] [CrossRef] [PubMed] [Green Version]
- Yin, L.; Li, Z.; Mattei, G.S.; Zheng, J.; Zhao, W.; Omenya, F.; Fang, C.; Li, W.; Li, J.; Xie, Q.; et al. Thermodynamics of antisite defects in layered NMC cathodes: Systematic insights from high-precision powder diffraction analyses. Chem. Mater. 2019, 32, 1002–1010. [Google Scholar] [CrossRef] [Green Version]
- Hwang, S.; Su, D. TEM studies on electrode materials for secondary ion batteries. Inorg. Battery Mater. 2019, 311, 1–27. [Google Scholar] [CrossRef]
- Zhu, J.; Sharifi-Asl, S.; Garcia, J.C.; Iddir, H.H.; Croy, J.R.; Shahbazian-Yassar, R.; Chen, G. Atomic-level understanding of surface reconstruction based on Li[NixMnyCo1−x−y]O2 single-crystal studies. ACS Appl. Energy Mater. 2020, 3, 4799–4811. [Google Scholar] [CrossRef]
- Kim, U.-H.; Park, G.-T.; Conlin, P.; Ashburn, N.; Cho, K.; Yu, Y.-S.; Shapiro, D.A.; Maglia, F.; Kim, S.-J.; Lamp, P.; et al. Cation ordered Ni-rich layered cathode for ultra-long battery life. Energy Environ. Sci. 2021, 14, 1573–1583. [Google Scholar] [CrossRef]
- Jung, S.-K.; Gwon, H.; Hong, J.; Park, K.-Y.; Seo, D.-H.; Kim, H.; Hyun, J.; Yang, W.; Kang, K. Understanding the degradation mechanisms of LiNi0.5 Co0.2 Mn0.3 O2 cathode material in lithium ion batteries. Adv. Energy Mater. 2013, 4. [Google Scholar] [CrossRef]
- Schweidler, S.; De Biasi, L.; Garcia, G.; Mazilkin, A.; Hartmann, P.; Brezesinski, T.; Janek, J. Investigation into mechanical degradation and fatigue of high-Ni NCM cathode material: A long-term cycling study of full cells. ACS Appl. Energy Mater. 2019, 2, 7375–7384. [Google Scholar] [CrossRef]
- Van Aert, S.; De Backer, A.; Martinez, G.T.; Dekker, A.D.; Van Dyck, D.; Bals, S.; Van Tendeloo, G. Advanced electron crystallography through model-based imaging. IUCrJ 2016, 3, 71–83. [Google Scholar] [CrossRef] [Green Version]
- De Backer, A.; Bos, K.H.W.V.D.; Broek, W.V.D.; Sijbers, J.; Van Aert, S. StatSTEM: An efficient approach for accurate and precise model-based quantification of atomic resolution electron microscopy images. Ultramicroscopy 2016, 171, 104–116. [Google Scholar] [CrossRef]
- Gemmi, M.; Mugnaioli, E.; Gorelik, T.E.; Kolb, U.; Palatinus, L.; Boullay, P.; Hovmöller, S.; Abrahams, J.P. 3D electron diffraction: The nanocrystallography revolution. ACS Cent. Sci. 2019, 5, 1315–1329. [Google Scholar] [CrossRef] [Green Version]
- Vainshtein, B.K.; Zvyagin, B.B.; Avilov, A.S. Diffraction Structure Analysis in Electron—Diffraction Techniques; Cowley, J.M., Ed.; Oxford University Press: Oxford, UK, 1992; pp. 216–312. [Google Scholar]
- Hadermann, J.; Abakumov, A.M. Structure solution and refinement of metal-ion battery cathode materials using electron diffraction tomography. Acta Crystallogr. Sect. B Struct. Sci. Cryst. Eng. Mater. 2019, 75, 485–494. [Google Scholar] [CrossRef] [PubMed] [Green Version]
- Karakulina, O.M.; Khasanova, N.R.; Drozhzhin, O.A.; Tsirlin, A.A.; Hadermann, J.; Antipov, E.V.; Abakumov, A.M. Antisite disorder and bond valence compensation in Li2FePO4F cathode for Li-Ion batteries. Chem. Mater. 2016, 28, 7578–7581. [Google Scholar] [CrossRef]
- Mugnaioli, E. Closing the gap between electron and X-ray crystallography. Acta Crystallogr. Sect. B Struct. Sci. Cryst. Eng. Mater. 2015, 71, 737–739. [Google Scholar] [CrossRef] [PubMed] [Green Version]
- Petříček, V.; Dušek, M.; Palatinus, L. Crystallographic computing system JANA2006: General features. Z. Krist. Cryst. Mater. 2014, 229, 345–352. [Google Scholar] [CrossRef]
- Palatinus, L.; Brázda, P.; Jelínek, M.; Hrda, J.; Steciuk, G.; Klementova, M. Specifics of the data processing of precession electron diffraction tomography data and their implementation in the program PETS2.0. Acta Crystallogr. Sect. B Struct. Sci. Cryst. Eng. Mater. 2019, 75, 512–522. [Google Scholar] [CrossRef]
- Nam, K.-W.; Bak, S.-M.; Hu, E.; Yu, X.; Zhou, Y.; Wang, X.; Wu, L.; Zhu, Y.; Chung, K.Y.; Yang, X.-Q. Combining in situ synchrotron X-ray diffraction and absorption techniques with transmission electron microscopy to study the origin of thermal instability in overcharged cathode materials for Lithium-Ion batteries. Adv. Funct. Mater. 2012, 23, 1047–1063. [Google Scholar] [CrossRef]
- Morales, J.; Vicente, C.P.; Tirado, J.L. Cation distribution and chemical deintercalation of Li1-xNi1+xO2. Mater. Res. Bull. 1990, 25, 623–630. [Google Scholar] [CrossRef]
- Ohzuku, T.; Ueda, A.; Nagayama, M. Electrochemistry and structural chemistry of LiNiO2 (R3m) for 4 volt secondary lithium Cells. J. Electrochem. Soc. 1993, 140, 1862–1870. [Google Scholar] [CrossRef]
- Hua, W.; Zhang, J.; Zheng, Z.; Liu, W.; Peng, X.; Guo, X.-D.; Zhong, B.; Wang, Y.-J.; Wang, X. Na-doped Ni-rich LiNi0.5Co0.2Mn0.3O2 cathode material with both high rate capability and high tap density for lithium ion batteries. Dalton Trans. 2014, 43, 14824–14832. [Google Scholar] [CrossRef]
- Zhang, X.; Jiang, W.; Mauger, A.; Qilu, A.; Gendron, F.; Julien, C. Minimization of the cation mixing in Li1+x(NMC)1−xO2 as cathode material. J. Power Sources 2010, 195, 1292–1301. [Google Scholar] [CrossRef]
- Vegard, L. Die konstitution der mischkristalle und die raumfüllung der atome. Z. Phys. 1921, 5, 17–26. [Google Scholar] [CrossRef]
- Denton, A.R.; Ashcroft, N.W. Vegard’s law. Phys. Rev. A 1991, 43, 3161–3164. [Google Scholar] [CrossRef] [PubMed]
- Mugnaioli, E.; Gemmi, M. Single-crystal analysis of nanodomains by electron diffraction tomography: Mineralogy at the order-disorder borderline. Z. Kristallogr. Cryst. Mater. 2018, 233, 163–178. [Google Scholar] [CrossRef]
- Palatinus, L.; Jacob, D.; Cuvillier, P.; Klementova, M.; Sinkler, W.; Marks, L.D. Structure refinement from precession electron diffraction data. Acta Crystallogr. Sect. A Found. Crystallogr. 2013, 69, 171–188. [Google Scholar] [CrossRef]
- Palatinus, L.; Petříček, V.; Corrêa, C.A. Structure refinement using precession electron diffraction tomography and dynamical diffraction: Theory and implementation. Acta Crystallogr. Sect. A Found. Adv. 2015, 71, 235–244. [Google Scholar] [CrossRef]
- Palatinus, L.; Corrêa, C.A.; Steciuk, G.; Jacob, D.; Roussel, P.; Boullay, P.; Klementová, M.; Gemmi, M.; Kopeček, J.; Domeneghetti, M.C.; et al. Structure refinement using precession electron diffraction tomography and dynamical diffraction: Tests on experimental data. Acta Cryst. B 2015, 71, 740–751. [Google Scholar] [CrossRef]
- LeBeau, J.M.; Findlay, S.D.; Allen, L.J.; Stemmer, S. Standardless atom counting in scanning transmission electron microscopy. Nano Lett. 2010, 10, 4405–4408. [Google Scholar] [CrossRef] [PubMed]
- Van Aert, S.; Batenburg, K.J.; Rossell, M.D.; Erni, R.; Van Tendeloo, G. Three-dimensional atomic imaging of crystalline nanoparticles. Nature 2011, 470, 374–377. [Google Scholar] [CrossRef] [PubMed]
- Bals, S.; Van Aert, S.; Van Tendeloo, G.; Brande, D.A. Statistical estimation of atomic positions from exit wave reconstruction with a precision in the picometer range. Phys. Rev. Lett. 2006, 96, 096106. [Google Scholar] [CrossRef] [Green Version]
- De Backer, A.; Jones, L.; Lobato, I.; Altantzis, T.; Goris, B.; Nellist, P.D.; Bals, S.; Van Aert, S. Three-dimensional atomic models from a single projection using Z-contrast imaging: Verification by electron tomography and opportunities. Nanoscale 2017, 9, 8791–8798. [Google Scholar] [CrossRef] [PubMed]
- Guzzinati, G.; Altantzis, T.; Batuk, M.; De Backer, A.; Lumbeeck, G.; Samaee, V.; Batuk, D.; Idrissi, H.; Hadermann, J.; Van Aert, S.; et al. Recent advances in transmission electron microscopy for materials science at the EMAT lab of the University of Antwerp. Materials 2018, 11, 1304. [Google Scholar] [CrossRef] [Green Version]
- Lin, F.; Markus, I.M.; Doeff, M.; Xin, H.L. Chemical and structural stability of lithium-ion battery electrode materials under electron beam. Sci. Rep. 2014, 4, 5694. [Google Scholar] [CrossRef] [Green Version]
- Hobbs, L.W. Electron-beam sensitivity in inorganic specimens. Ultramicroscopy 1987, 23, 339–344. [Google Scholar] [CrossRef]


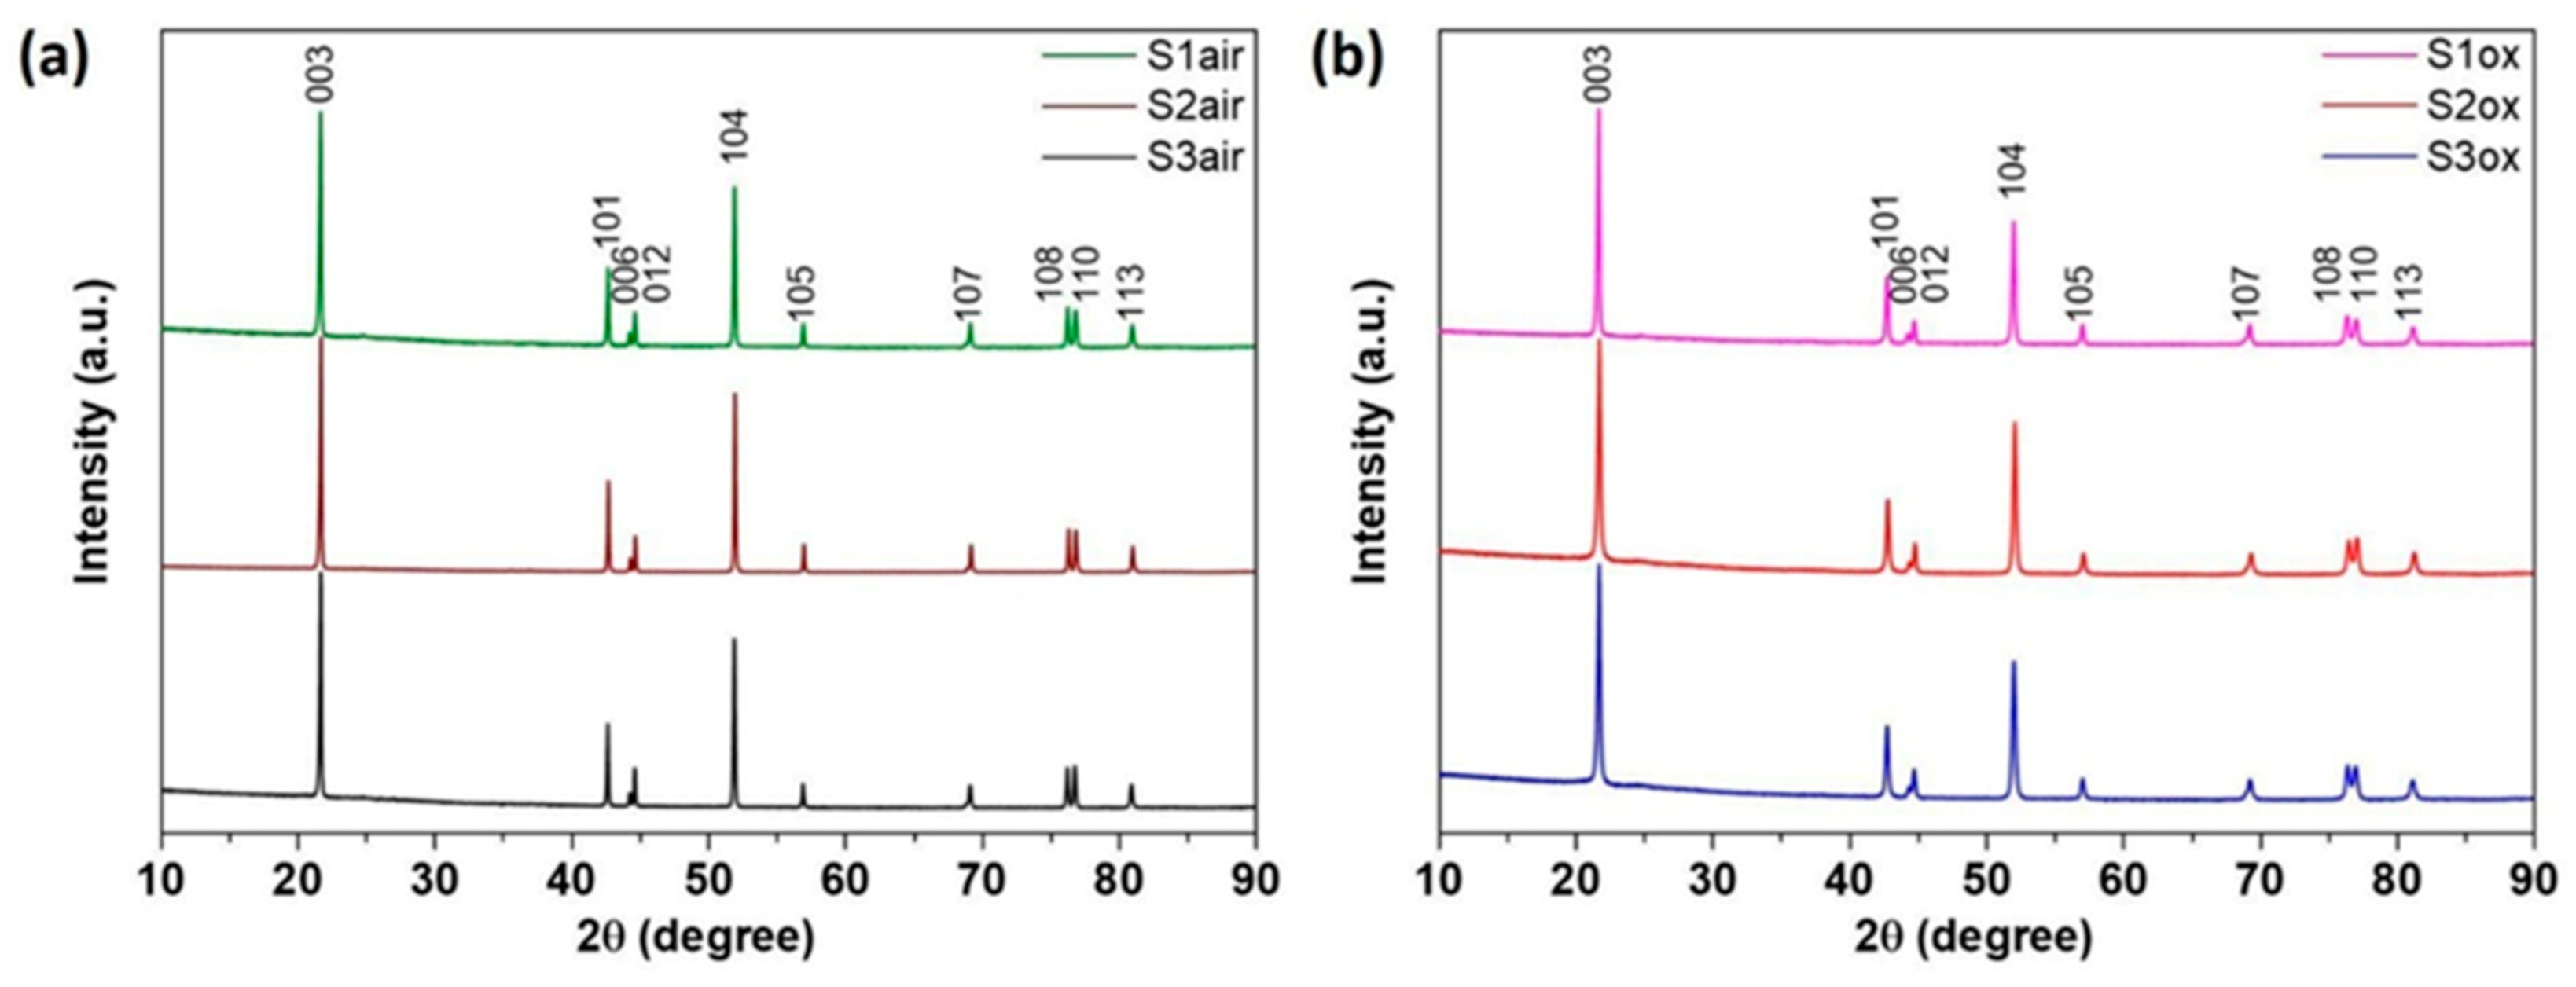
| Sample | Co-Precipitation Route | TM Source | C (NH3·H2O), mol/L | pH | Annealing Atmosphere | Li/TM Ratio |
|---|---|---|---|---|---|---|
| S1air | hydroxide | sulfates | 0.25 | 11.0 | air | 1.06 |
| S1ox | hydroxide | sulfates | 0.25 | 11.0 | oxygen | 1.03 |
| S2air | hydroxide | acetates | 0.50 | 11.5 | air | 1.06 |
| S2ox | hydroxide | acetates | 0.50 | 11.5 | oxygen | 1.03 |
| S3air | carbonate | sulfates | 0.25 | 7.8 | air | 1.06 |
| S3ox | hydroxide | sulfates | 0.50 | 11.5 | oxygen | 1.03 |
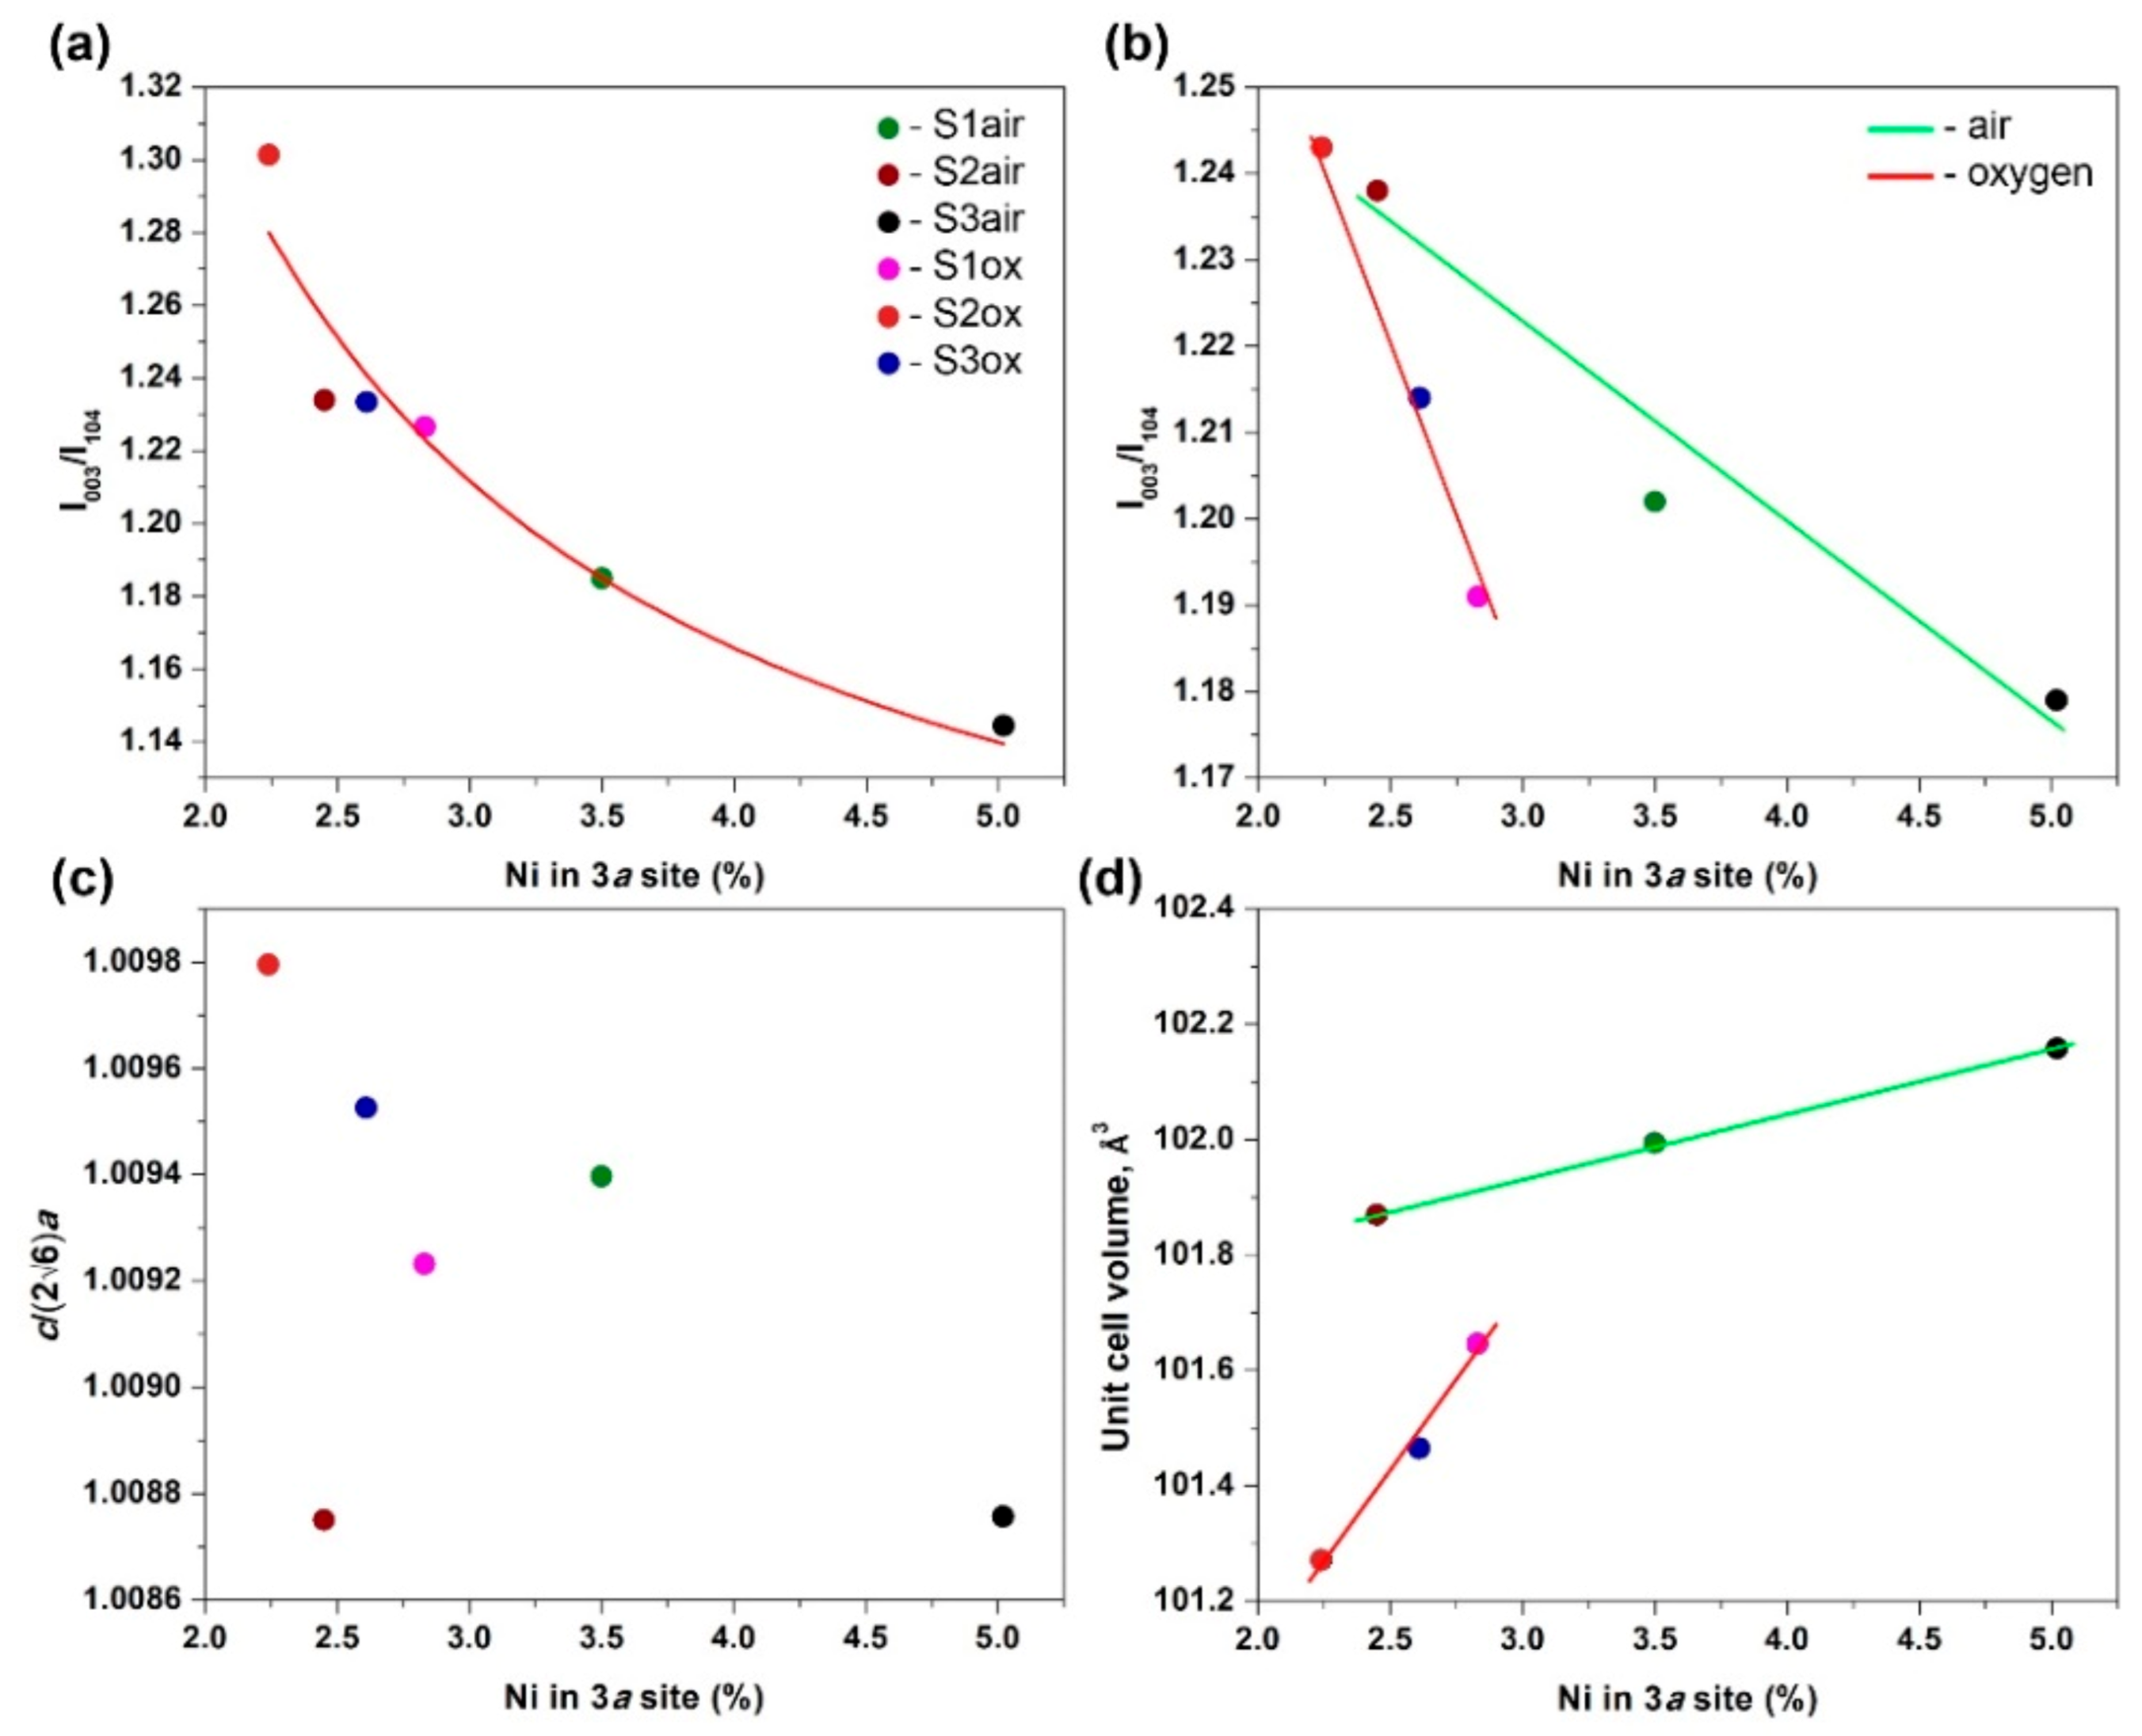
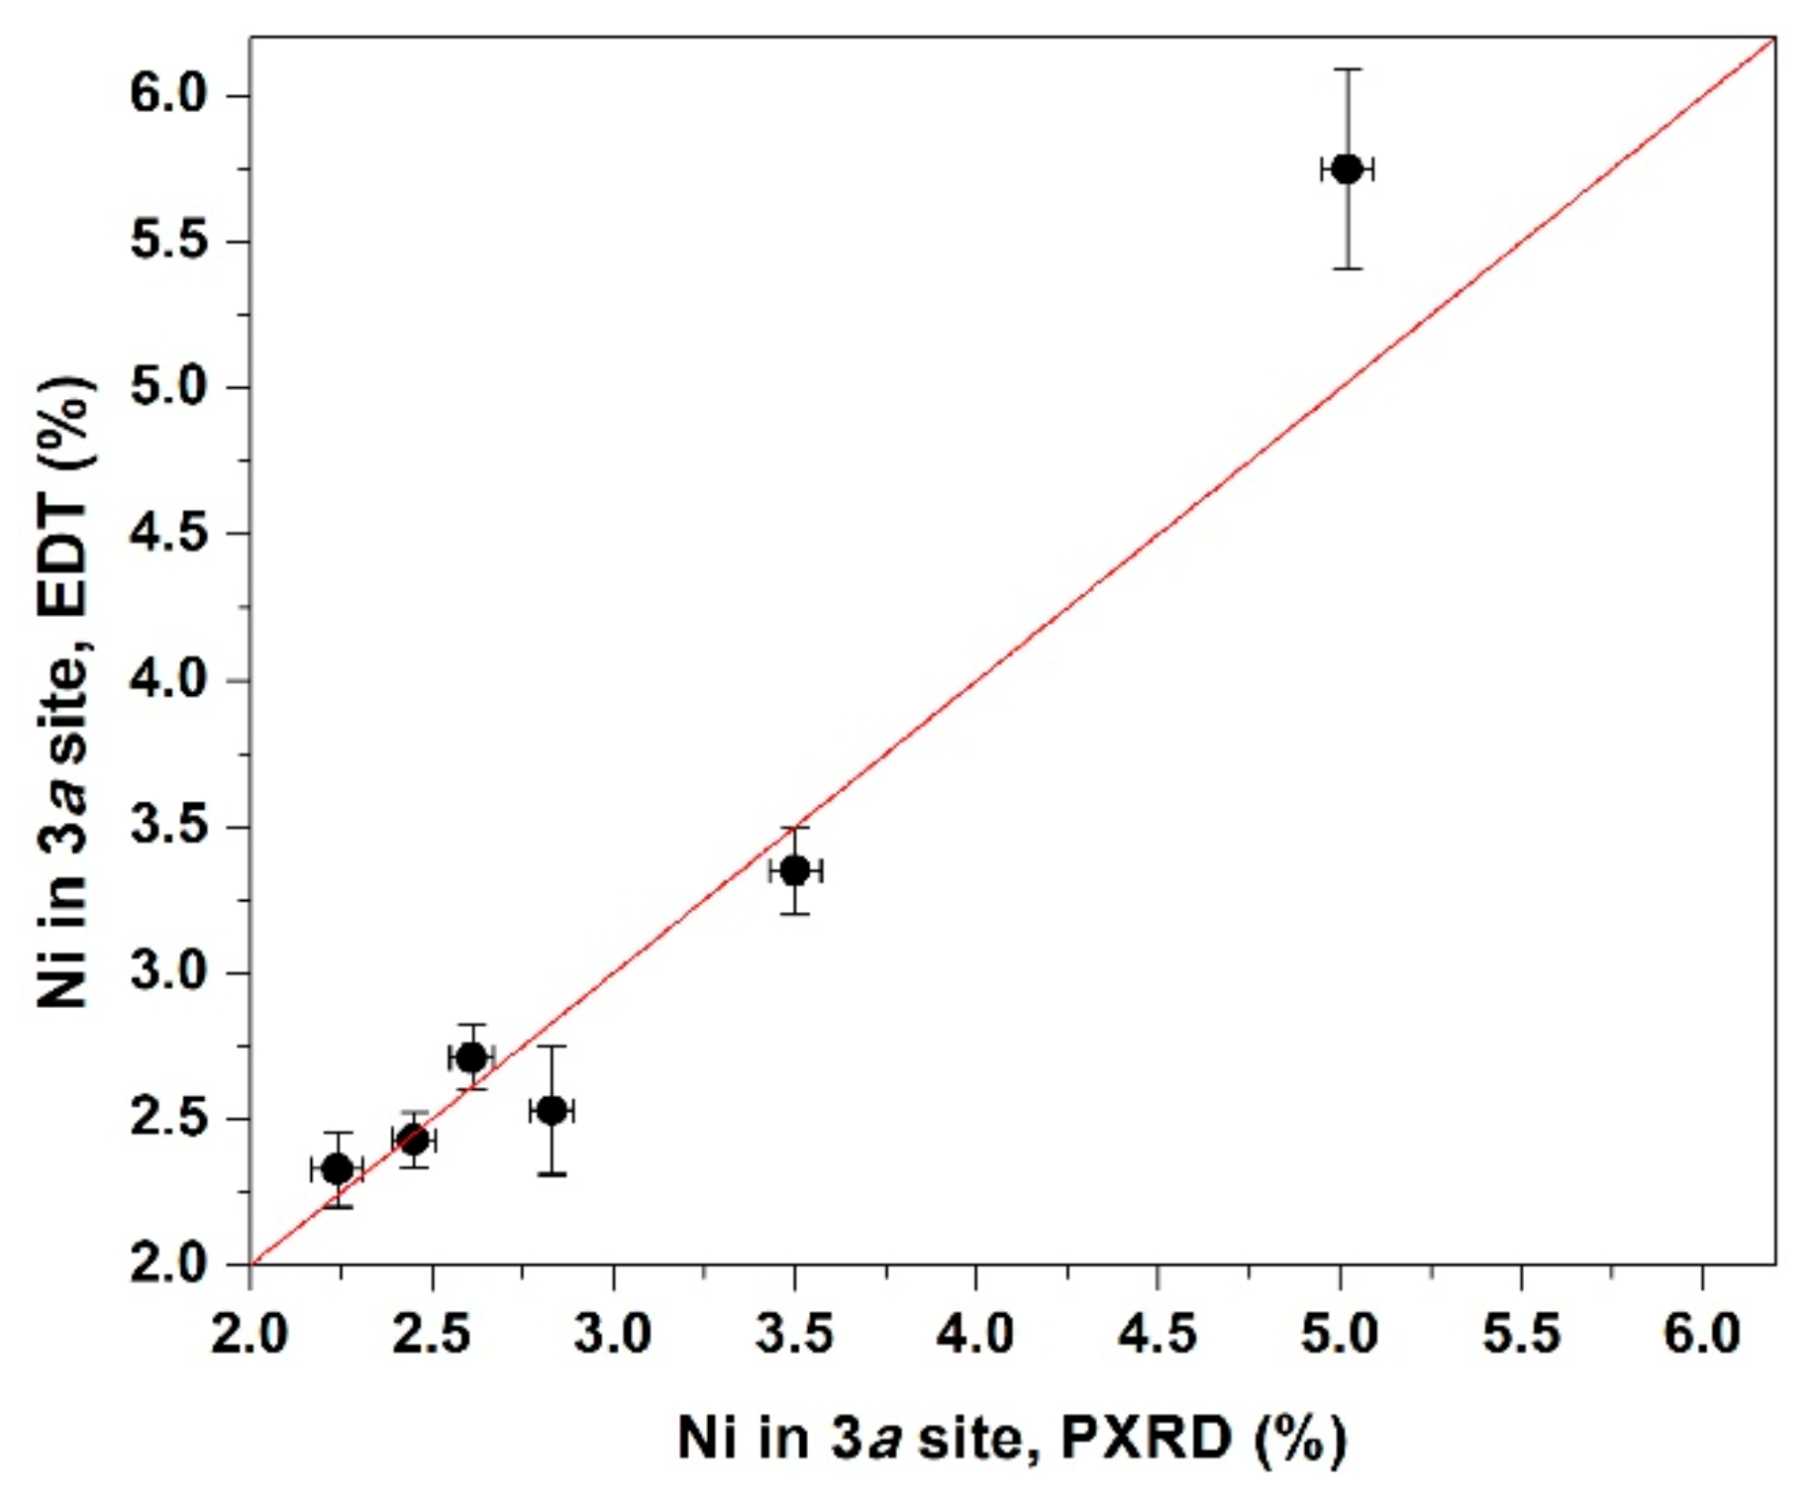
| Sample | Refined Composition | a, Å | c, Å | V, Å3 | zO | Uiso, Å2 | τ | d(Li-O), Å | d(TM-O), Å | Ni in 3a Site, % | Li in 3b Site, % | RF, % | Rp, % |
|---|---|---|---|---|---|---|---|---|---|---|---|---|---|
| S1air | Li0.965Ni0.835Mn0.1Co0.1O2 | 2.87712(1) | 14.2274(1) | 101.994(1) | 0.24047(8) | 0.0049(2) | 0.9724(9) | 2.1225(7) | 1.9651(6) | 3.50(7) | 0 | 2.21 | 1.66 |
| S2air | Li0.975Ni0.825Mn0.1Co0.1O2 | 2.876568(8) | 14.21556(7) | 101.8694(7) | 0.24095(7) | 0.0051(2) | 0.9888(7) | 2.1173(6) | 1.9681(5) | 2.45(6) | 0 | 1.24 | 2.07 |
| S3air | Li0.950Ni0.850Mn0.1Co0.1O2 | 2.87927(1) | 14.2290(1) | 102.1578(9) | 0.24076(8) | 0.0057(2) | 0.9823(9) | 2.1210(7) | 1.9685(6) | 5.02(7) | 0 | 2.30 | 2.00 |
| S1ox | Li0.995Ni0.805Mn0.1Co0.1O2 | 2.87401(2) | 14.2097(2) | 101.646(2) | 0.24092(7) | 0.0049(2) | 0.9781(8) | 2.1160(7) | 1.9664(6) | 2.83(6) | 2.4(2) | 2.00 | 1.75 |
| S2ox | Li1.013Ni0.787Mn0.1Co0.1O2 | 2.86994(2) | 14.1975(2) | 101.271(2) | 0.24020(9) | 0.0047(3) | 0.9804(9) | 2.1199(8) | 1.9584(7) | 2.24(7) | 3.5(2) | 2.42 | 1.65 |
| S3ox | Li0.993Ni0.807Mn0.1Co0.1O2 | 2.87202(3) | 14.2040(3) | 101.465(3) | 0.24062(8) | 0.0048(2) | 0.9756(9) | 2.1175(7) | 1.9629(6) | 2.61(6) | 1.9(2) | 1.71 | 1.49 |
| Sample | Ni in 3a Site, % | I003/I104 | I003/I104, po-Corrected | I003/I104, po- and F000-Corrected | |
|---|---|---|---|---|---|
| S1air | 3.50(7) | 1.290 | 1.185 | 1.202 | 1.00940 |
| S1ox | 2.45(6) | 1.277 | 1.234 | 1.238 | 1.00875 |
| S2air | 5.02(7) | 1.208 | 1.144 | 1.179 | 1.00876 |
| S2ox | 2.83(6) | 1.312 | 1.227 | 1.191 | 1.00923 |
| S3air | 2.24(7) | 1.382 | 1.301 | 1.243 | 1.00980 |
| S3ox | 2.61(6) | 1.330 | 1.233 | 1.214 | 1.00953 |
Publisher’s Note: MDPI stays neutral with regard to jurisdictional claims in published maps and institutional affiliations. |
© 2021 by the authors. Licensee MDPI, Basel, Switzerland. This article is an open access article distributed under the terms and conditions of the Creative Commons Attribution (CC BY) license (https://creativecommons.org/licenses/by/4.0/).
Share and Cite
Orlova, E.D.; Savina, A.A.; Abakumov, S.A.; Morozov, A.V.; Abakumov, A.M. Comprehensive Study of Li+/Ni2+ Disorder in Ni-Rich NMCs Cathodes for Li-Ion Batteries. Symmetry 2021, 13, 1628. https://doi.org/10.3390/sym13091628
Orlova ED, Savina AA, Abakumov SA, Morozov AV, Abakumov AM. Comprehensive Study of Li+/Ni2+ Disorder in Ni-Rich NMCs Cathodes for Li-Ion Batteries. Symmetry. 2021; 13(9):1628. https://doi.org/10.3390/sym13091628
Chicago/Turabian StyleOrlova, Elena D., Aleksandra A. Savina, Sergey A. Abakumov, Anatolii V. Morozov, and Artem M. Abakumov. 2021. "Comprehensive Study of Li+/Ni2+ Disorder in Ni-Rich NMCs Cathodes for Li-Ion Batteries" Symmetry 13, no. 9: 1628. https://doi.org/10.3390/sym13091628
APA StyleOrlova, E. D., Savina, A. A., Abakumov, S. A., Morozov, A. V., & Abakumov, A. M. (2021). Comprehensive Study of Li+/Ni2+ Disorder in Ni-Rich NMCs Cathodes for Li-Ion Batteries. Symmetry, 13(9), 1628. https://doi.org/10.3390/sym13091628