Article

Effect of Natural Wind on the Transiting Test for Measuring the Aerodynamic Coefficients of Structures

1
China Metallurgical Group Corporation, Beijing 100028, China
2
School of Civil Engineering, Zhengzhou University, Zhengzhou 450001, China
*
Authors to whom correspondence should be addressed.
Symmetry 2021, 13(8), 1493; https://doi.org/10.3390/sym13081493
Submission received: 5 July 2021 / Revised: 30 July 2021 / Accepted: 10 August 2021 / Published: 14 August 2021

Abstract

:
The aerodynamic coefficients transiting test is a new method for measuring the structural aerodynamic coefficients using the wind generated by a moving vehicle. However, the effect and correction of natural wind on the transiting test has not been studied. Hence, in this study, the investigation of the aerodynamic force and pressure measurements on a special triangular prism model is simulated through the transiting test under different natural wind conditions for 30° and 90° angles of wind incidence. Force and pressure measurement results in the transiting test are used to describe and explain the effect of natural wind in the range of 0–3.0 m/s on the aerodynamic coefficients of the symmetric triangular prism qualitatively and quantitatively. The results show that the driving wind field of the vehicle, aerodynamic force coefficient, and aerodynamic pressure coefficient are significantly influenced by strong natural wind greater than 1.71 m/s, which must be considered and so it is recommended that the structure aerodynamic coefficients transiting test should be conducted under the condition that the natural wind is less than 1.71 m/s. In addition, the method of two-direction round-trip measurement is proposed to modify the effect of natural wind on transiting tests.

1. Introduction

The aerodynamic coefficients of structures are an important parameter in the study of structural wind engineering [1]. The aerostatic stability of bridges [2], aerodynamic instability of transmission cable conductors [3], wind resistance research of high-rise buildings [4], airfoil design of wind turbines [5,6], galloping stability of structures [7,8], safety of high-speed train operations [9,10], and vehicle aerodynamic shape design [11] are all closely related to the aerodynamic coefficients. At present, the full-scale field measurement research [12,13], computational fluid dynamics that are based on fluid calculation software [14], and the wind tunnel test [15,16] are commonly used methods for investigating the structural aerodynamic coefficients. However, the above three methods have their own shortcomings. For the numerical simulation method, the setting of some parameters is different from the actual situation, and the simulation conditions are more ideal. Simulation results are usually restricted by conditions such as grid and incoming flow [17]. Therefore, the problem of aerodynamics cannot be completely solved by numerical simulation [18,19]. Field measurements are the most realistic research method, but they will also be restricted by conditions such as weather, terrain, installation conditions, and measurement period. It is difficult to conduct field measurements on some large structures [20,21]. The wind tunnel test is the most common experimental method, but the establishment of exact two-dimensional flow conditions in wind tunnels is a very difficult problem [22,23]. It is usually affected by the blocking effect [24], the Reynolds number effect [25], the wall interference [26], support system interference [27], the boundary layer effect [28], and other factors. Rašuo used the NACA 0012 airfoil to analyze the influence of the Reynolds number, Mach number, wall interference, and sidewall boundary-layer control [22,25]. In addition, in order to improve the accuracy of the wind tunnel test, many scholars have conducted in-depth studies on the boundary layer effect of the wind tunnel test [29].
Li et al. proposed a new test method for structural wind resistance research using wind generated by a vehicle moving at a constant speed on the basis of the principle of relative kinematics, which is also called the transiting test for short [30,31]. As a new structural wind resistance research method, the transiting test has practical applications in building the wind pressure coefficient [30], the structural aerodynamic coefficient [31,32], the galloping of iced conductors [33], passive simulation of the wind profile [34], and aerodynamic performance of the wind turbine airfoil. These applications can be expanded to other aspects of structural wind resistance research. Moreover, the transiting test can be extended to other aspects of structural wind resistance research. However, the transiting test can be affected by factors such as the Reynolds number, end plate, natural wind, road type, and vehicle interference. In order to improve the accuracy of the test, it is necessary to conduct research and analysis on the various influencing factors and then provide guidance for the transiting test. The Reynolds number effect and the effect of end plates had been analyzed in the previous studies related to the transiting test. It is found that the transiting test method, for measuring the aerodynamic coefficients of the triangular prism on the straight highway, is not sensitive to the Reynolds number effect [31] and requires end plates which meet certain size requirements [32]. Considering that natural wind is ubiquitous in the external environment, it is necessary to study the effect of natural wind on the transiting test. The purpose is to provide guidance on natural wind conditions for subsequent transiting tests.
Natural wind is ubiquitous in the outdoor environment. Outdoor tests are inevitably interfered with by natural winds [35,36]. Common outdoor tests must take into account the impact of natural wind on several aspects, such as the impact of natural wind on the safety of high-speed rail [37], the vehicle coast-down test [38,39,40], aircraft landing safety, building ventilation [41], and vehicle driving safety [42], and so on. The transiting test method of the structural aerodynamic coefficients is also an outdoor road test exposed to the wind environment. Hence, investigating the influencing factors of natural wind is necessary.
At present, the methods commonly used in natural wind impact research mainly include the simulation of natural wind curves using numerical simulation software [43], the simulation of natural wind characteristics in wind tunnels [42], and measurement of the natural wind environment during the field measurement test [44]. Using actual natural wind characteristics, Yu et al. [37] numerically simulated natural wind and applied it to the high-speed dynamic simulation model, which has been modeled using the vehicle dynamic simulation package “Simpack” to study the random wind stability of the high-speed train. The results demonstrated that the operational safety of the high-speed train will be overestimated if the lateral wind velocity is not considered. Kozmar et al. [42] evaluated the effect of the cutting angle of natural wind on the vehicle aerodynamic load, and the effects of bora-like wind gusts were simulated by exposing the wind tunnel model to an airflow with intermittent switching between weak wind (smaller velocity) and wind gusts (larger velocity) every 3 s. Ji et al. [41] proposed a creative method for generating a fluctuating boundary condition and avoiding the limitation of wind tunnel experiments to assess the influence of fluctuating wind direction on cross natural ventilation. McAuliffe et al. [45] placed a 3D ultrasonic anemometer at a height of 2 m on both sides of a vehicle’s taxi track to measure the natural wind speed when testing the aerodynamic performance of a heavy-duty passenger car and concluded that the natural wind effect should be considered when analyzing the data of pulsating wind speed. Páscoa [39] determined that the windless condition test was accurate when performing the coast-down test of vehicle aerodynamic performance; the results showed that after repeated tests, 4% of the test error was mainly caused by natural wind. Zhang et al. [46] designed a virtual test system for the resistance of vehicle road sliding, which realized the compensation for natural wind, and reduced the natural wind impact while improving the test accuracy. The analysis test of the effect of natural wind on the aerodynamic coefficients is modeled after the test of natural wind on the vehicle coast-down test by using the method of measuring the natural wind environment. The influence analysis of natural wind is crucial to the general applicability and test accuracy of the transiting test.
This paper is a subsequent study about the method of the transiting test, mainly focusing on the impact analysis of natural wind on the aerodynamic coefficients of a triangular prism structure. The triangular prism model is the research object for the transiting test of aerodynamic coefficients, which simultaneously uses the two methods of the force and pressure measurement study for investigating the aerodynamic force coefficients and aerodynamic pressure coefficients under different natural wind conditions. These test results can verify the general applicability of the transiting test under natural wind conditions and qualitatively and quantitatively analyze the influence of natural wind in the range of 0–3.0 m/s on the lift and drag force coefficients and the mean pressure coefficient. In addition, proposing a correction method for a two-direction round-trip measurement to obtain the average value and summarizing the corresponding laws about natural wind conditions can provide advice and guidance for subsequent transiting tests.

2. Experimental Methodology

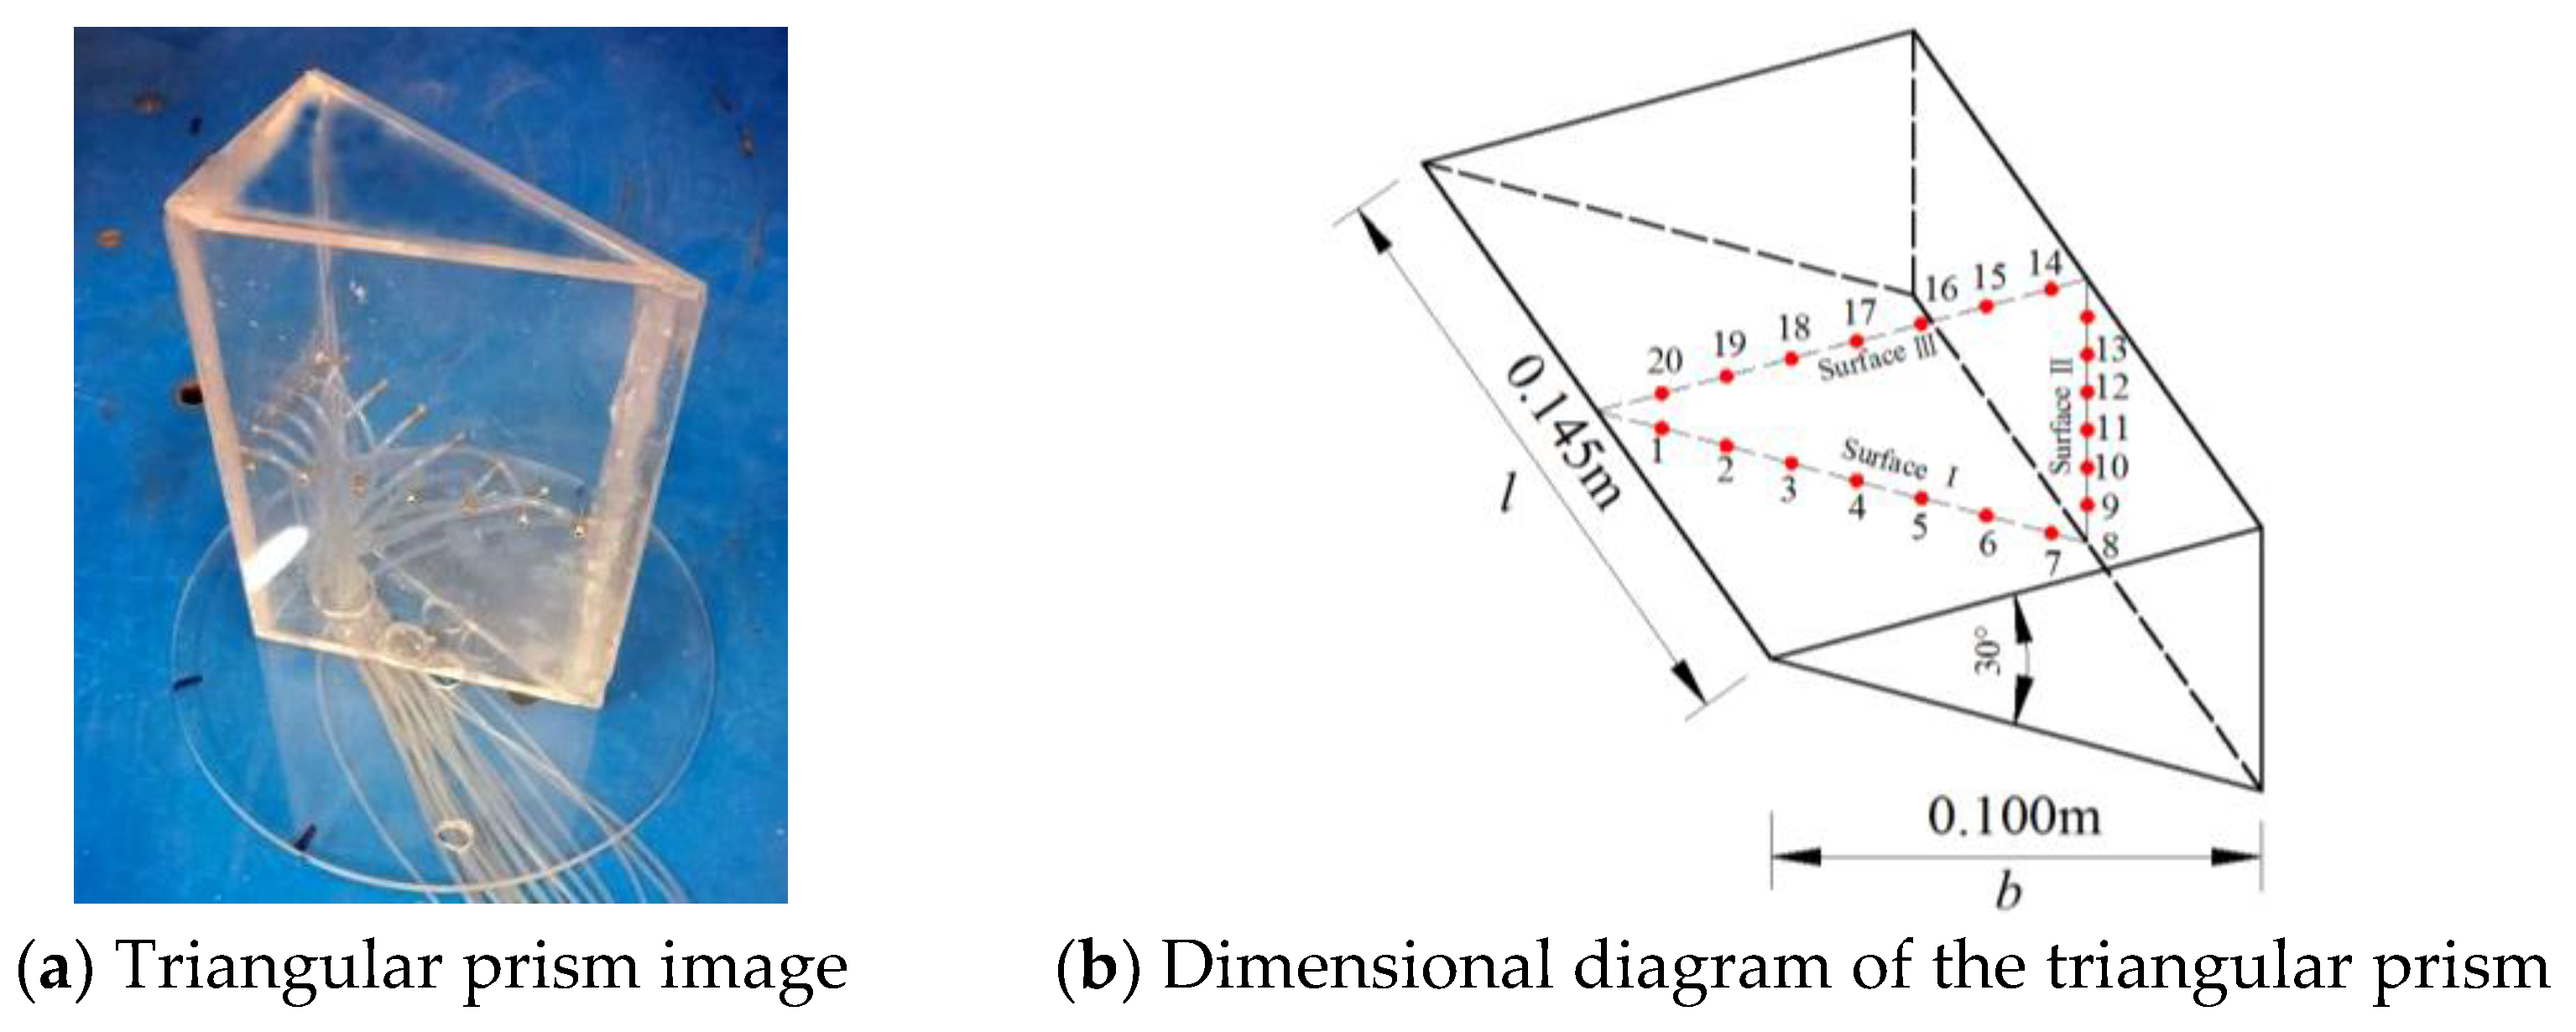
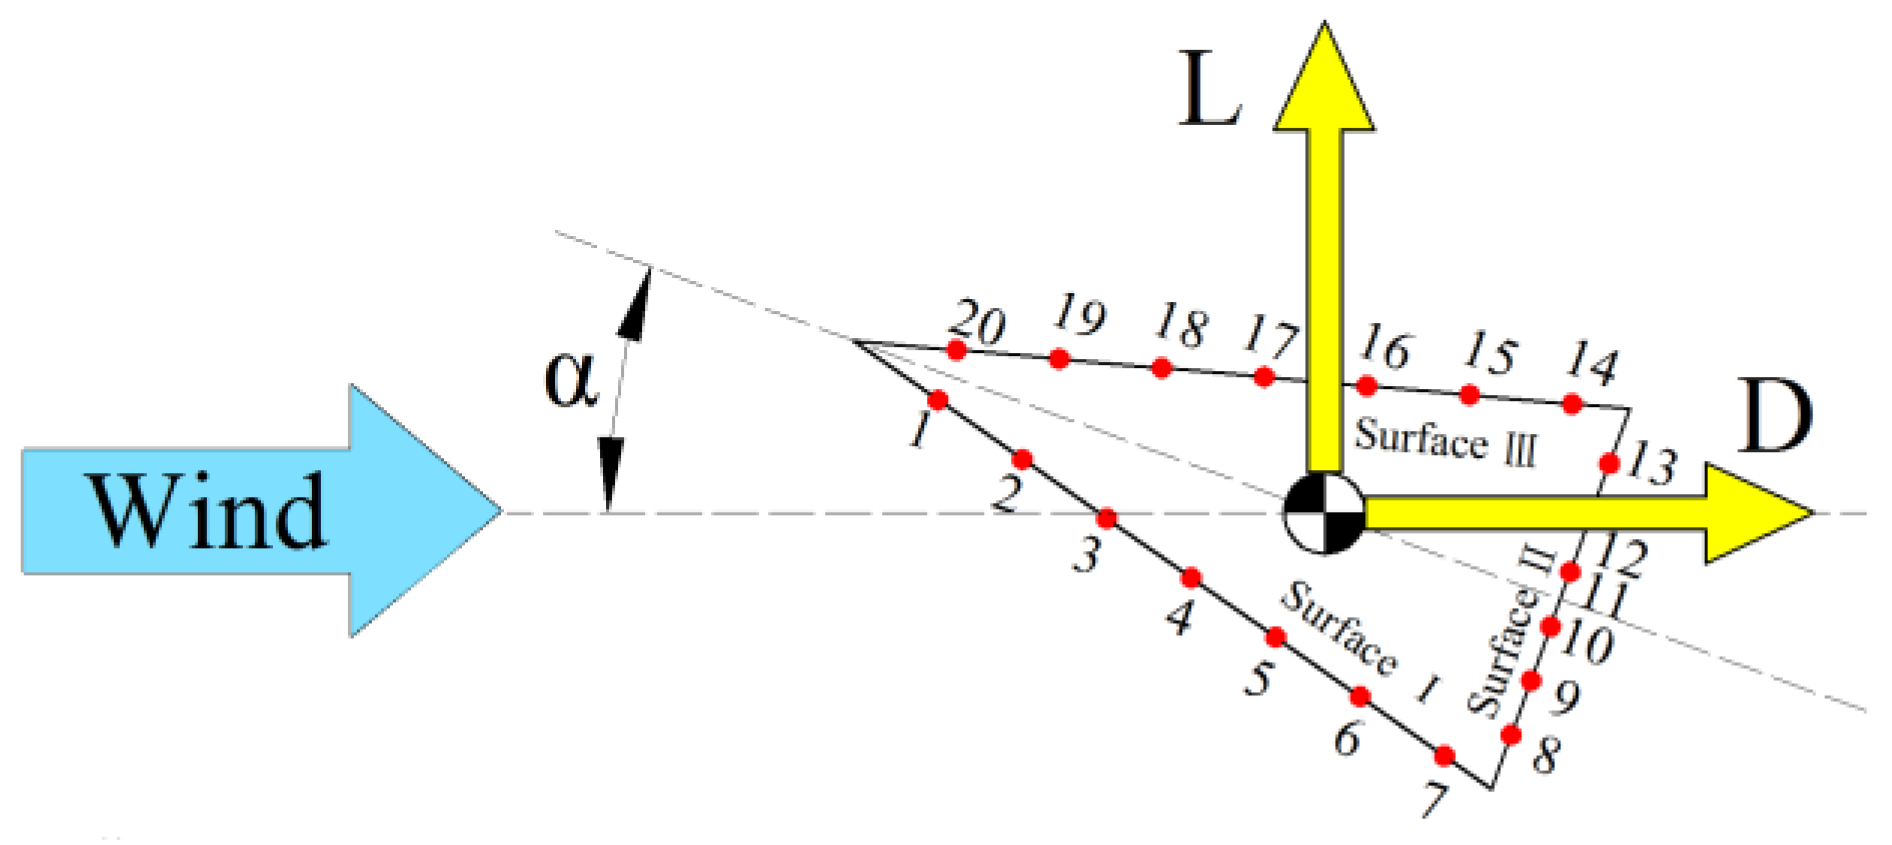
2.1. Introduction of the Test and Model

This research was based on the verification of the aerodynamic transiting test of a triangular prism structure, which uses the test device shown in Figure 1 [31,32]. The Zhengzhou Ring Expressway (G3001) in China was selected as the test route. The transiting test device was mainly composed of a roof test platform and in-vehicle collection systems. The test roof platform was mainly used to fix the test model and pitot tube. The in-vehicle acquisition system mainly included a synchronous measurement system for multipoint high-frequency dynamic wind pressure, a balance force measurement system, and a driving wind measurement system using the pitot tube. The combination of the force measurement system and the pressure measurement system were used for the aerodynamic coefficients. The speed of the vehicle was cruise controlled in the range of 60–120 km/h.
As shown in Figure 2a, the triangular prism model [8] was made of organic glass to ensure that the model has sufficient strength and rigidity and did not deform without the clear vibration phenomena in the force and pressure measurement tests. The thickness of the model and end plate were 3 and 5 mm, respectively. The diameter pressure-measuring hole (1.5 mm) was arranged at the mid-span section. The pressure measurement pipeline system consisted of a short brass tube and a PVC hose, which was directly connected to the pressure sensor to ensure the firm connection of the nozzle. The isosceles triangular prism model had a width of 0.145 m, a height of 0.100 m, and an apex angle of 30°. The pressure measuring points are arranged on the center of symmetry. The pressure tap and the model surface numbers are shown in Figure 2b.

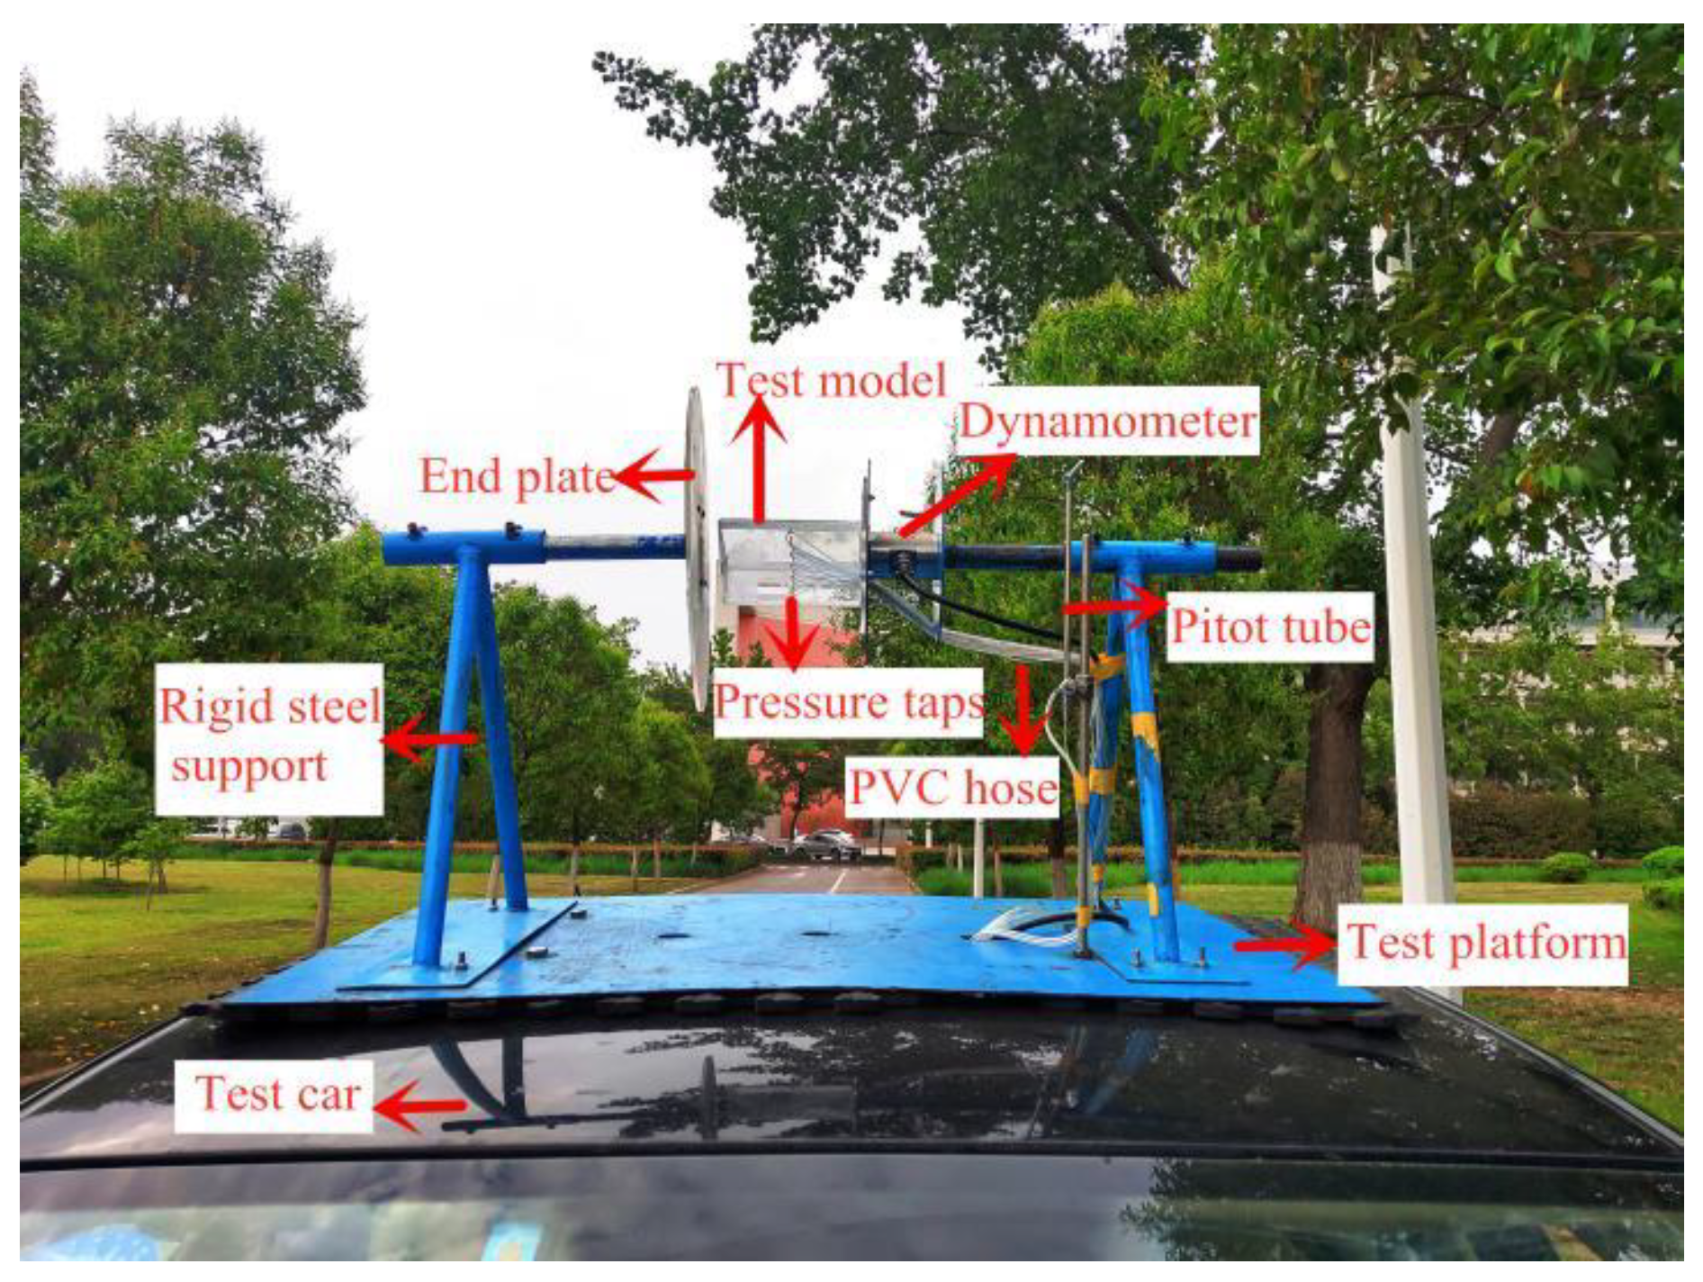
2.2. Equipment and Data Acquisition System

The test measured both the dynamic balance force and the pressure distribution along the circumferential direction [47] to determine the coefficients of the triangular prism model [7]. Pressure taps and aerodynamic force conventions agreement are shown in Figure 3.
The system of measuring the aerodynamic force was composed of the three-component force and intelligent display acquisition equipment. As shown in Figure 1, a balance (NOS-C901) was used to collect the axial force in the X- and Y-axis directions in real time, and the acquisition equipment (MCK-F) was used to collect and record data. The MCK-F acquisition instrument was connected to the computer via USB. The precision of the system was approximately ±0.03%. In this test, the maximum sampling frequency was 30 Hz, and the range was ±150 N. The single-channel accuracy was 0.5%, and the comprehensive force measurement accuracy was better than 2.5%.
The system of measuring the aerodynamic pressure distribution was also composed of pressure sensors and data acquisition equipment. Twenty differential high-frequency dynamic pressure sensors (YMC41) were selected under strict conditions, and a 32-channel data acquisition (USB2805C) card was used to collect data synchronously, as shown in Figure 1. In addition, the ranges of the high frequency dynamic pressure sensors of YMC41 differential were ±2 Kpa, and its accuracy grade was 0.25%, with a frequency up to 4 KHz. The maximum sampling frequency of the USB2805C data acquisition card was up to 250 KHz, and its system accuracy was 0.01%, which was suitable for the storage and management of the wind pressure data.
The system of measuring wind field speed consisted of two high-frequency dynamic pressure sensors of YMC41 differentials combined with an L-shaped pitot tube. The two pressure sensors were connected to the total pressure and static pressure holes of the pitot tube to obtain the total pressure and static pressure of the wind field generated by the moving vehicle. The dynamic pressure was converted to the reference wind speed by using the Bernoulli formula [31], and the static pressure could also be used as the reference static pressure for the dimensionless wind pressure coefficient. The sampling frequency of the acquisition system of high frequency dynamic wind pressure was 909 Hz.

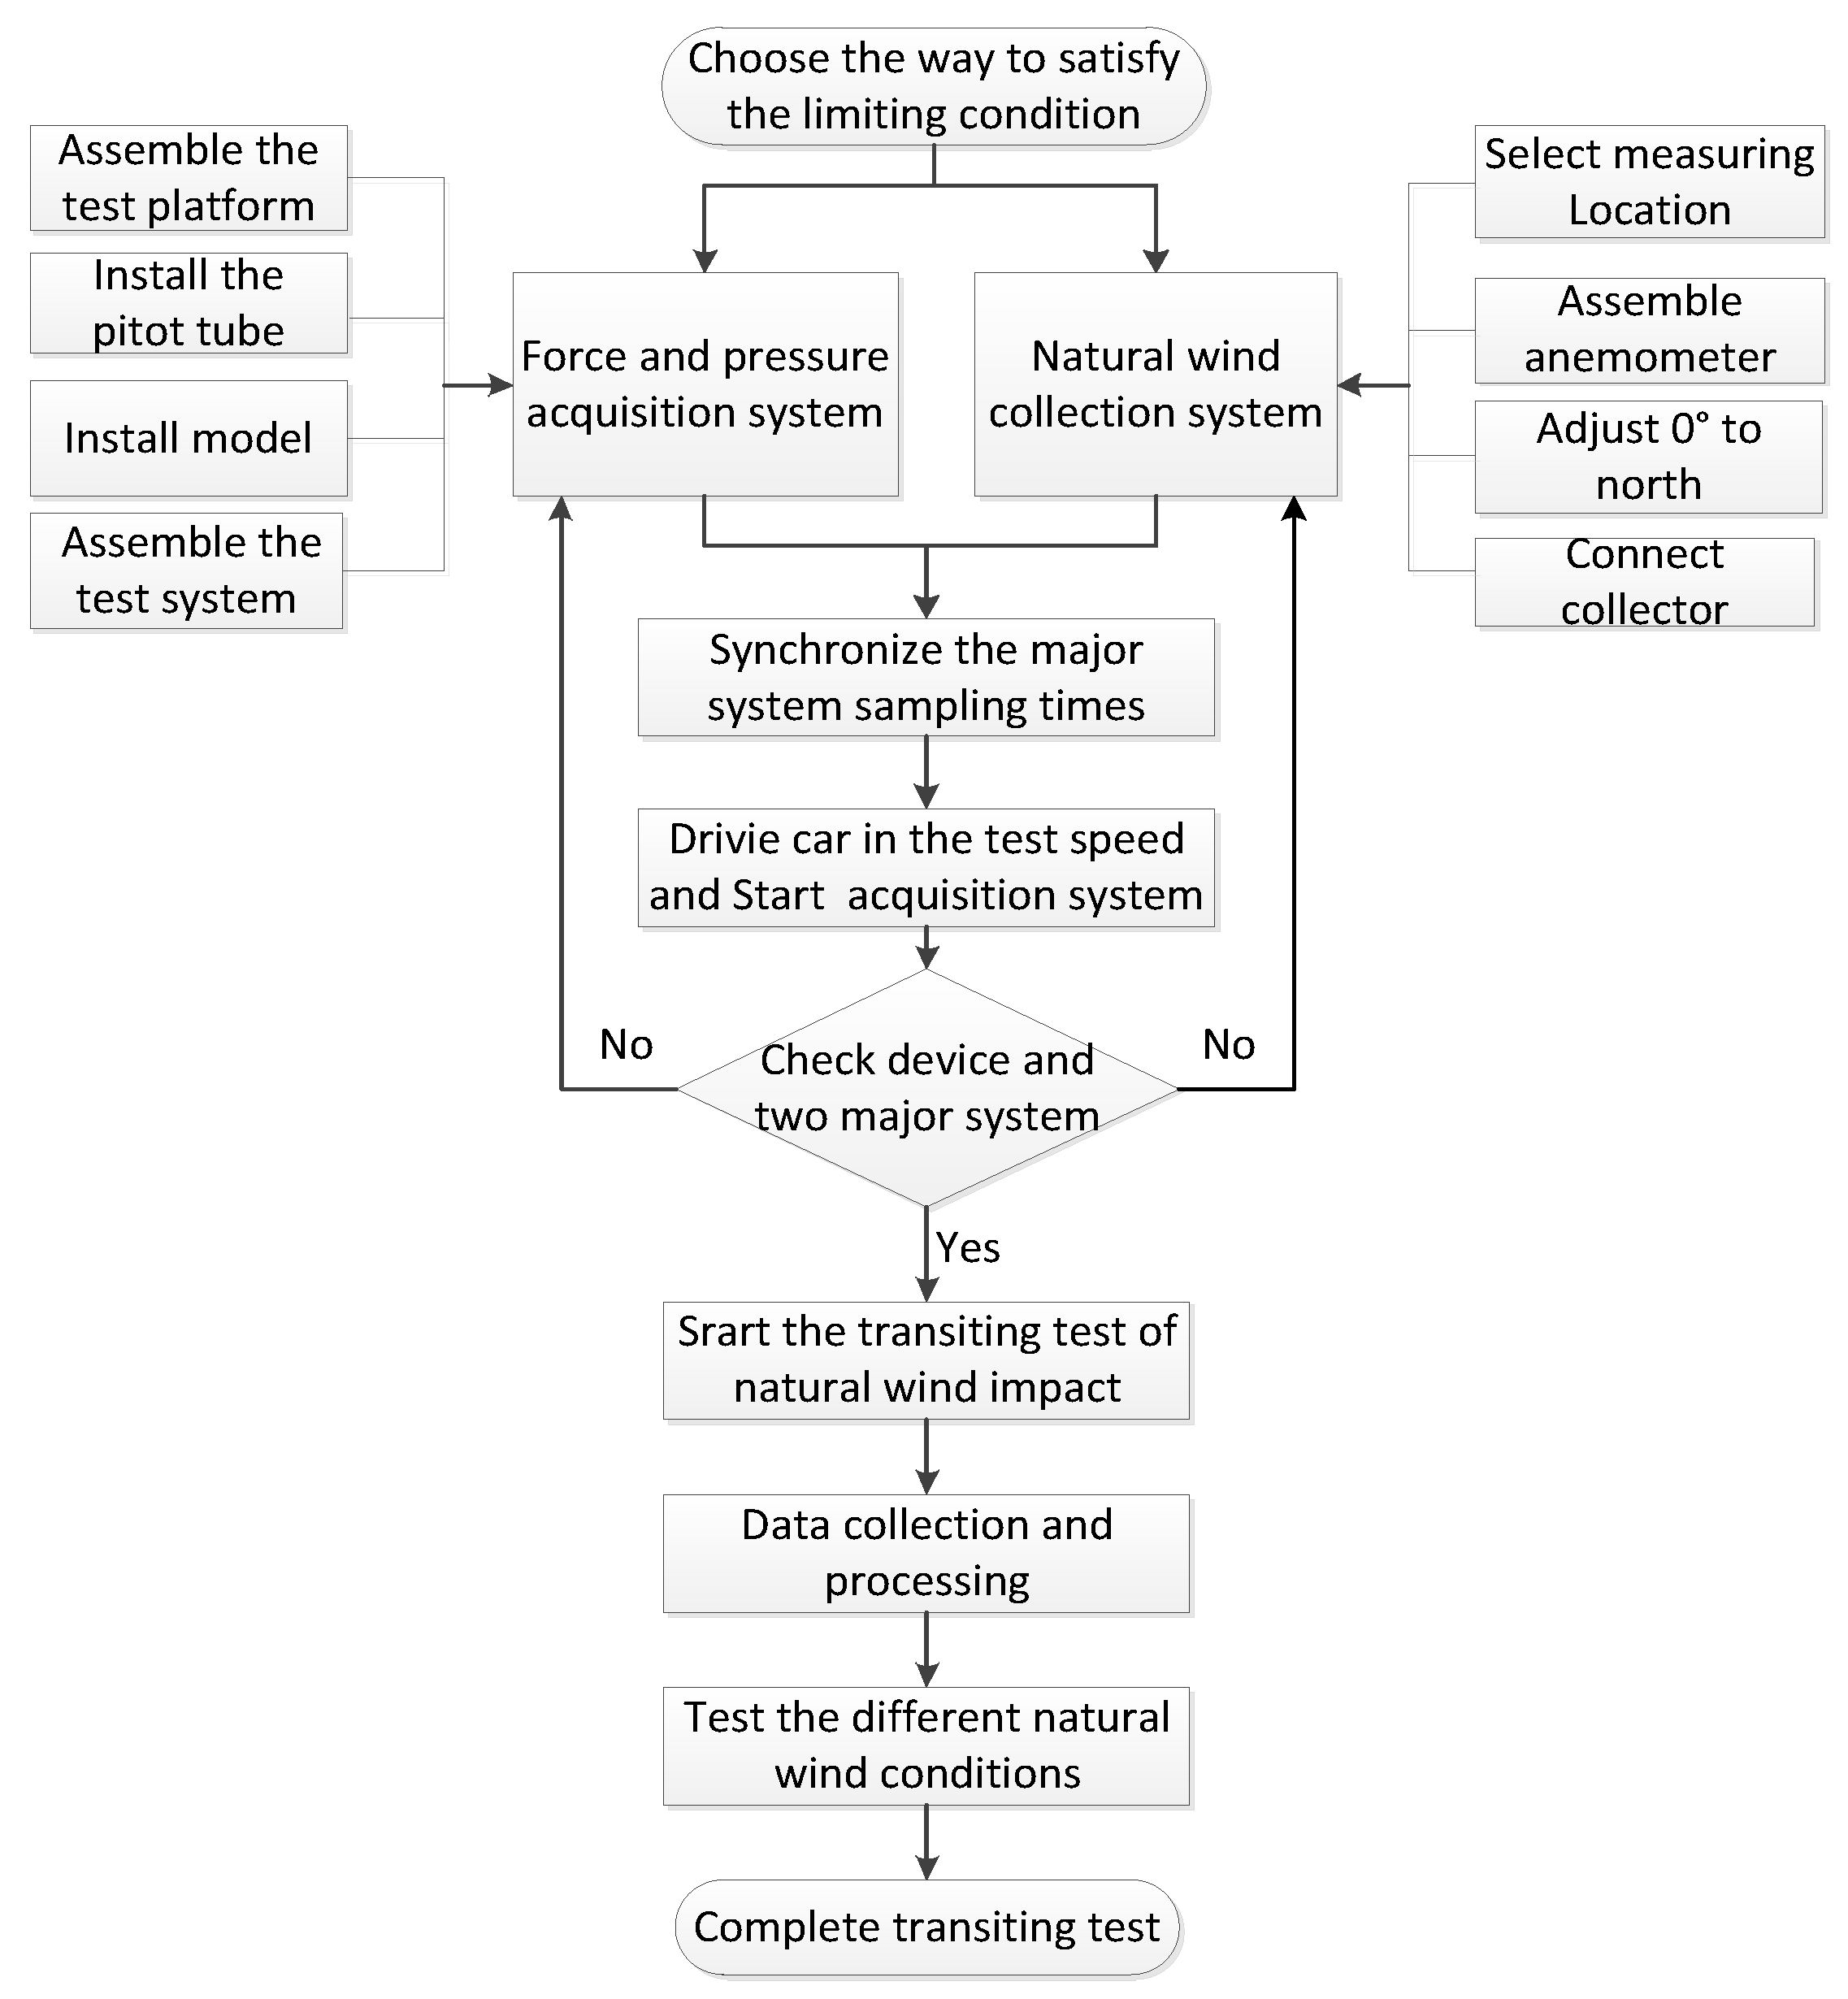
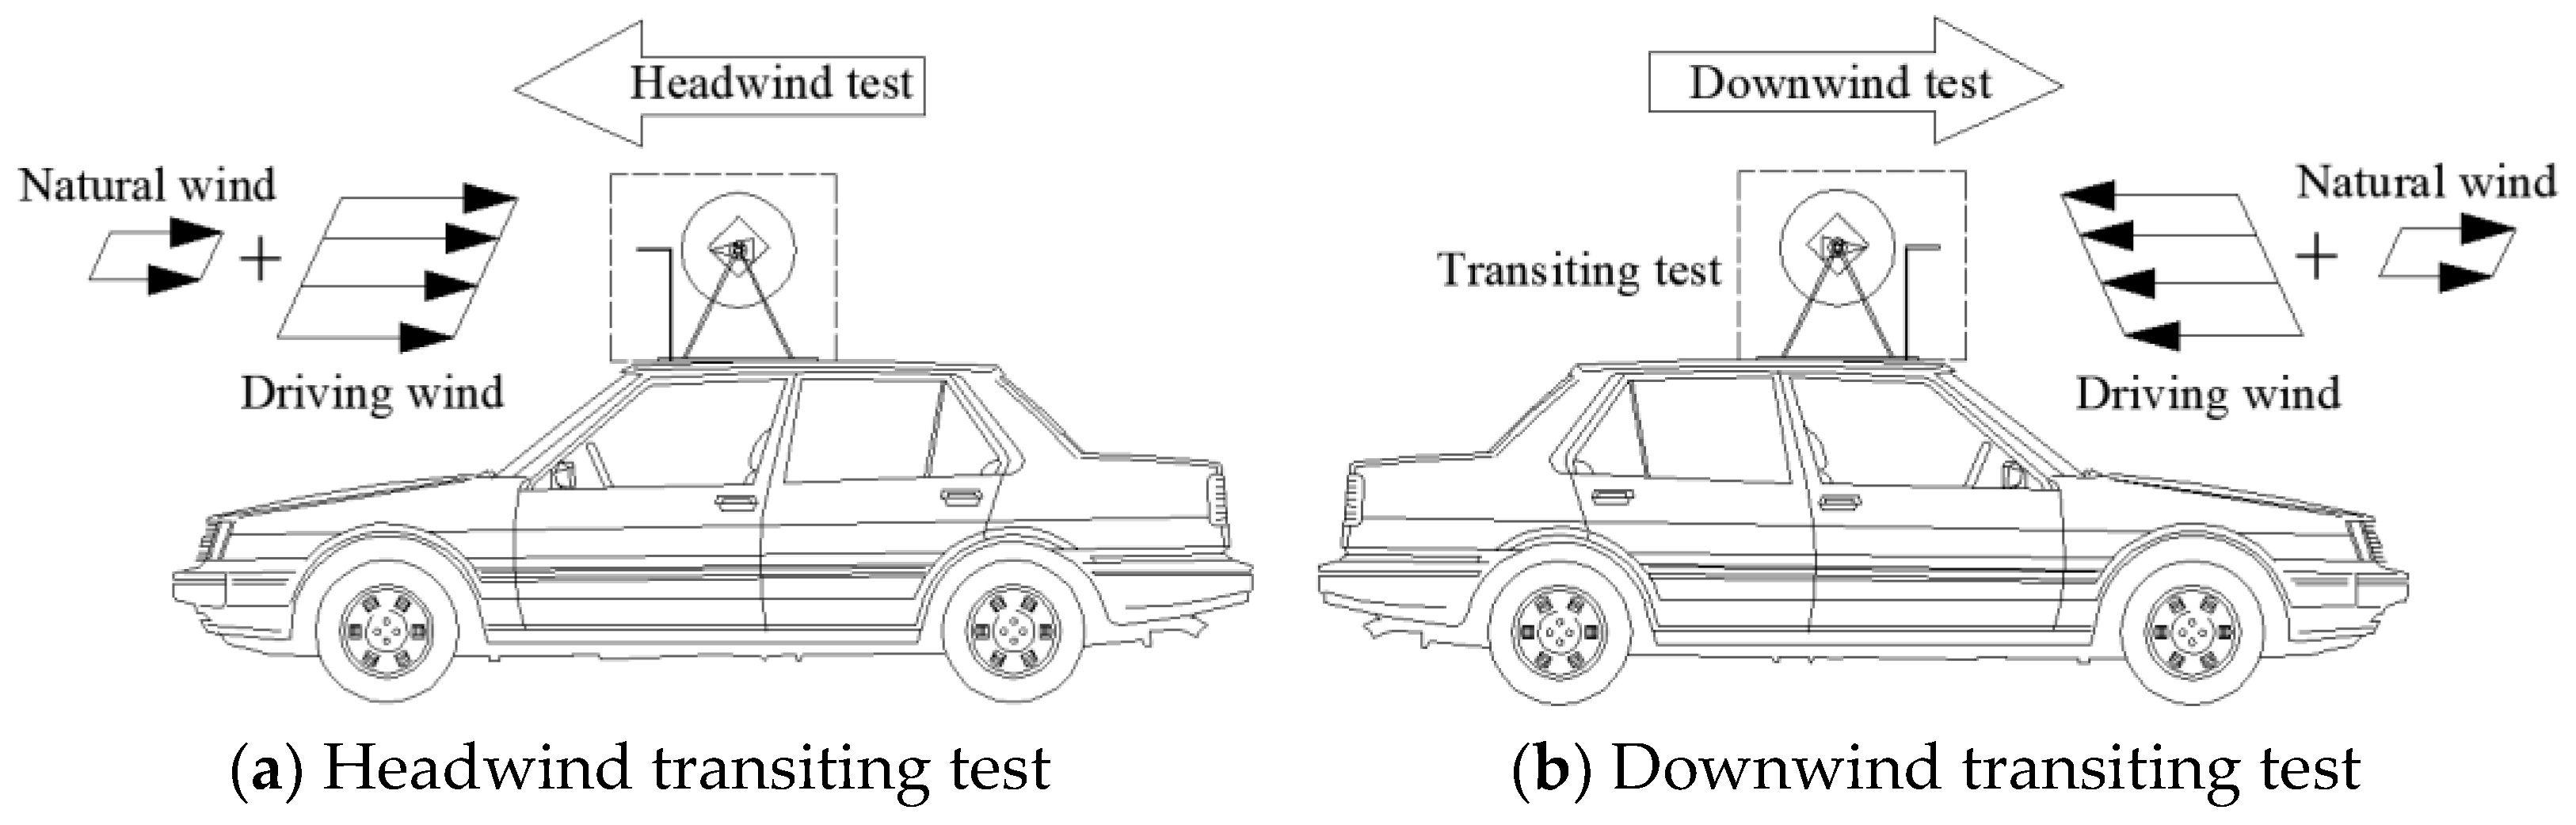
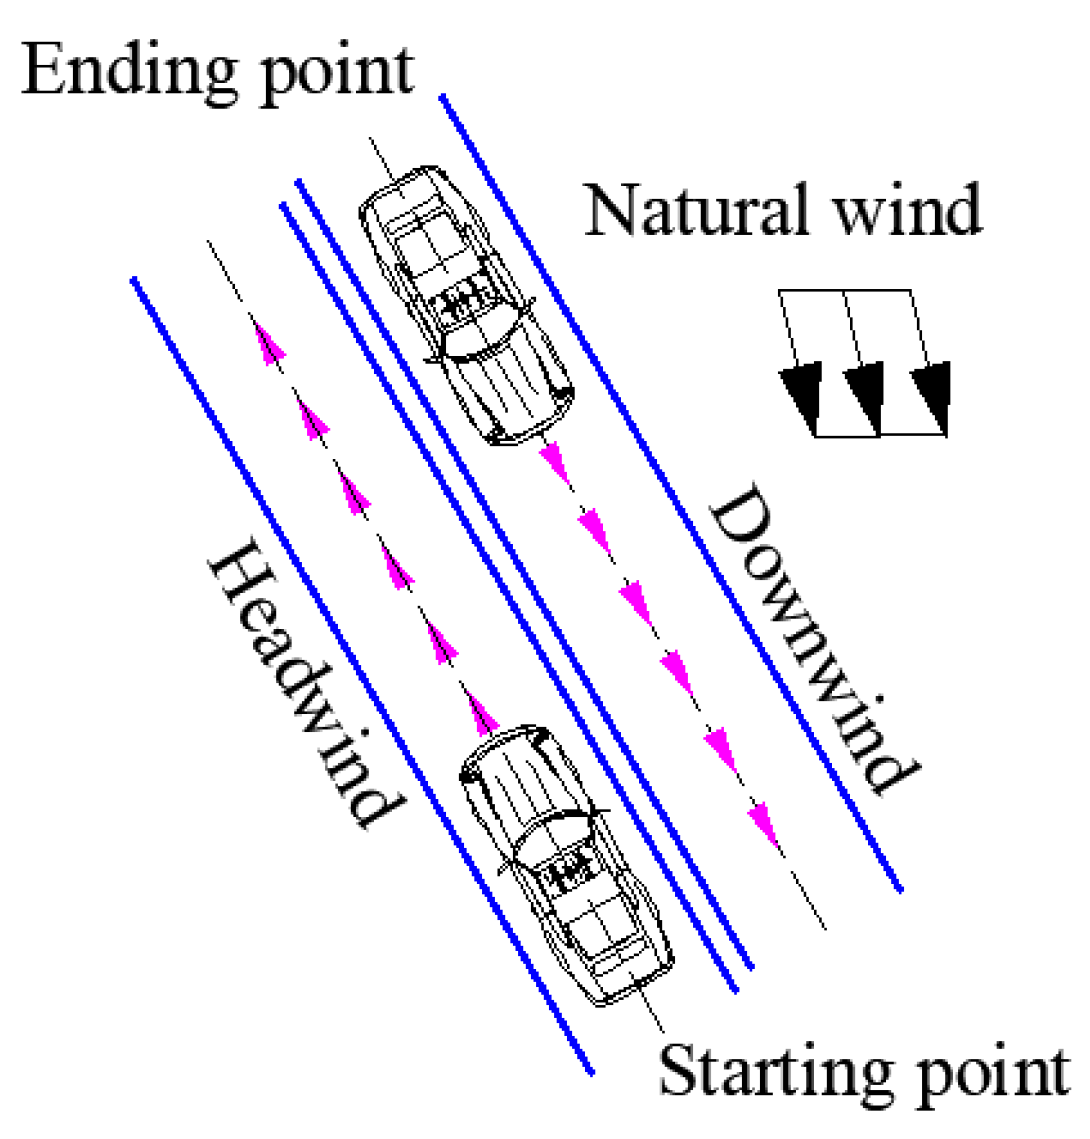
2.3. Test Methods and Strategies

To investigate the influence of natural wind on the test results of the aerodynamic coefficients, the transiting test must control all the experimental conditions, except natural wind, which is to remain unchanged. Hence, the test was conducted under different natural winds but in the same test route, model, and test vehicle environment under the same test road conditions. In addition, the transiting test system with the natural wind collection system should be synchronous. Natural wind was observed while the structural test was carried out. The test results of the transiting test obtained under the natural wind conditions were recorded and compared. The test procedure is illustrated in Figure 4.
The test route was fixedly selected from point Z of Zhongyuan West Road Station to point K of Kexue Avenue Station on the Zhengzhou G3001 Ring Expressway in China. The test route shown in Figure 5a is 6 km long. The road section is straight and flat, and the test was performed when vehicle traffic was light (see Figure 5b). The natural wind measurement position was fixed at a height of 10 m on the sidewalk at the intersection of the G3001 Ring Expressway and Zhengshang Road, as shown in Figure 5c,d. In the wind tunnel test [8], the wind speed was 20 m/s to ensure that the fixed cruise speed of the vehicle was set to 72 km/h (20 m/s). The speed of all the transiting tests were set to 72 km/h (20 m/s). The placement of the model was horizontal, and the wind angle conditions of 0° and 90° [48] were selected to verify the accuracy of the test results [47]. The data acquisition time was 100 s, and the test conditions are presented in Table 1.

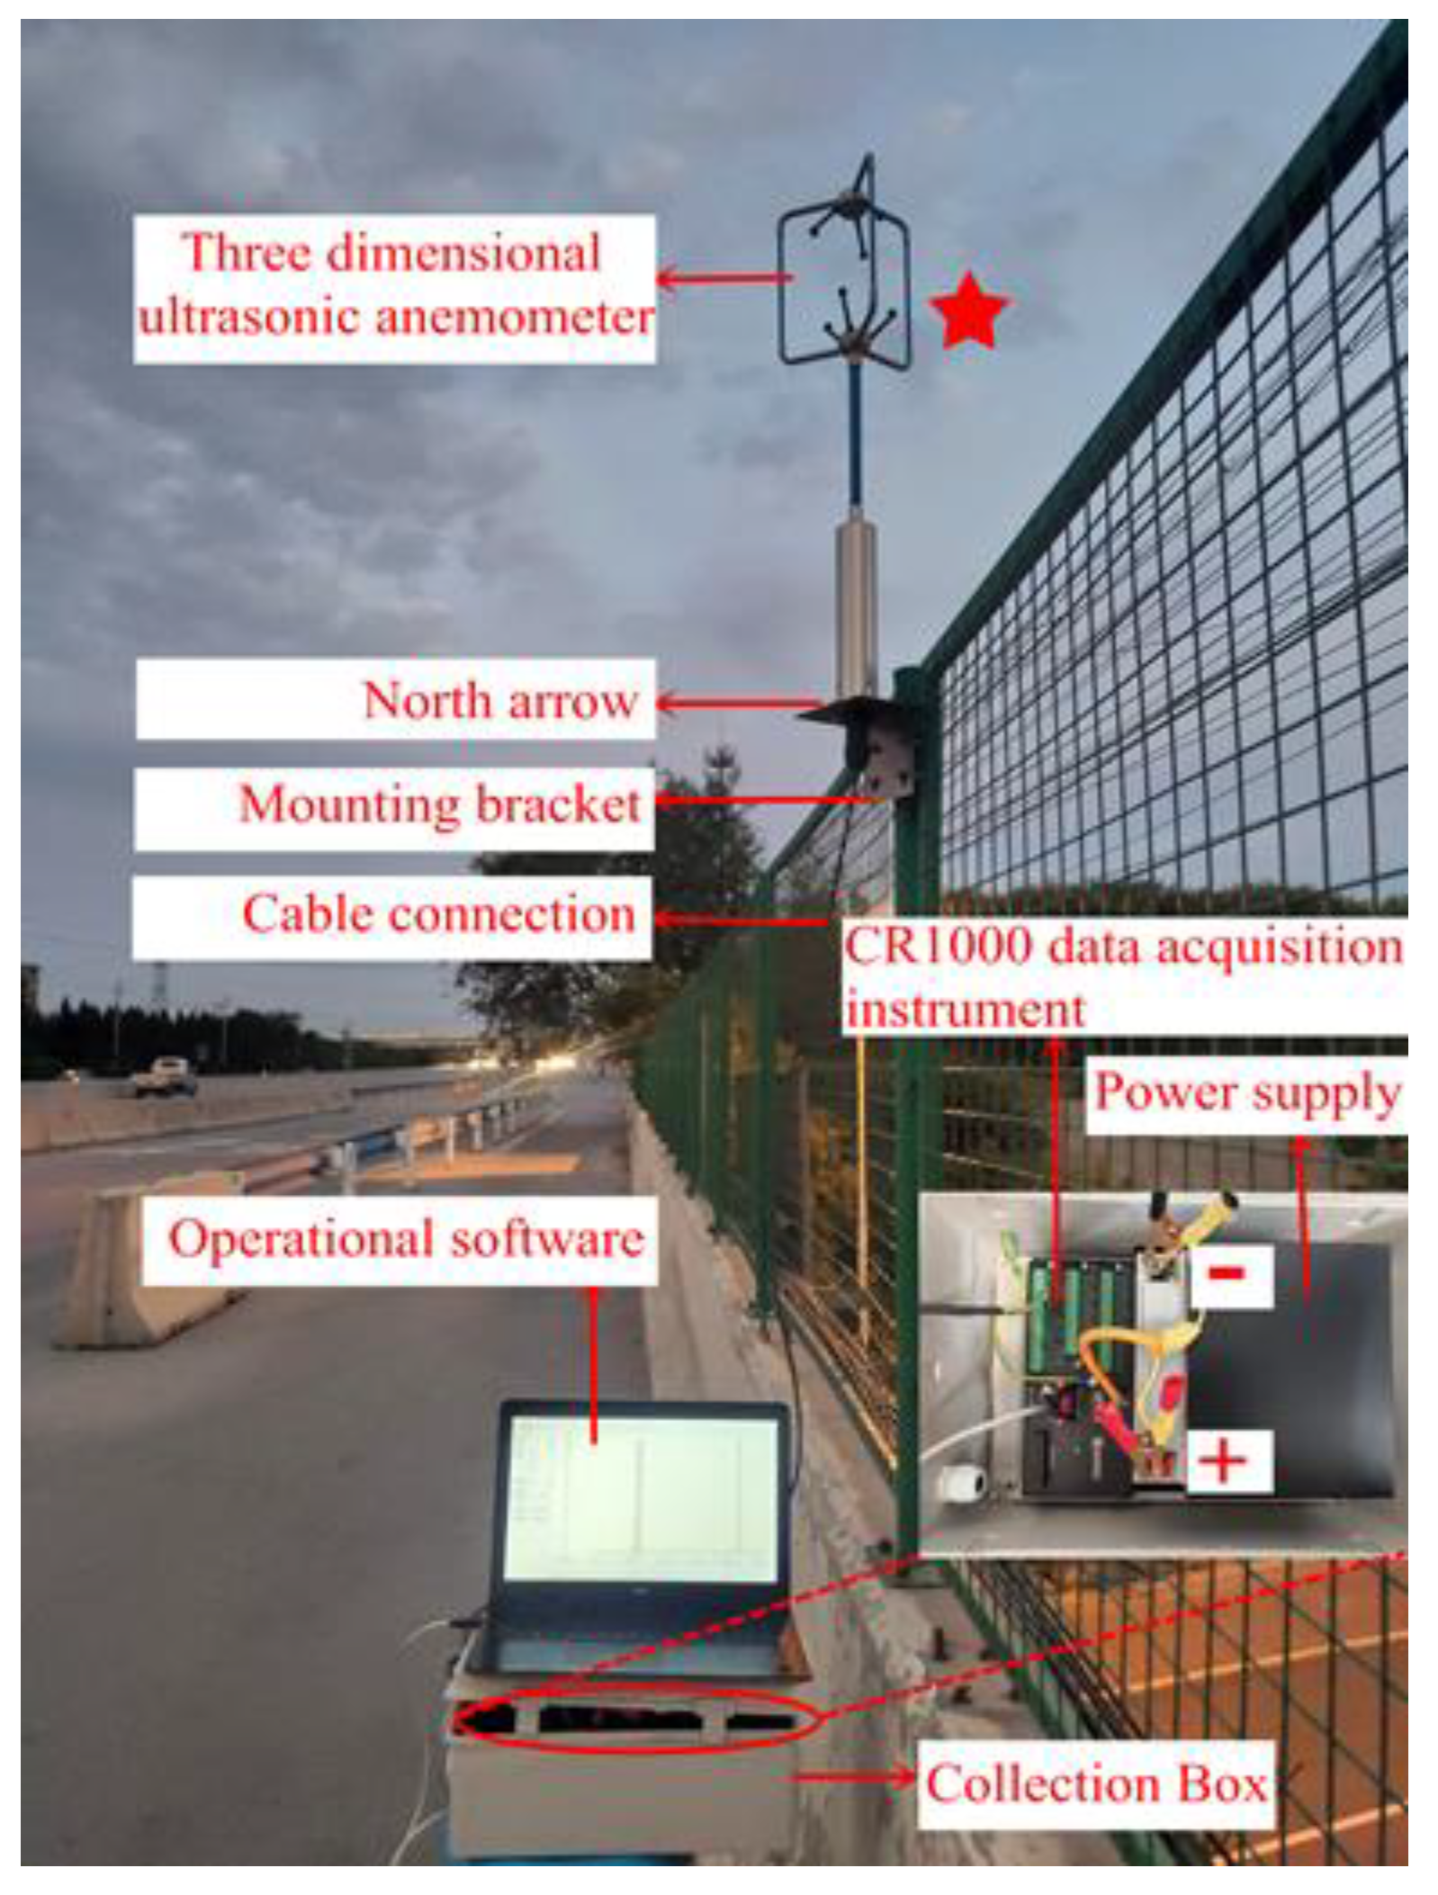
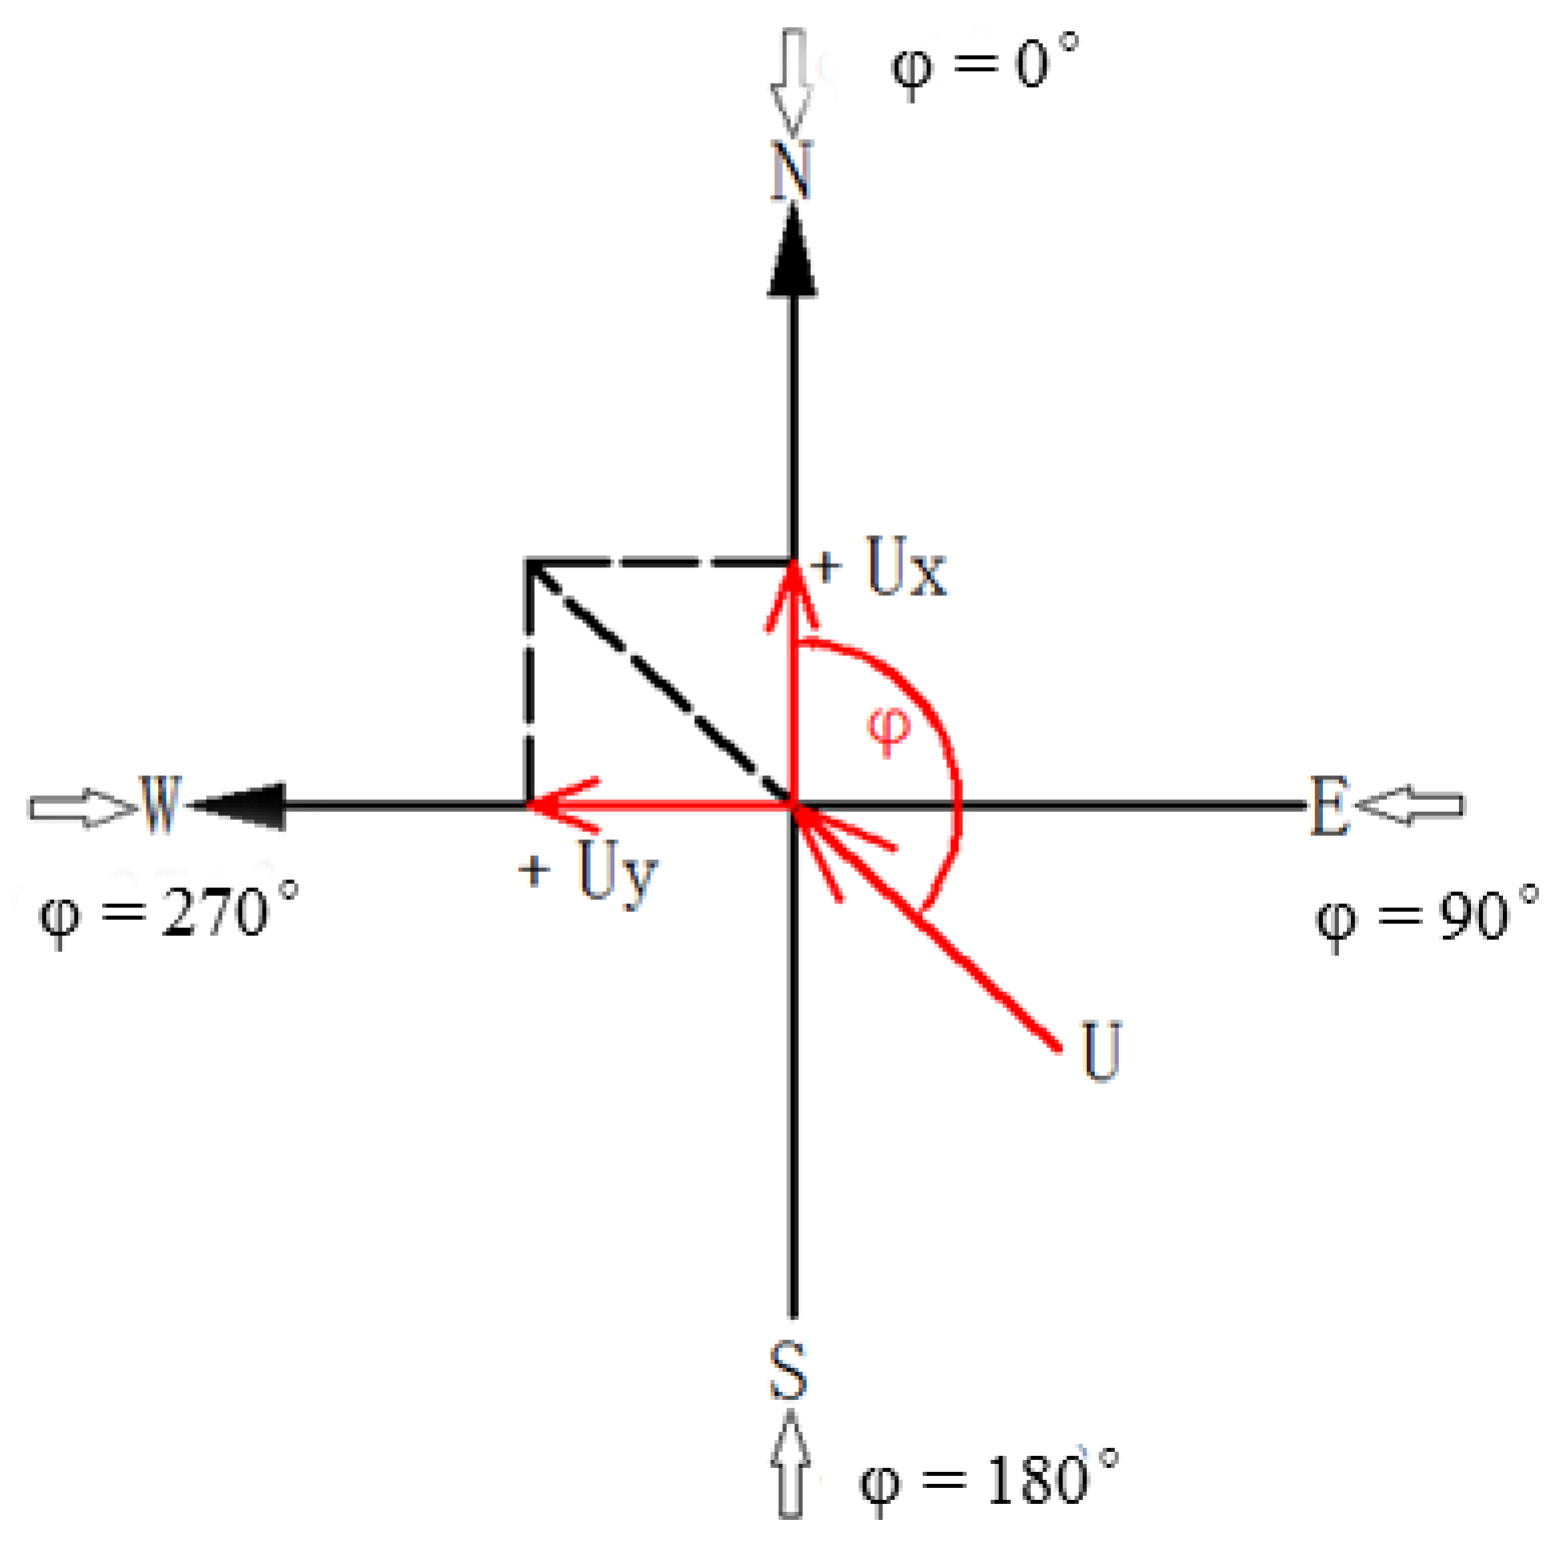
2.4. Measurement of Natural Wind

Natural wind is a space vector [35] that can be measured using a 3D ultrasonic anemometer [49]. As shown in Figure 6, the system test of natural wind collection was composed of a 3D ultrasonic anemometer (Wind Master; Gill Scientific, Inc.; Logan, UK), a data acquisition instrument (CR1000; Campbell Scientific, Inc.; Logan, UK), and a notebook computer. The natural wind-collecting device was assembled and installed at a height of 10 m at the fixed measuring location of the test (see Figure 5d and Figure 6). The 0° line of the anemometer pointed to the north, which was determined using the north arrow. The sampling frequency was set to 10 Hz, and the wind speed resolution and wind speed range were 0.01 and 0–50 m/s, respectively. The accuracy was <1.5% RMS.
Natural wind is the result of the combined effect of air movement and terrain roughness in time and space [50]. For the description of the natural wind environment in an area with consistent terrain, the wind speed at a height of 10 m in the area is generally counted, and the average value within 10 min of each sampling is taken [35,51,52]. In this paper, the fixed natural wind measurement point was arranged at a height of 10 m above the surface of the test road in an open position in the middle of the test road. In each test, the average wind speed of 10 min was used as the standard to describe the natural wind conditions. The terrain of the area where the test road was located was consistent and belonged to the type-C-terrain profile [53]. Moreover, the collection time of natural wind data was synchronized with the collection time of the transiting test data. Therefore, the natural wind data measured at the fixed measuring point represented the natural wind environment of the area where the test road was located.

3. Analysis of Data

3.1. Data of Force

All the acquired data were reduced and analyzed using the following expressions.
The aerodynamic force (drag and lift) coefficients of the test model are expressed as follows:
C d = 2 D ρ V 2 b l ,
C l = 2 L ρ V 2 b l ,
where D is the drag, L is the lift, ρ is the air density (ρ = 1.225 kg/m3), and b and l are the chord and span dimensions of the test model, respectively.
The pitot tube was used to measure the dynamic pressure of the wind field through the Bernoulli formula. In the transiting test, the driving wind speed of the vehicle is represented by the following equation:
V = 2 ( p 0 p ) ρ ,
where V is the driving wind of the moving vehicle, p 0 is the total pressure, p is the static pressure, and ρ is the air density. By substituting Formula (3) into Formula (1) and (2), the expression of the drag and lift coefficients is obtained as follows:
C d = D ( p 0 p ) b l ,
C l = L ( p 0 p ) b l ,
In addition, C d and C l are the standard deviations of C d and C l and represent the fluctuating drag and lift coefficient, respectively.

3.2. Data of Pressure

The wind pressure on the surface of the model is usually expressed by the aerodynamic pressure coefficient. The data of pressure time history, measured by the transiting test, are statistically analyzed to obtain the mean wind pressure coefficient, which is expressed as follows:
C p i = p i p P 0 P ,
The fluctuating aerodynamic pressure coefficient is expressed as follows:
C p i = 1 N 1 k = 1 N ( C p i k C p i , m e a n ) 2 ,
The mean aerodynamic pressure coefficient absolute deviation is expressed as follows [17]:
β = 1 20 | ( C p i , m e a n C p , m e a n ) / C p , m e a n | 20 × 100 % ,
where C p i is the mean wind pressure coefficient, C p i is the fluctuating wind pressure coefficient, p 0 and p are the total pressure and static pressure at the reference height, p i ( t ) is the wind pressure of measuring point, T is the sampling time, and N is the number of samples.

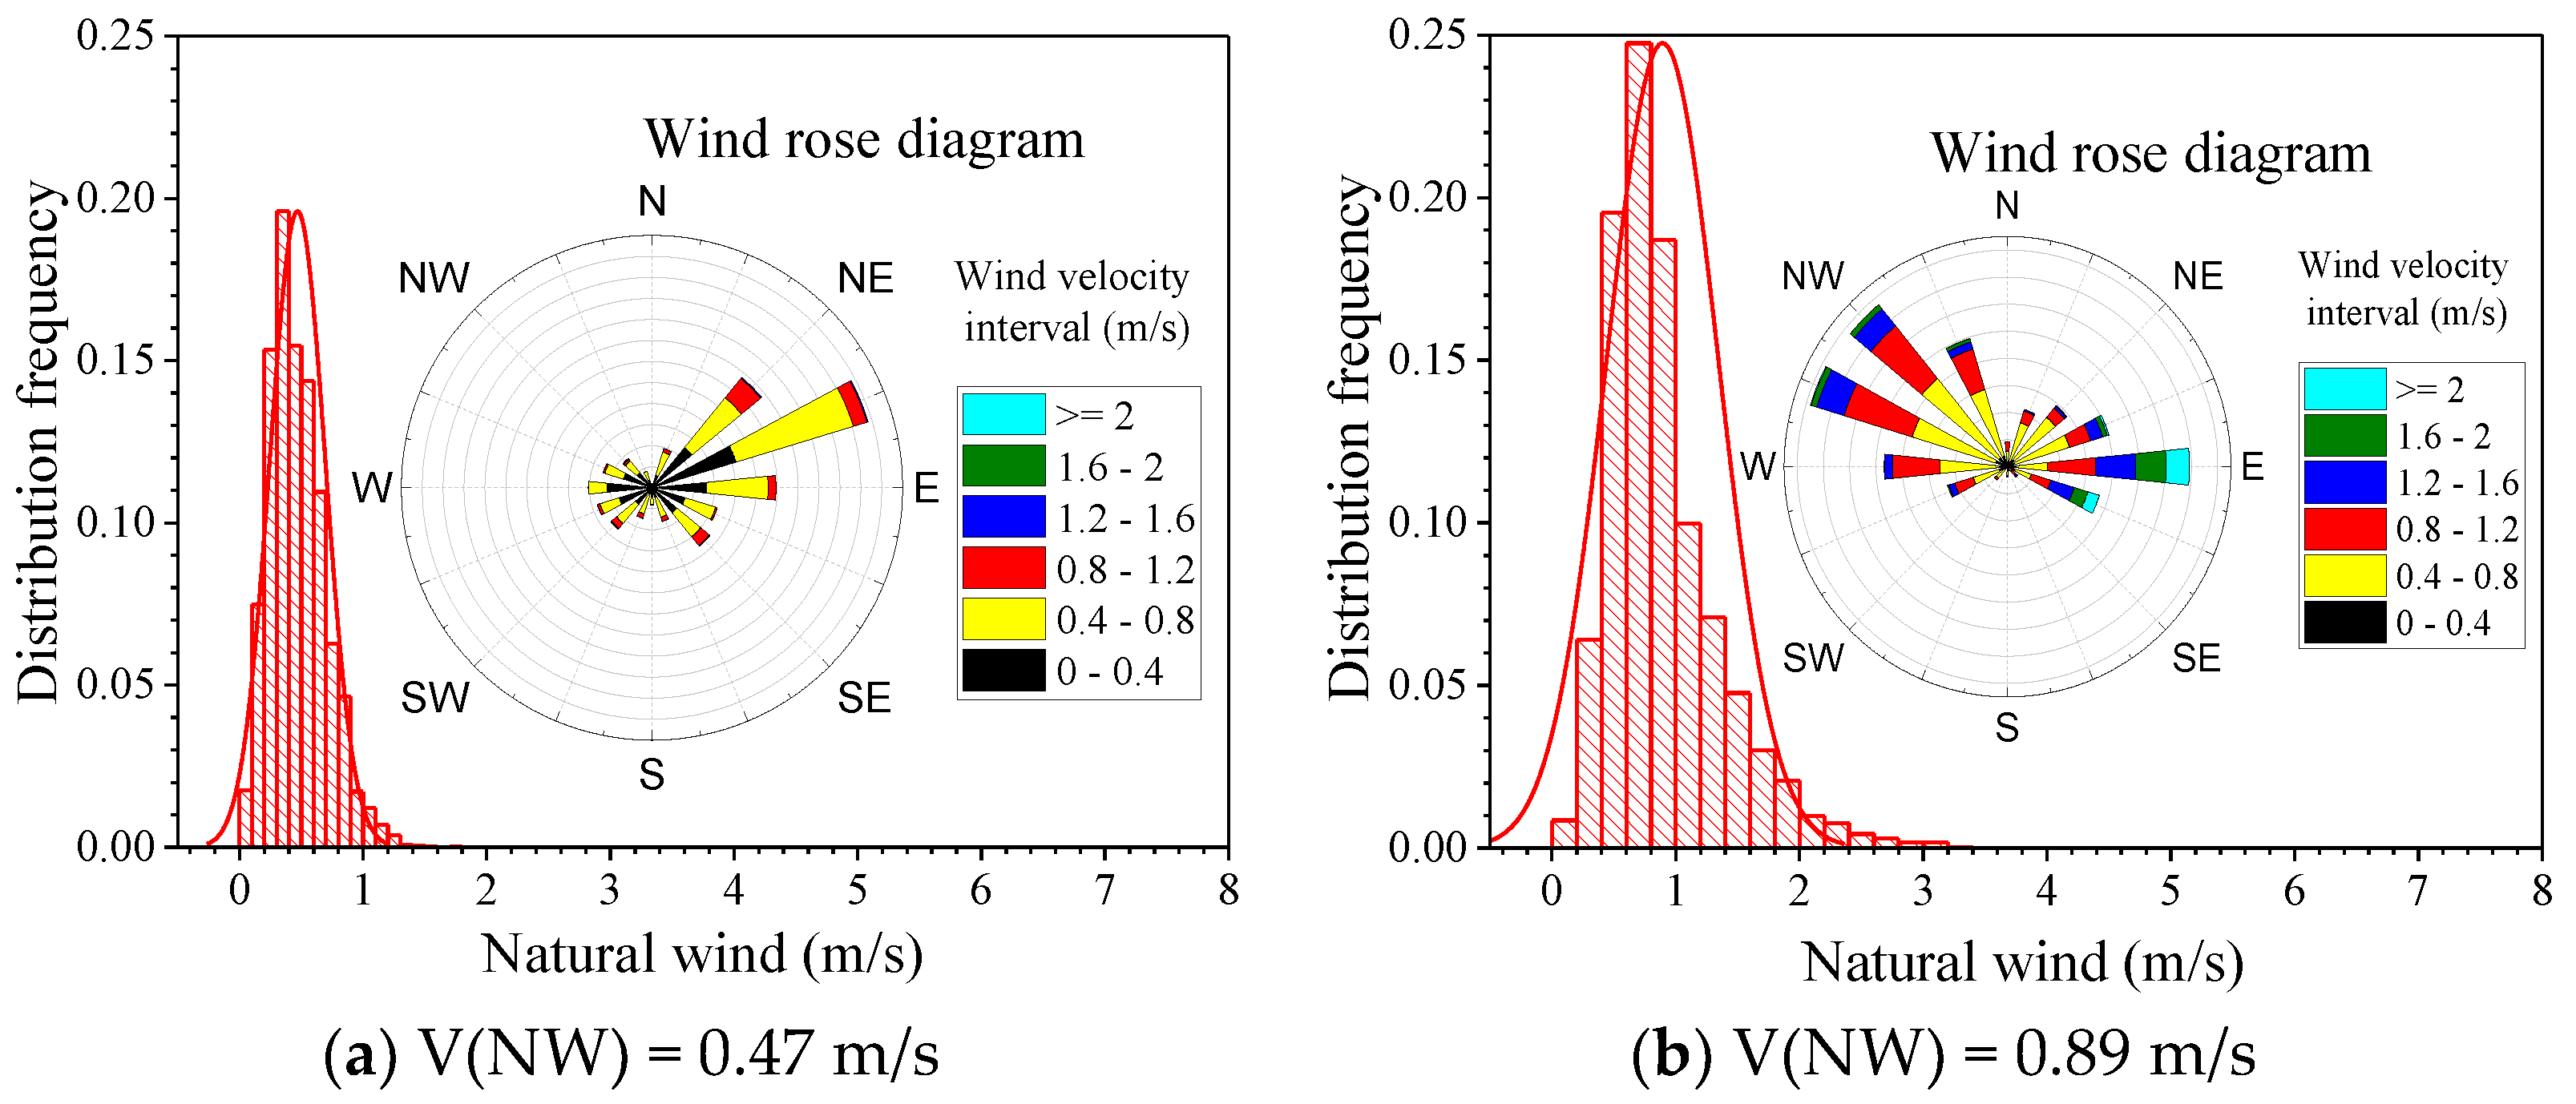
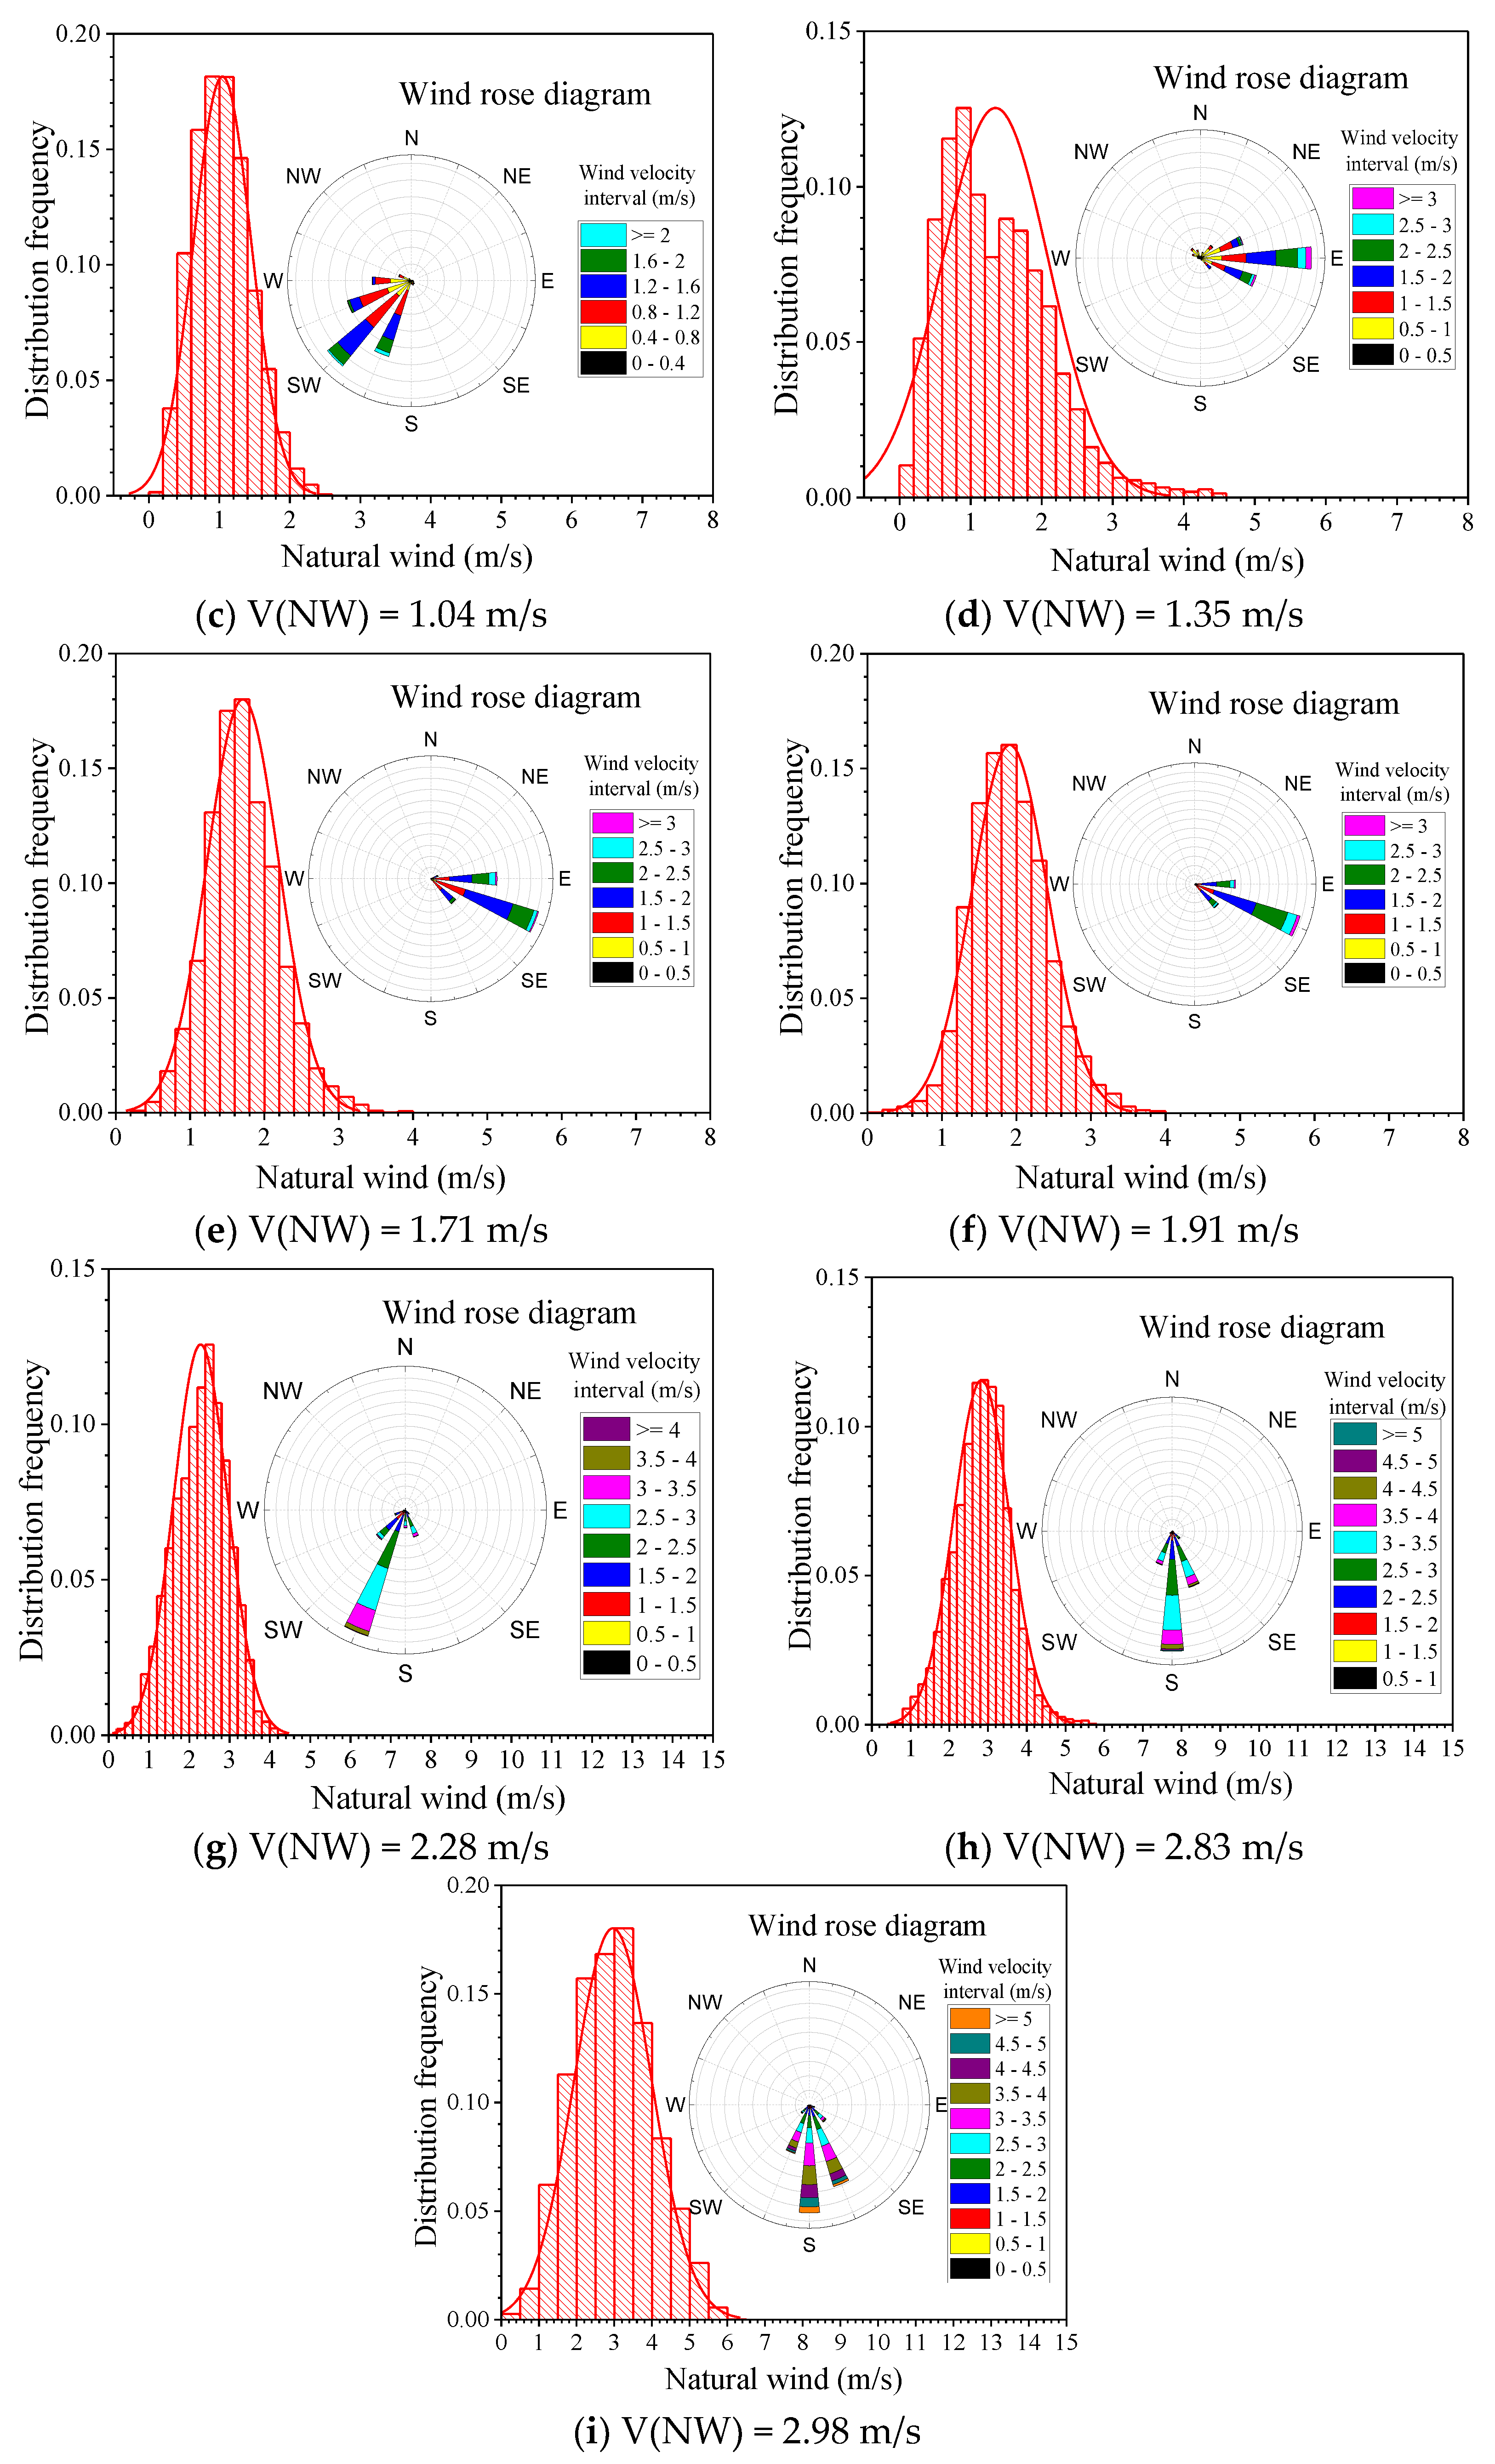
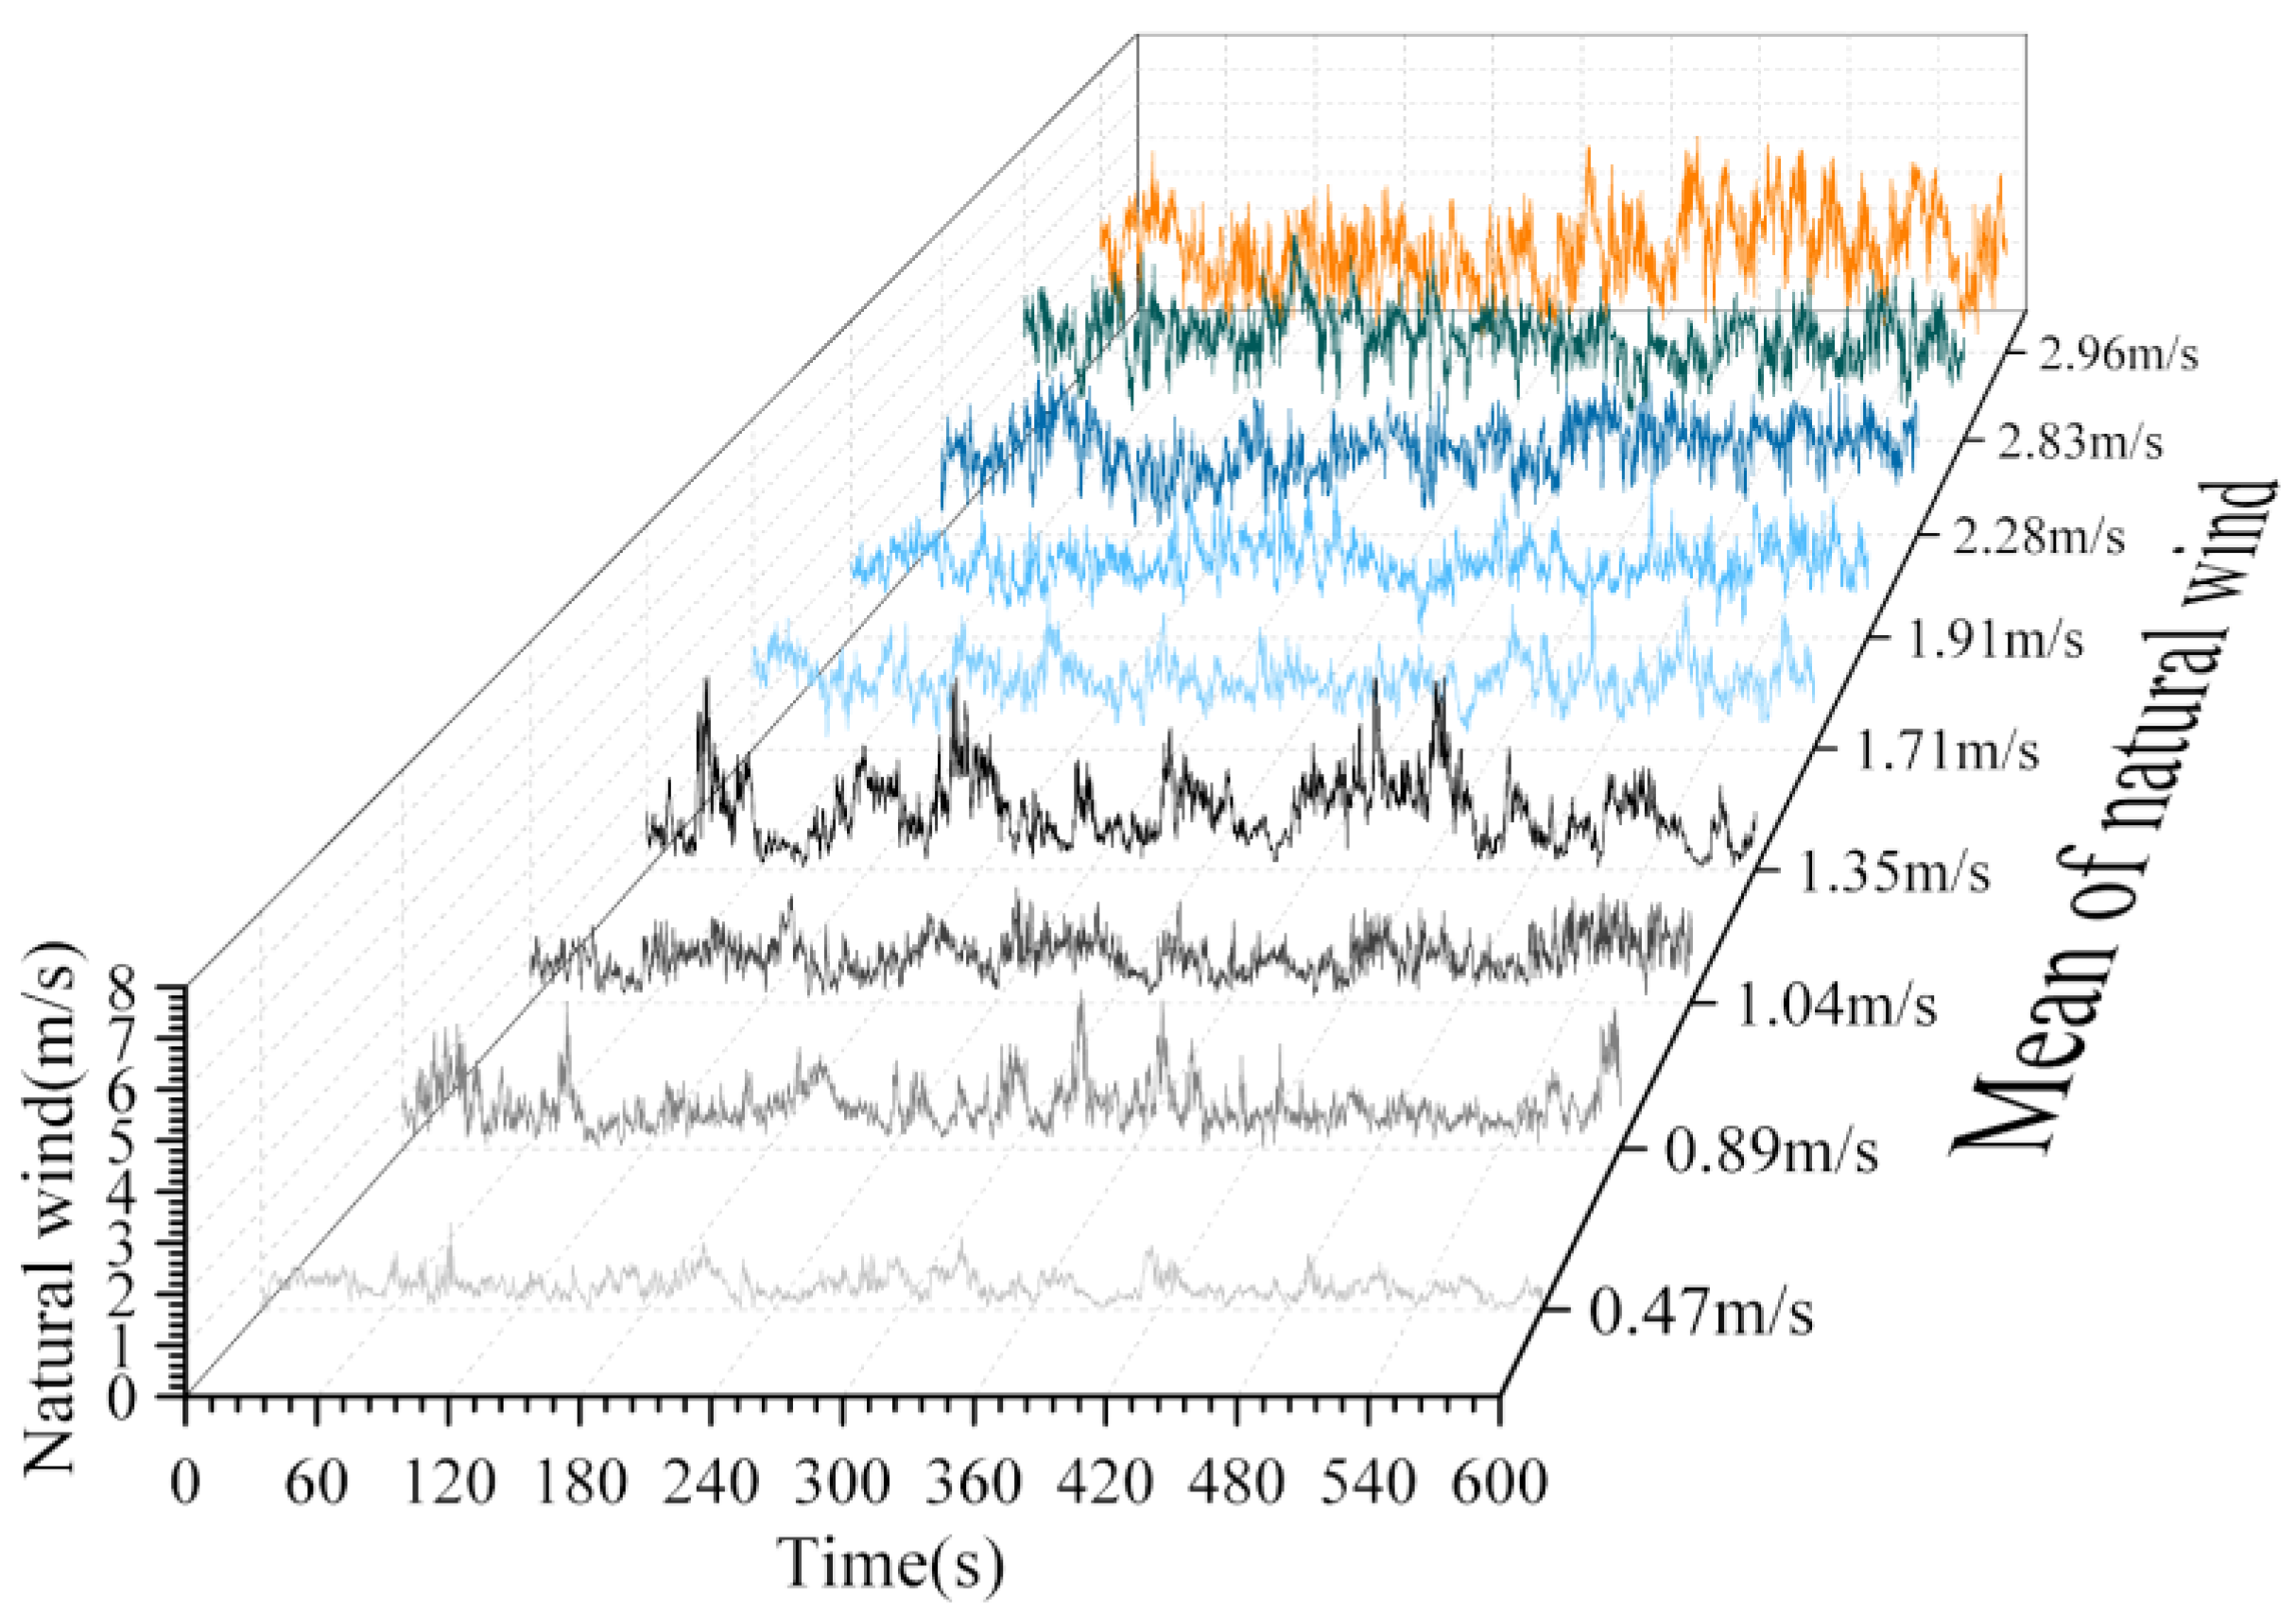
3.3. Data of Natural Wind

The 3D ultrasonic anemometer was fixed at the wind measurement point to record the surrounding natural wind speed. Natural wind can be regarded as a 3D vector, in which the three components can be expressed in the north–south U X ( t ) , east–west U Y ( t ) , and vertical U Z ( t ) directions. The wind angle of natural wind in the vertical direction is extremely small, and the wind direction is consistent with the horizontal direction. Thus, U Z ( t ) is negligible. The natural wind velocity V ( N W ) of the horizontal wind direction φ is expressed as follows [35]:
V ( N W ) = U = U X 2 + U Y 2 ,
φ = arccos ( U X U ) sgn ( U Y ) + 180 ° .
As shown in Figure 7, to describe the natural wind direction, we superimpose the coordinate system of the anemometer onto the the geographic coordinate system, that is, the 0 scale of the anemometer points to the north, and natural wind is analyzed with the basic wind speed of 10 min [35].
To explore the influence of natural wind on the transiting test, a comparative analysis of the test results of the same transiting tests under different natural wind conditions were carried out. Figure 8a–i show the wind speed distribution and wind rose diagram of the surrounding natural winds during the transiting tests, which were carried out at nine different natural wind conditions of different dates. These nine natural wind speed time–history curves, shown in Figure 9, are sufficient in representing the natural wind environment that can be encountered in the daily transiting tests. These nine kinds of natural winds are used to compare the effects of natural wind on the transiting test. When natural wind is large, the main wind direction is southerly (the K–Z route is headwind, and the Z–K is downwind); when the average value of natural wind speed is small, the main wind direction is not displayed. Hence, the wind speed distribution is scattered, and the wind direction is ignored at this moment. As shown in Table 2, the nine types of working conditions all take the mean wind speed of the natural wind as the main wind speed, and the main wind speed is between 0–3.0 m/s.

4. Results

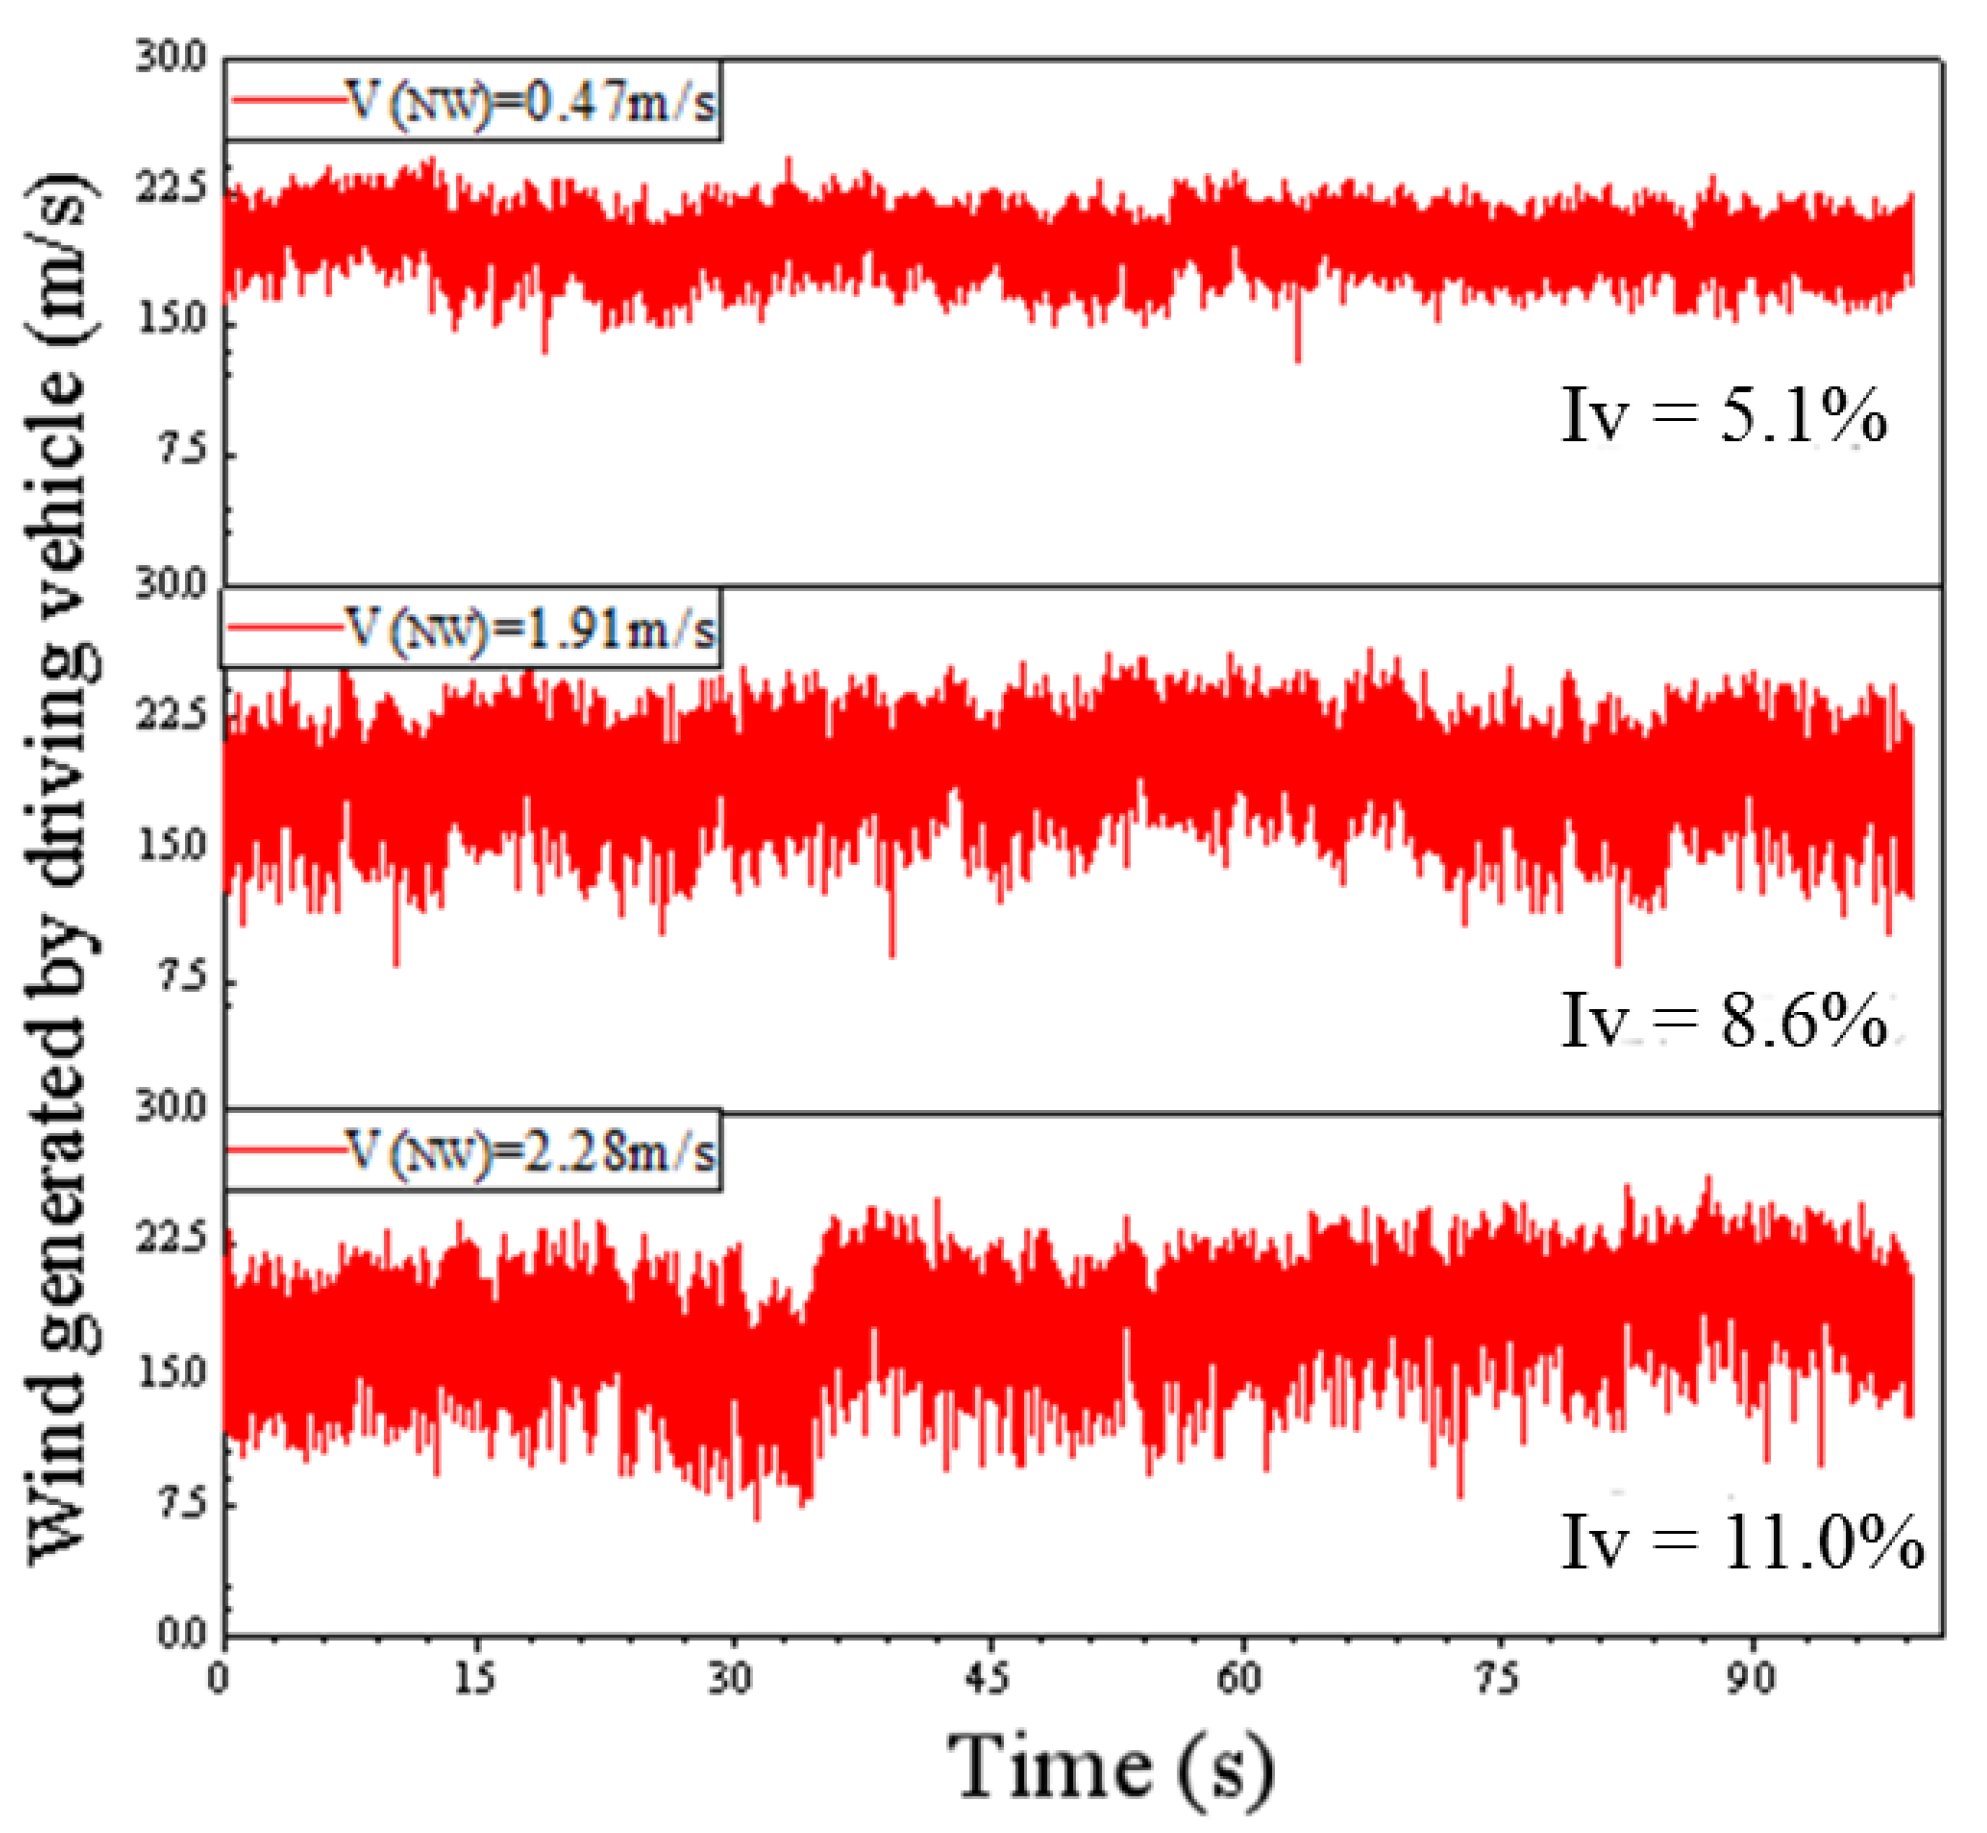
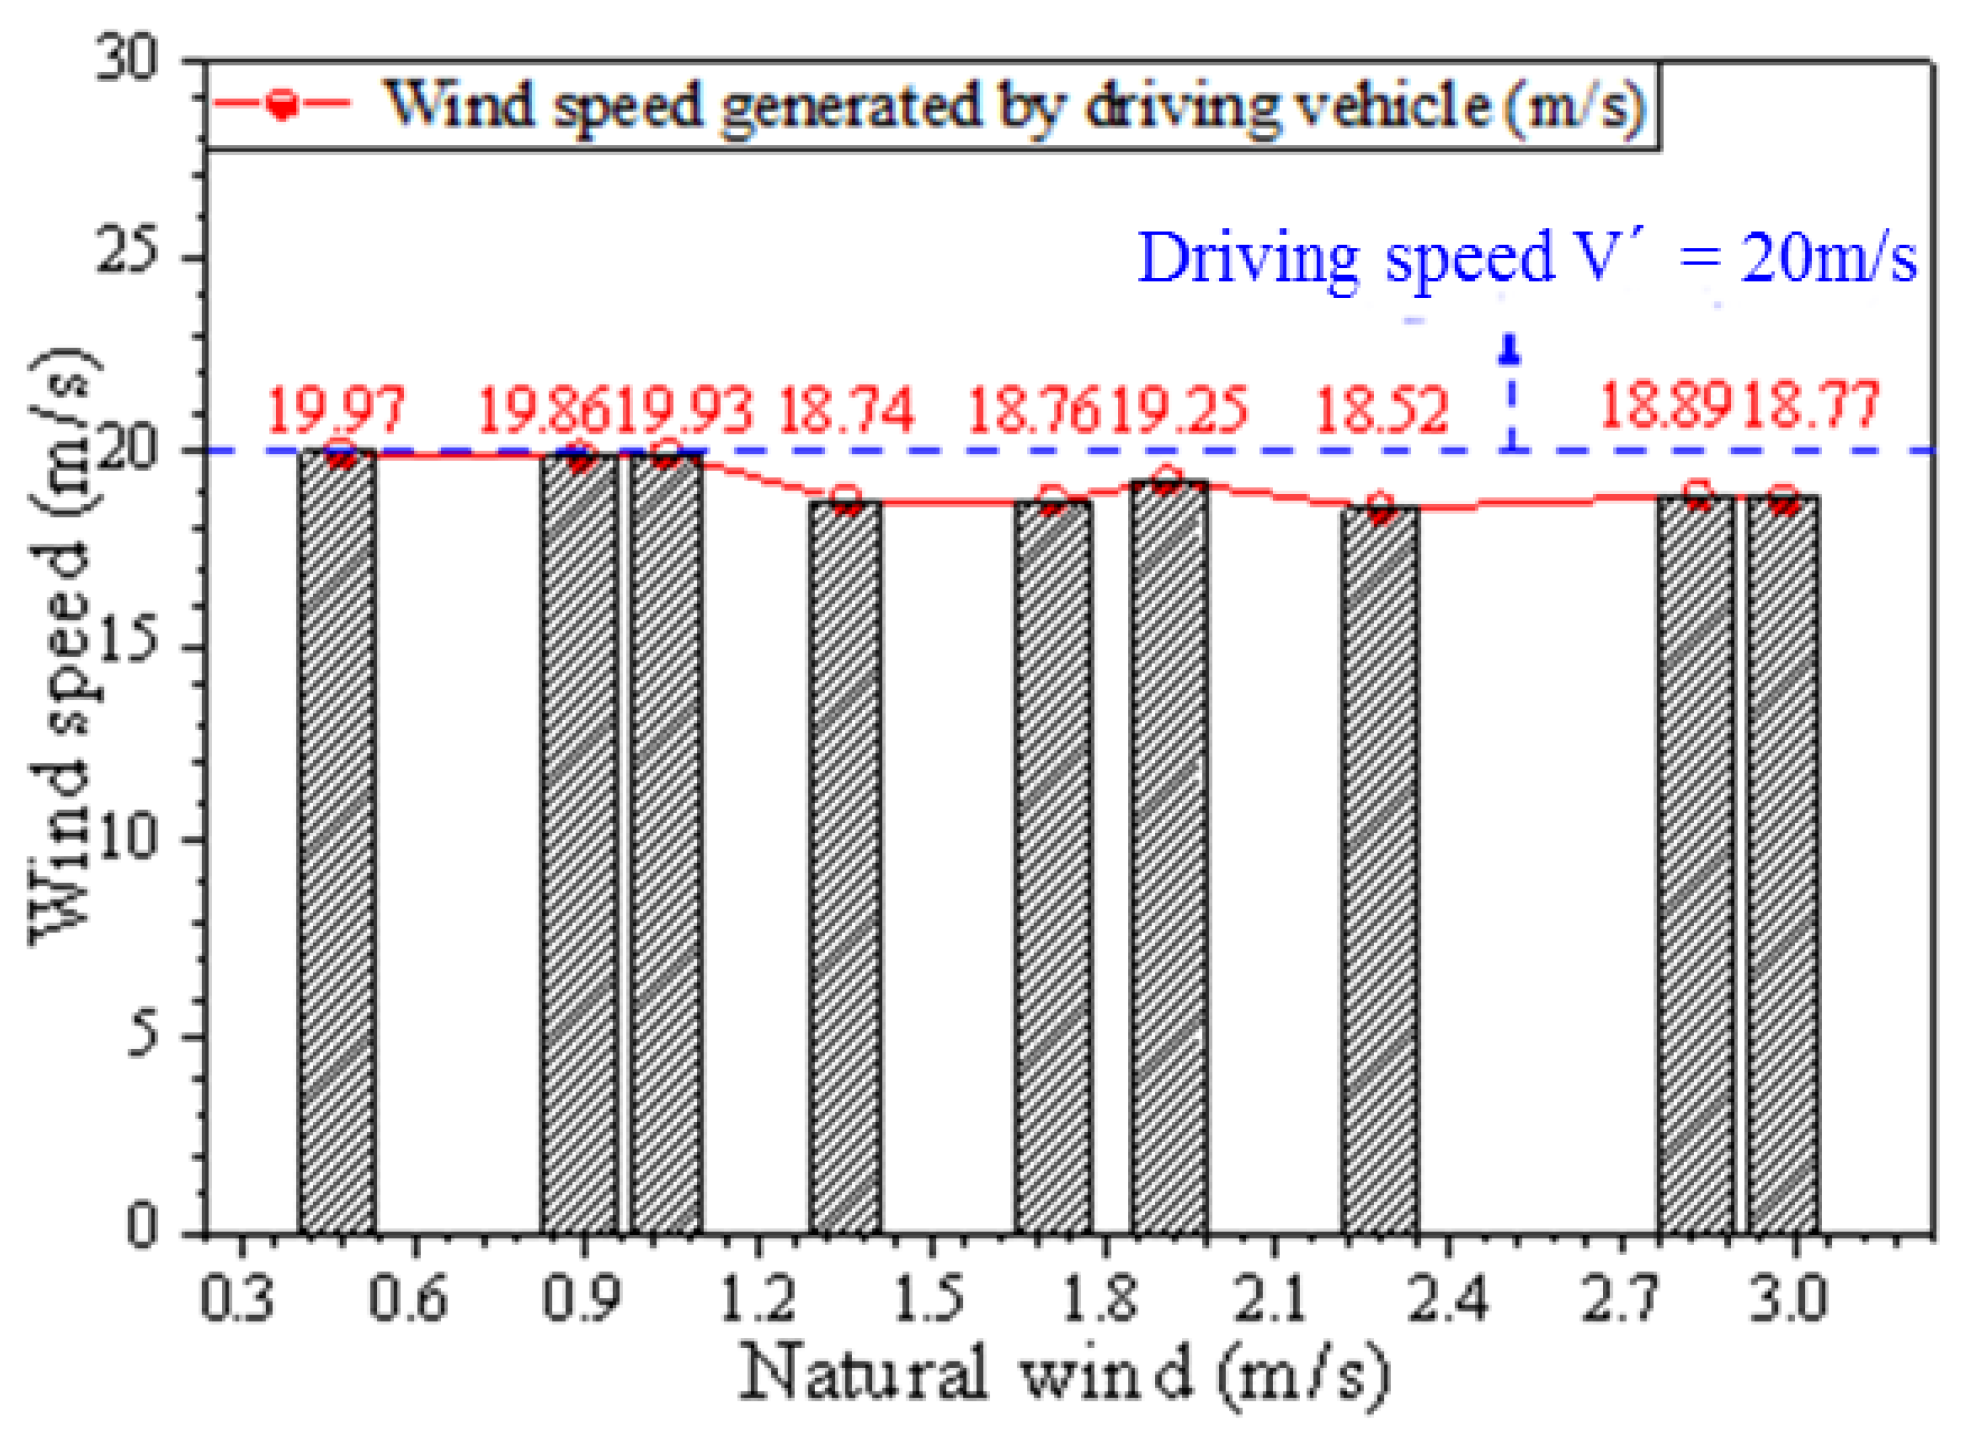
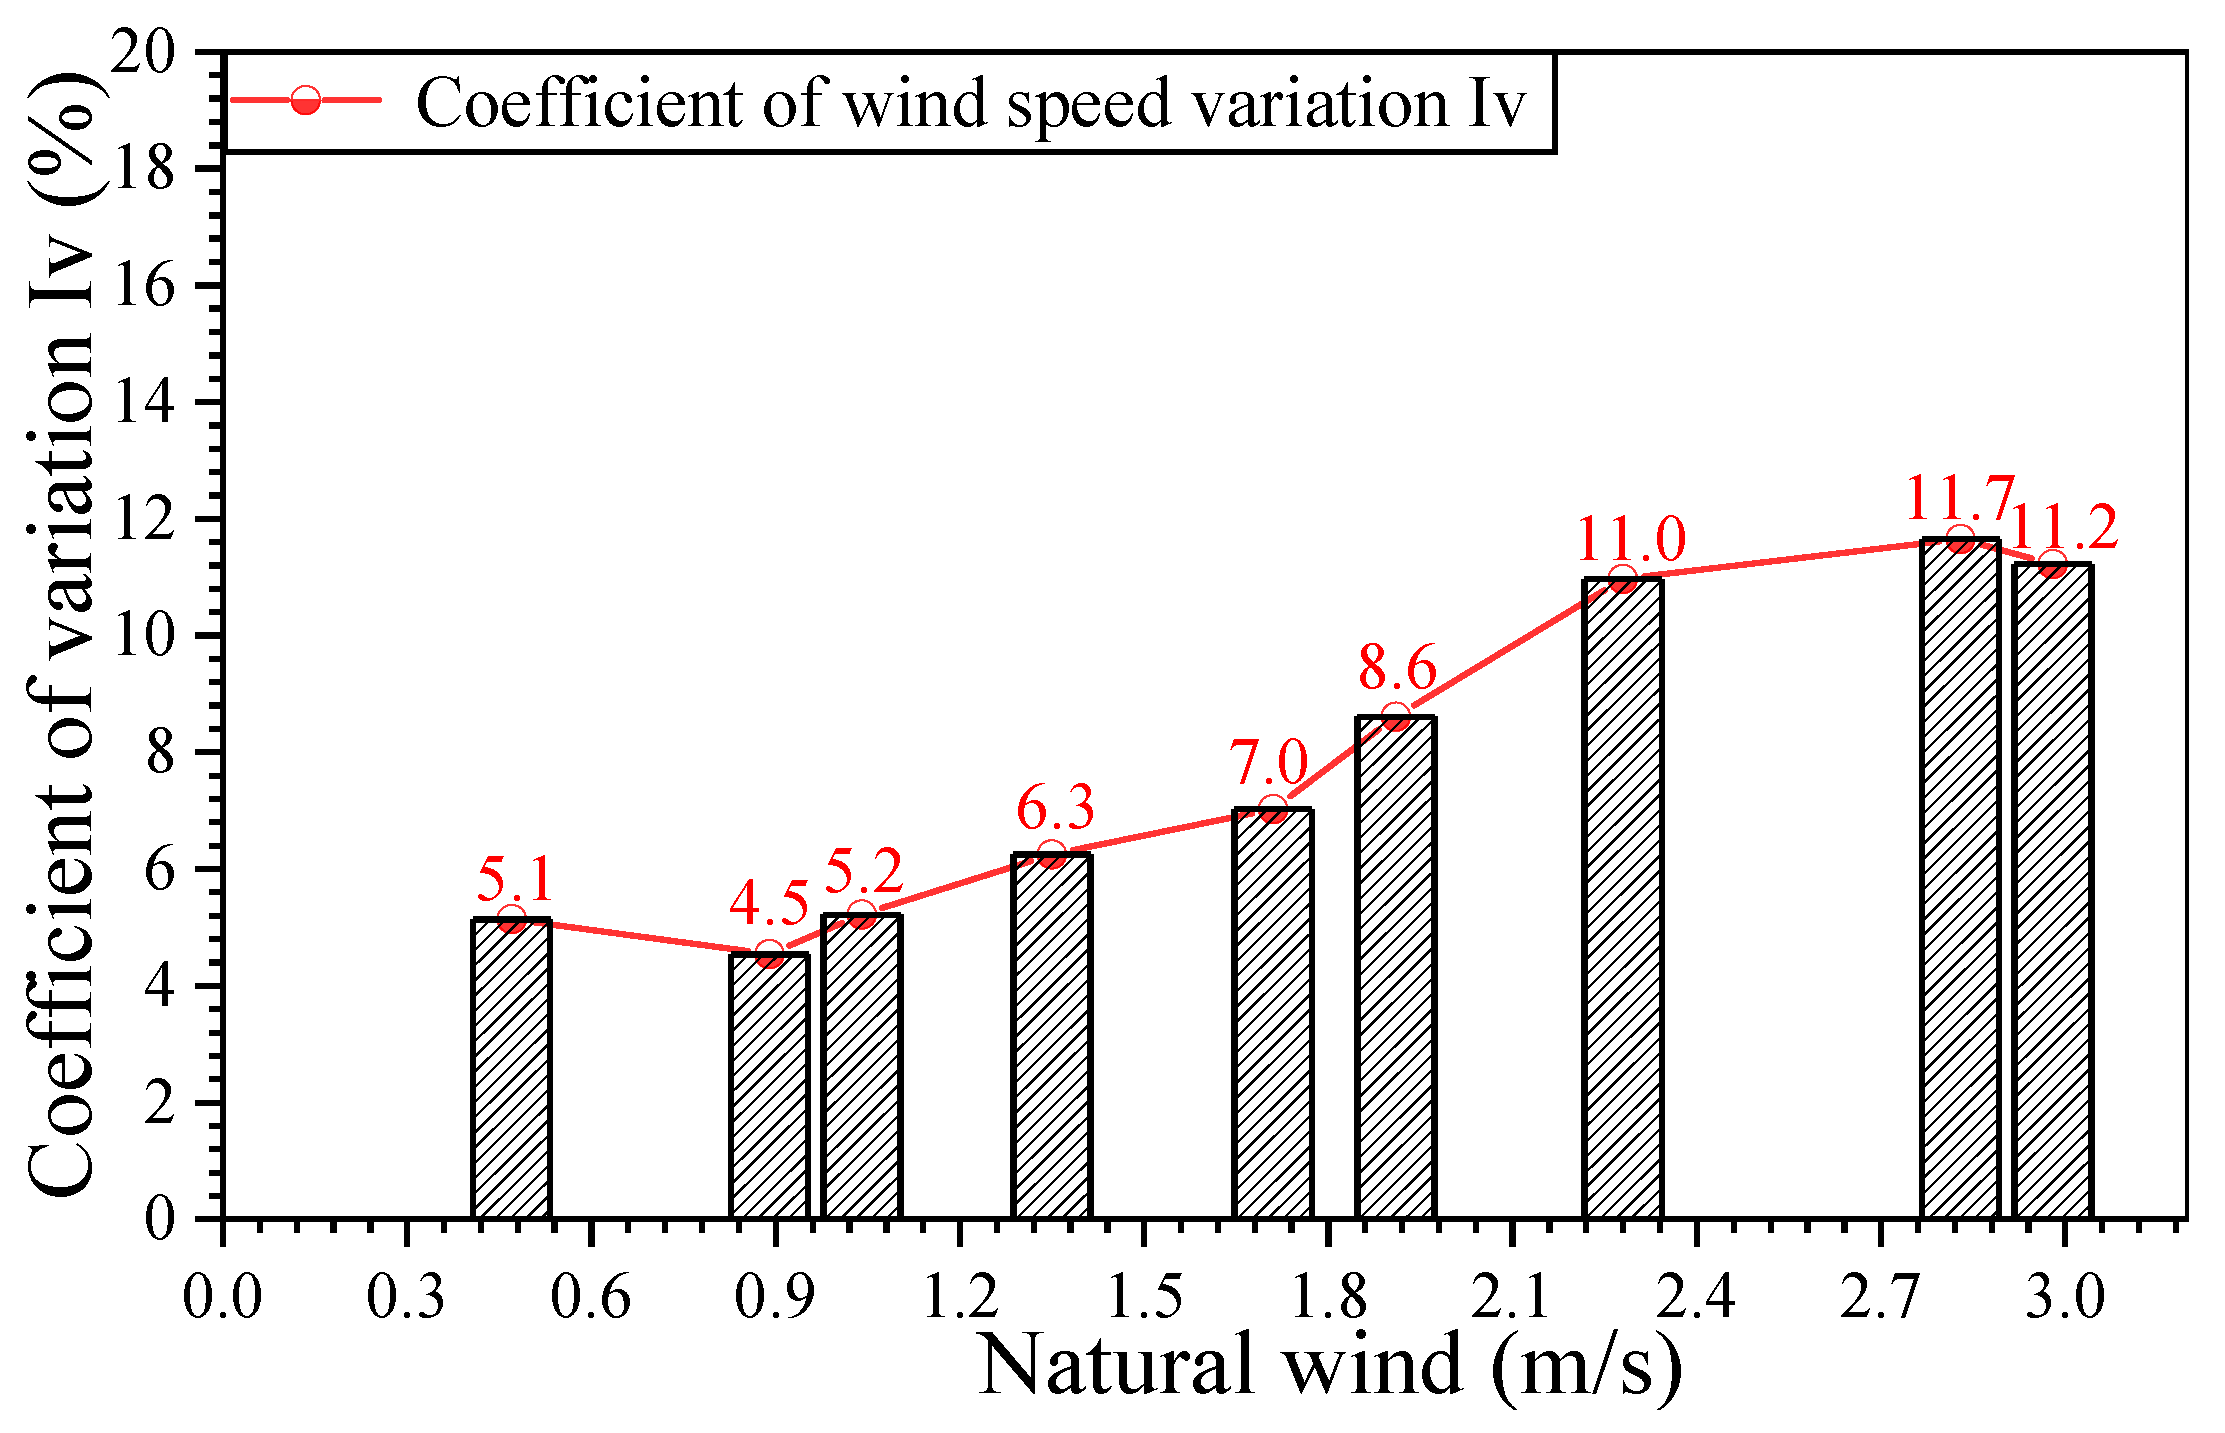
4.1. Effect of Natural Wind on the Driving Wind of a Moving Vehicle

The wind field of the transiting test of aerodynamic coefficients is generated by the moving vehicle with a constant speed in the cruise control system, and the stability of the driving wind field is particularly important [32]. Natural wind will have an impact on the stability and uniformity of the wind field [40]. Duncan et al. [55] investigated the effects of road turbulence on the vehicle aerodynamic performance by using the simulation method, and the change of road turbulence was mainly caused by natural wind. McAuliffe et al. [45] installed a number of cobra probes in front of the vehicle body to examine the wind turbulence of the cruise-controlled driving vehicle and compared the impact of different driving environments on the vehicle’s wind field. Therefore, comparing the vehicle driving wind and wind field variation coefficients, measured at 72 km/h cruise speed under different natural wind conditions, is necessary. In this study, the driving wind of the vehicle was converted using the Bernoulli formula with the measured dynamic pressure of the pitot tube [56]. The coefficient of wind field variation was represented by I V = σ v / V mean .
As shown in Figure 10, the impact of natural wind on the driving wind of the vehicle was qualitatively analyzed by comparing the history curves of wind speed time under three representative natural wind conditions. When natural wind was 0.47 m/s, the coefficient of variation of the measured wind field was small at approximately 5%, which is similar to the results of other scholars [57]. As shown in Figure 11 and Figure 12, the influence of natural wind on the vehicle’s driving wind field was quantitatively compared by the tendency of the vehicle’s driving wind field to change with natural wind. With the change in natural wind, the average wind speed of the wind field generated by 72 km/h (20 m/s) cruise control was around 20 m/s, and the deviation was within 5%. However, the influence of natural wind on the coefficient of variation of wind field showed a significant increase. The influence of strong natural wind on the uniformity of the wind field of the vehicle must be considered because it worsens the uniformity of the wind field of the vehicle and may affect the aerodynamic coefficient results. Moreover, when natural wind was greater than 2.28 m/s, the coefficient of variation was as high as 11%.

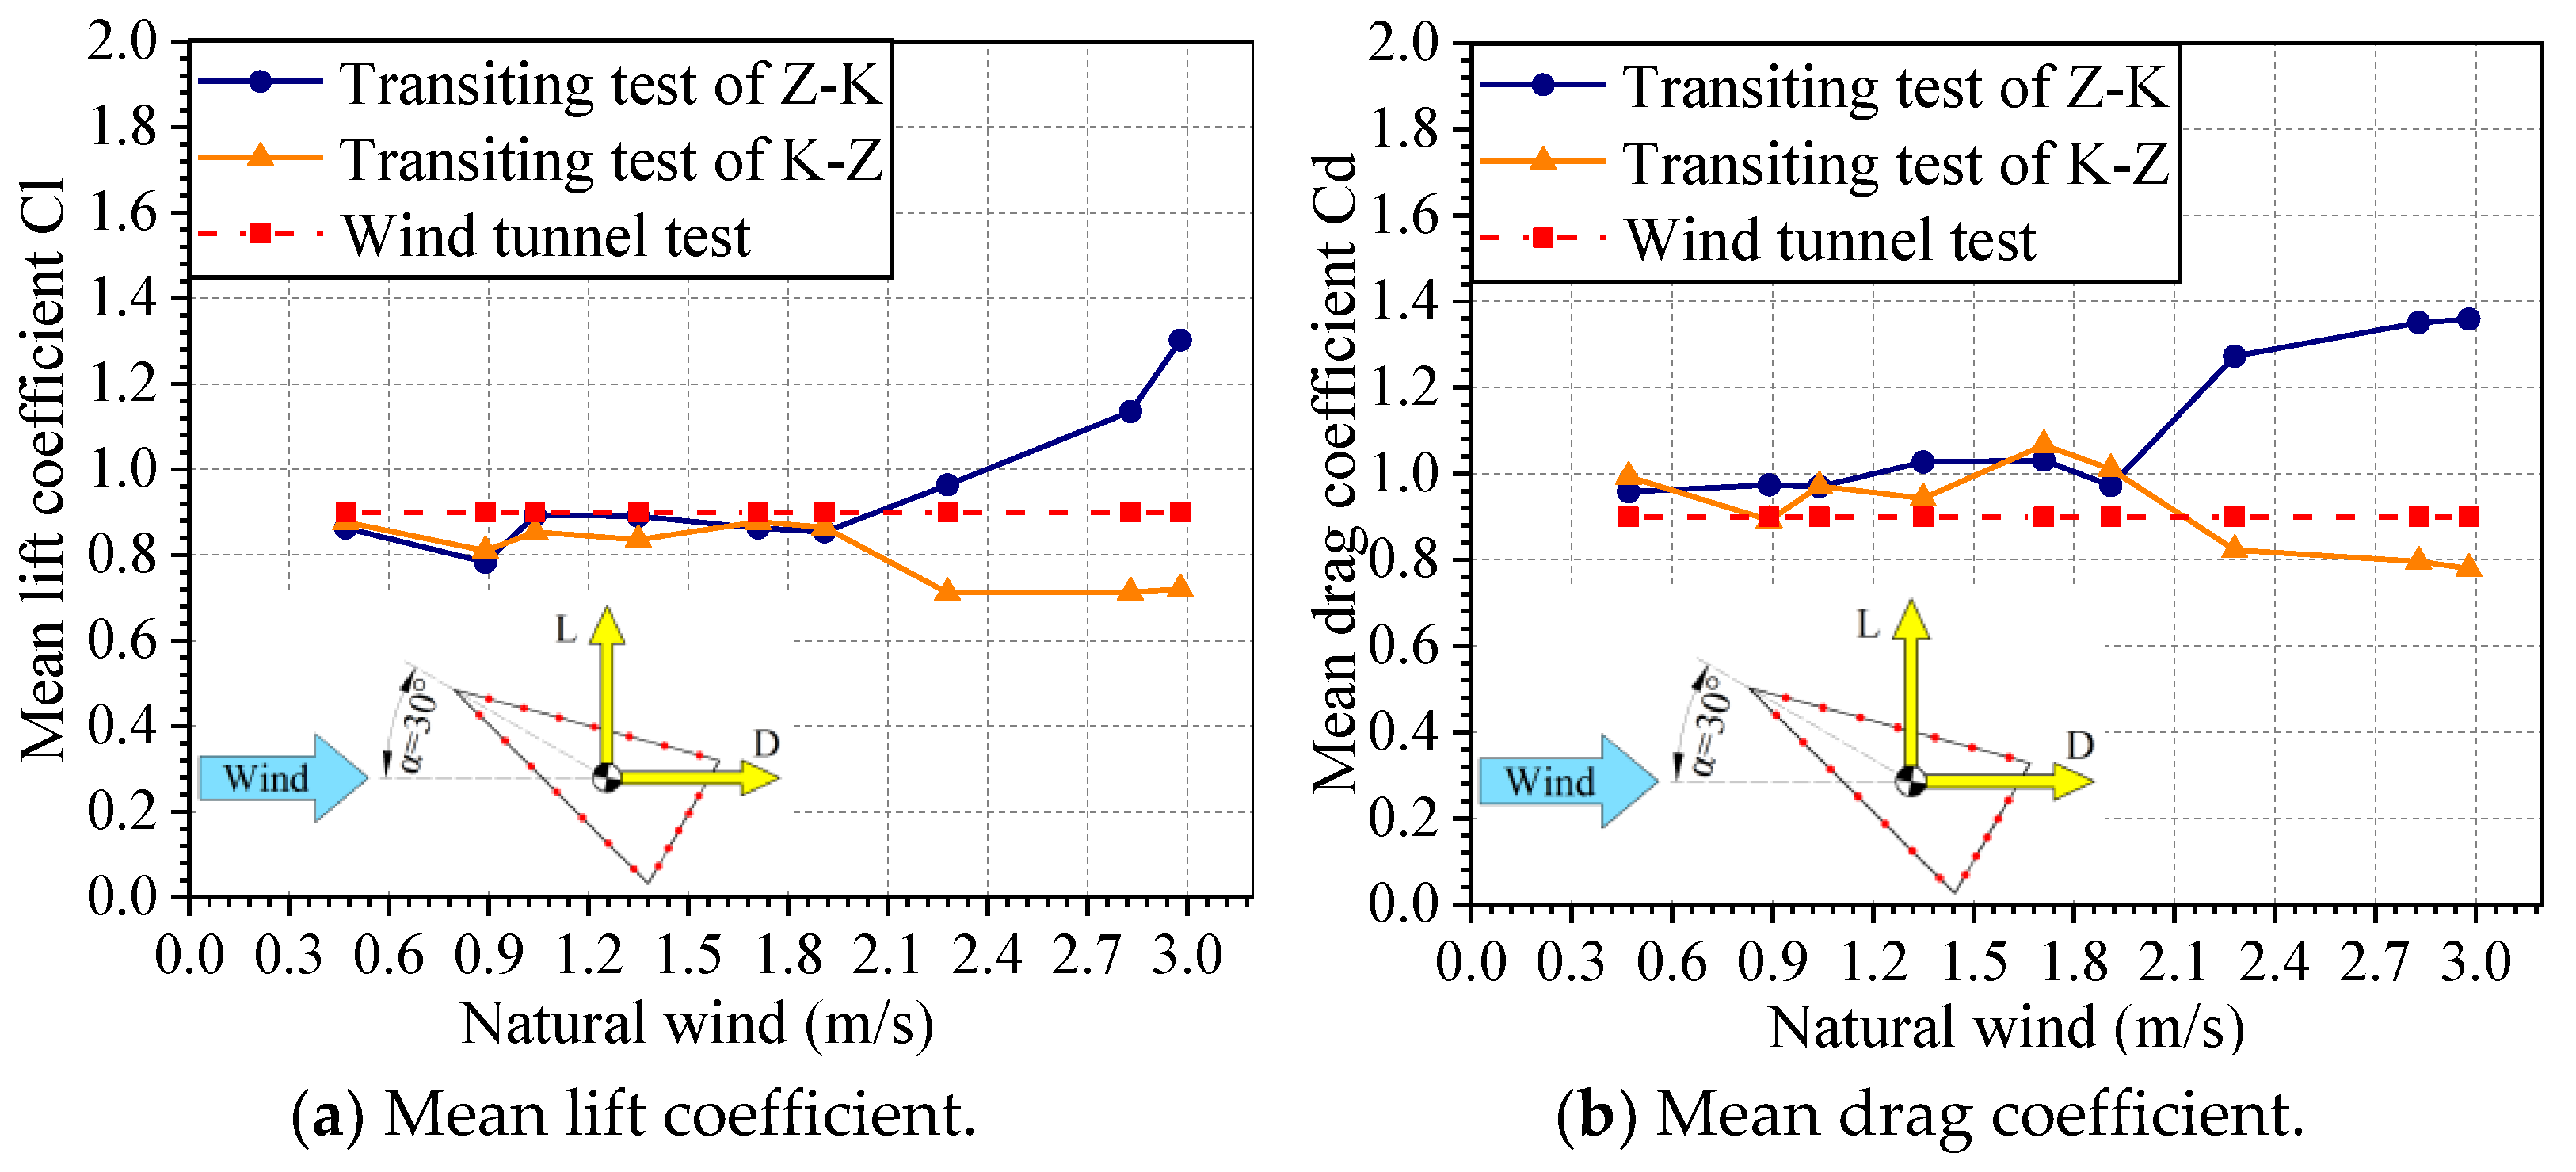
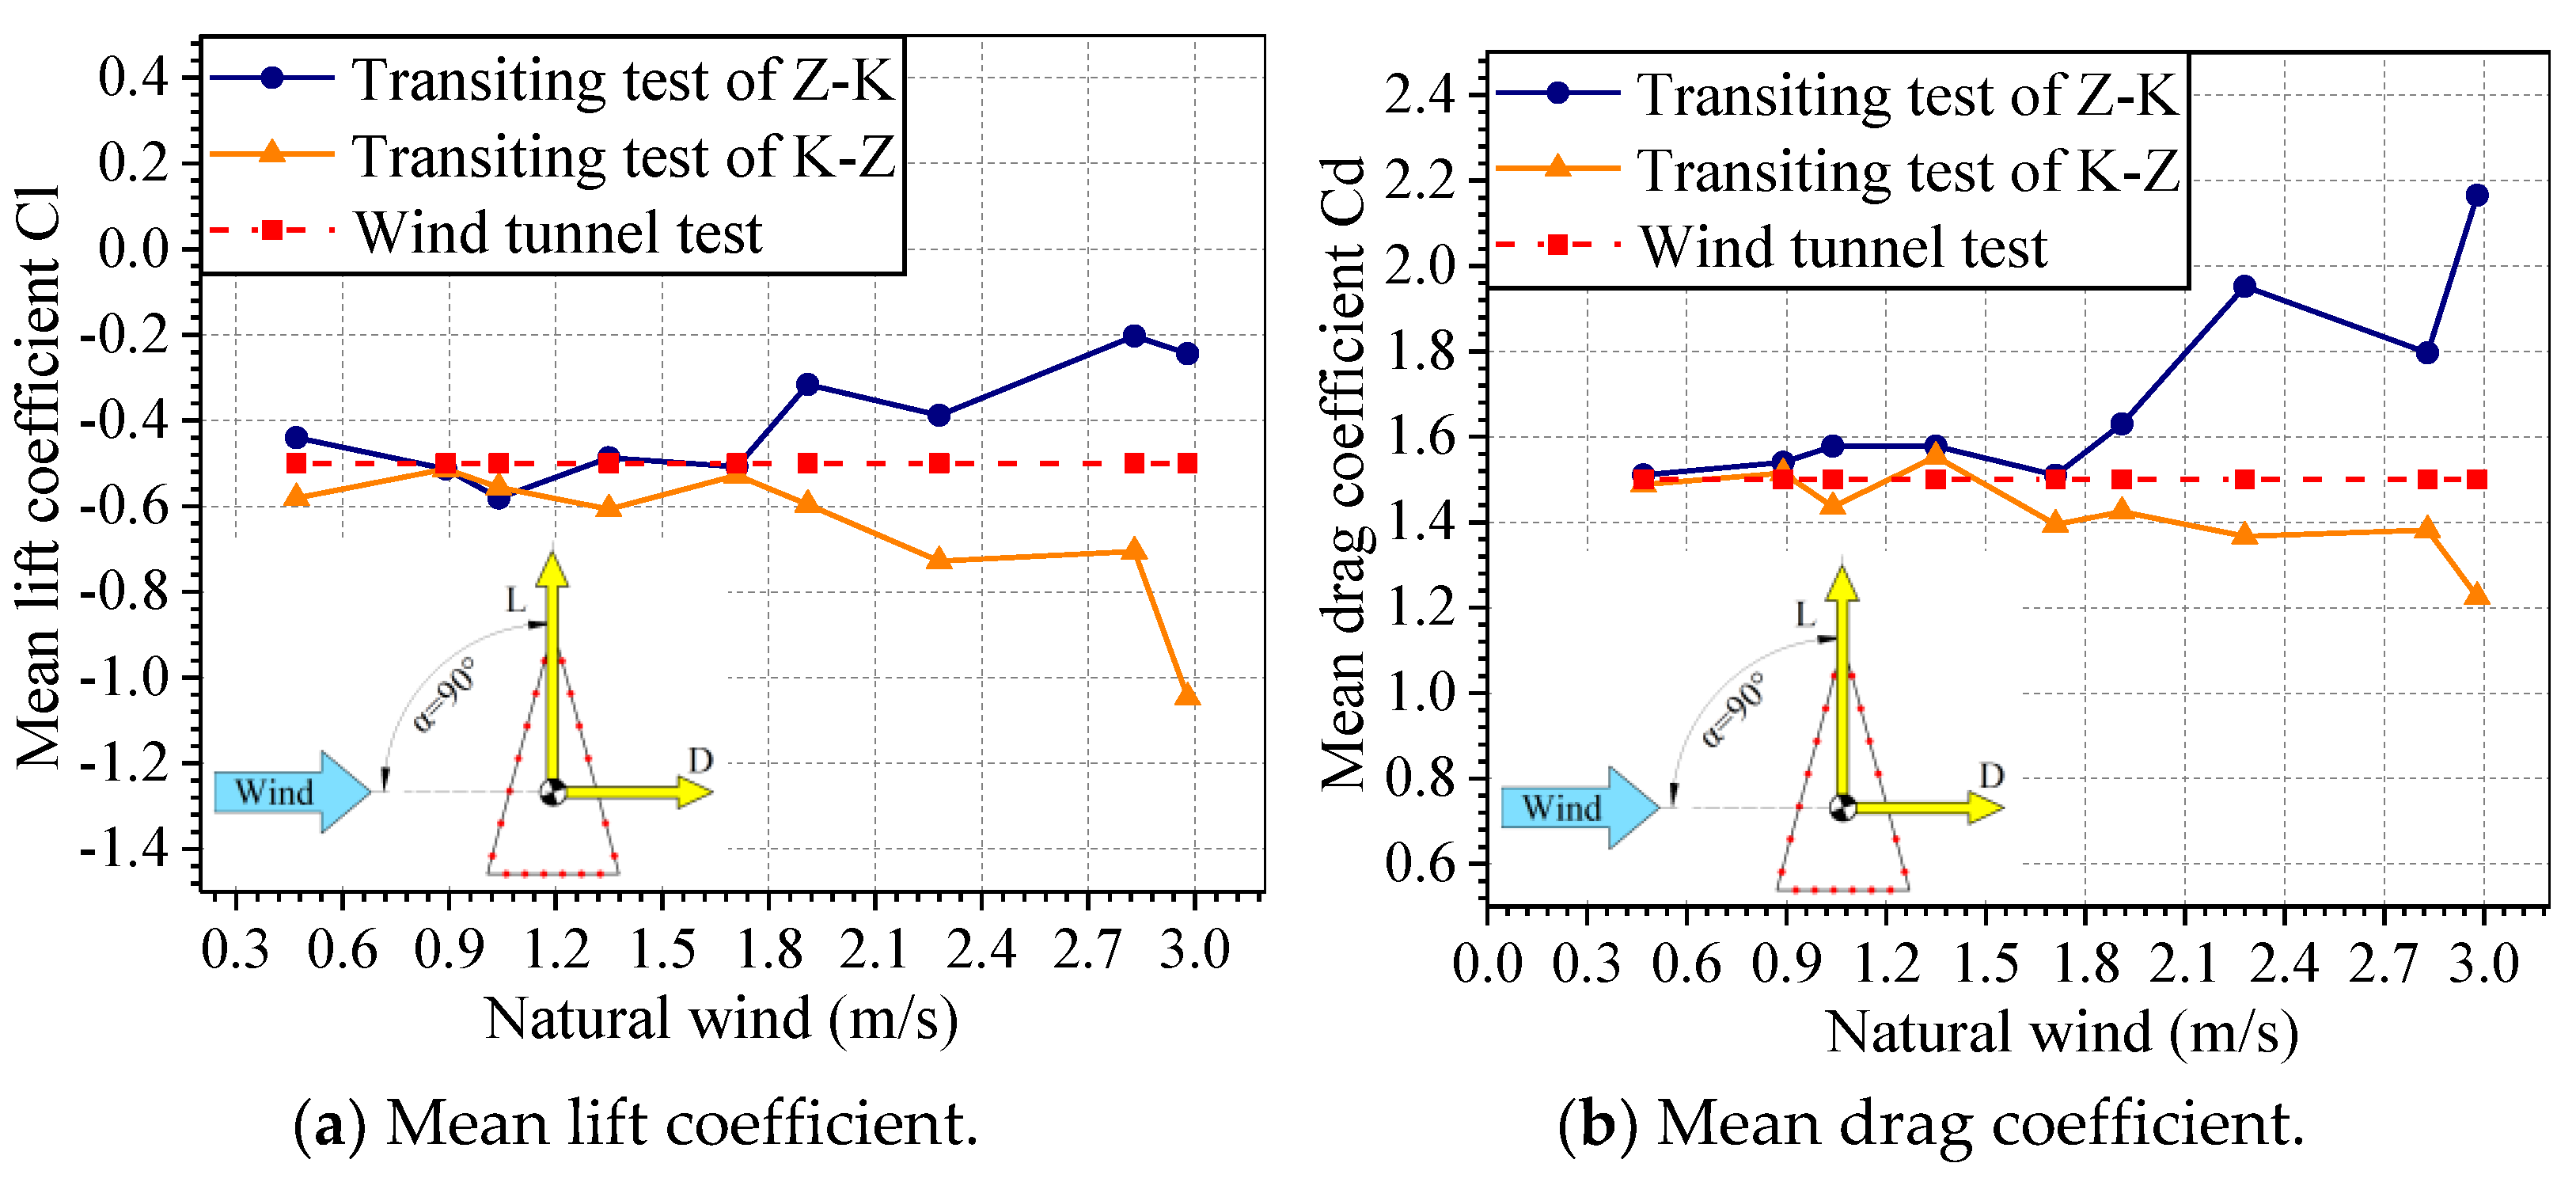
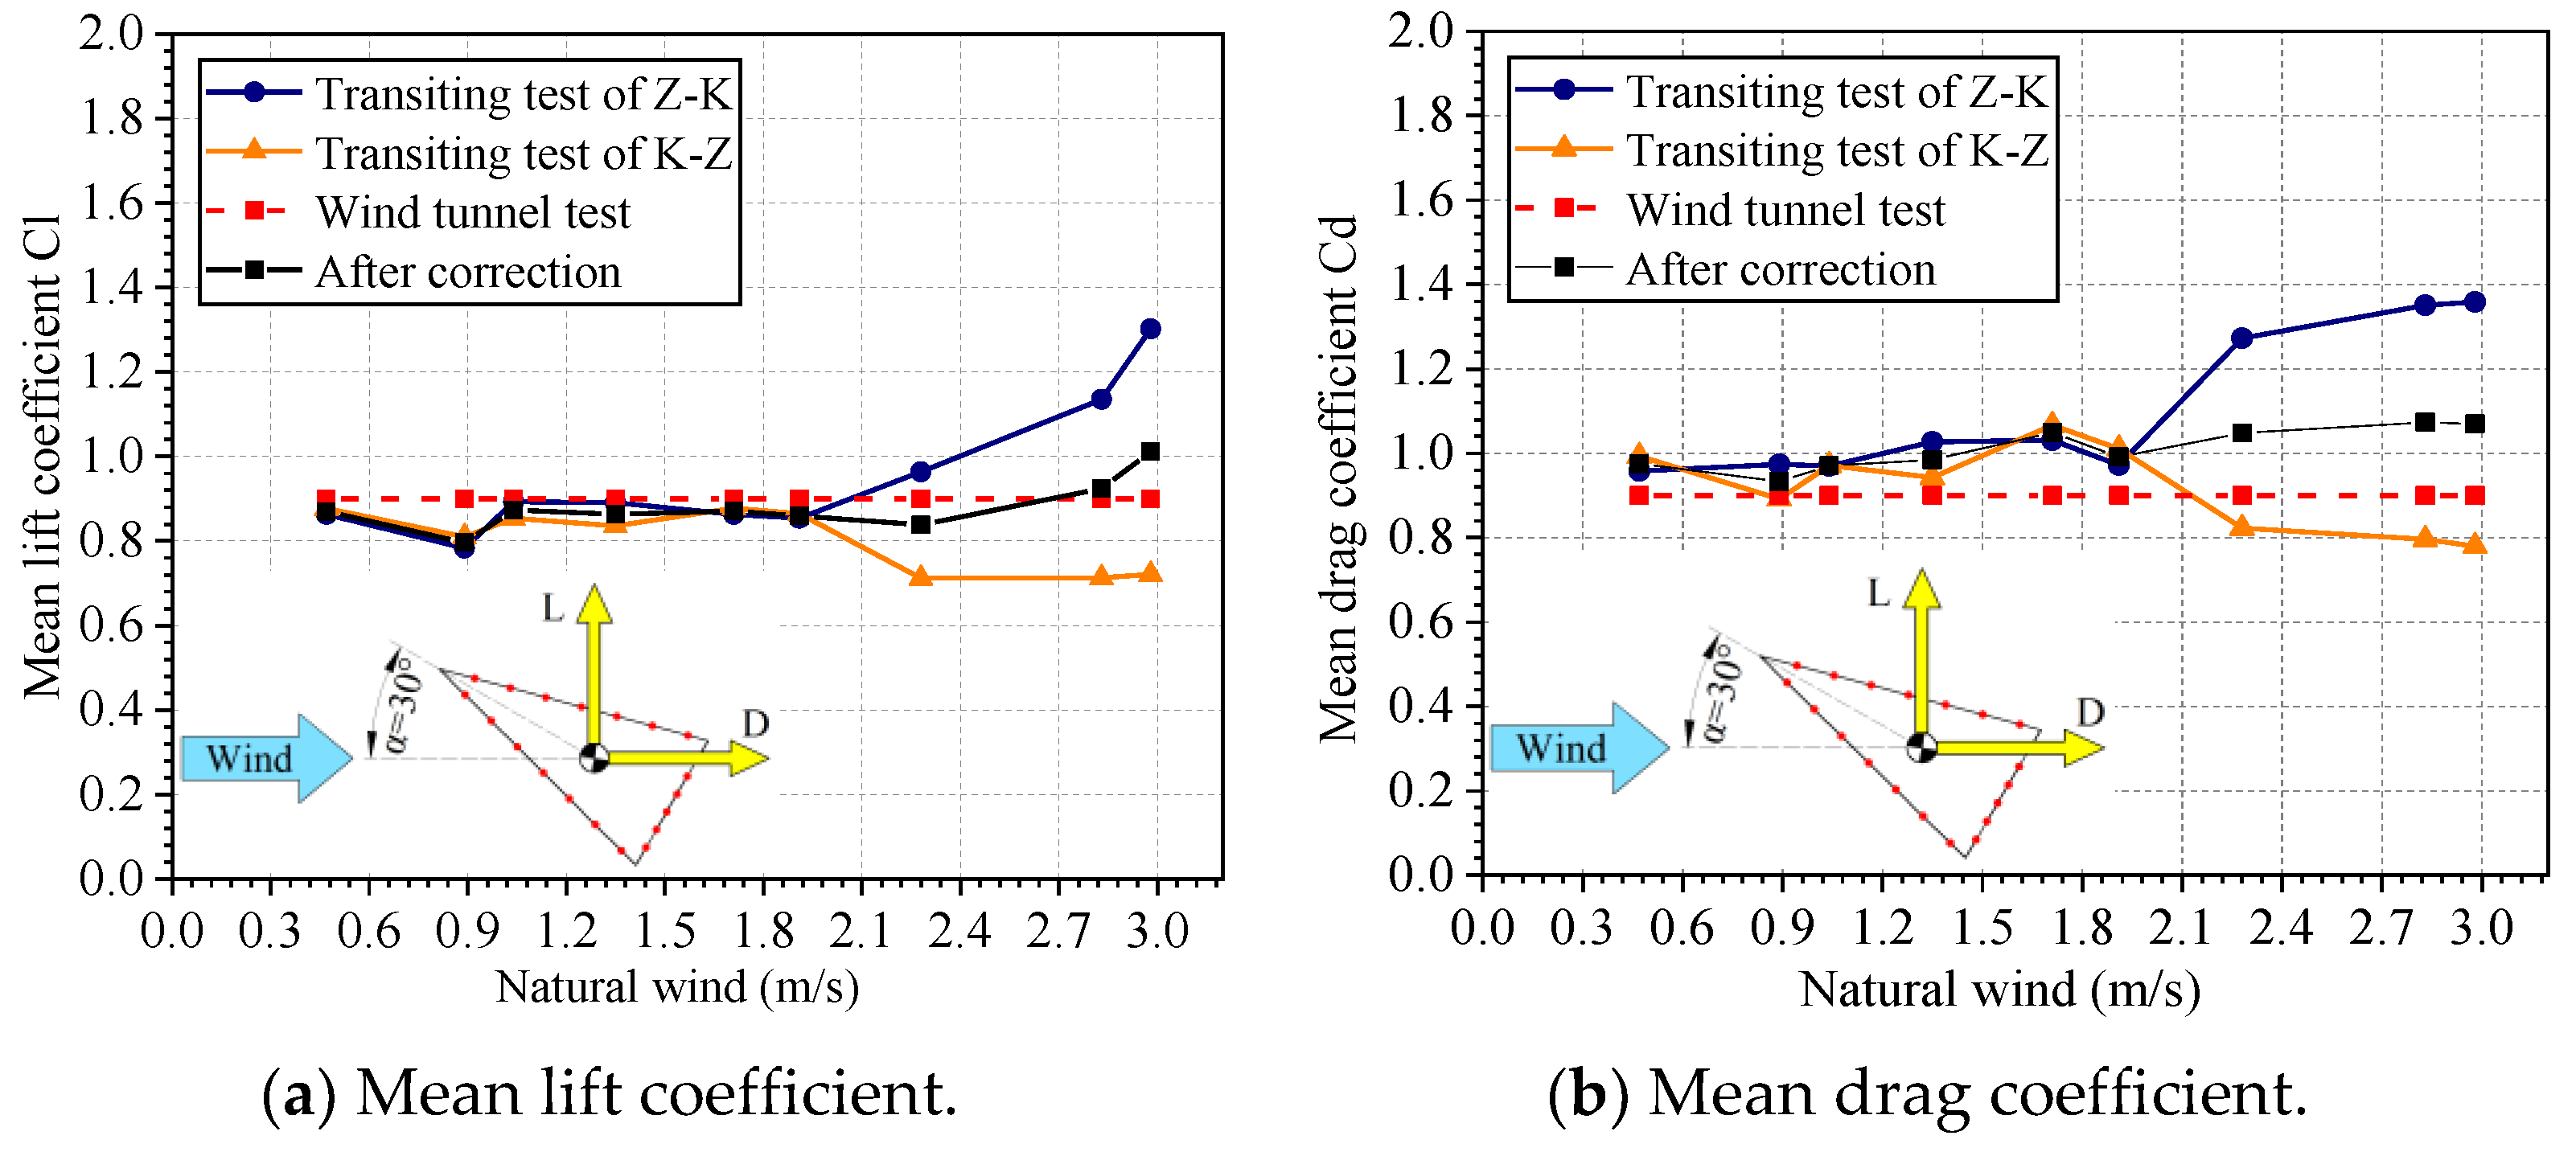
4.2. Effect of Natural Wind on the Mean Aerodynamic Force Coefficients

The results of the transiting test of aerodynamic coefficients of the triangular prism structure under the limited conditions of different wind angles were compared with those of the wind tunnel test to verify the test accuracy [32]. The analysis in Section 4.1 pointed out that strong natural winds would affect the driving wind of the vehicle. The structural aerodynamic force is the result of the wind field acting on the model. The change in wind field caused by natural wind also influences the result of the measured aerodynamic force coefficients. This section combines the driving direction of the vehicle with the wind incidence angles of 30° and 90° to analyze the change in the lift and drag coefficients of the transiting test with the natural wind.
The variation in the mean lift and drag coefficients of the downwind and headwind transiting tests along the natural wind is shown in Figure 13 and Figure 14 for angles of wind incidence for 30° and 90°. These results are also compared with those of the reference test of the wind tunnel. For the wind incidence angle of 30° (see Figure 13), the presence of natural wind affects the result of the lift and drag coefficients, and this influence will show that the result of the lift and drag coefficients of the transiting test will deviate from the wind tunnel test standard as natural wind increases. This trend may be due to the effect of the natural wind field being superimposed on the driving wind of the vehicle and results from the increase in the wind field variation coefficient I v . Under the working condition of V ( NW ) > 1.91 m/s, the test results of the downwind (Z–K) transiting test showed a tendency of having a large deviation, whereas the test results of the headwind (K–Z) transiting test showed a small trend. However, under the working condition of V ( NW ) < 1.91 m/s, although the existence of natural wind will cause fluctuations in the test results, the test results of the transiting test were still consistent with those of the wind tunnel test, and the deviation in the test results was within 10%. Therefore, under low natural wind conditions, the impact of natural wind on the test results of the transiting test was negligible. For a wind incidence angle of 90° (Figure 14), the effect of natural wind on the results of the lift and drag coefficients of the transiting test showed the same pattern as above. Under the working condition of V ( NW ) > 1.71 m/s, the deviation in the test results was too large, and the influence of natural wind on the test must be considered. Under the condition of weak natural wind, the deviation in the lift and drag coefficients is within the range of 0.1, which can be neglected.

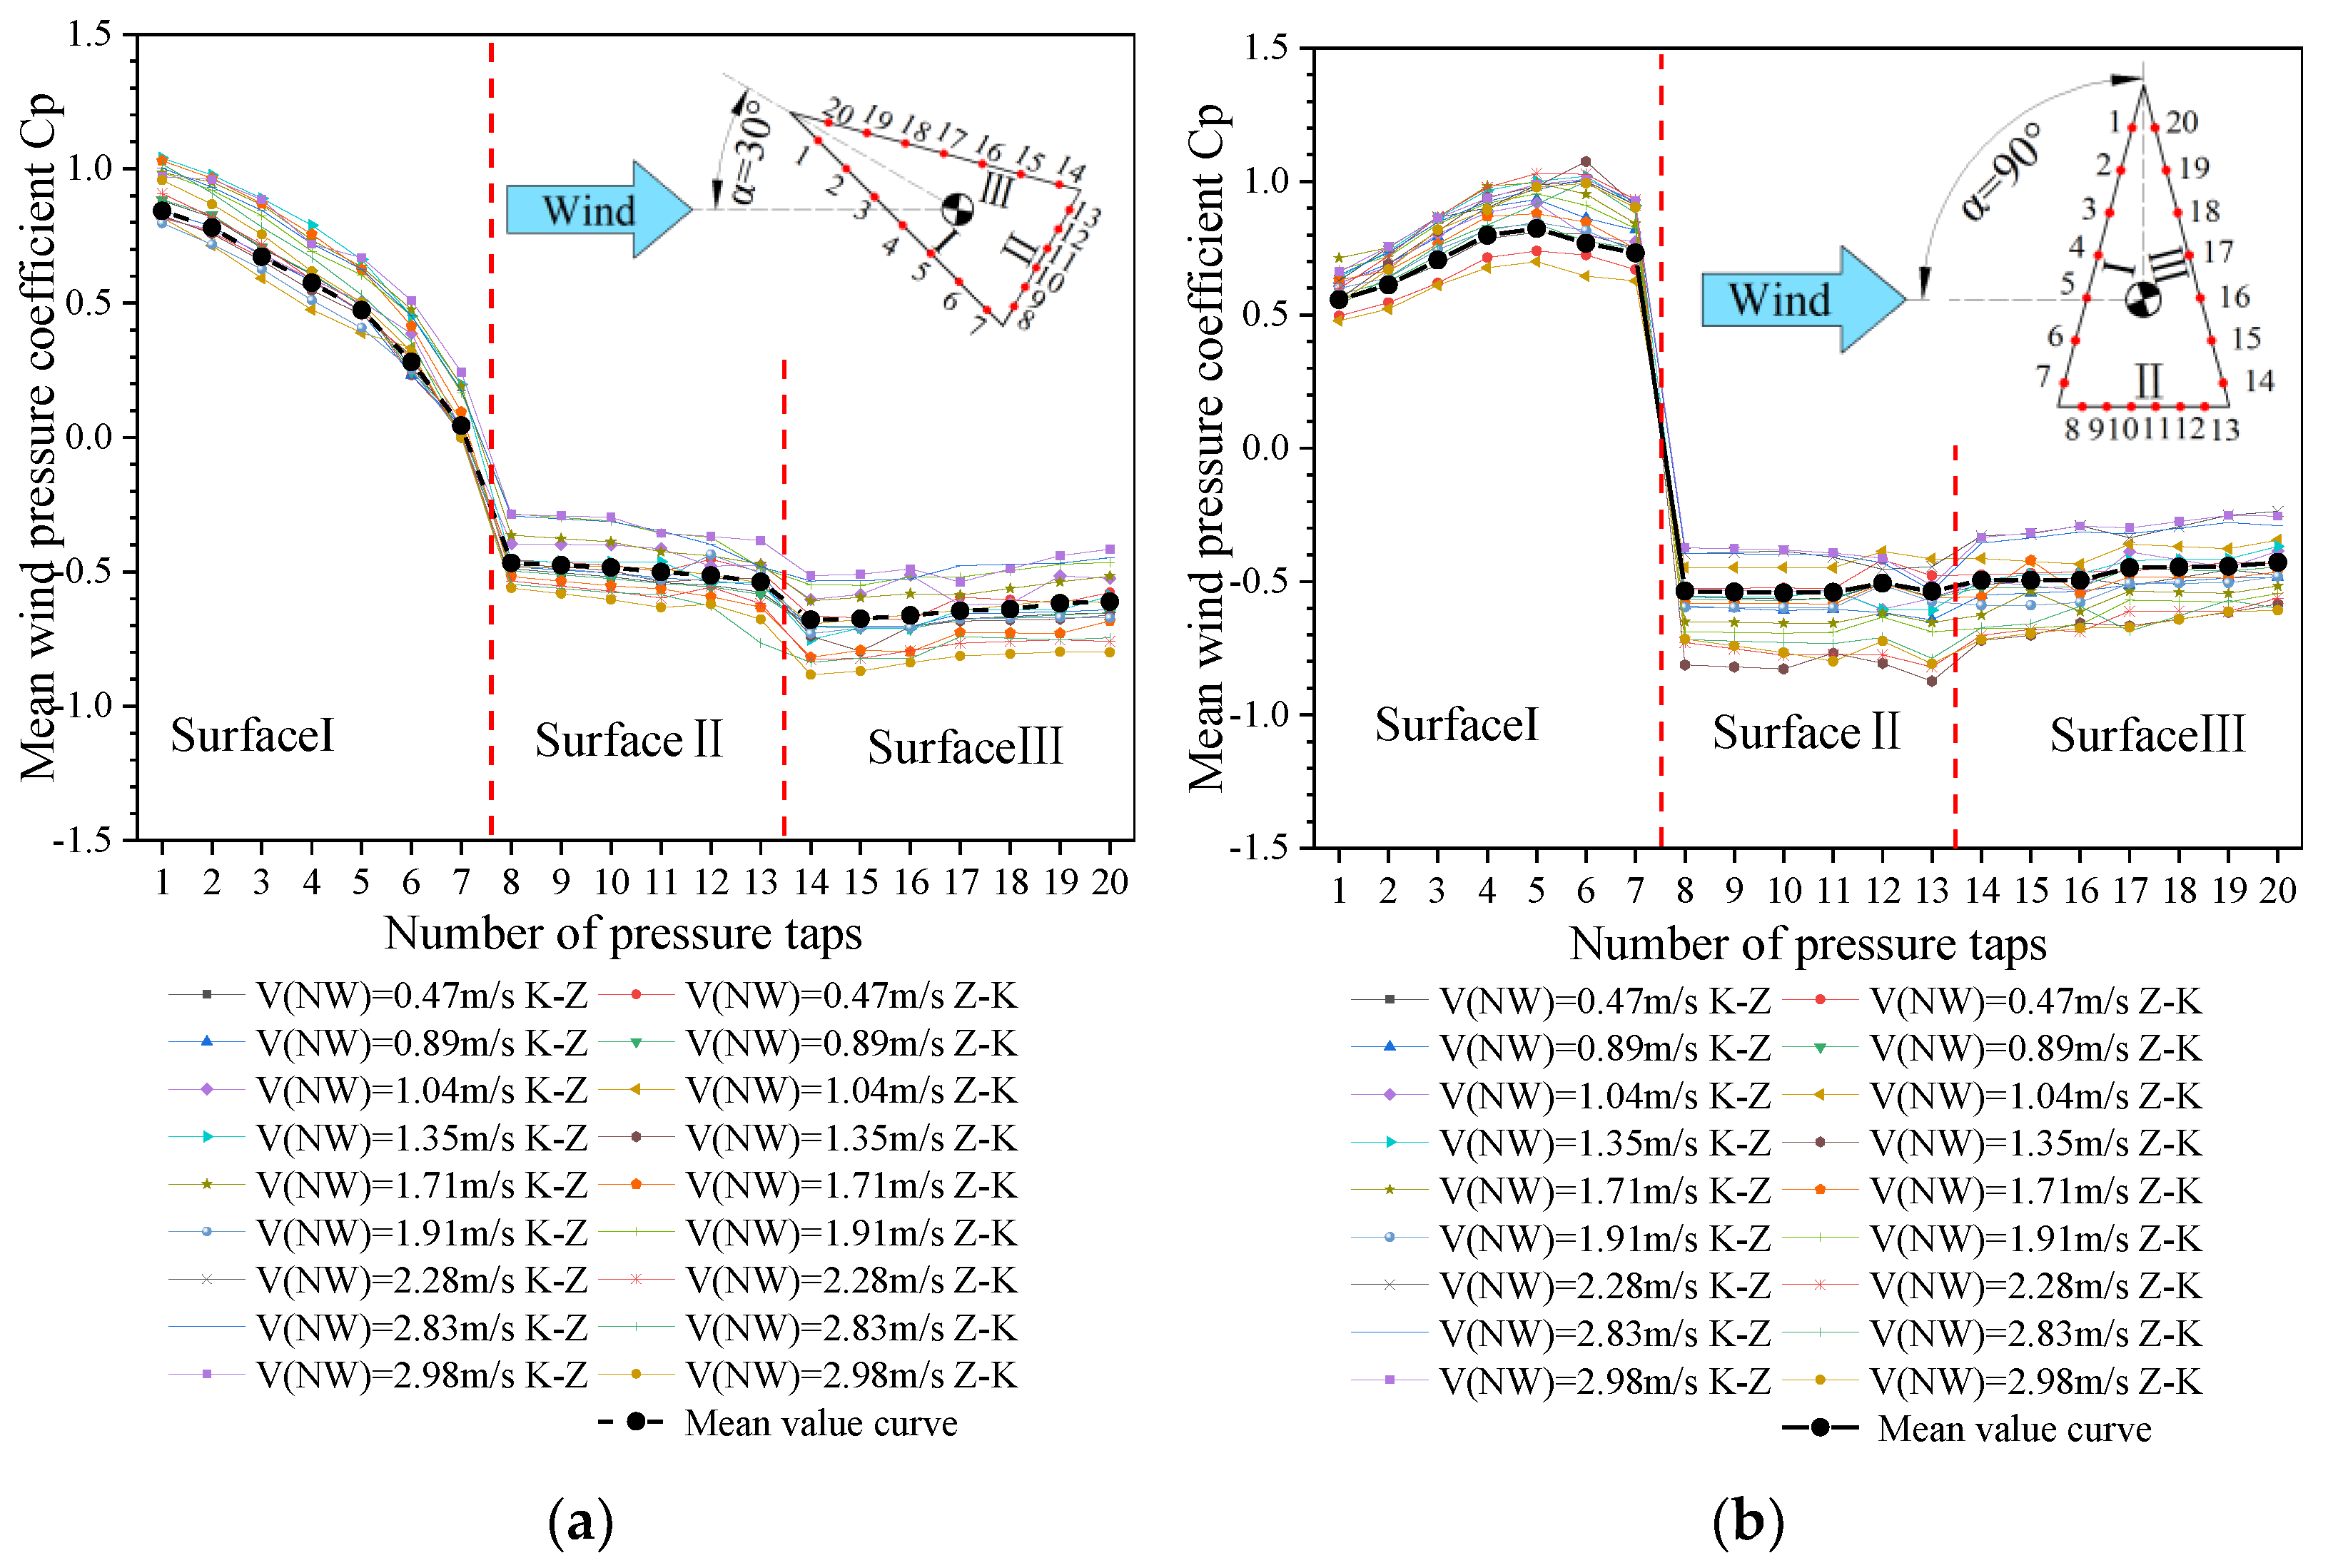
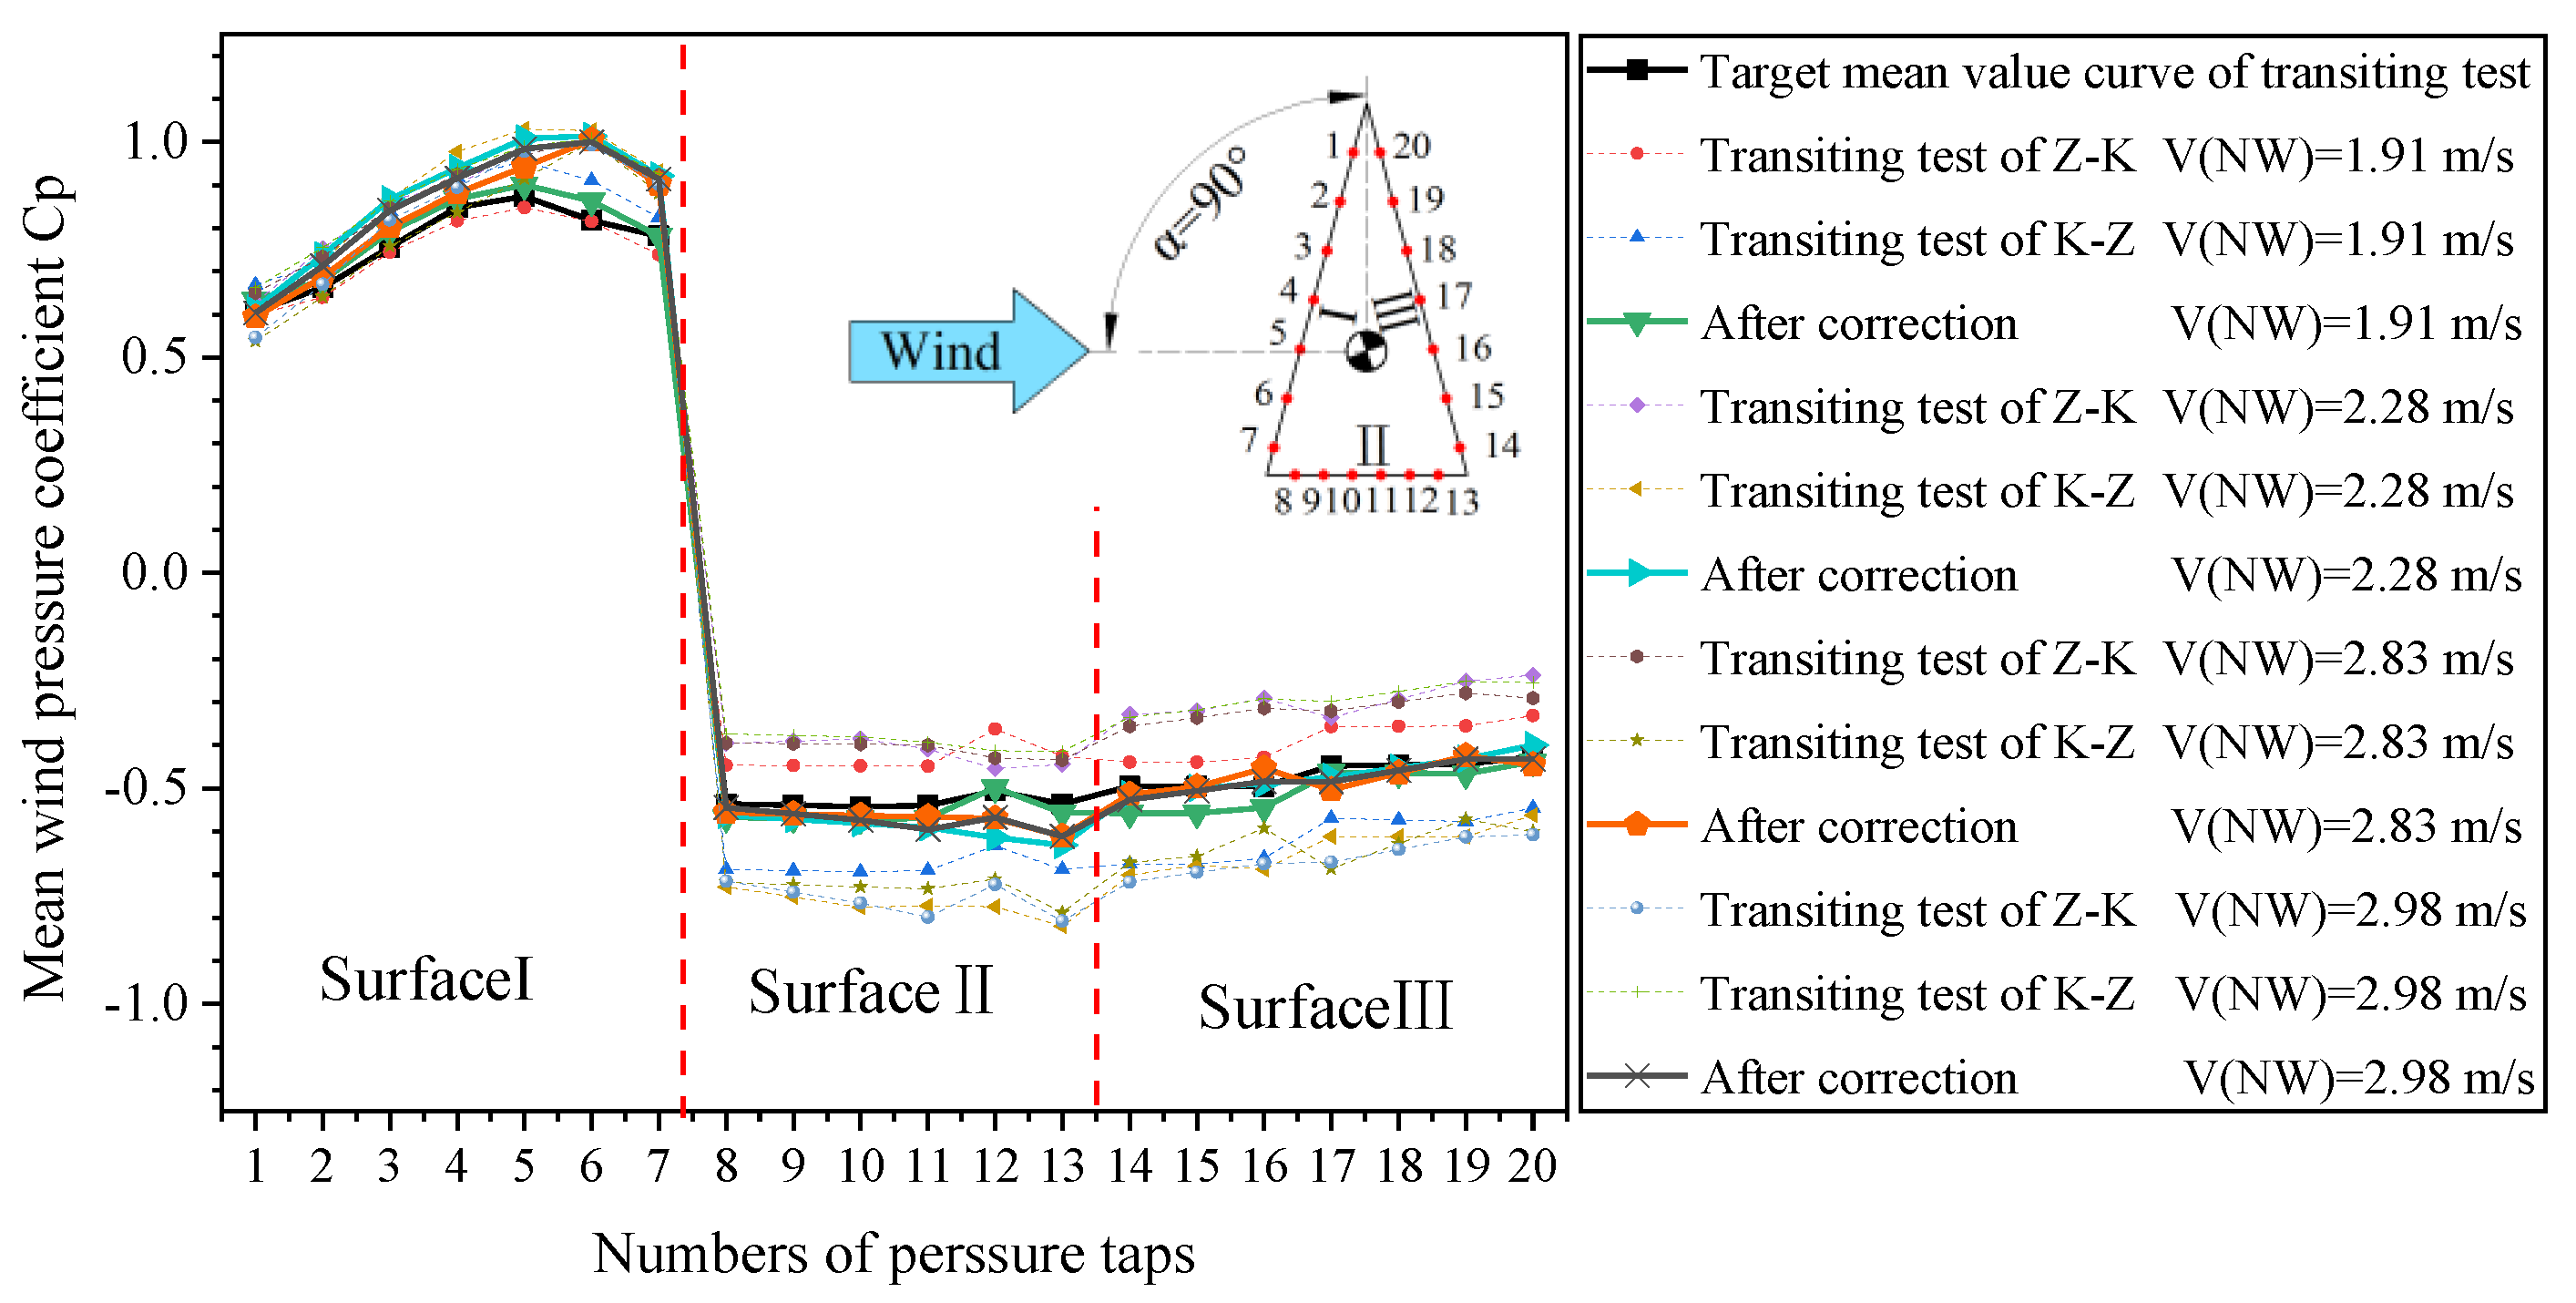
4.3. Effect of Natural Wind on the Mean Aerodynamic Pressure Coefficient

The analysis of the previous summary indicated that changes in the wind field caused by natural winds also had an effect on the measured aerodynamic coefficient results. The combination of force measurement and the pressure measurement system is a common method used in structural wind resistance research. Ricciardelli et al. [58] combined the analysis of structural aerodynamic coefficients and structural aerodynamic pressure coefficients to investigate the effects of topographical characteristics and height on the aerodynamic performance of tall buildings. Yan et al. [47] also used the two methods of force and pressure measurements to examine the influence of turbulence on the aerodynamic performance of high-speed trains. In this section, the 30° and 90° wind angles are used to analyze the surface pressure coefficient of the triangular prism model of the transiting test with natural wind.
The curves of the pressure coefficient of the model surface measured by the downwind and headwind transiting tests under nine kinds of natural wind at 30° and 90° wind angles are illustrated in Figure 15. By comparison, regardless of the change in natural wind or the difference between downwind and headwind, the trend of the pressure coefficient curve of the model remains the same. As shown in Figure 15a,b, the trend of the wind pressure coefficient curve of the measuring point is highly consistent, and the area of each surface is clear. The windward and leeward sides are the positive and negative pressure areas, respectively, and the curve trend is smooth.
However, by comparing the curves of the measuring points, although the pressure coefficient curves trend is highly consistent, the surface pressure coefficient values under different natural wind conditions still show certain differences, and the data are sometimes inconsistent. Therefore, the presence of natural winds affected the surface pressure coefficient results, and the mean absolute deviation β is defined as the indicator for evaluating the effect of natural wind on the pressure coefficient [17]. The variation in the absolute deviation with natural wind is shown in Figure 16. Regardless of the wind attack angle of 30° or 90°, the mean value of the absolute deviation β increased with the increase in natural wind. Hence, although natural wind did not affect the trend of the pressure coefficient curve of the measuring point, it had a certain influence on the value of the pressure coefficient, and the large natural wind increased the deviation. This behavior is consistent with the analysis of the aerodynamic force coefficients in Section 4.2. In addition, when V ( NW ) < 1.71 m/s, the mean absolute deviation β was less than 1%, and this natural wind condition can ensure the accuracy of the test.

5. Discussion

According to the above analysis, the results of the transiting test under natural wind conditions lower than 1.71 m/s (critical wind speed) are the most ideal. When the natural wind speed is greater than the critical wind speed, the test results have larger errors. So, is it possible to find a method to correct the transiting test results under natural wind conditions greater than the critical wind speed to reduce the errors?
The different driving directions will cause the transiting test to appear in a headwind and downwind kind of situation under the influence of strong natural wind. As shown in Figure 17, the total wind field above the vehicle where the test model is located is actually the superposition of the wind field generated by the vehicle and the natural wind field. Therefore, we propose a correction method of averaging the two-direction round-trip measurement (Figure 18) to correct the results of the transiting test under the condition of natural wind speed greater than the critical wind speed.

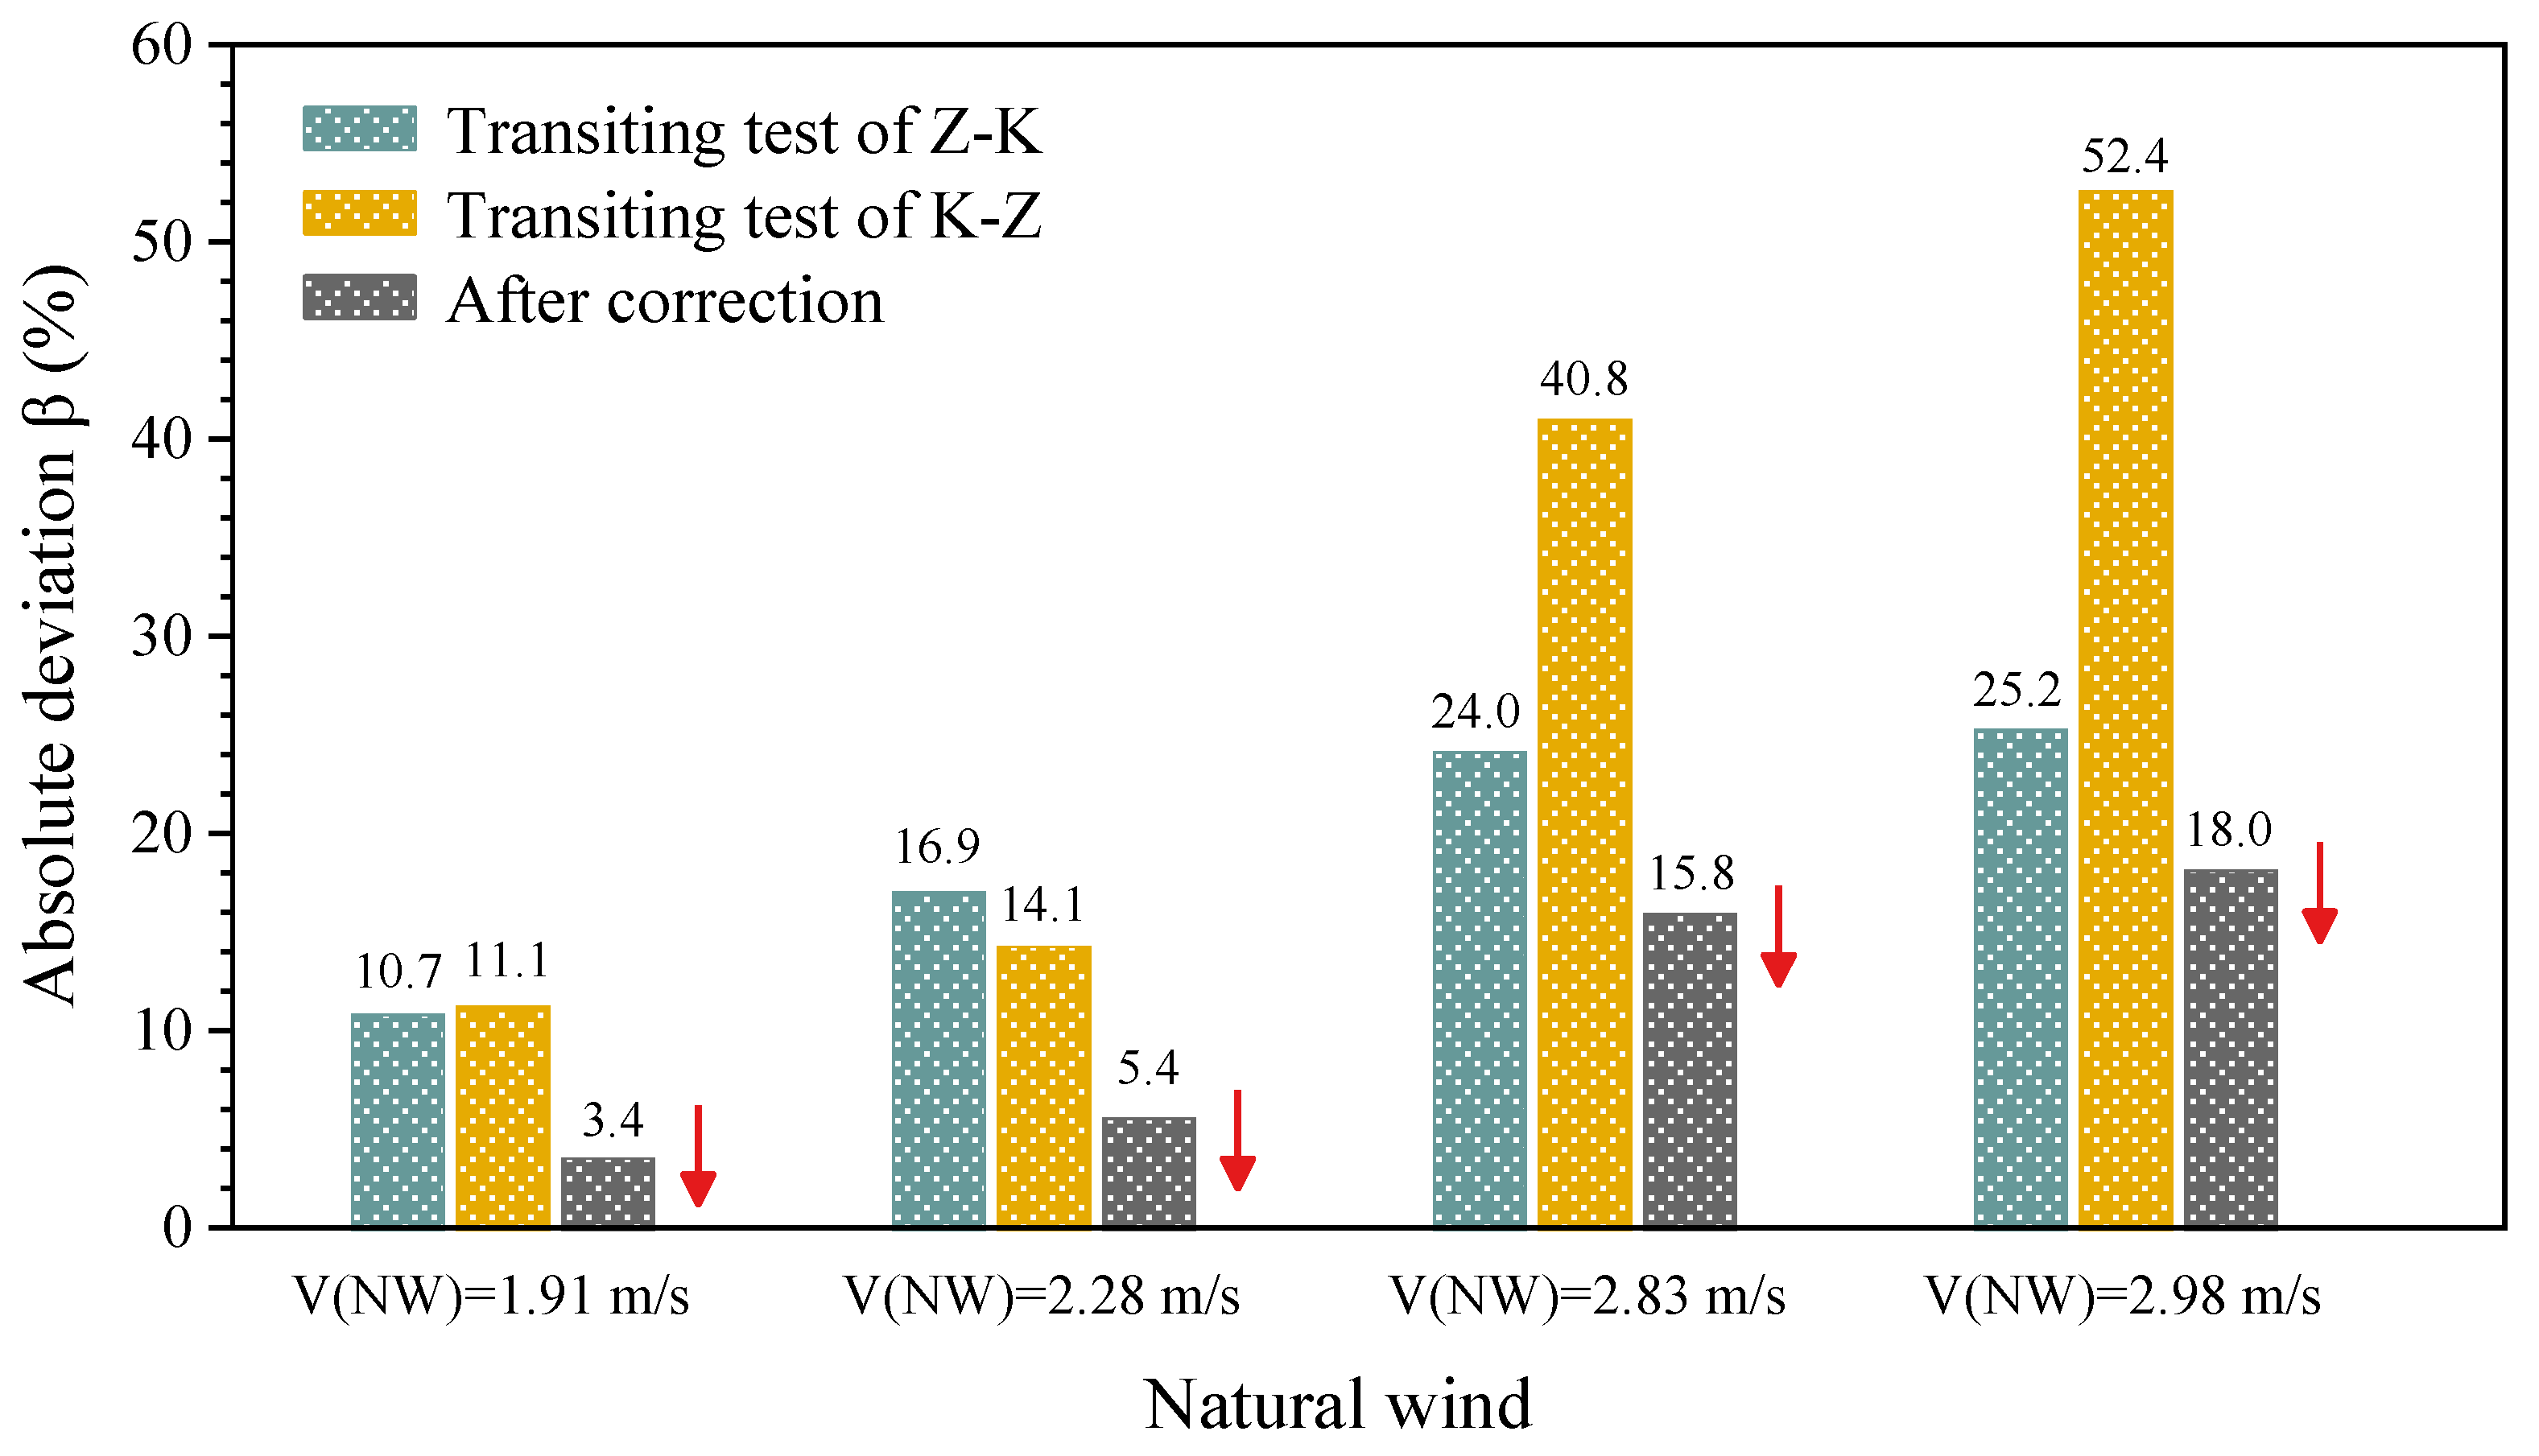
5.1. Correction of Natural Wind on the Mean Aerodynamic Force Coefficients

Figure 19 shows the aerodynamic force coefficients under different natural wind conditions at a 30° wind attack angle. It can be seen that the two results obtained by the two-direction measurement differ greatly after the natural wind speed is greater than 1.91 m/s and they gradually deviate from the wind tunnel test results. For a 90° wind attack angle, the same phenomenon appears when the natural wind speed is greater than 1.71 m/s (as shown in Figure 20). However, the results that were corrected by the method of averaging the two-direction round-trip measurement were closer to the wind tunnel test results.
Therefore, the correction method of averaging the two-direction round-trip measurement can effectively correct the influence of natural wind on the aerodynamic force coefficients of the triangular prism structure and effectively improve the accuracy of the transiting test under natural wind conditions greater than 1.71 m/s.

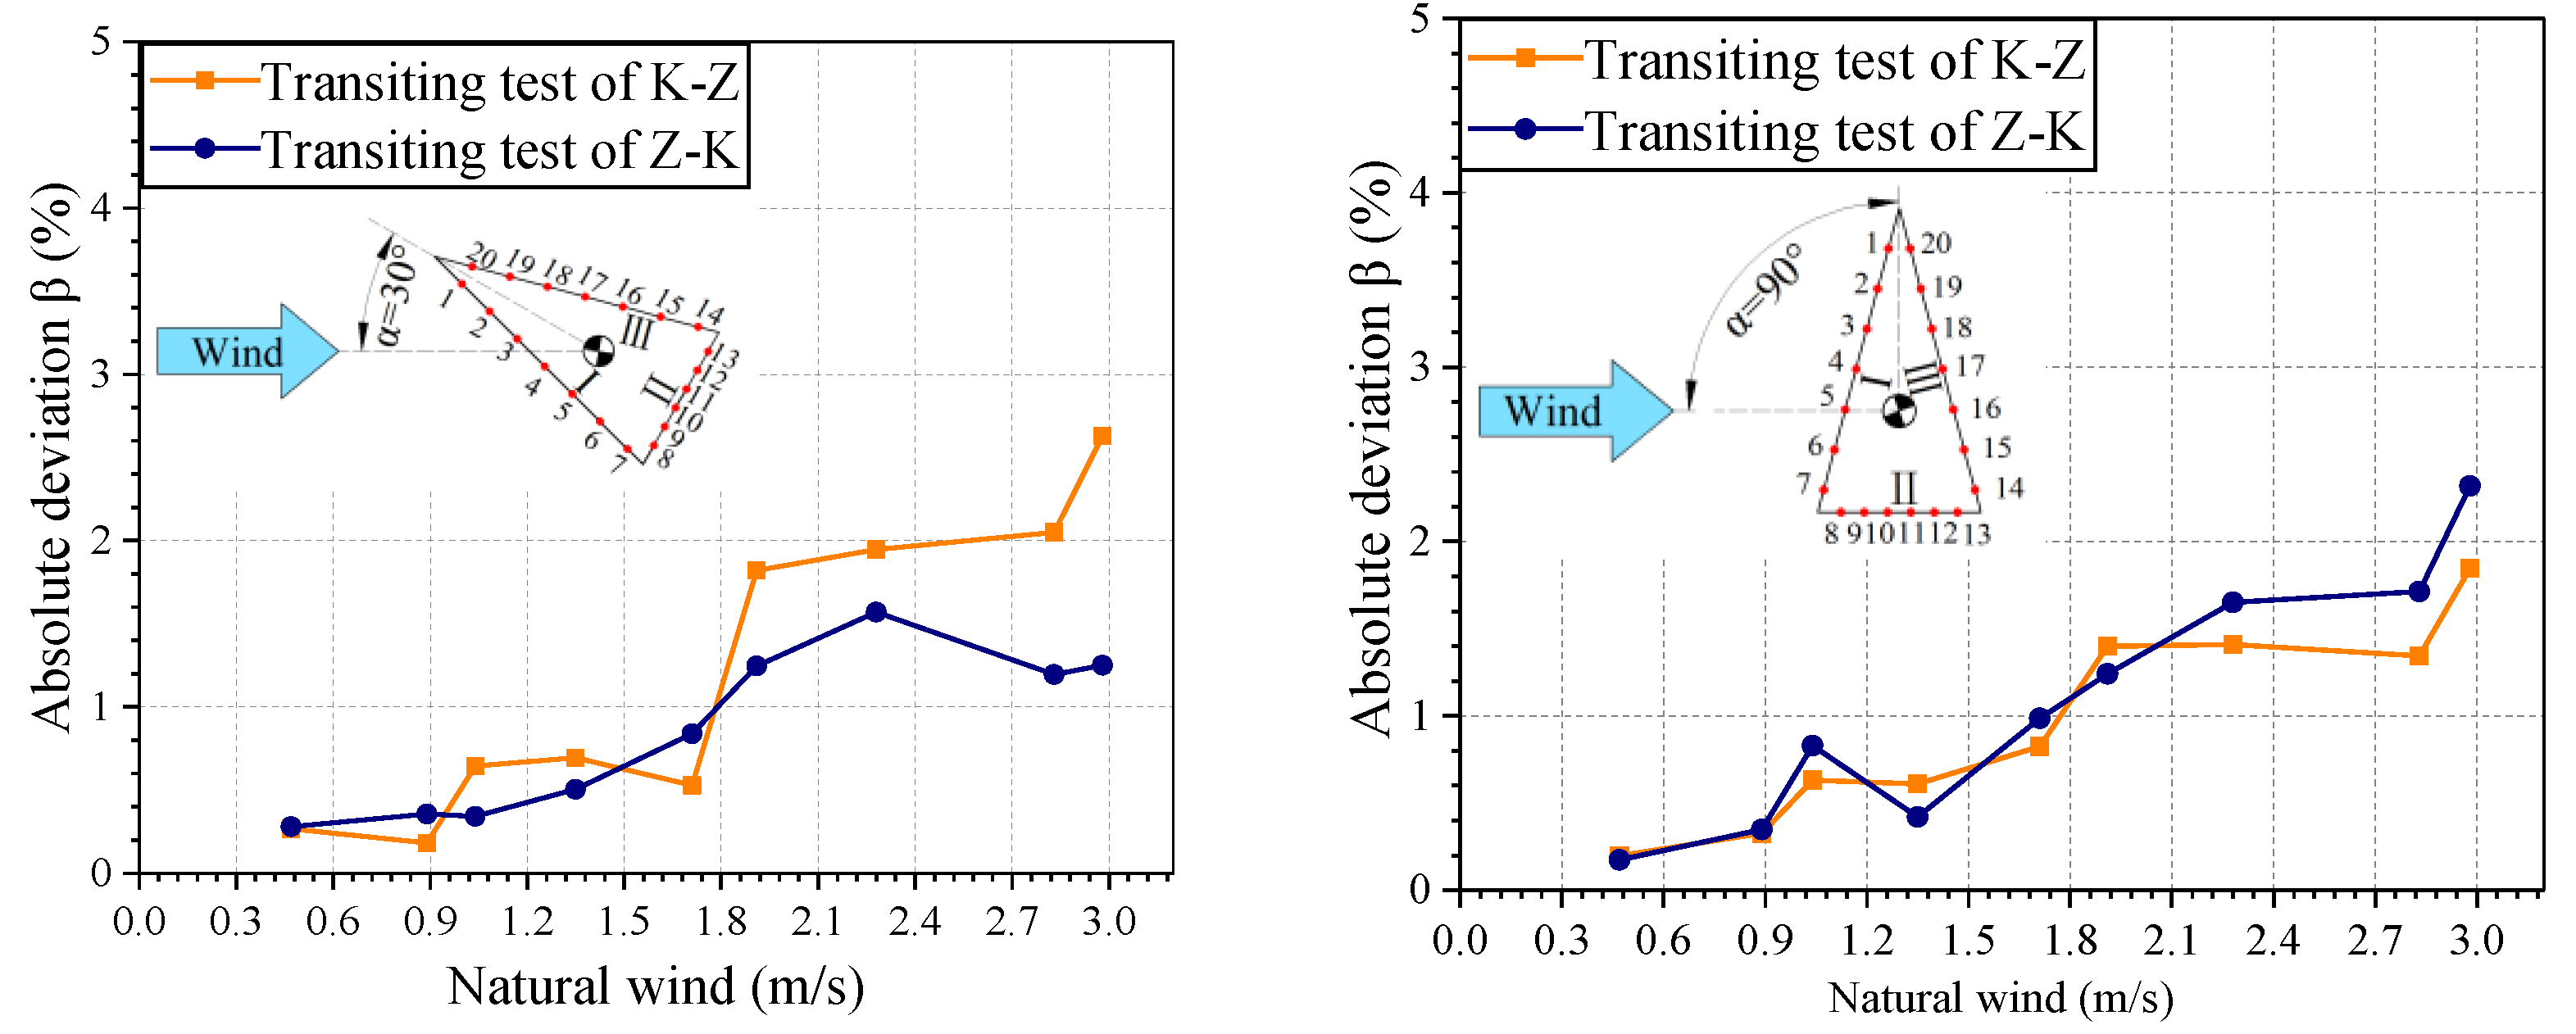
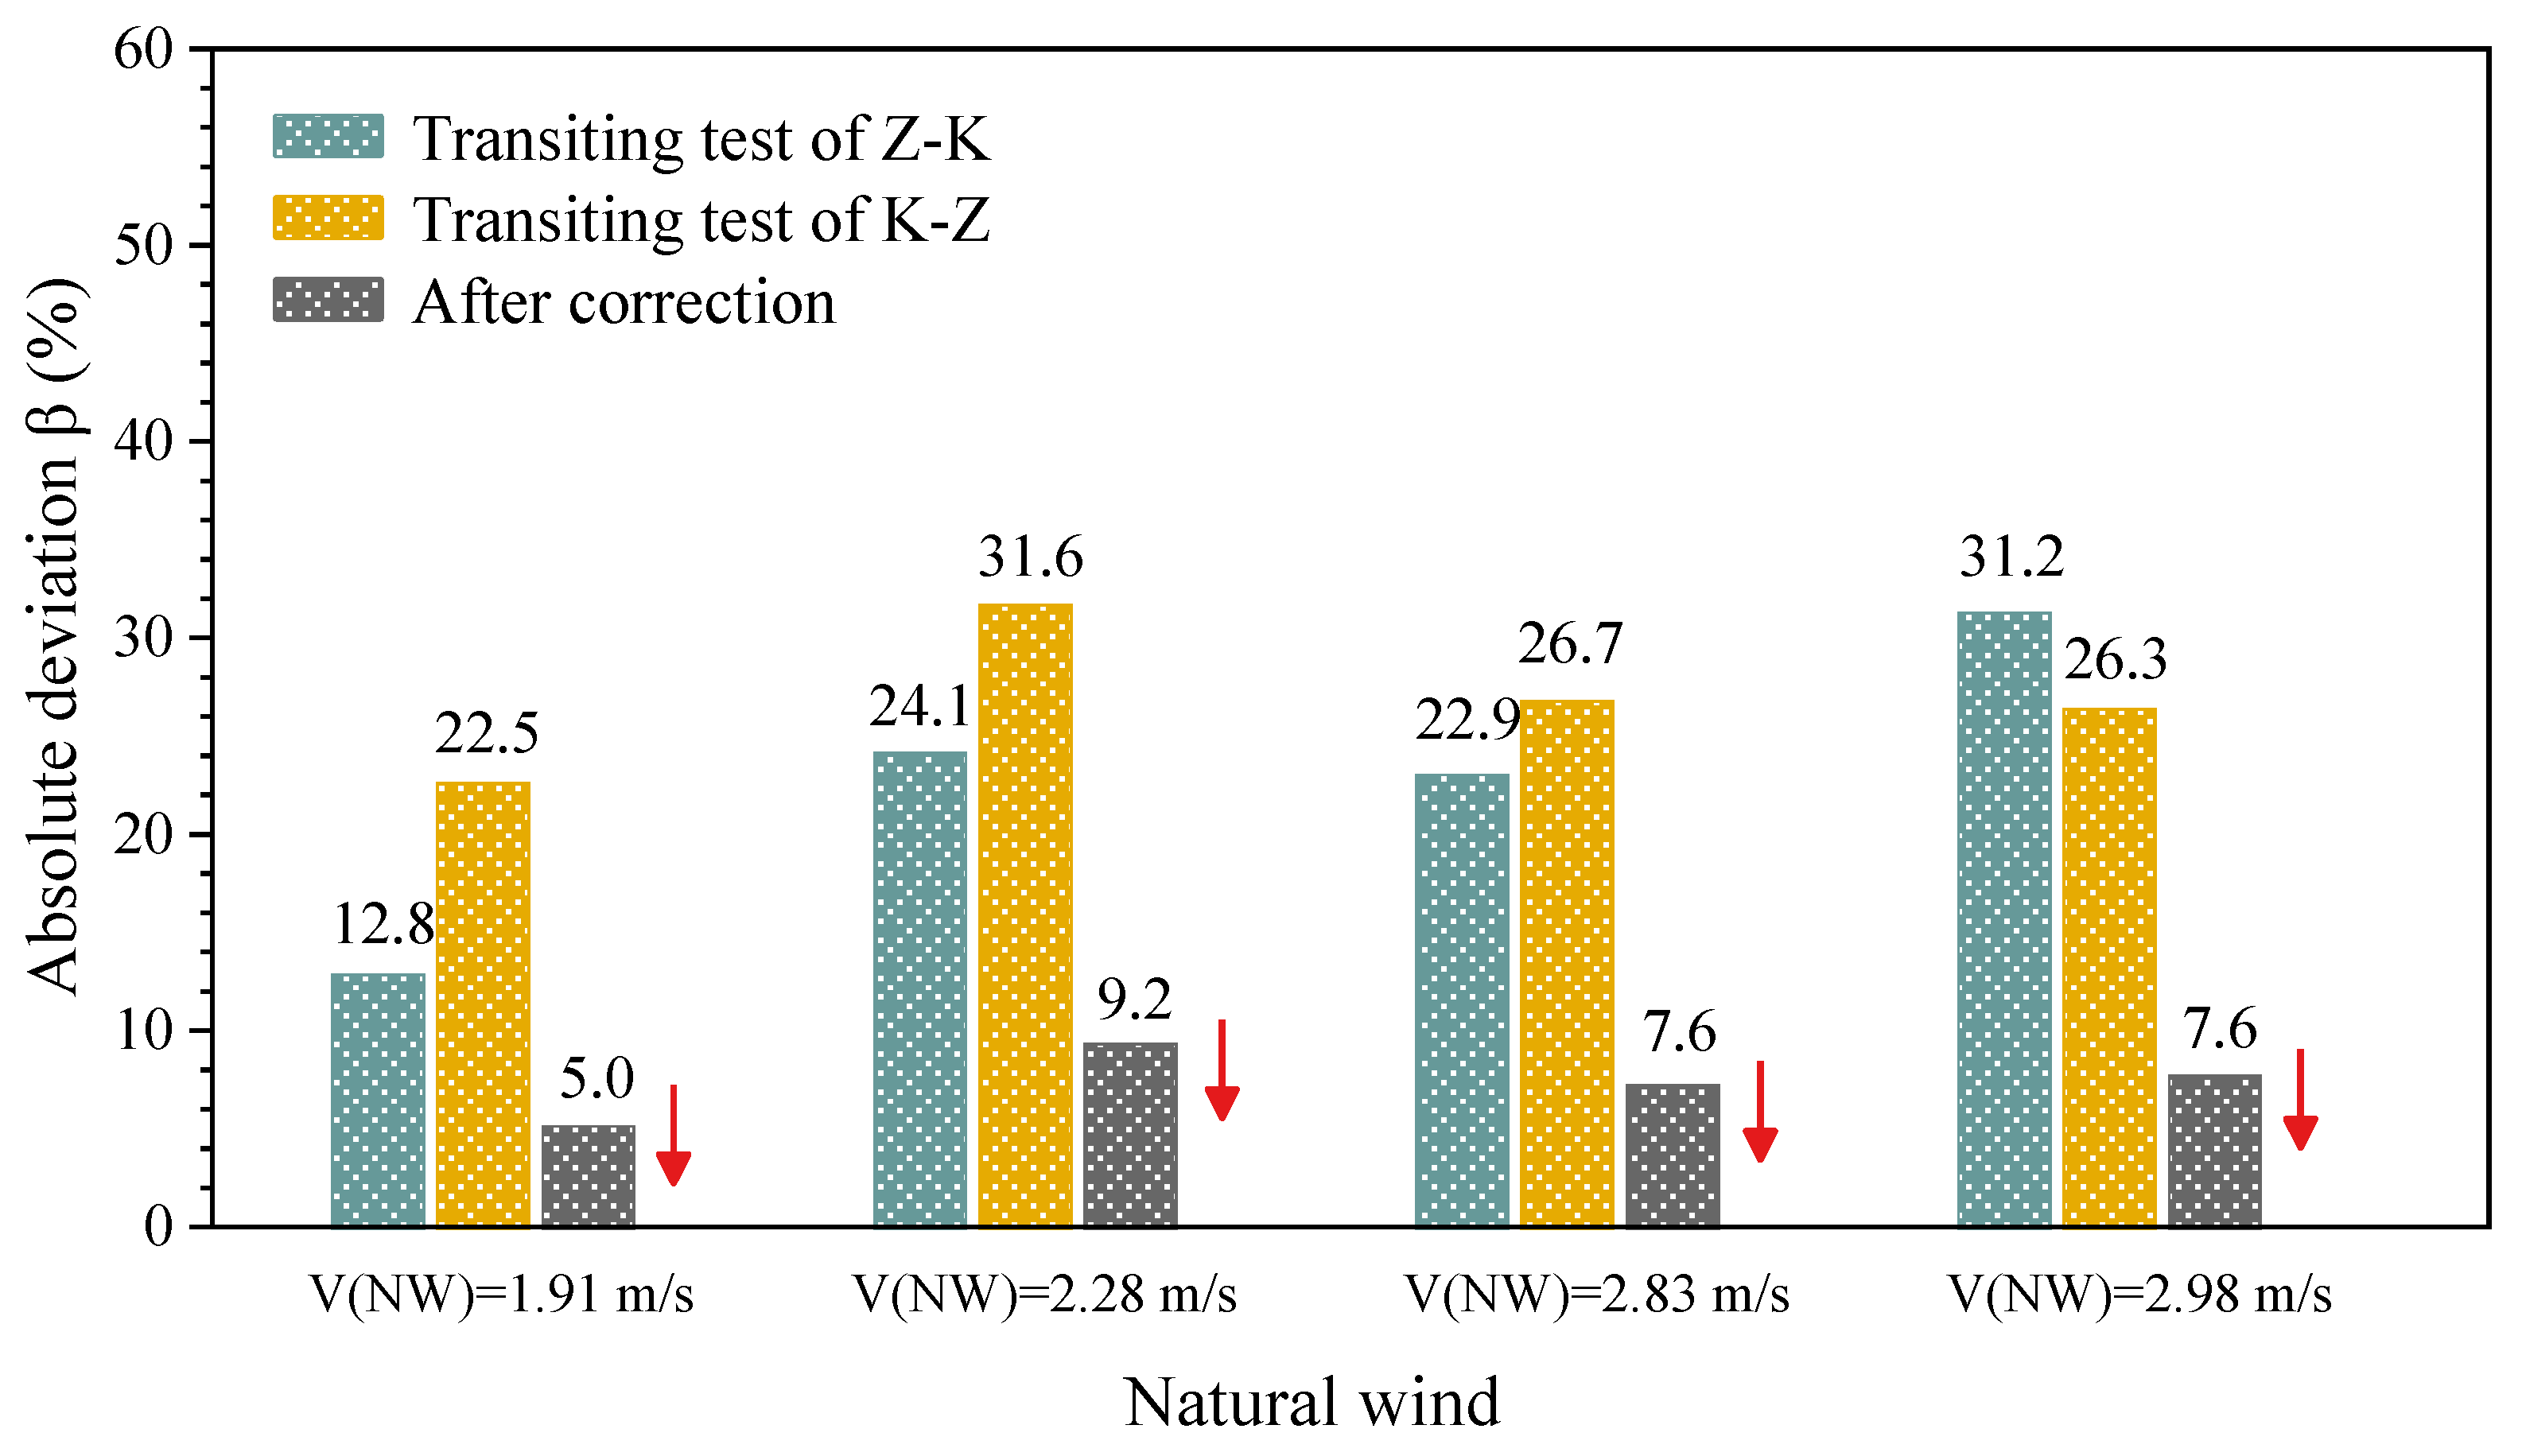
5.2. Correction of Natural Wind on the Mean Aerodynamic Pressure Coefficient

From the analysis of the influence of natural wind on the mean wind pressure coefficient of the triangular prism in Section 4.3, it is shown that natural wind conditions higher than 1.71 m/s seriously affect the accuracy of the wind pressure coefficient. In this natural wind environment, the results of transiting test should be corrected. In order to study the correction effect of the two-direction round-trip measurement method on the mean wind pressure coefficient, natural wind conditions of 1.91 m/s, 2.28 m/s, 2.83 m/s, and 2.98 m/s were selected.
Taking a wind attack angle of 30° as an example, the wind pressure coefficient curves of the triangular prism model, measured under the two-direction round-trip conditions, are shown in Figure 21. The results under the four wind speeds were significantly different and seriously deviated from the target curve measured under the weak natural wind condition. However, the corrected curves were more consistent with the target curve. In addition, as shown in Figure 22, the results obtained at a 90° wind attack angle also show that the wind pressure coefficient curves measured under the two-direction round-trip conditions seriously deviated from the target curve, but the corrected curve was more consistent with the target curve. The average absolute deviation β was used as an index to evaluate the correction effect. The smaller the β value, the more accurate the test result. The closer the wind pressure coefficient result is to the target curve, the better the correction effect. As shown in Figure 23 and Figure 24, the correction effect was particularly significant and the corrected wind pressure coefficients were more accurate. In addition, the corrected β value dropped to less than 10% at a 90° wind attack angle (Figure 24).
Therefore, the correction method of averaging the two-direction round-trip measurement can effectively correct the influence of natural wind on the wind pressure coefficient of the triangular prism structure and effectively improve the accuracy of the transiting test under natural wind conditions greater than 1.71 m/s.

6. Conclusions

In this study, the qualitative and quantitative analysis of the effect of natural wind on the transiting test was carried out. The following conclusions can be drawn from this study.
(1)
The wind field of the driving vehicle will be significantly affected only when the mean natural wind speed is greater than 1.71 m/s. The influence of natural wind in the range of 0–3.0 m/s on the mean velocity error of the driving wind is less than 10%.
(2)
The effect of natural wind on the aerodynamic force coefficients is limited and negligible when the mean natural wind speed is smaller than 1.91 m/s.
(3)
When mean natural wind speed is smaller than 1.71 m/s, the weak natural wind has a limited impact on the mean aerodynamic pressure coefficients and the impact can be ignored. Moreover, natural wind has no effect on the curve trend of the aerodynamic pressure coefficients. Natural wind has less influence on the positive wind pressure on the windward side that is lower than the negative pressure on the leeward side.
(4)
In summary, to improve the accuracy of the test results, it is recommended that the transiting test of aerodynamic coefficient is carried out under natural wind conditions of less than 1.71 m/s. If the transiting test is carried out under the condition that the average natural wind speed is greater than 1.71 m/s, it is recommended to use the correction method of taking the average value from the two-direction round-trip measurement.
(5)
The influence and correction of this research that are based on the segment model, and the natural wind influence analysis and correction that are based on the aeroelastic model transiting test, need further research.

Author Contributions

Conceptualization, S.L. and L.L.; methodology, G.Z. and X.L.; software, G.Z.; formal analysis, X.L.; investigation, S.L. and L.L. All authors have read and agreed to the published version of the manuscript.

Funding

The authors are grateful for the financial support from the National Natural Science Foundation of China (51778587, 51808510), the Key Scientific and Technological Research Projects of Henan Province (192102310514), the Foundation for University Young Key Teachers of Henan Province (2017GGJS005), and the Science and technology planning project of Transportation in Henan Province (2018J3).

Institutional Review Board Statement

Not applicable.

Informed Consent Statement

Not applicable.

Data Availability Statement

Not applicable.

Conflicts of Interest

The authors declare no conflict of interest.

References

  1. Aliabadi, S.K.; Rasekh, S. Effect of sudden change in free stream velocity on the wind turbine airfoil performance based on boundary element method. Eng. Anal. Bound. Elem. 2019, 101, 360–370. [Google Scholar] [CrossRef]
  2. Wan, J.W.; Wang, Q.; Liao, H.L.; Li, M.S. Study on aerodynamic coefficients and responses of the integrated catwalk of Halogaland Bridge. Wind Struct. 2017, 25, 215–232. [Google Scholar] [CrossRef]
  3. Cai, M.; Zhou, L.; Lei, H.; Huang, H. Wind tunnel test investigation on unsteady aerodynamic coefficients of iced 4-bundle conductors. Adv. Civ. Eng. 2019, 1, 1–12. [Google Scholar] [CrossRef] [Green Version]
  4. Sheng, R.; Perret, L.; Calmet, I.; Demouge, F.; Guilhot, J. Wind tunnel study of wind effects on a high-rise building at a scale of 1:300. J. Wind Eng. Ind. Aerodyn. 2018, 174, 391–403. [Google Scholar] [CrossRef]
  5. Park, B.H.; Han, Y.O. Steady aerodynamic characteristics of two-dimensional naca0012 airfoil for one revolution angle of attack. Int. J. Aeronaut. Space Sci. 2018, 19, 291–304. [Google Scholar] [CrossRef]
  6. Wang, Y.; Shen, S.; Li, G.; Huang, D.; Zheng, Z. Investigation on aerodynamic performance of vertical axis wind turbine with different series airfoil shapes. Renew. Energy 2018, 126, 801–818. [Google Scholar] [CrossRef]
  7. Alonso, G.; Meseguer, J. A parametric study of the galloping stability of two dimensional triangular cross-section bodies. J. Wind Eng. Ind. Aerodyn. 2006, 94, 241–253. [Google Scholar] [CrossRef]
  8. Alonso, G.; Meseguer, J.; Grande, I.P. Galloping stability of triangular cross sectional bodies: A systematic approach. J. Wind Eng. Ind. Aerodyn. 2007, 95, 928–940. [Google Scholar] [CrossRef]
  9. Giappino, S.; Melzi, S.; Tomasini, G. High-speed freight trains for intermodal transportation: Wind tunnel study on the aerodynamic coefficients of container wagons. J. Wind Eng. Ind. Aerodyn. 2018, 175, 111–119. [Google Scholar] [CrossRef]
  10. He, X.; Zou, Y.; Wang, H.; Han, Y.; Shi, K. Aerodynamic characteristics of a trailing rail vehicles on viaduct based on still wind tunnel experiments. J. Wind Eng. Ind. Aerod. 2014, 135, 22–33. [Google Scholar] [CrossRef]
  11. Noguchi, Y.; Suzuki, M.; Baker, C.; Nakade, K. Numerical and experimental study on the aerodynamic force coefficients of railway vehicles on an embankment in crosswind. J. Wind Eng. Ind. Aerodyn. 2019, 184, 90–105. [Google Scholar] [CrossRef]
  12. Li, J.; Li, Q.; Hu, S. Monitoring of wind pressures on gable roof of a low-rise building during tropical cyclones and comparisons with wind tunnel test results. Struct. Control. Health Monit. 2019, 38, e2380. [Google Scholar] [CrossRef]
  13. Ma, C.; Liu, Y.; Yeung, N.; Li, Q. Experimental Study of Across-Wind Aerodynamic Behavior of a Bridge Tower. J. Bridge. Eng. 2019, 24, 04018116. [Google Scholar] [CrossRef]
  14. Álvarez, A.; Nieto, F.; Nguyen, D.; Owen, J.; Hernandez, S. 3D LES simulations of a static and vertically free-to-oscillate 4:1 rectangular cylinder: Effects of the grid resolution. J. Wind Eng. Ind. Aerodyn. 2019, 192, 31–44. [Google Scholar] [CrossRef]
  15. Guo, P.; Li, S.; Wang, D. Effects of aerodynamic interference on the iced straddling hangers of suspension bridges by wind tunnel tests. J. Wind Eng. Ind. Aerodyn. 2019, 184, 162–173. [Google Scholar] [CrossRef]
  16. Guo, P.; Li, S.L.; Wang, C.Q.; Wang, D.W. Influence of catwalk design parameters on the galloping of constructing main cables in long-span suspension bridges. J. Vibroeng. 2017, 19, 4671–4684. [Google Scholar] [CrossRef]
  17. Meng, F.-Q.; He, B.-J.; Zhu, J.; Zhao, D.-X.; Darko, A.; Zhao, Z.-Q. Sensitivity analysis of wind pressure coefficients on CAARC standard tall buildings in CFD simulations. J. Build. Eng. 2018, 16, 146–158. [Google Scholar] [CrossRef]
  18. Rašuo, B. On boundary layer control in two-dimensional transonic wind tunnel testing. In Proceedings of the IUTAM Symposium on One Hundred Years of Boundary Layer Research, 2006; Volume 129, pp. 473–482. Available online: https://num.math.uni-goettingen.de/bail/documents/proceedings/rasuo.pdf (accessed on 1 June 2021).
  19. Argentini, T.; Diana, G.; Rocchi, D.; Somaschini, C. A case-study of double multi-modal bridge flutter: Experimental result and numerical analysis. J. Wind Eng. Ind. Aerod. 2016, 151, 25–36. [Google Scholar] [CrossRef]
  20. Wang, H.; Mao, J.-X.; Spencer, B.F. A monitoring-based approach for evaluating dynamic responses of riding vehicle on long-span bridge under strong winds. Eng. Struct. 2019, 189, 35–47. [Google Scholar] [CrossRef]
  21. Zhang, J.; Li, Q. Field measurements of wind pressures on a 600 m high skyscraper during a landfall typhoon and comparison with wind tunnel test. J. Wind Eng. Ind. Aerodyn. 2018, 175, 391–407. [Google Scholar] [CrossRef]
  22. Rašuo, B. 2012 Scaling between Wind Tunnels–Results Accuracy in Two-Dimensional Testing. Trans. Jpn. Soc. Aeronaut. Space Sci. 2012, 55, 109–115. [Google Scholar] [CrossRef] [Green Version]
  23. Ocokoljić, G.; Damljanović, D.; Vuković, Đ.; Rašuo, B. Contemporary frame of measurement and assessment of wind-tunnel flow quality in a low-speed facility. FME Trans. 2018, 46, 429–442. [Google Scholar] [CrossRef]
  24. Zocca, M.; Gori, G.; Guardone, A. Blockage and Three-Dimensional Effects in Wind-Tunnel Testing of Ice Accretion over Wings. J. Aircr. 2017, 54, 759–767. [Google Scholar] [CrossRef]
  25. Rašuo, B. The influence of Reynolds and Mach numbers on two-dimensional wind-tunnel testing: An experience. Aeronaut. J. 2011, 115, 249–254. [Google Scholar] [CrossRef]
  26. Rašuo, B. On Status of Wind Tunnel Wall Correction. In Proceedings of the 25th ICAS Congress, Hamburg, Germany, September 2006; Available online: https://www.icas.org/ICAS_ARCHIVE/ICAS2006/PAPERS/416.PDF (accessed on 1 June 2021).
  27. Ocokoljić, G.; Rašuo, B.; Kozić, M. Supporting system interference on aerodynamic characteristics of an aircraft model in a low-speed wind tunnel. Aerosp. Sci. Technol. 2017, 64, 133–146. [Google Scholar] [CrossRef]
  28. Linić, S.L.; Ocokoljić, G.J.; Ristić, S.S.; Lučanin, V.J.; Kozić, M.S.; Rašuo, B.P.; Jegdić, B.V. Boundary-layer transition detection by thermography and numerical method around bionic train model in wind tunnel test. Therm. Sci. 2018, 22, 1137–1148. [Google Scholar] [CrossRef] [Green Version]
  29. Meier, G.E.A.; Sreenivasan, K.R.; Heinemann, H.-J. (Eds.) IUTAM Symposium on One Hundred Years of Boundary Layer Research Book Series: Solid Mechanics and Its Applications 129; Springer: Berlin/Heidelberg, Germany, 2006. [Google Scholar] [CrossRef]
  30. Li, S.; Liu, L.; Wu, H.; Jiang, N.; Zheng, S.; Guo, P. New Test Method of Wind Pressure Coefficient Based on CAARC Standard Model Determined Using Vehicle Driving Wind. Exp. Tech. 2019, 43, 707–717. [Google Scholar] [CrossRef]
  31. Li, S.; Liang, J.; Zheng, S.; Jiang, N.; Liu, L.; Guo, P. A Novel Test Method for Aerodynamic Coefficient Measurements of Structures Using Wind Generated by a Moving Vehicle. Exp. Tech. 2019, 43, 677–693. [Google Scholar] [CrossRef]
  32. Li, S.; Wan, R.; Wang, D.; Guo, P. Effect of end plates on transiting test for measuring the aerodynamic coefficient of structures using wind generated by a moving vehicle. J. Wind Eng. Ind. Aerodyn. 2019, 190, 273–286. [Google Scholar] [CrossRef]
  33. Guo, P.; Wang, D.W.; Li, S.L.; Liu, L.L.; Wang, X.D. Transiting test method for galloping of iced conductor using wind generated by a moving vehicle. Wind Struct. 2019, 28, 155–170. [Google Scholar] [CrossRef]
  34. Li, S.; Chu, Y.; Liu, X.; Liu, L.; Guo, P.; Wang, X.; Li, P. Investigation on passive simulation method and factors influencing the type-C-terrain wind profile of a structural wind-resistant moving-vehicle tester. J. Build. Eng. 2020, 32, 101482. [Google Scholar] [CrossRef]
  35. Li, B.; Yang, Q.; Yang, J. Wind characteristics near ground in south-eastern coast area of China based on field measurement. Geomat. Nat. Haz. Risk 2016, 7, 57–69. [Google Scholar] [CrossRef] [Green Version]
  36. Nappo, C.J.; Hiscox, A.L.; Miller, D.R. A Note on Turbulence Stationarity and Wind Persistence Within the Stable Planetary Boundary Layer. Bound. Lay. Meteorol. 2010, 136, 165–174. [Google Scholar] [CrossRef]
  37. Yu, M.; Liu, J.; Liu, D.; Chen, H.; Zhang, J. Investigation of aerodynamic effects on the high-speed train exposed to longitudinal and lateral wind velocities. J. Fluid Struct. 2016, 61, 347–361. [Google Scholar] [CrossRef]
  38. Altinisik, A. Aerodynamic coast-down analysis of a passenger car for various configurations. Int. J. Automot. Technol. 2017, 18, 245–254. [Google Scholar] [CrossRef]
  39. Páscoa, J.C.; Brójo, F.P.; Santos, F.C.; Fael, P.O. An innovative experimental on-road testing method and its demonstration on a prototype vehicle. J. Mech. Sci. Technol. 2012, 26, 1663–1670. [Google Scholar] [CrossRef]
  40. McAuliffe, B.R.; Chuang, D. Track-Based Aerodynamic Testing of a Heavy-Duty Vehicle: Coast-Down Measurements SAE. Int. J. Commer. Veh. 2016, 9, 381–396. [Google Scholar] [CrossRef]
  41. Ji, L.; Tan, H.; Kato, S.; Bu, Z.; Takahashi, T. Wind tunnel investigation on influence of fluctuating wind direction on cross natural ventilation. Build. Environ. 2011, 46, 2490–2499. [Google Scholar] [CrossRef]
  42. Kozmar, H.; Butler, K.; Kareem, A. Downslope Gusty Wind Loading of Vehicles on Bridges. J. Bridge. Eng. 2015, 20, 04015008. [Google Scholar] [CrossRef]
  43. Baker, C.J. The simulation of unsteady aerodynamic cross wind forces on trains. J. Wind Eng. Ind. Aerodyn. 2010, 98, 88–99. [Google Scholar] [CrossRef]
  44. Veldhuizen, R.; Van Raemdonck, G.; Van Der Krieke, J. Fuel economy improvement by means of two European tractor semi-trailer combinations in a platooning formation. J. Wind Eng. Ind. Aerodyn. 2019, 188, 217–234. [Google Scholar] [CrossRef]
  45. McAuliffe, B.R.; Belluz, L.; Belzile, M. Measurement of the On-Road Turbulence Environment Experienced by Heavy Duty Vehicles SAE. Int. J. Commer. Veh. 2014, 7, 685–702. [Google Scholar] [CrossRef]
  46. Zhang, X.L.; Liu, P.F. Virtual Test System for Coast-down Resistance of Motor Vehicle with Compensation of Wind Speed and Direction. Trans. Chin. Soc. Agric. Mach. 2017, 48, 390–397. [Google Scholar]
  47. Yan, L.; Zhu, L.D.; Flay, R. Comparison of force-balance and pressure measurements on deck strips on a stationary bridge model. J. Wind Eng. Ind. Aerod. 2017, 164, 96–107. [Google Scholar] [CrossRef]
  48. Ganapathi, C.S.; Harikrishna, P.; Rajan, S.S. Effects of upstream terrain characteristics on aerodynamic coefficients of structures. Arch. Civ. Mech. Eng. 2017, 17, 776–785. [Google Scholar] [CrossRef]
  49. Fiedler, M.; Berg, W.; Ammon, C.; Loebsin, C.; Sanftleben, P.; Samer, M.; Von Bobrutzki, K.; Kiwan, A.; Saha, C.K. Air velocity measurements using ultrasonic anemometers in the animal zone of a naturally ventilated dairy barn. Biosyst. Eng. 2013, 116, 276–285. [Google Scholar] [CrossRef]
  50. Wang, H.; Wu, T.; Tao, T.; Li, A.; Kareem, A. Measurements and analysis of non-stationary wind characteristics at Sutong Bridge in Typhoon Damrey. J. Wind Eng. Ind. Aerod. 2016, 151, 100–106. [Google Scholar] [CrossRef] [Green Version]
  51. GB50009-2012 Load Code for the Design of Building Structures Beijing; China Architecture and Building Press. Available online: https://www.chinesestandard.net/PDF.aspx/GB50009-2012 (accessed on 1 June 2021).
  52. Fu, J.; Zheng, Q.; Huang, Y.; Wu, J.; Pi, Y.; Liu, Q. Design optimization on high-rise buildings considering occupant comfort reliability and joint distribution of wind speed and direction. Eng. Struct. 2018, 156, 460–471. [Google Scholar] [CrossRef]
  53. Li, Q.; Zhi, L.; Hu, F. Boundary layer wind structure from observations on a 325m tower. J. Wind Eng. Ind. Aerod. 2010, 98, 818–832. [Google Scholar] [CrossRef]
  54. Liu, Z.; Zheng, C.; Wu, Y.; Song, Y. Investigation on characteristics of thousand-meter height wind profiles at non-tropical cyclone prone areas based on field measurement. Build. Environ. 2018, 130, 62–73. [Google Scholar] [CrossRef]
  55. Duncan, B.; D’Alessio, L.; Gargoloff, J.; Alajbegovic, A. Vehicle aerodynamics impact of on-road turbulence. Proc. Inst. Mech. Eng. Part D J. Automob. Eng. 2017, 231, 1148–1159. [Google Scholar] [CrossRef] [Green Version]
  56. Chevula, S.; Sanz-Andres, A.; Franchini, S. Franchini, Estimation of the correction term of pitot tube measurements in unsteady (gusty) flows. Flow. Meas. Instrum. 2015, 46, 179–188. [Google Scholar] [CrossRef]
  57. Wordley, S.; Saunders, J.W. On-road Turbulence. SAE Int. J. Passeng. Cars Mech. Syst. 2008, 1, 341–360. [Google Scholar] [CrossRef]
  58. Ricciardelli, F.; De Grenet, E.T.; Hangan, H. Pressure distribution, aerodynamic forces and dynamic response of box bridge sections. J. Wind Eng. Ind. Aerod. 2002, 90, 1135–1150. [Google Scholar] [CrossRef]
Figure 1. Typical view of transiting test devices.
Symmetry 13 01493 g001
Figure 2. Triangular prism model.
Symmetry 13 01493 g002
Figure 3. Layout of pressure tap and aerodynamic force conventions.
Symmetry 13 01493 g003
Figure 4. Procedure of the transiting test.
Symmetry 13 01493 g004
Figure 5. Test route and natural wind measurement position: (a) test route, (b) road conditions of route, and (c,d) natural wind measurement position.
Symmetry 13 01493 g005
Figure 6. System of natural wind collection.
Symmetry 13 01493 g006
Figure 7. Coordinate system of wind speed.
Symmetry 13 01493 g007
Figure 8. Mean value and wind roses of different natural wind conditions.
Symmetry 13 01493 g008aSymmetry 13 01493 g008b
Figure 9. Time–history curve of the various natural wind conditions.
Symmetry 13 01493 g009
Figure 10. History curves of wind generated by the driving vehicle under three different natural winds.
Symmetry 13 01493 g010
Figure 11. Variation of mean wind speed with natural wind.
Symmetry 13 01493 g011
Figure 12. Coefficient of wind speed variation under different natural winds.
Symmetry 13 01493 g012
Figure 13. Variation in the mean aerodynamic force coefficients with natural wind for 30° angle of wind incidence.
Symmetry 13 01493 g013
Figure 14. Variation in the mean aerodynamic force coefficients with natural wind for 90° angle of wind incidence.
Symmetry 13 01493 g014
Figure 15. Comparison of the distribution curves of the mean pressure coefficient under different natural winds for 30° (a) and 90° (b) angles of wind incidence.
Symmetry 13 01493 g015
Figure 16. Variation in the absolute deviation of the mean pressure coefficient with natural wind for 30° (left) and 90° (right) angles of wind incidence.
Symmetry 13 01493 g016
Figure 17. Comparison of downwind and headwind driving under the same natural wind.
Symmetry 13 01493 g017
Figure 18. Schematic diagram of the two-direction round-trip measurement.
Symmetry 13 01493 g018
Figure 19. Comparison of aerodynamic force coefficients of the structure before and after correction under different natural wind conditions at a 30° attack angle.
Symmetry 13 01493 g019
Figure 20. Comparison of aerodynamic force coefficients of the structure before and after correction under different natural wind conditions at a 90° attack angle.
Symmetry 13 01493 g020
Figure 21. Comparison of the aerodynamic pressure coefficient curves of the triangular prism before and after the correction under the strong natural condition with a 30° wind attack angle.
Symmetry 13 01493 g021
Figure 22. Comparison of the aerodynamic pressure coefficient curves of the triangular prism before and after the correction under the strong natural condition with a 90° wind attack angle.
Symmetry 13 01493 g022
Figure 23. Correction effect of aerodynamic pressure coefficient of triangular prism structure under strong natural conditions with a 30° wind attack angle.
Symmetry 13 01493 g023
Figure 24. Correction effect of aerodynamic pressure coefficient of triangular prism structure under strong natural conditions with a 90° wind attack angle.
Symmetry 13 01493 g024
Table 1. Test conditions.
Driving SpeedModel PlacementWind Attack Angle αTest RouteRange of Natural Wind Speed
72 km/h
(20 m/s)
Horizontal30°K–Z0–3.0 m/s
Z–K
90°K–Z
Z–K
Table 2. Natural wind conditions.
CaseTest Date Natural   Wind   Speed   in   10   m ,   V ( N W ) Natural   Wind   Speed   in   2   m ,   V ( N W )
120 May 20190.47 m/s0.33 m/s
226 Sep. 20190.89 m/s0.62 m/s
321 May 20191.04 m/s0.73 m/s
428 Aug. 20191.35 m/s0.95 m/s
529 Aug. 20191.71 m/s1.20 m/s
629 Aug. 20191.91 m/s1.34 m/s
716 Apr. 20192.28 m/s1.60 m/s
814 May 20192.83 m/s1.98 m/s
914 May 20192.98 m/s2.08 m/s
Note: V ( NW ) = V ( NW ) ( H / H ) α , α = 0.3 [54], H = 2 m, H = 10   m .
Publisher’s Note: MDPI stays neutral with regard to jurisdictional claims in published maps and institutional affiliations.

