
Study of Temperature Field Distribution in Topographic Bias Tunnel Based on Monitoring Data

 ,
,
Abstract
:1. Introduction
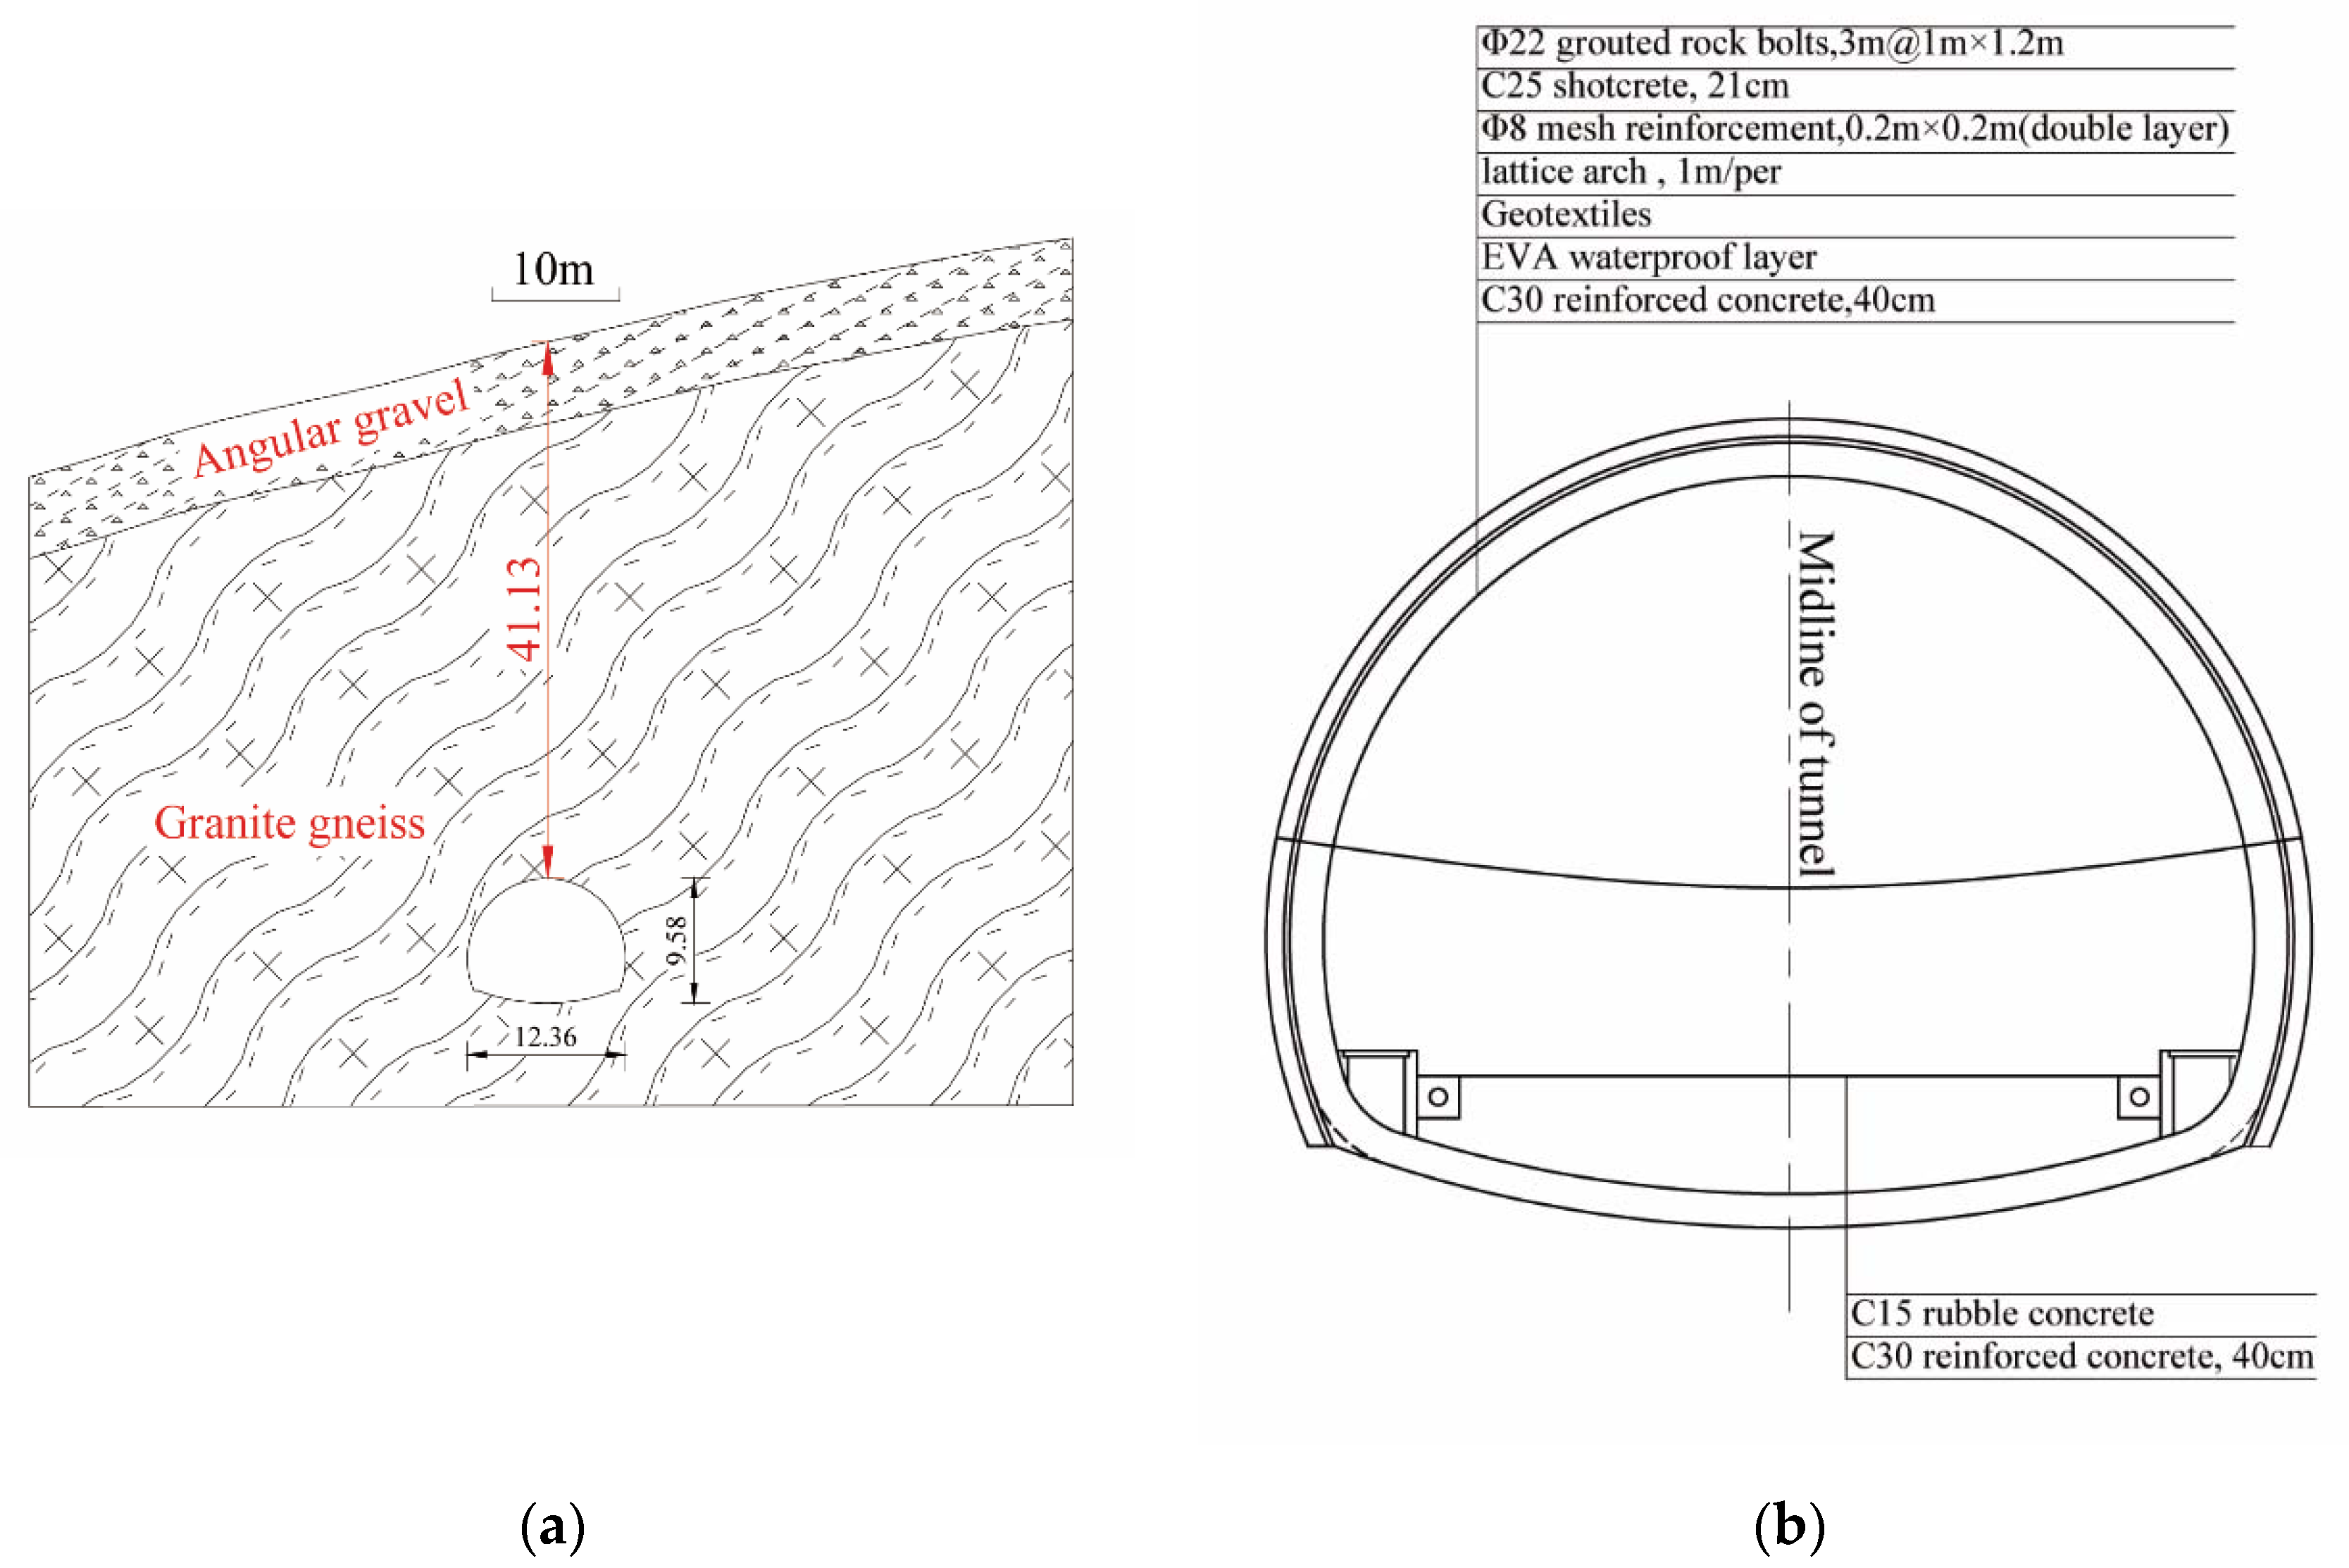
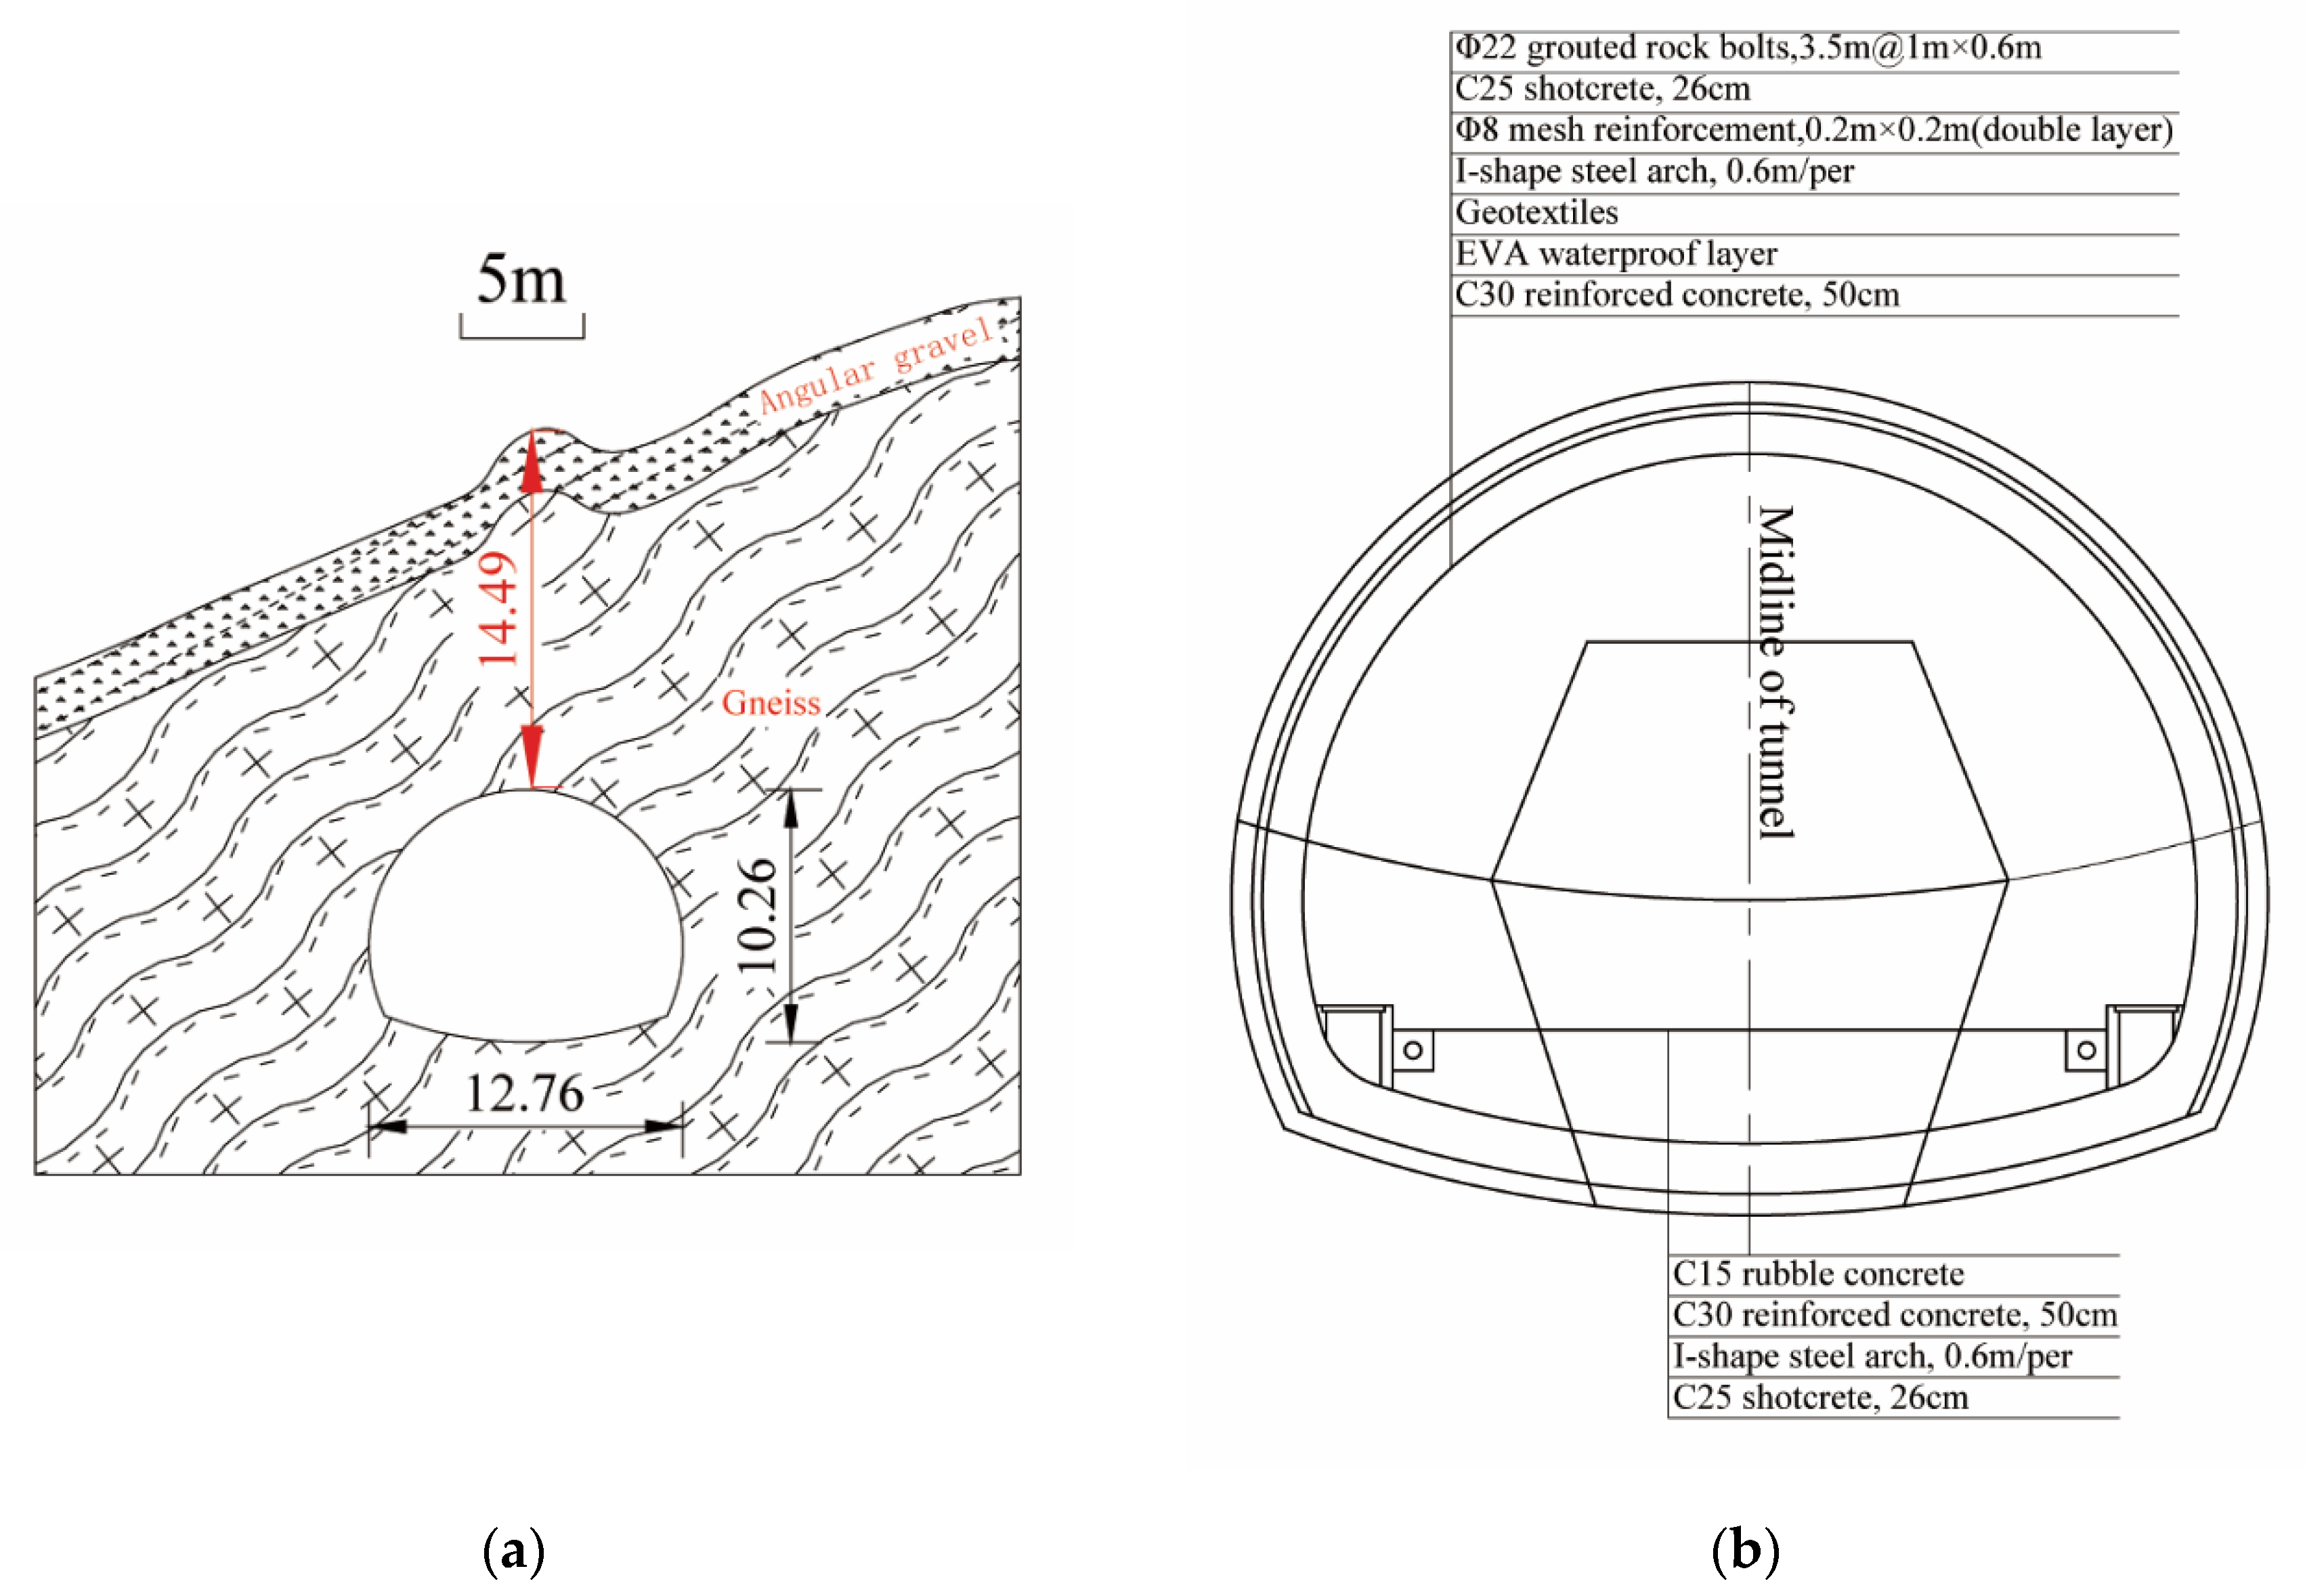
2. Engineering Geological Conditions
3. Monitoring Arrangement and Results
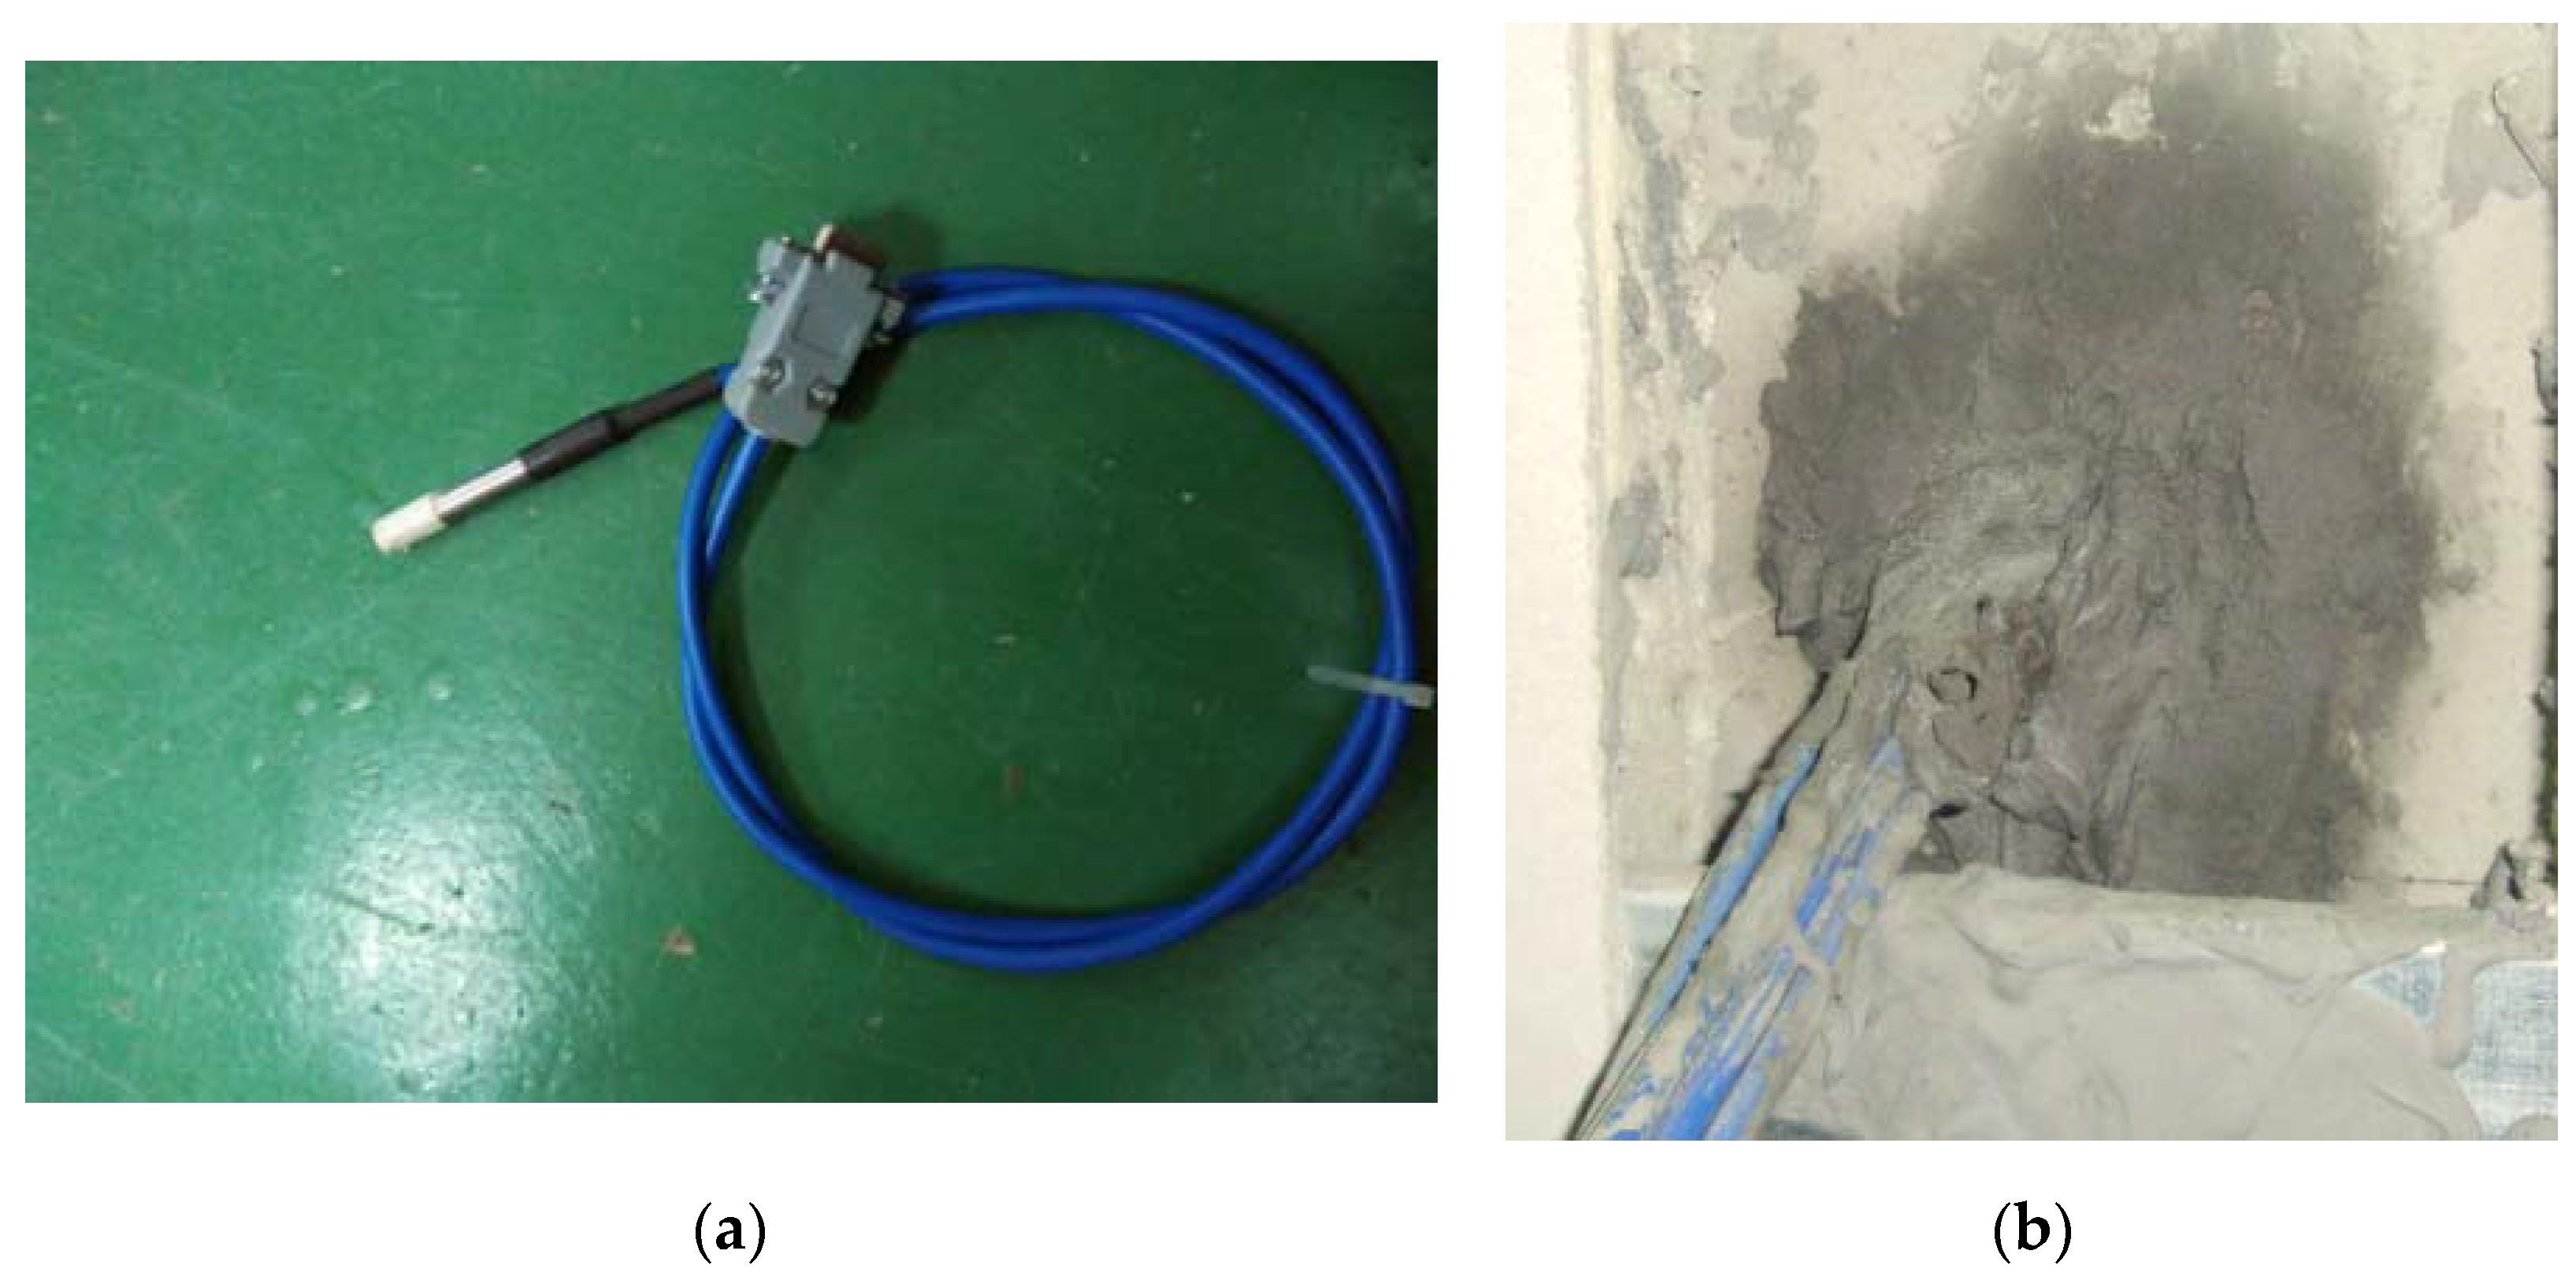
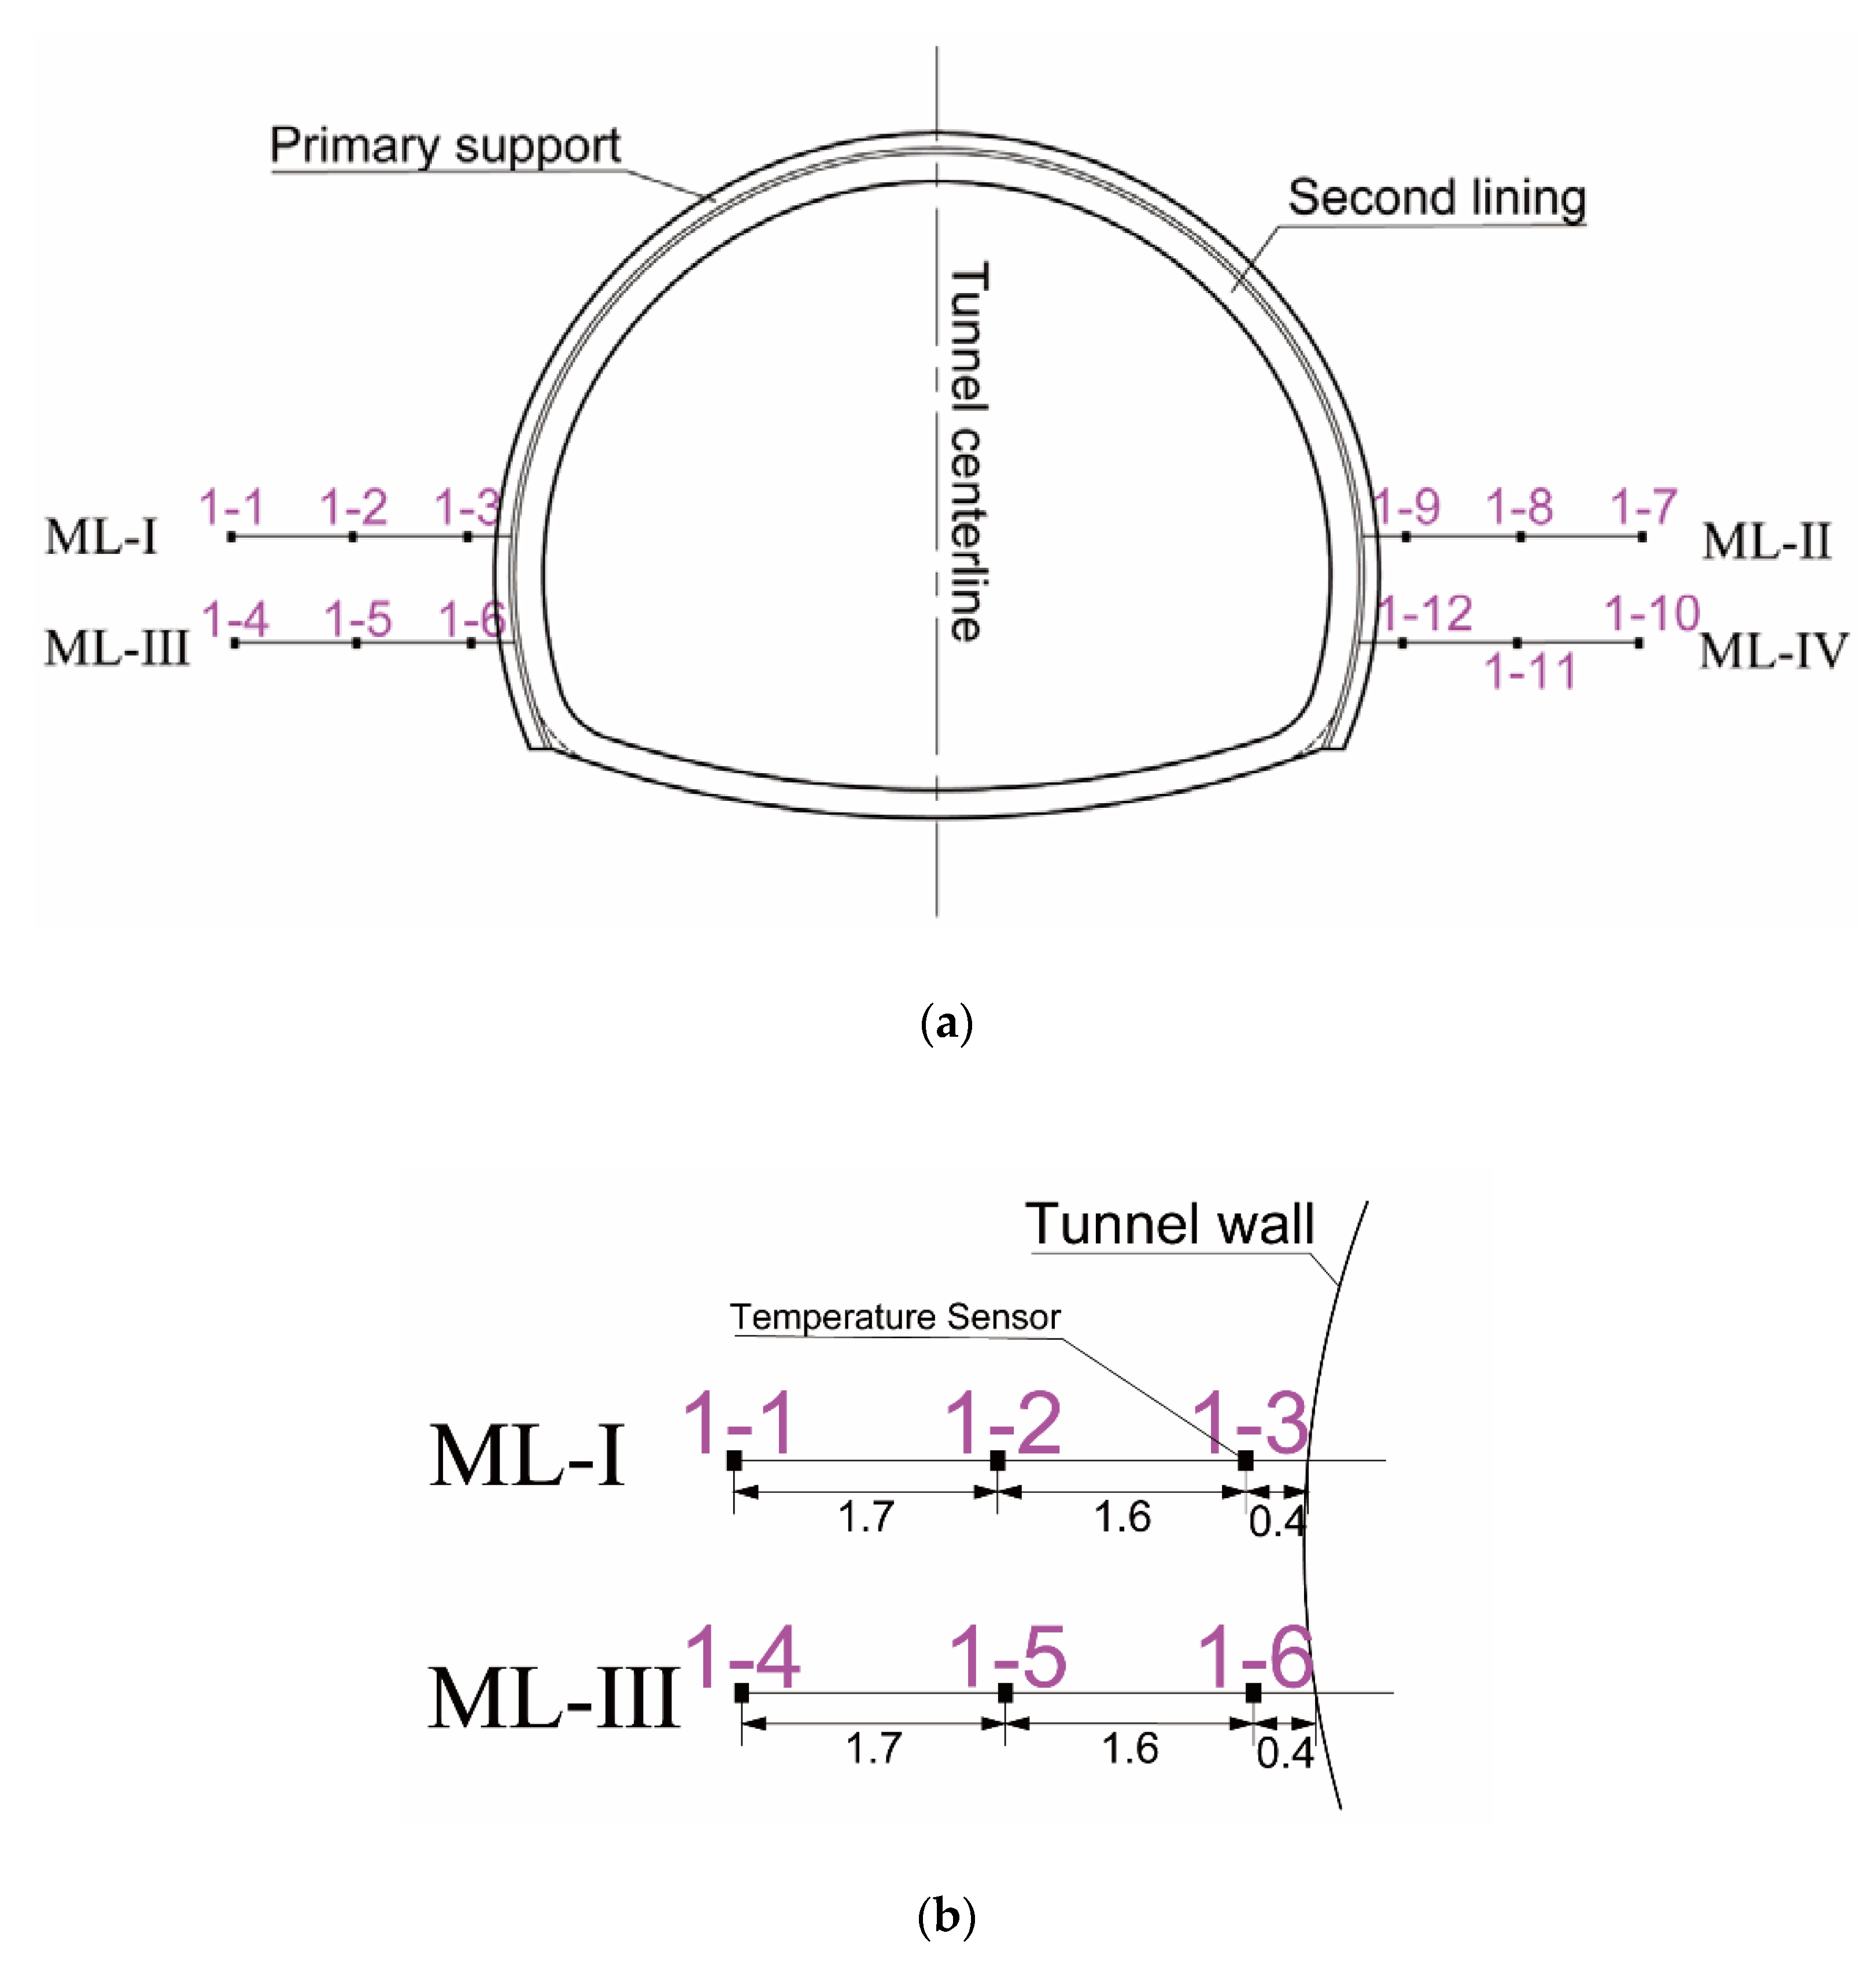
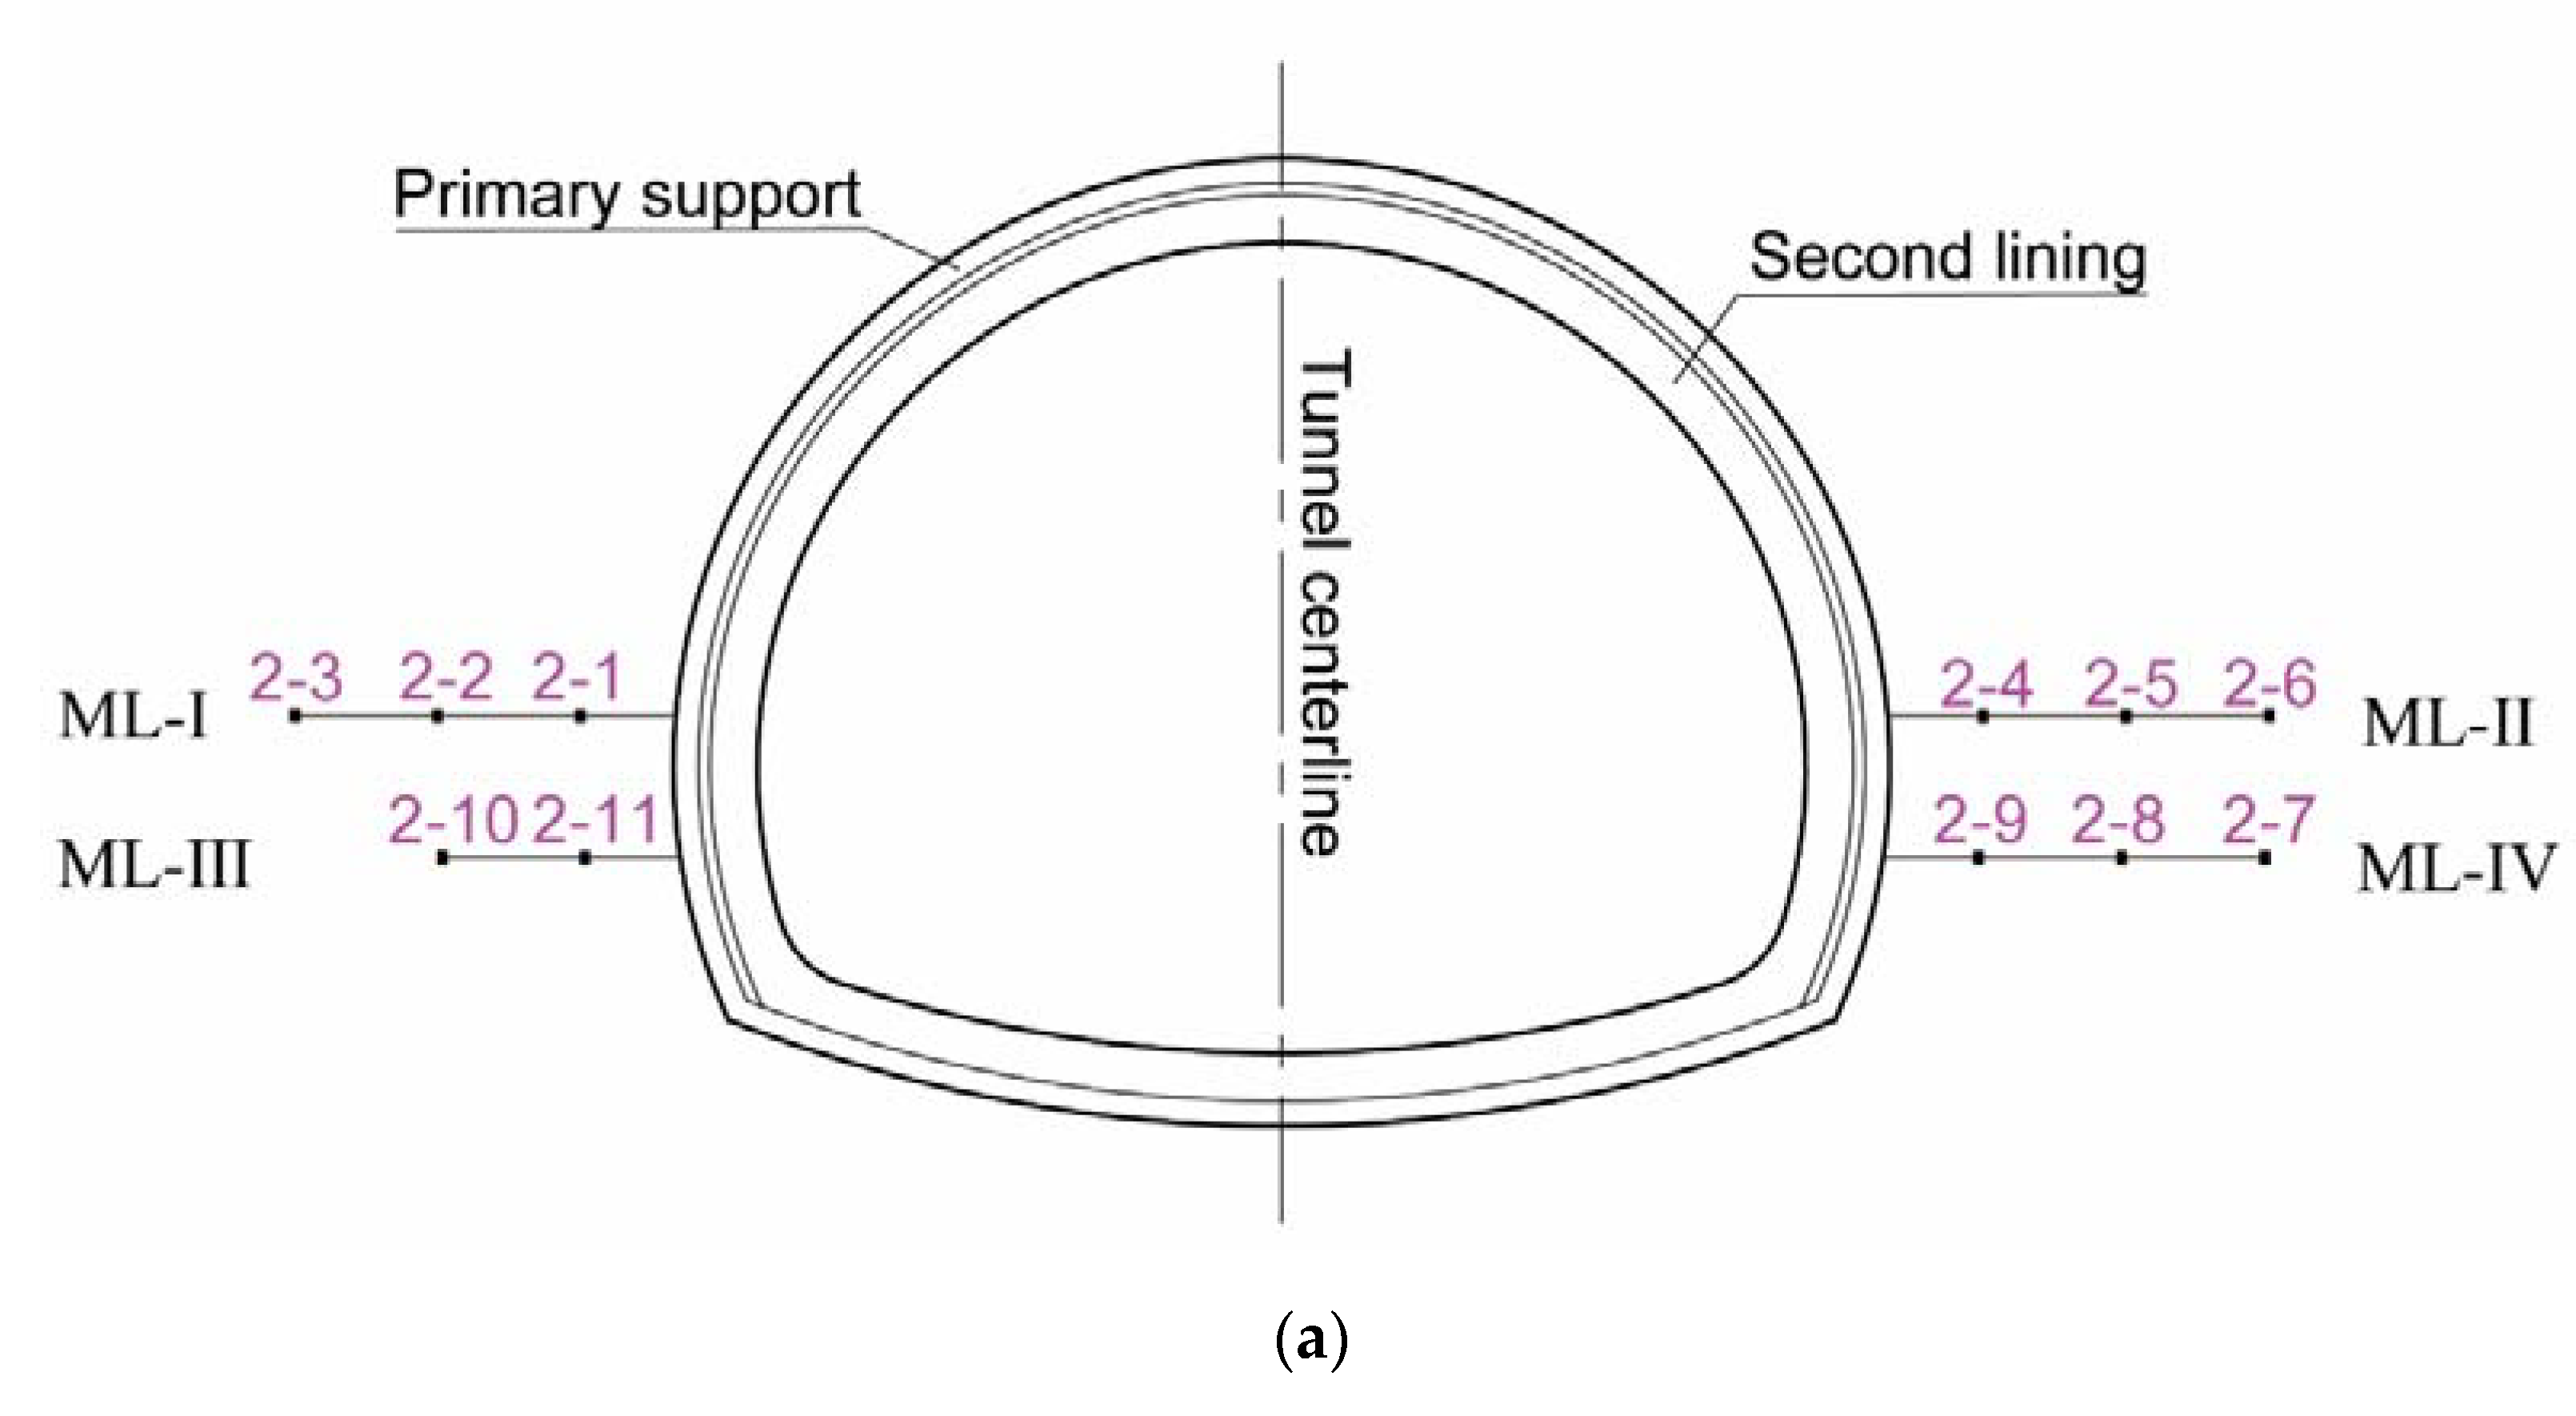
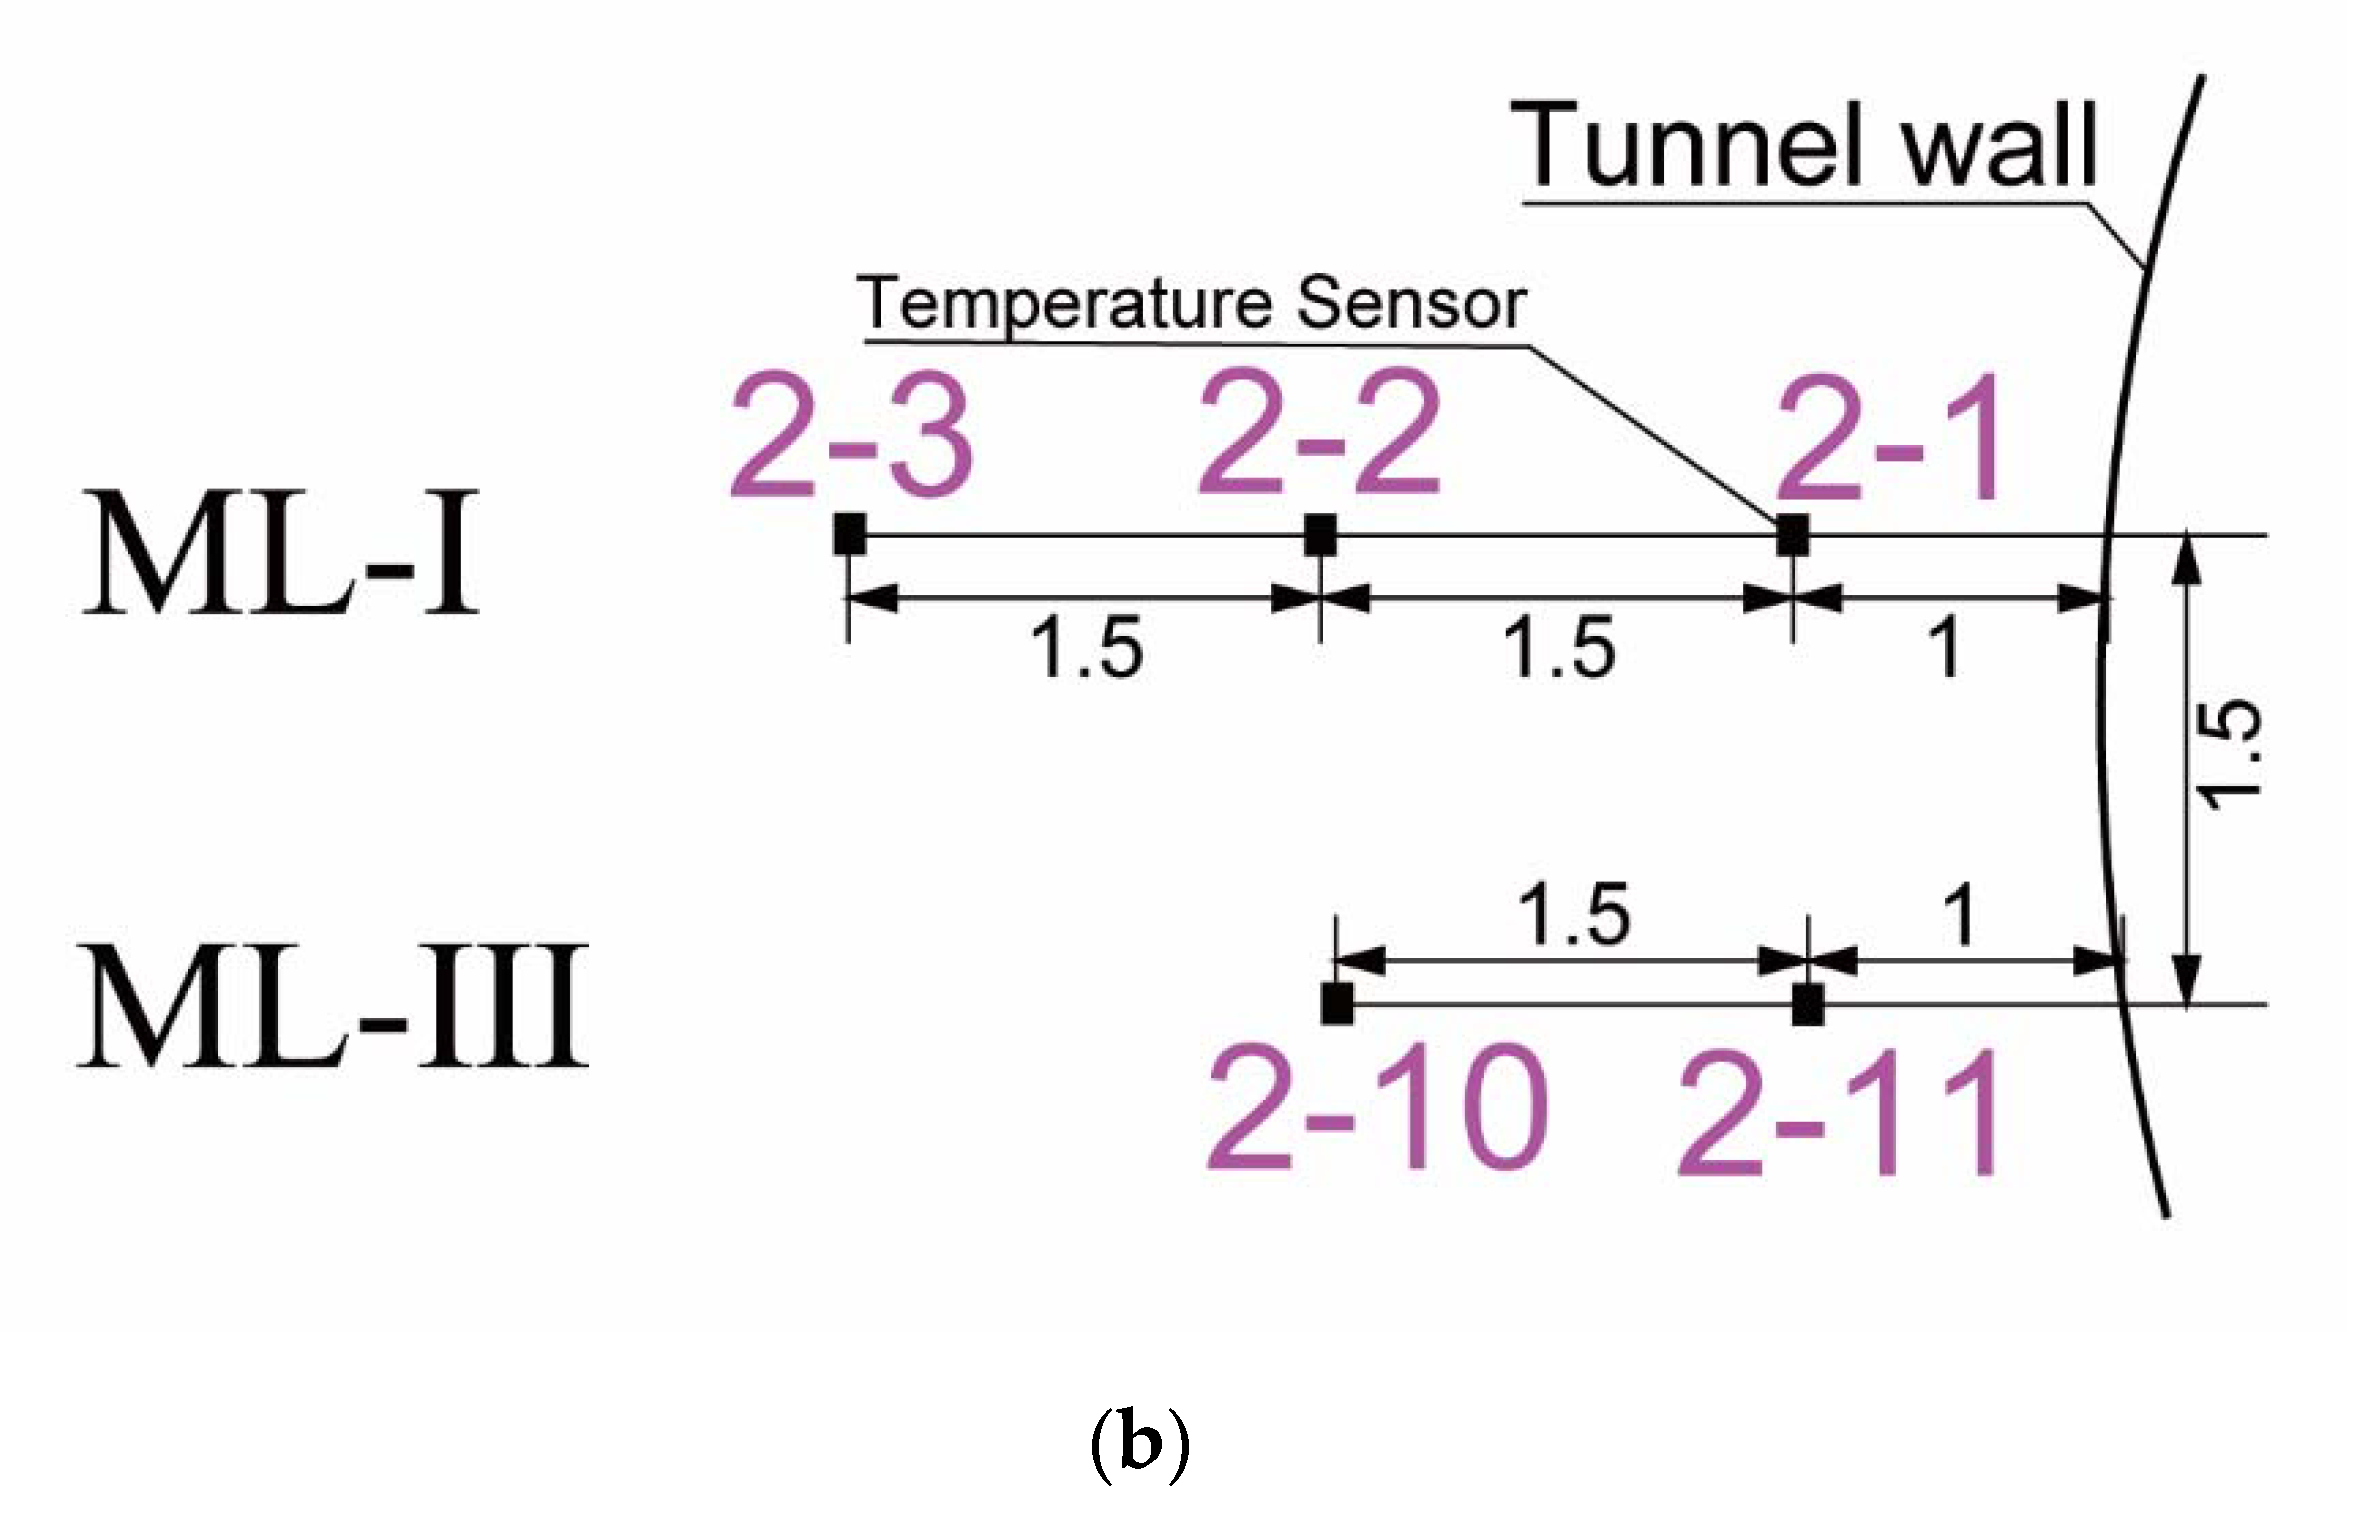
3.1. Monitoring Arrangement
3.2. Monitoring Results of Section 1 (Section LK316 + 260)
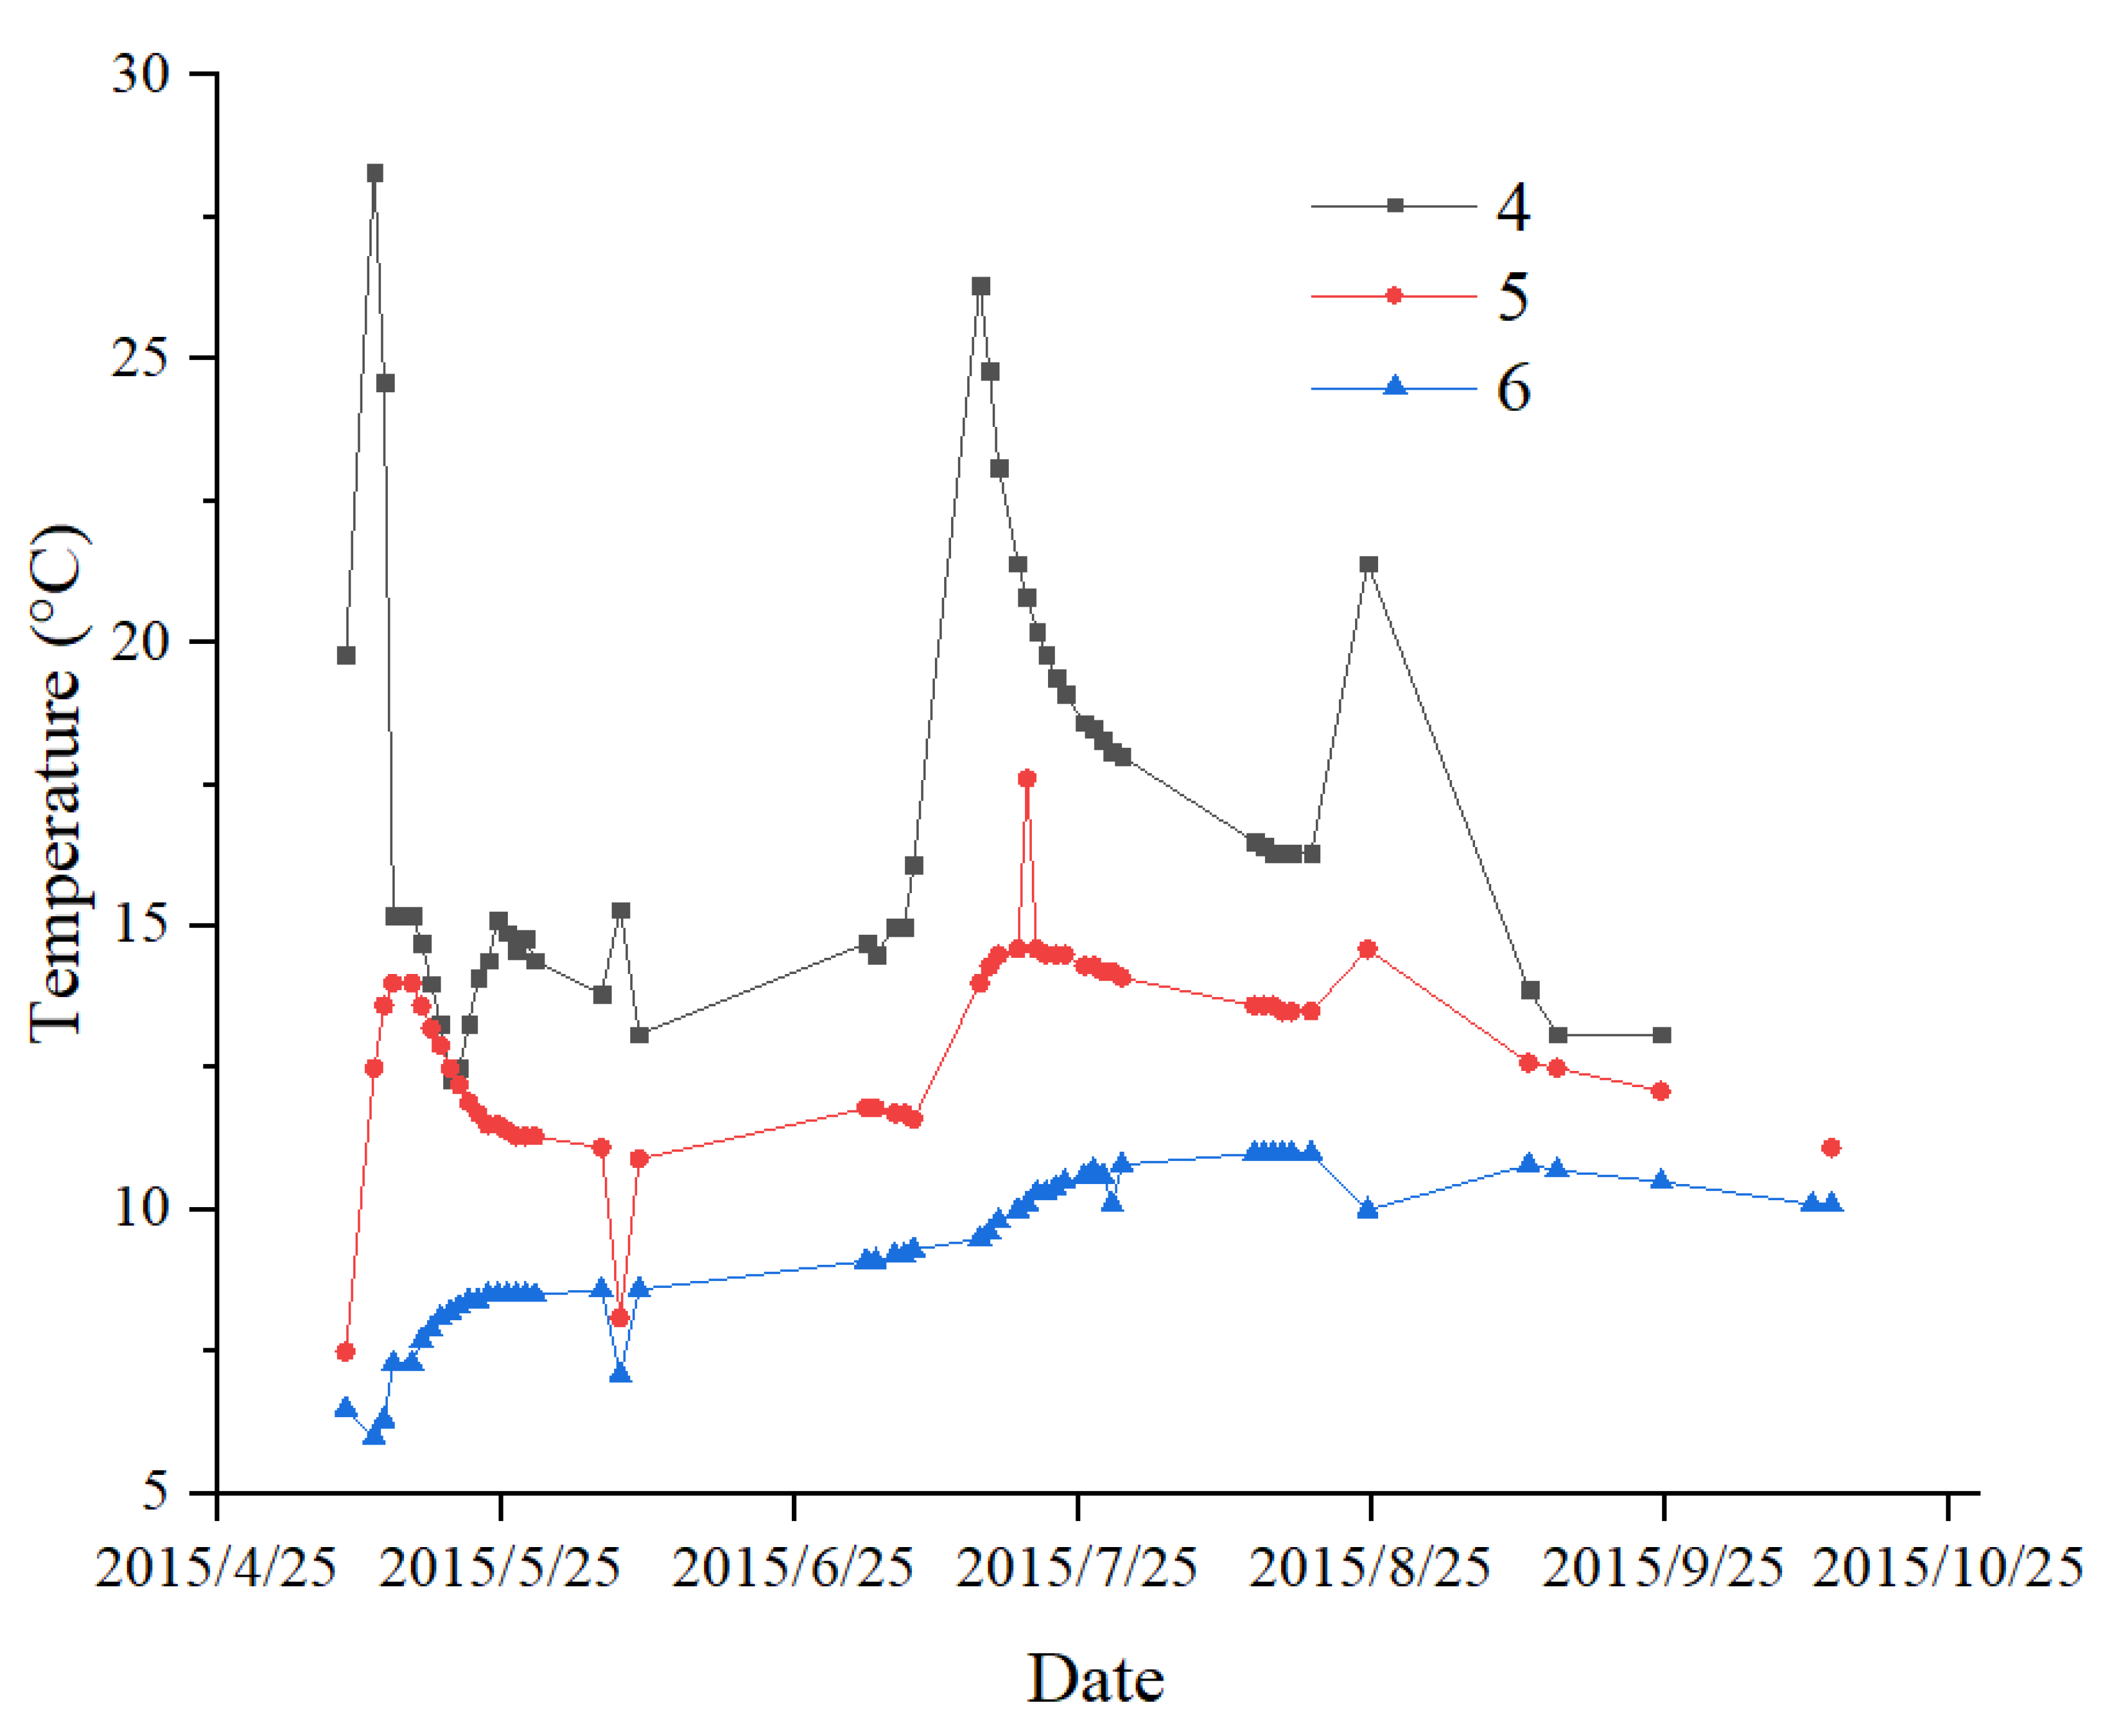
3.2.1. Patterns of Temperature Change in the Short-Term
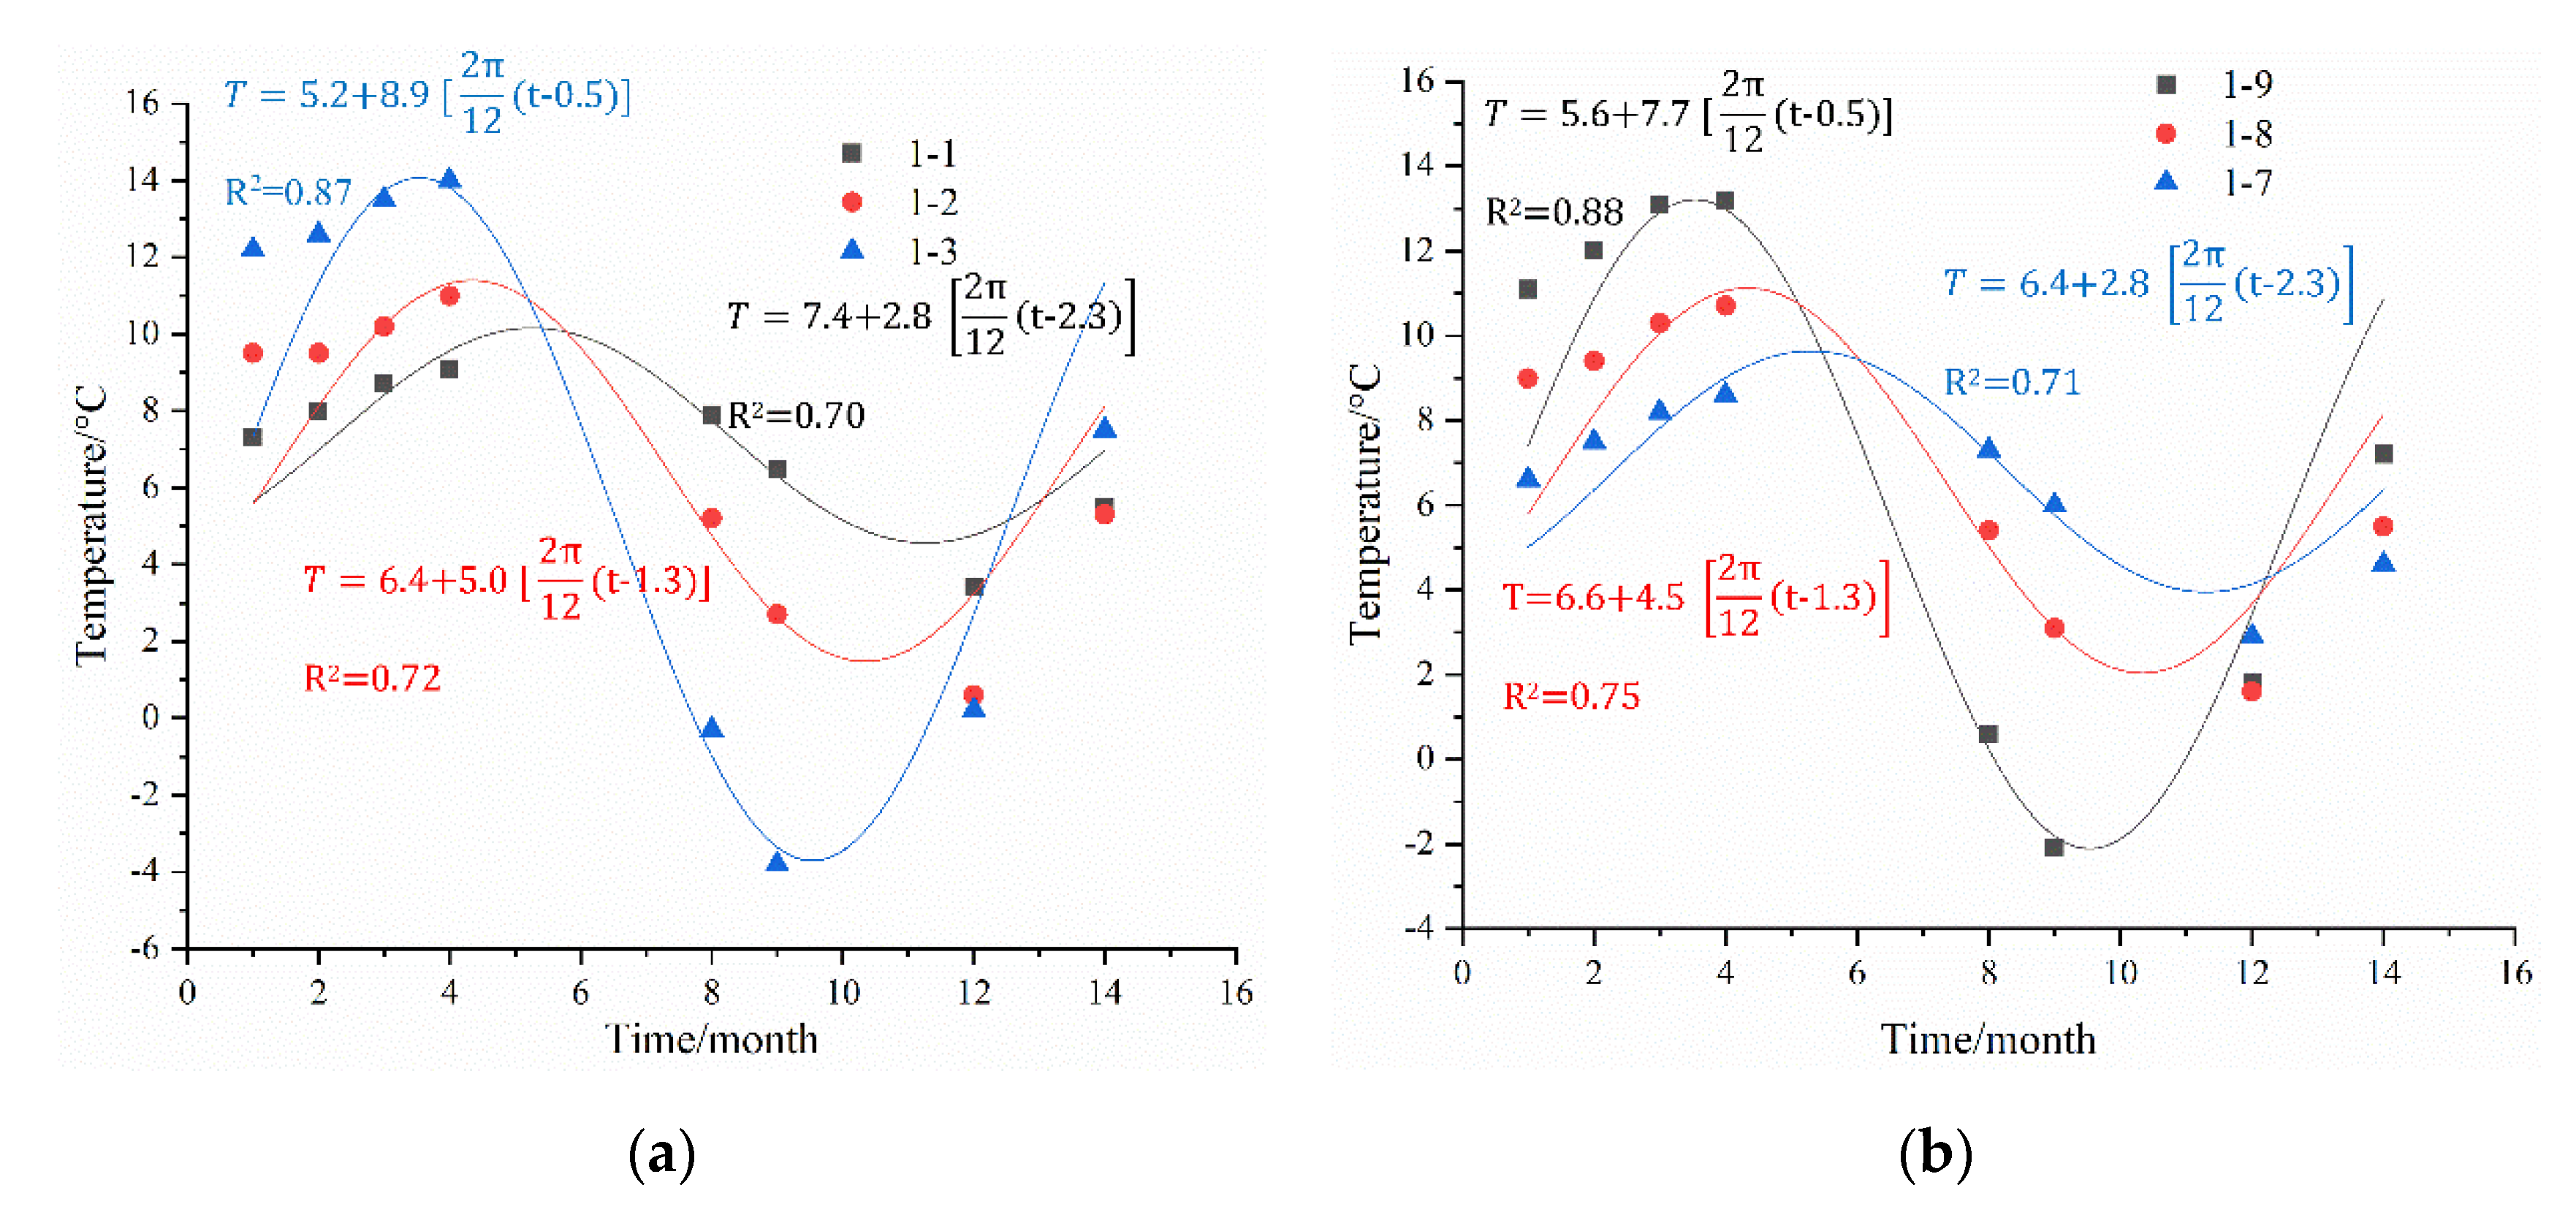
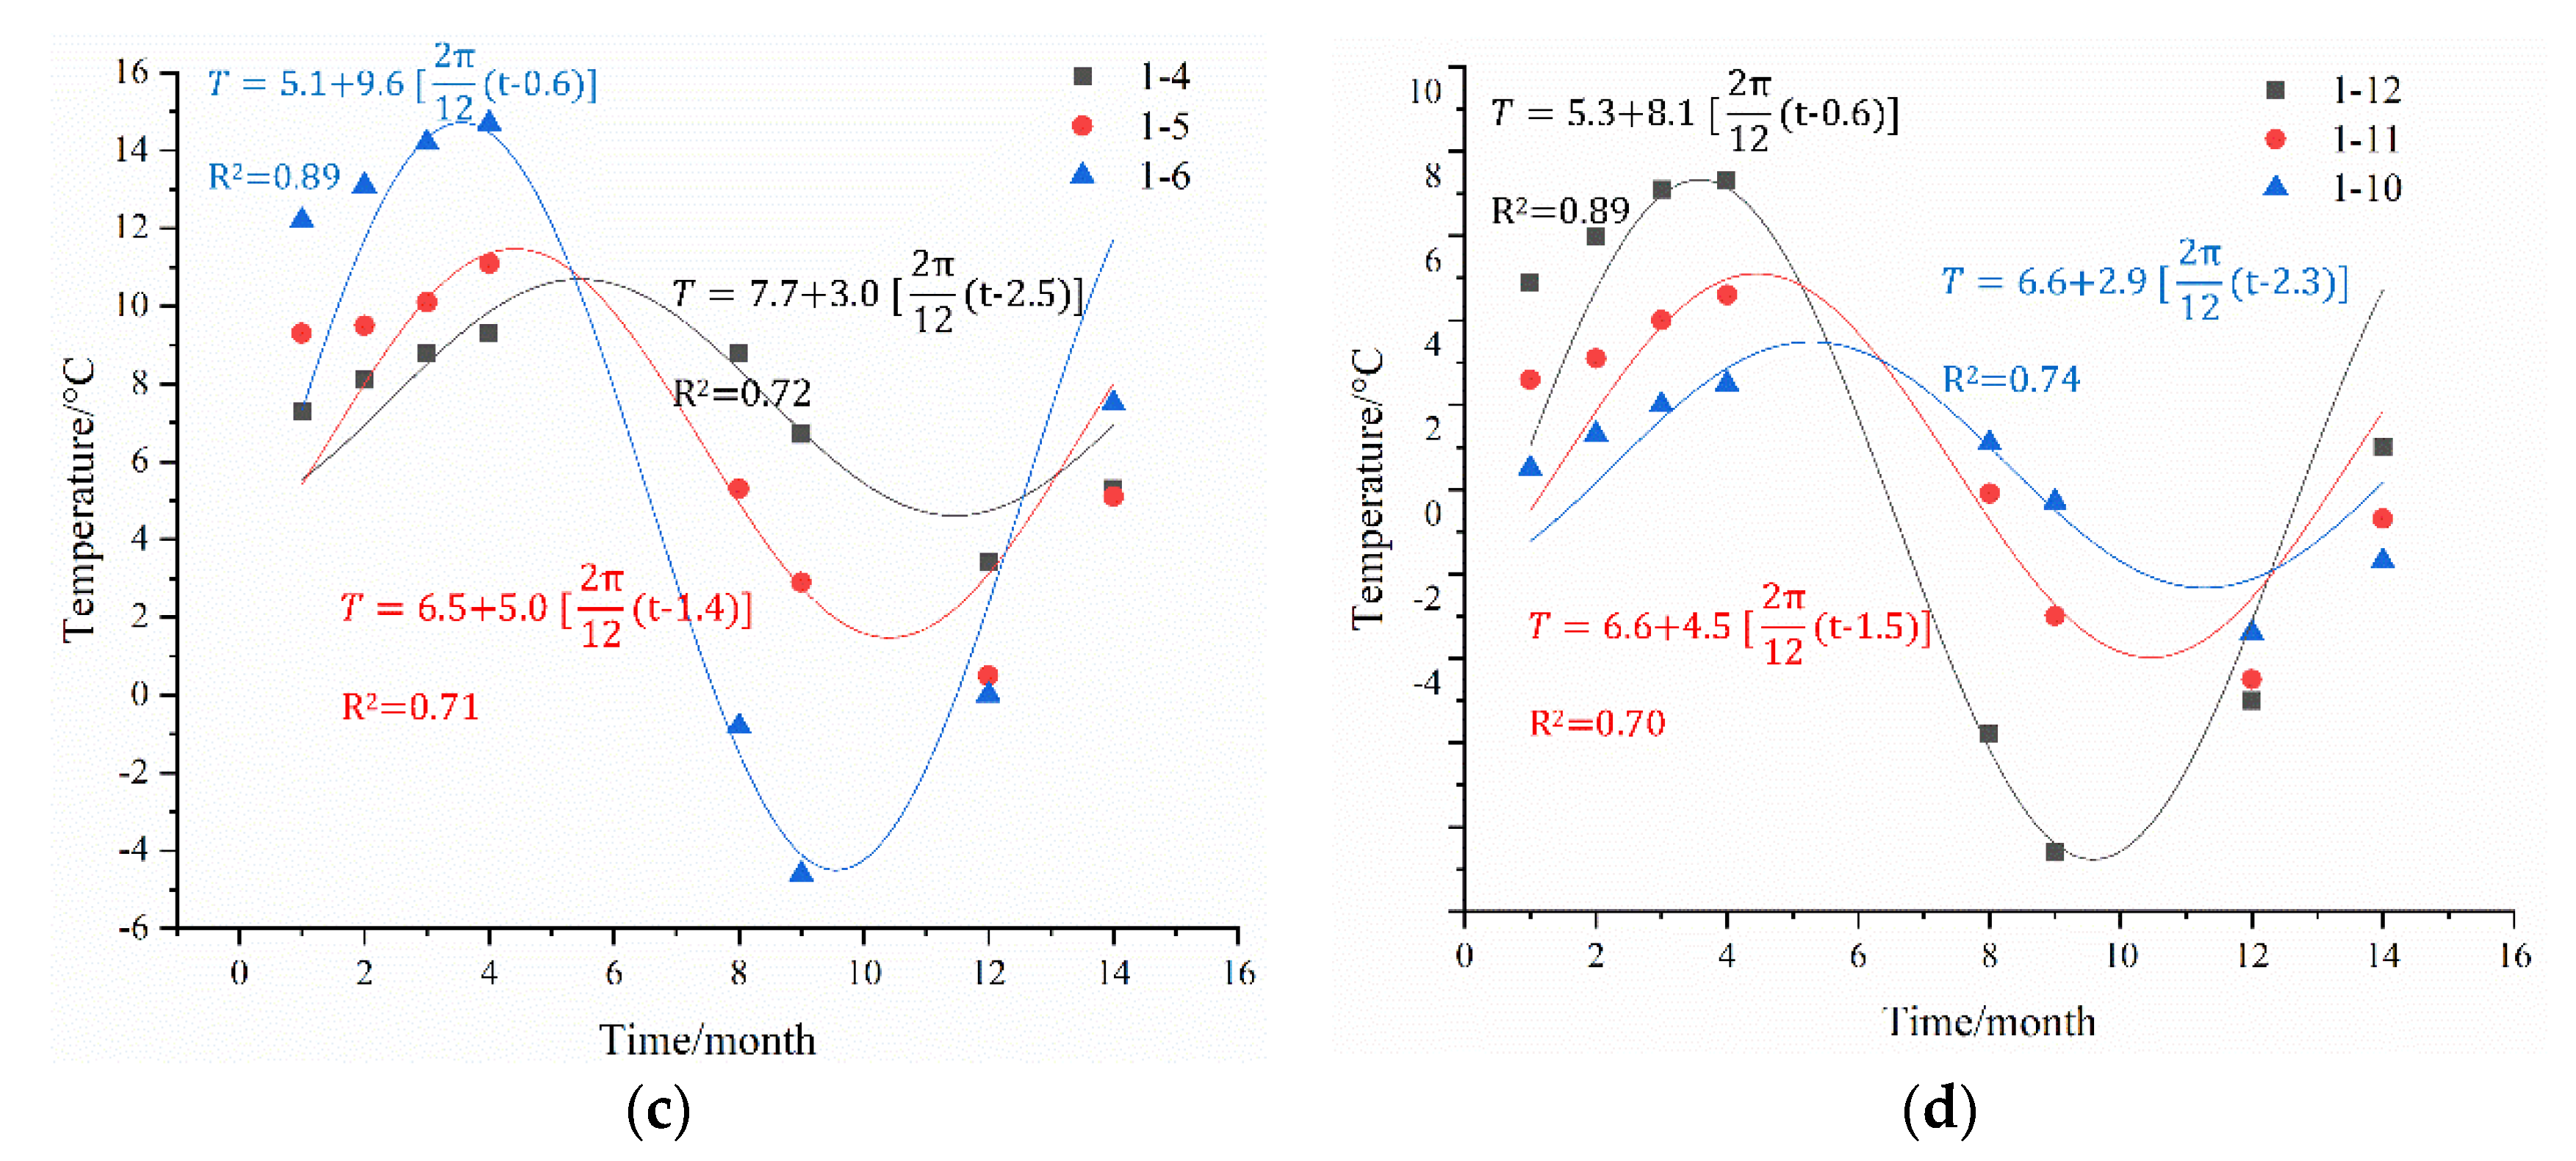
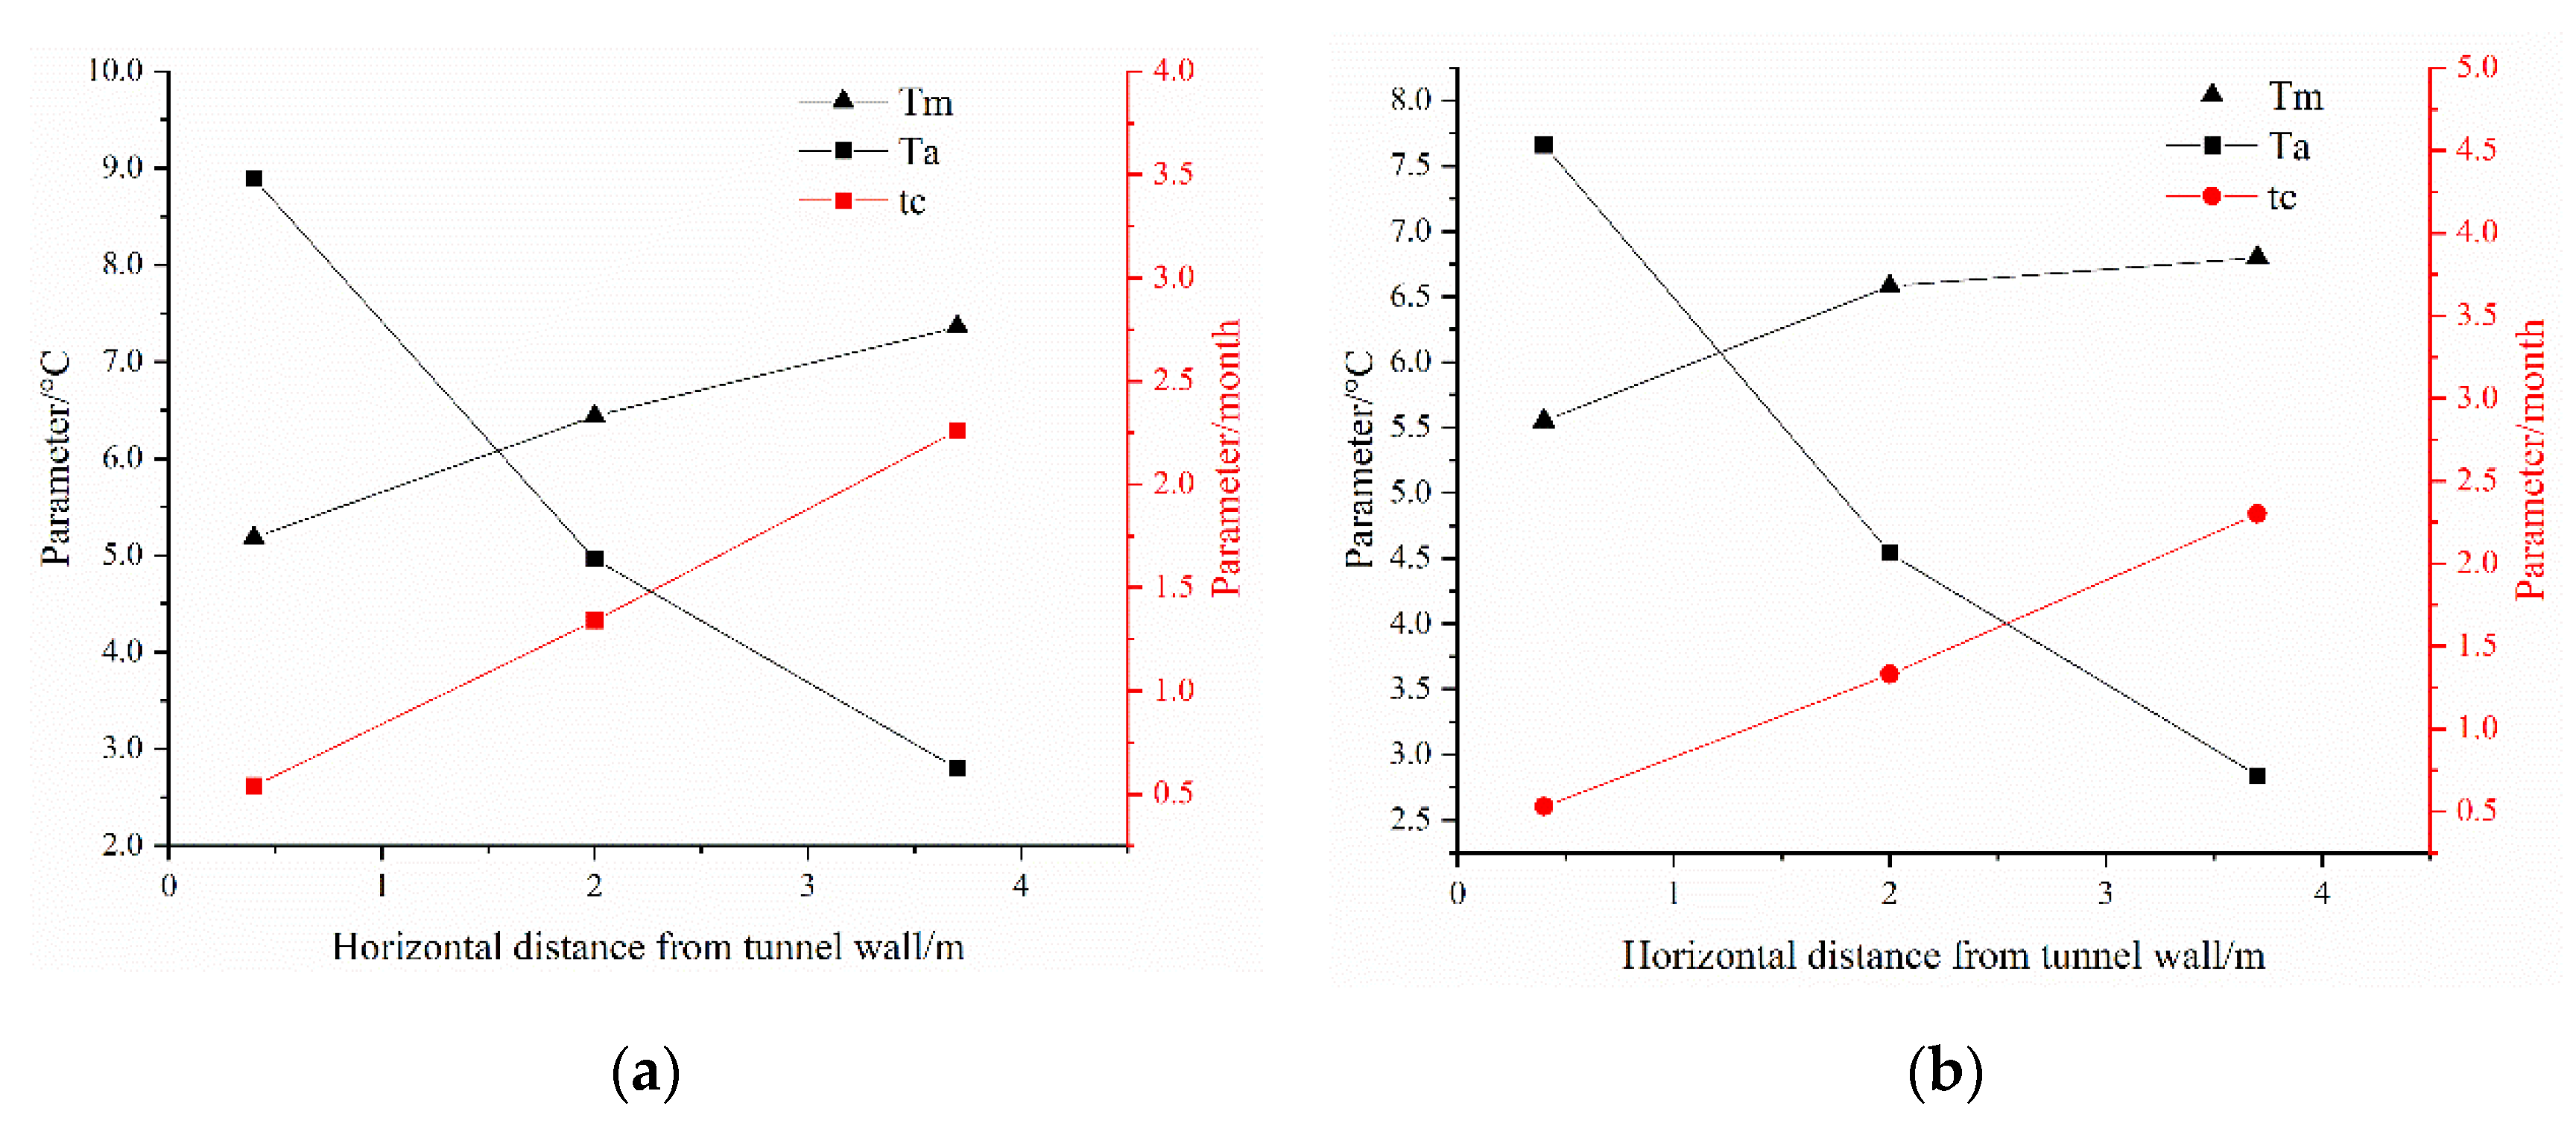
3.2.2. Temperature Change in the Long-Term
- (1)
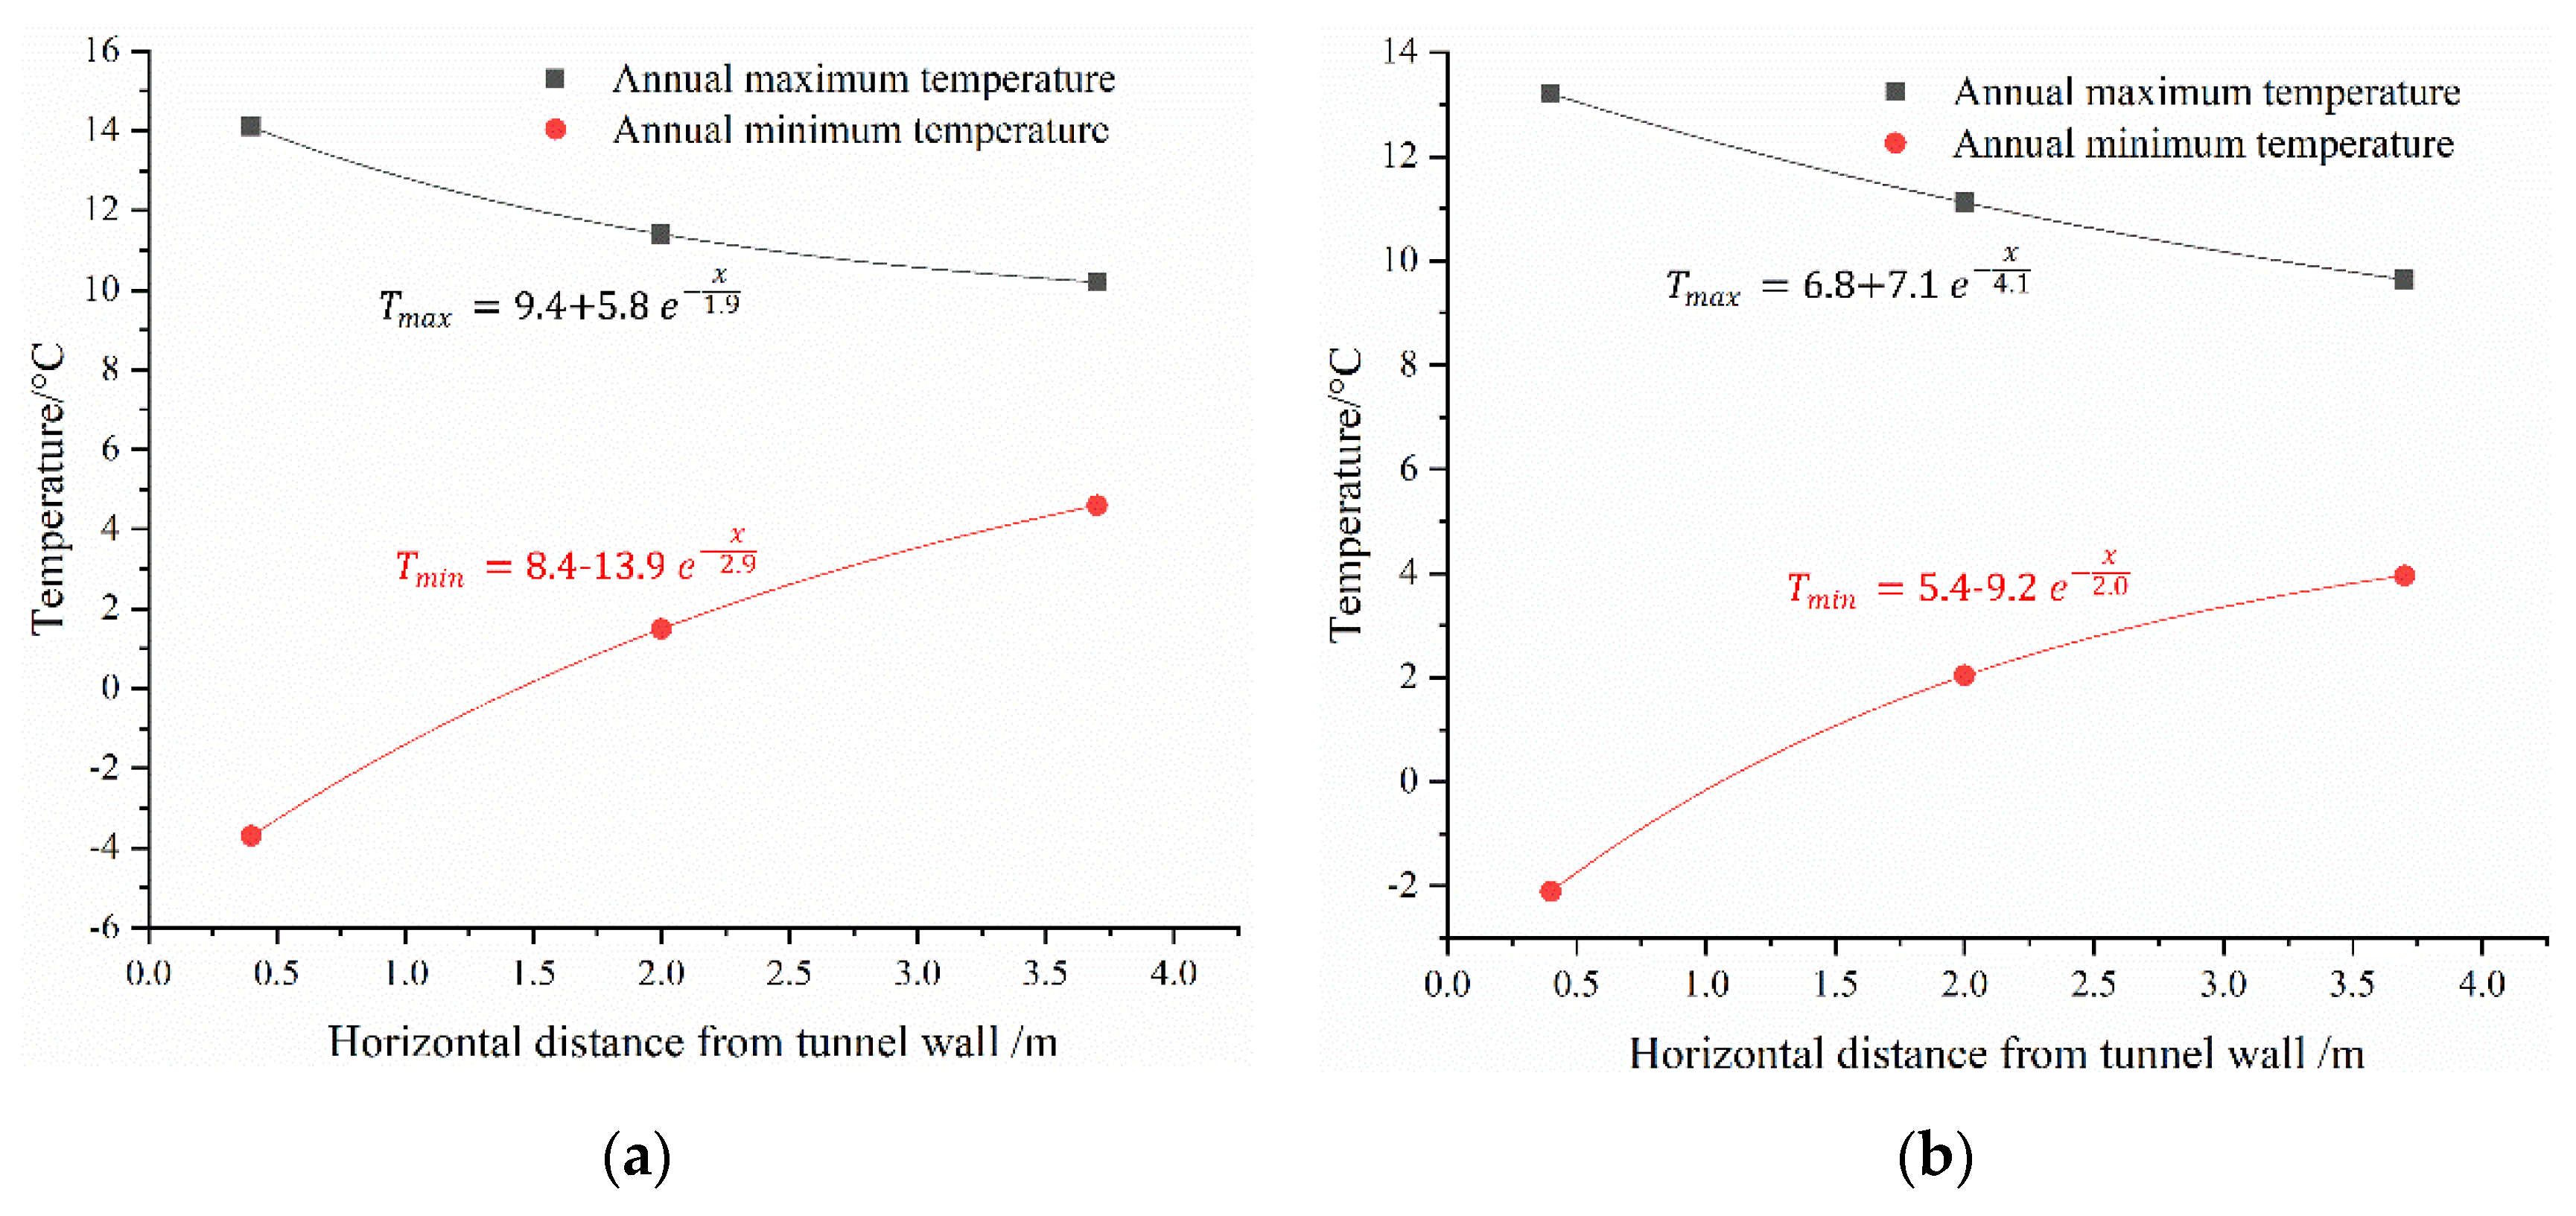
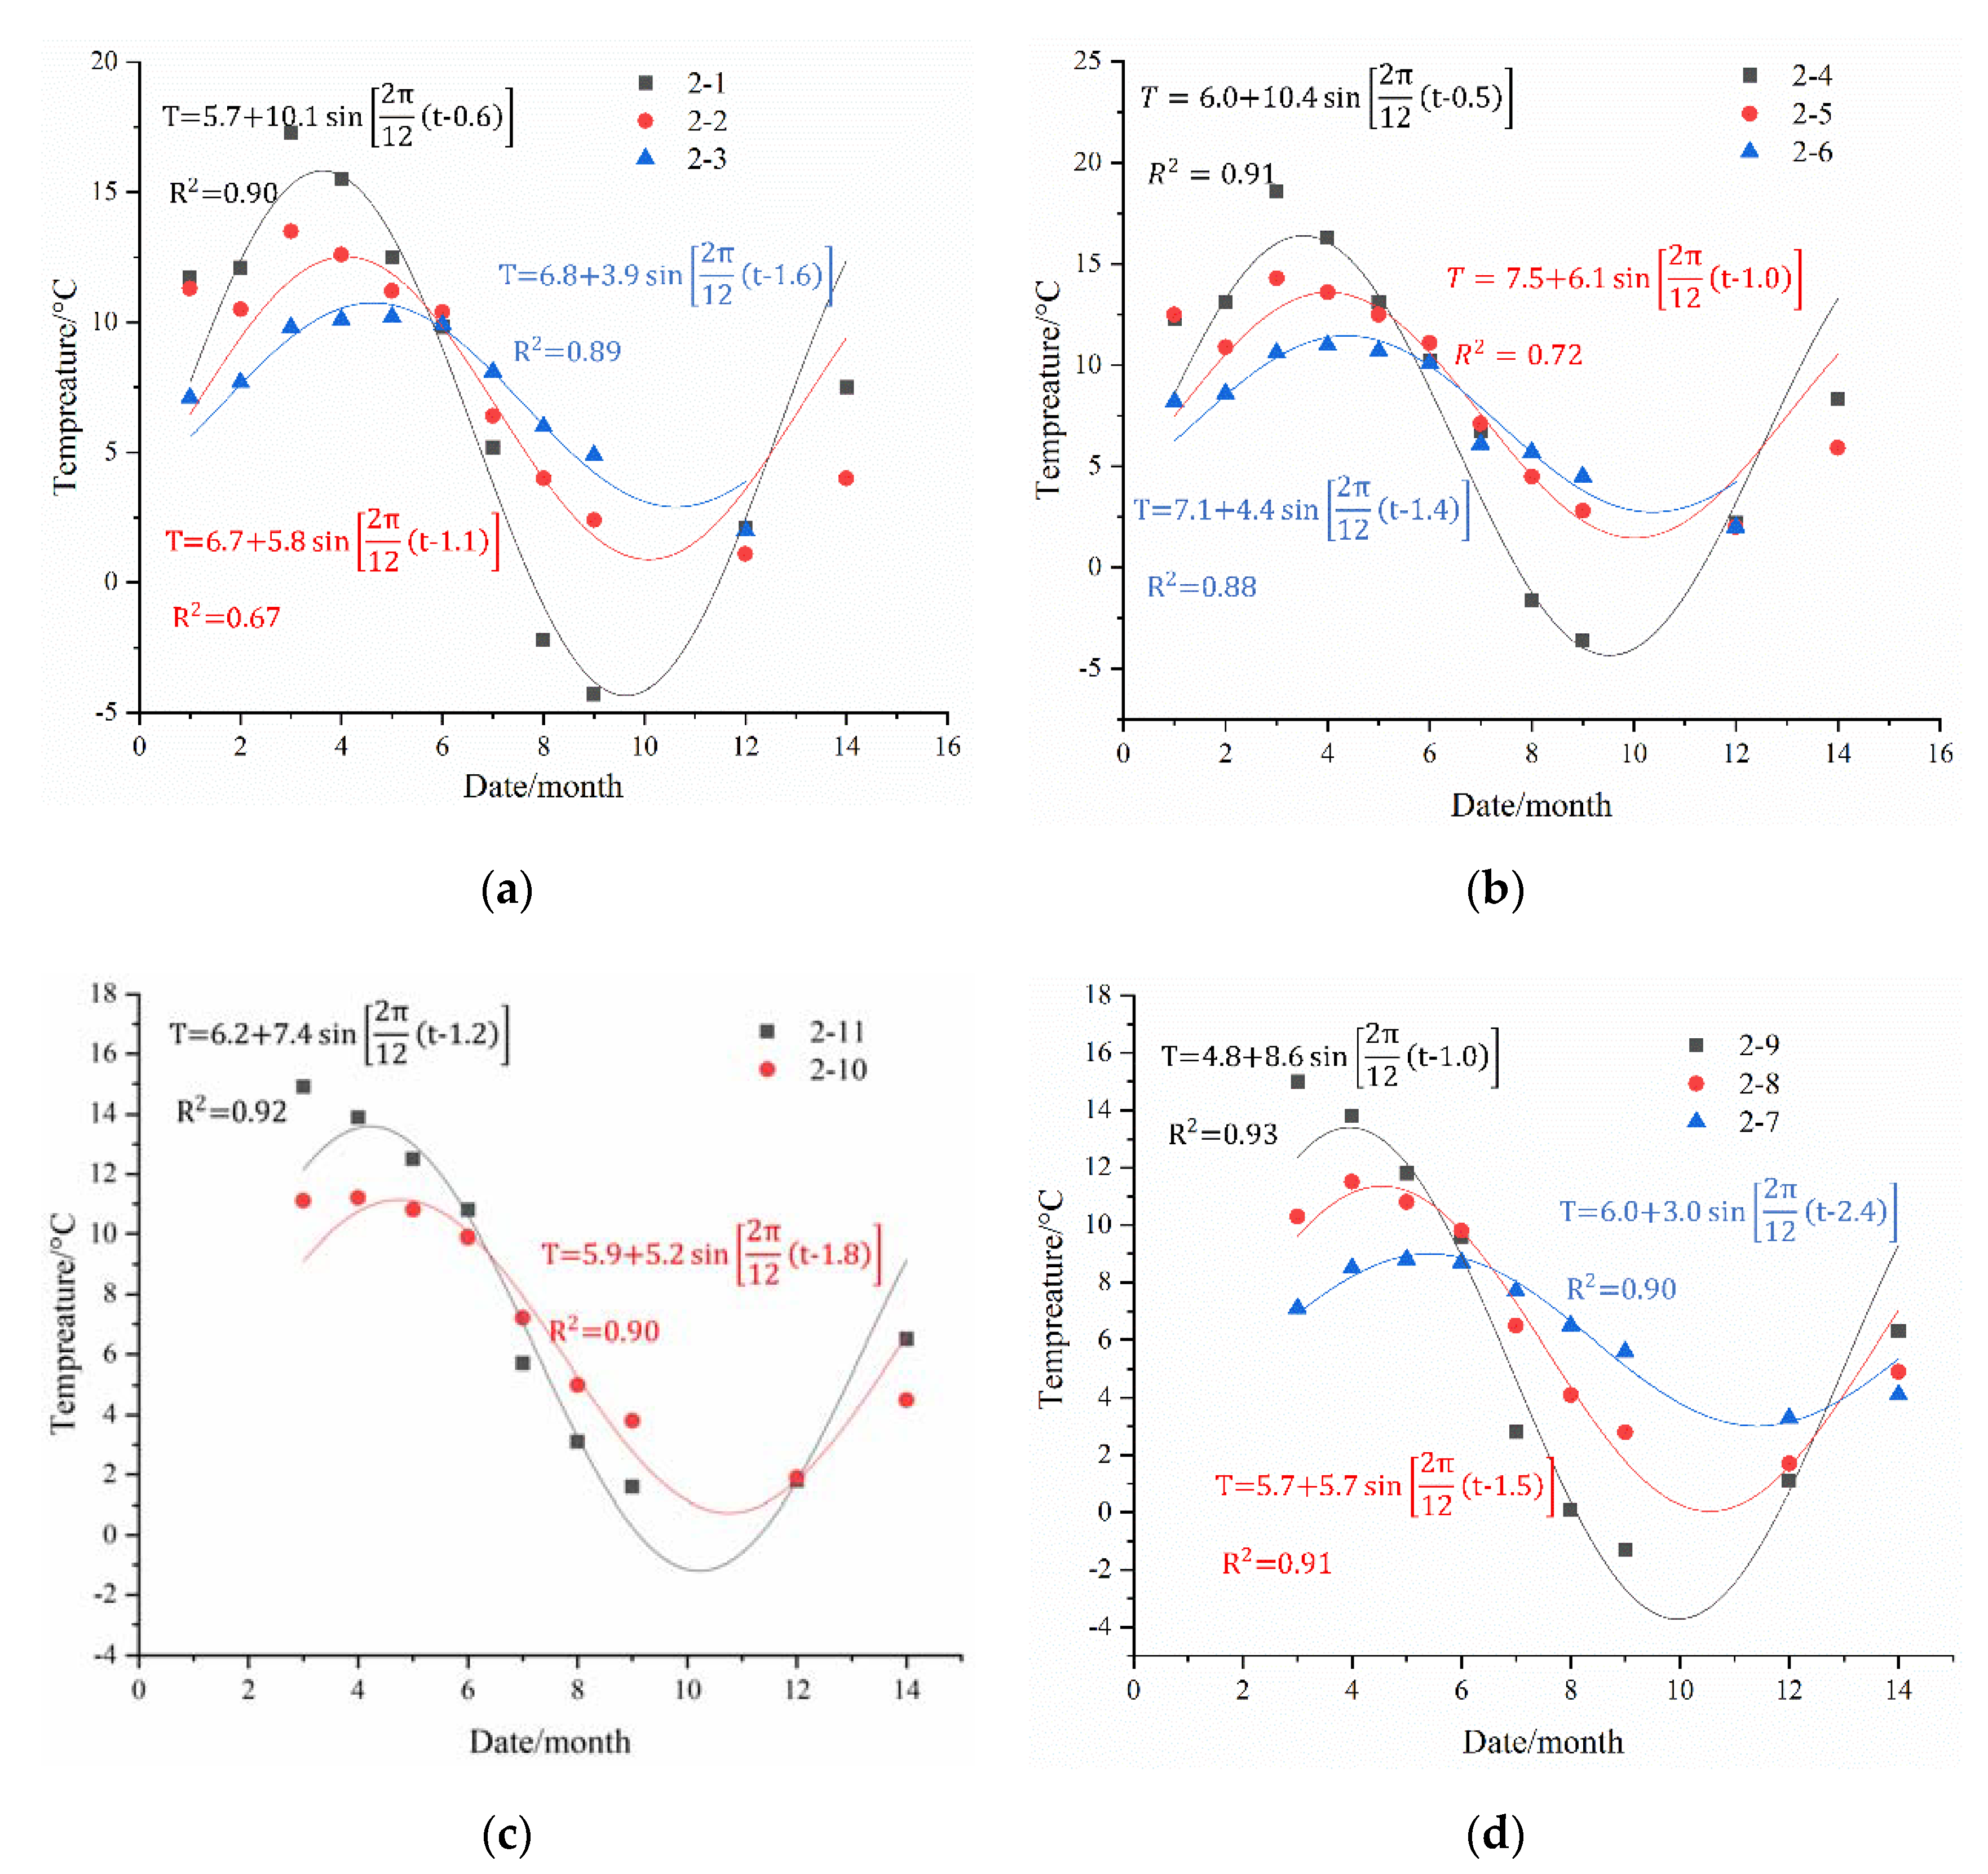
- Fitting equation
- (2)
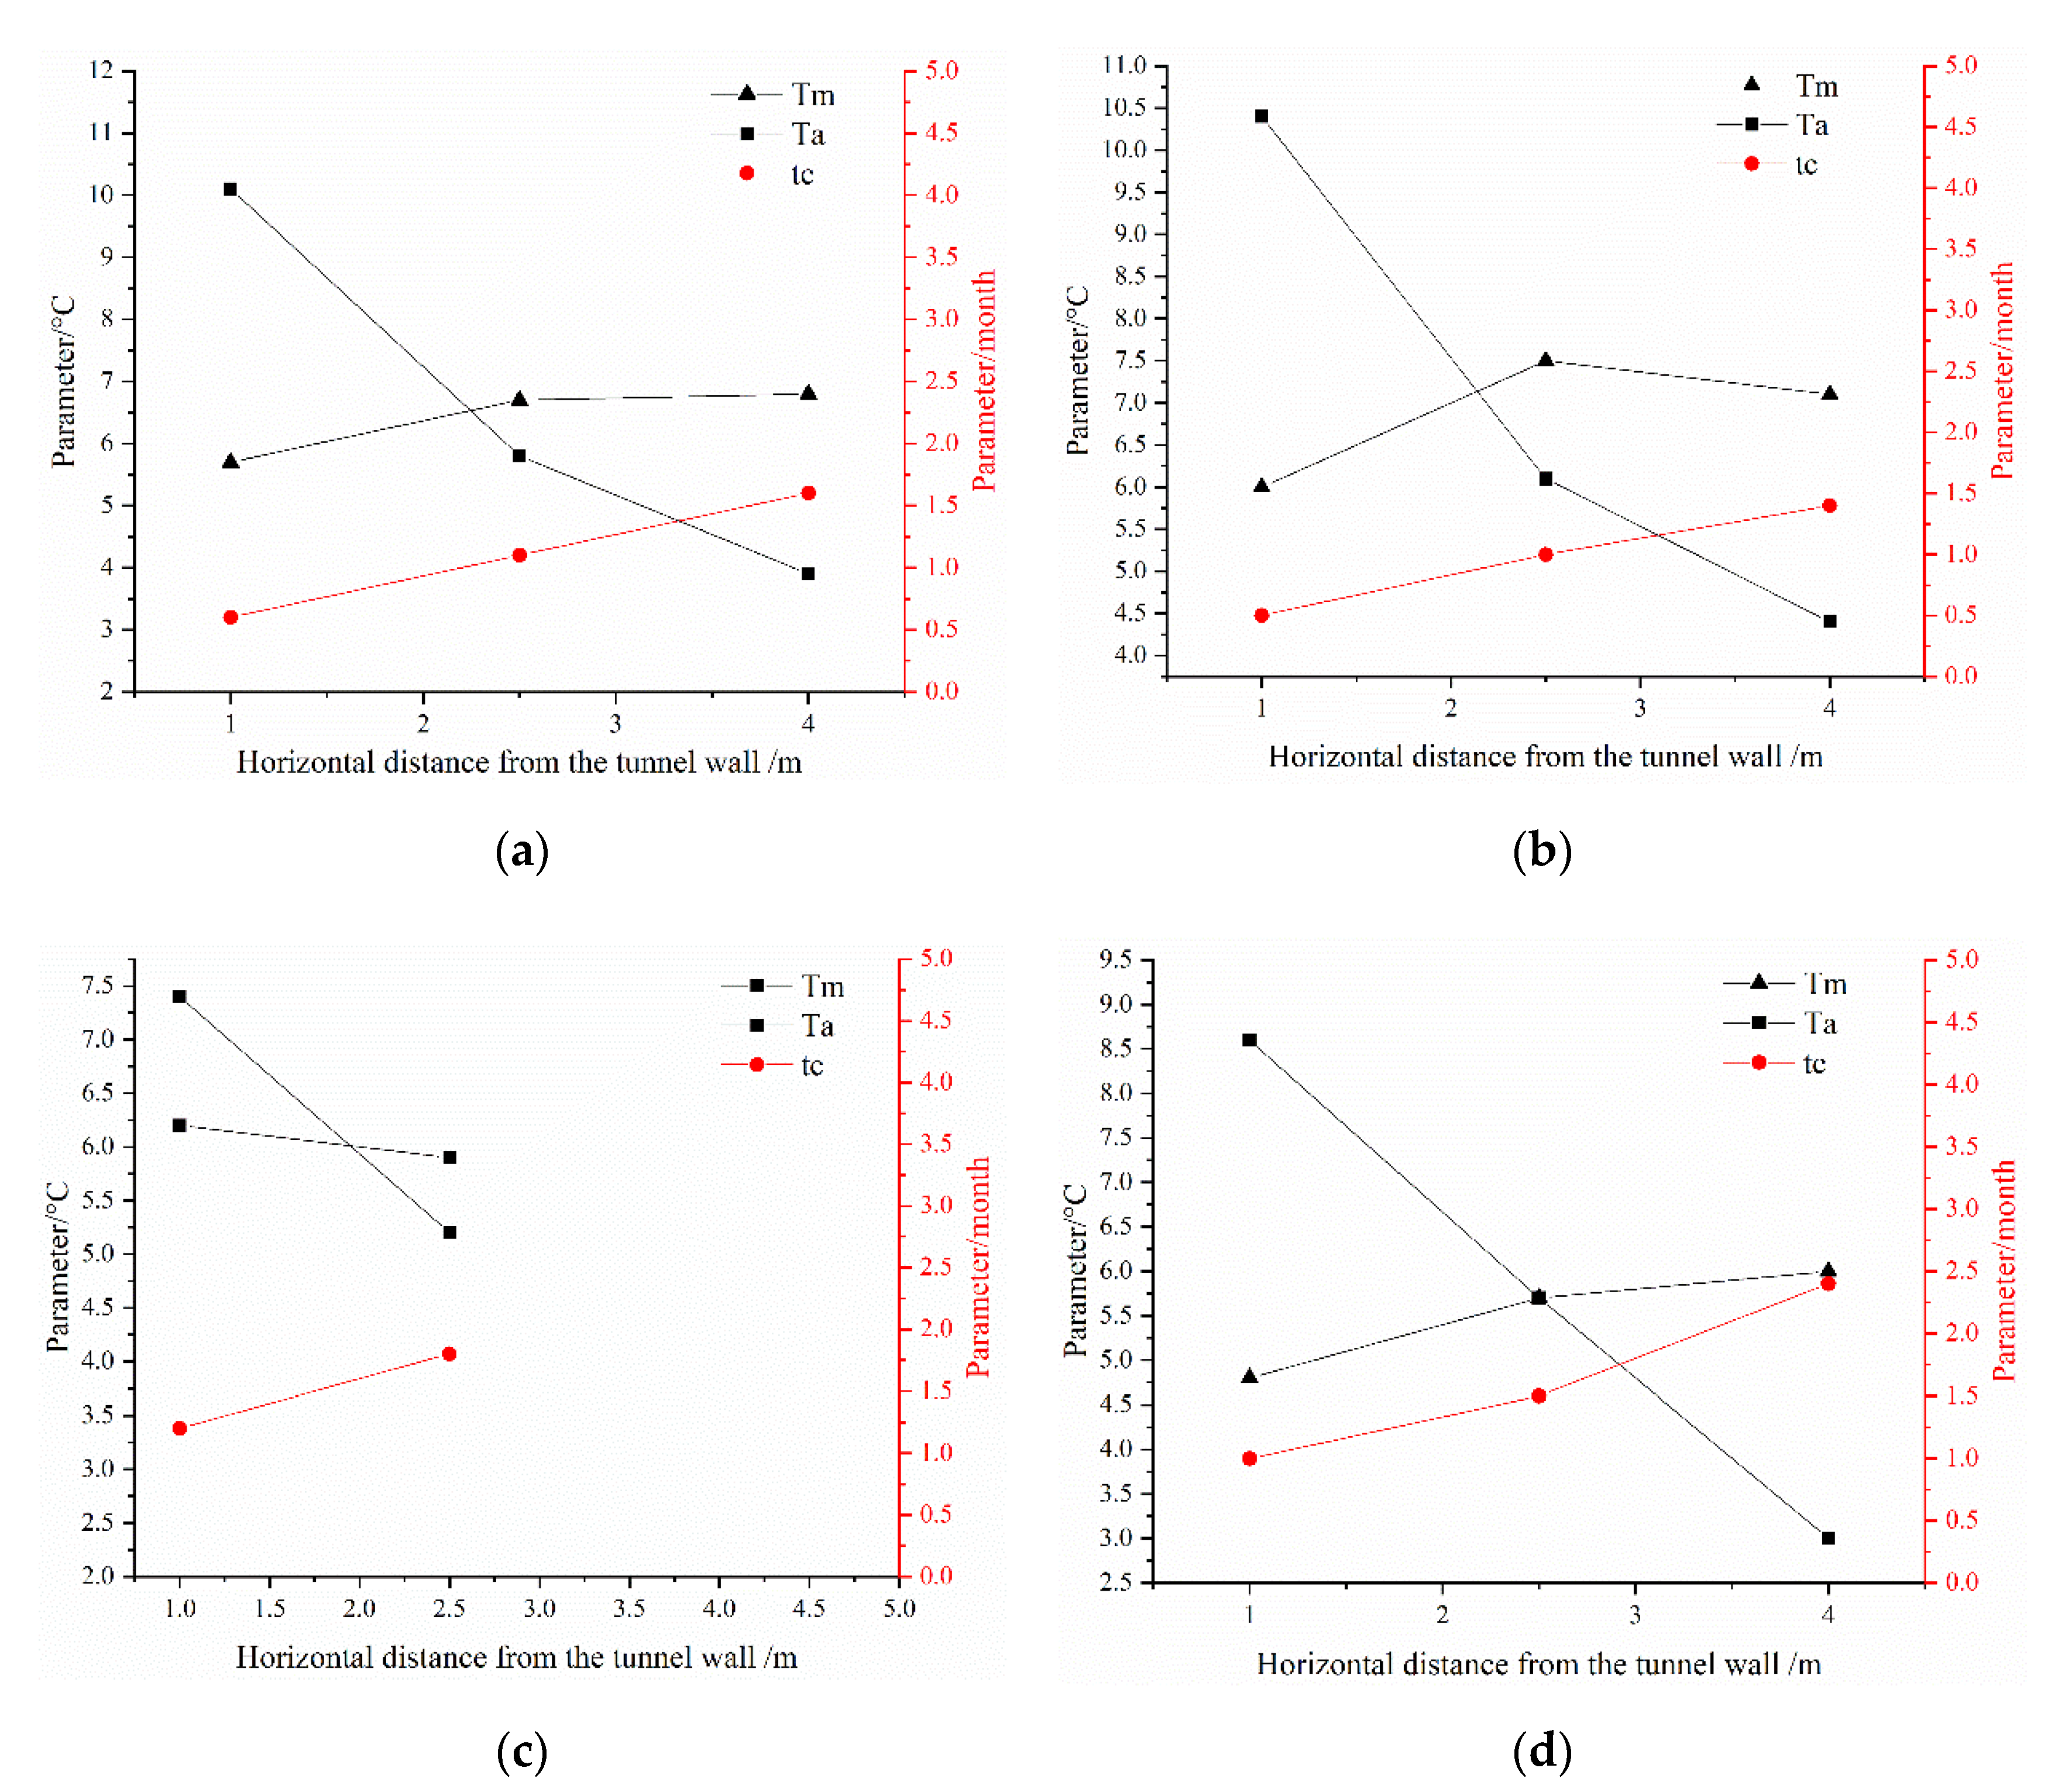
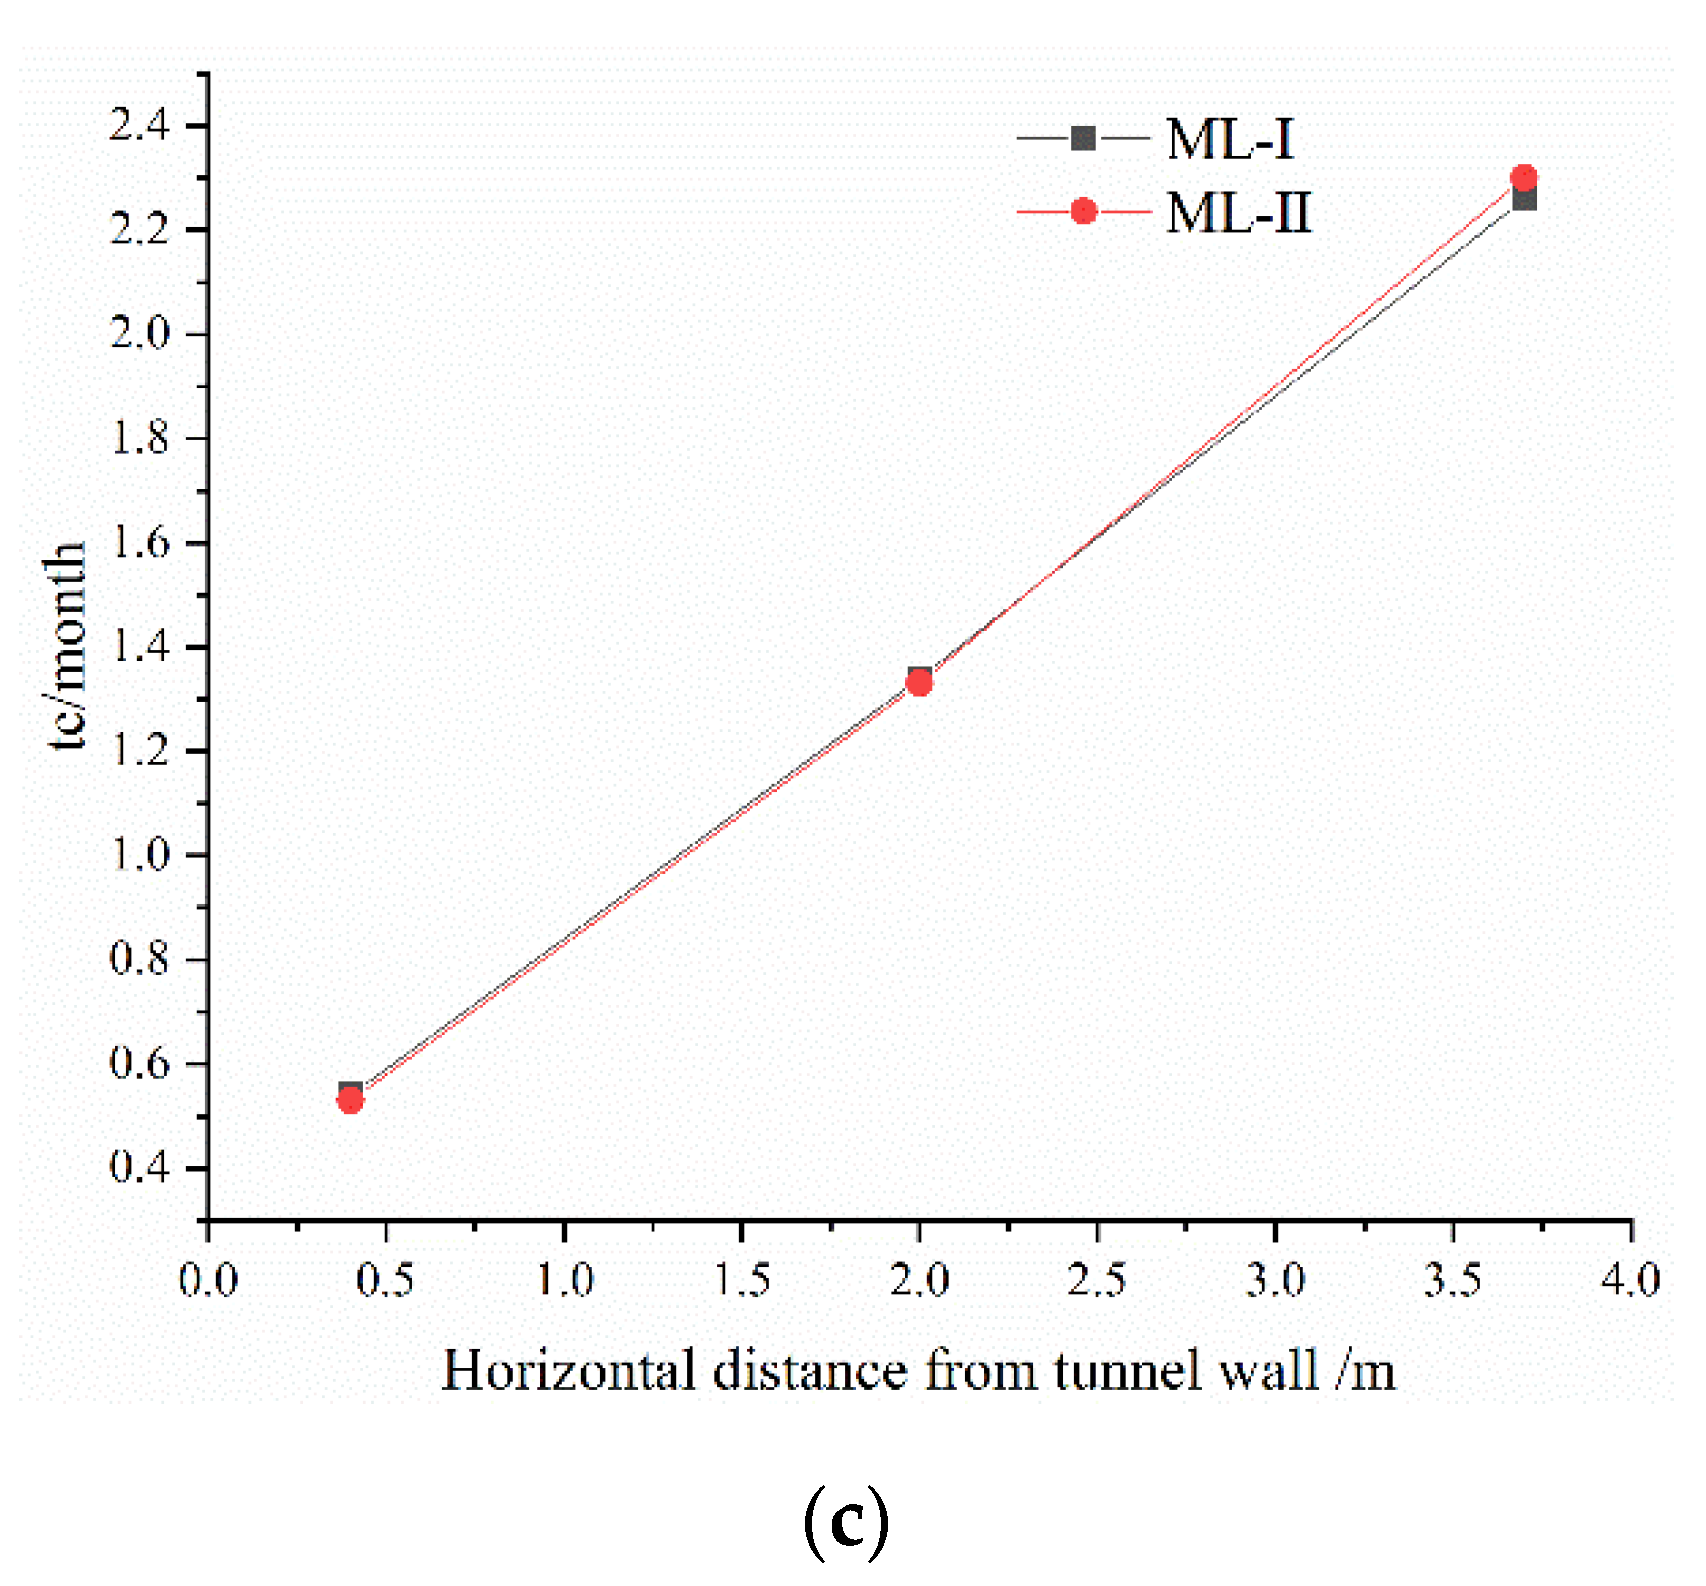
- Temperature variation
3.3. Monitoring Results of Section 2 (RK315 + 710)
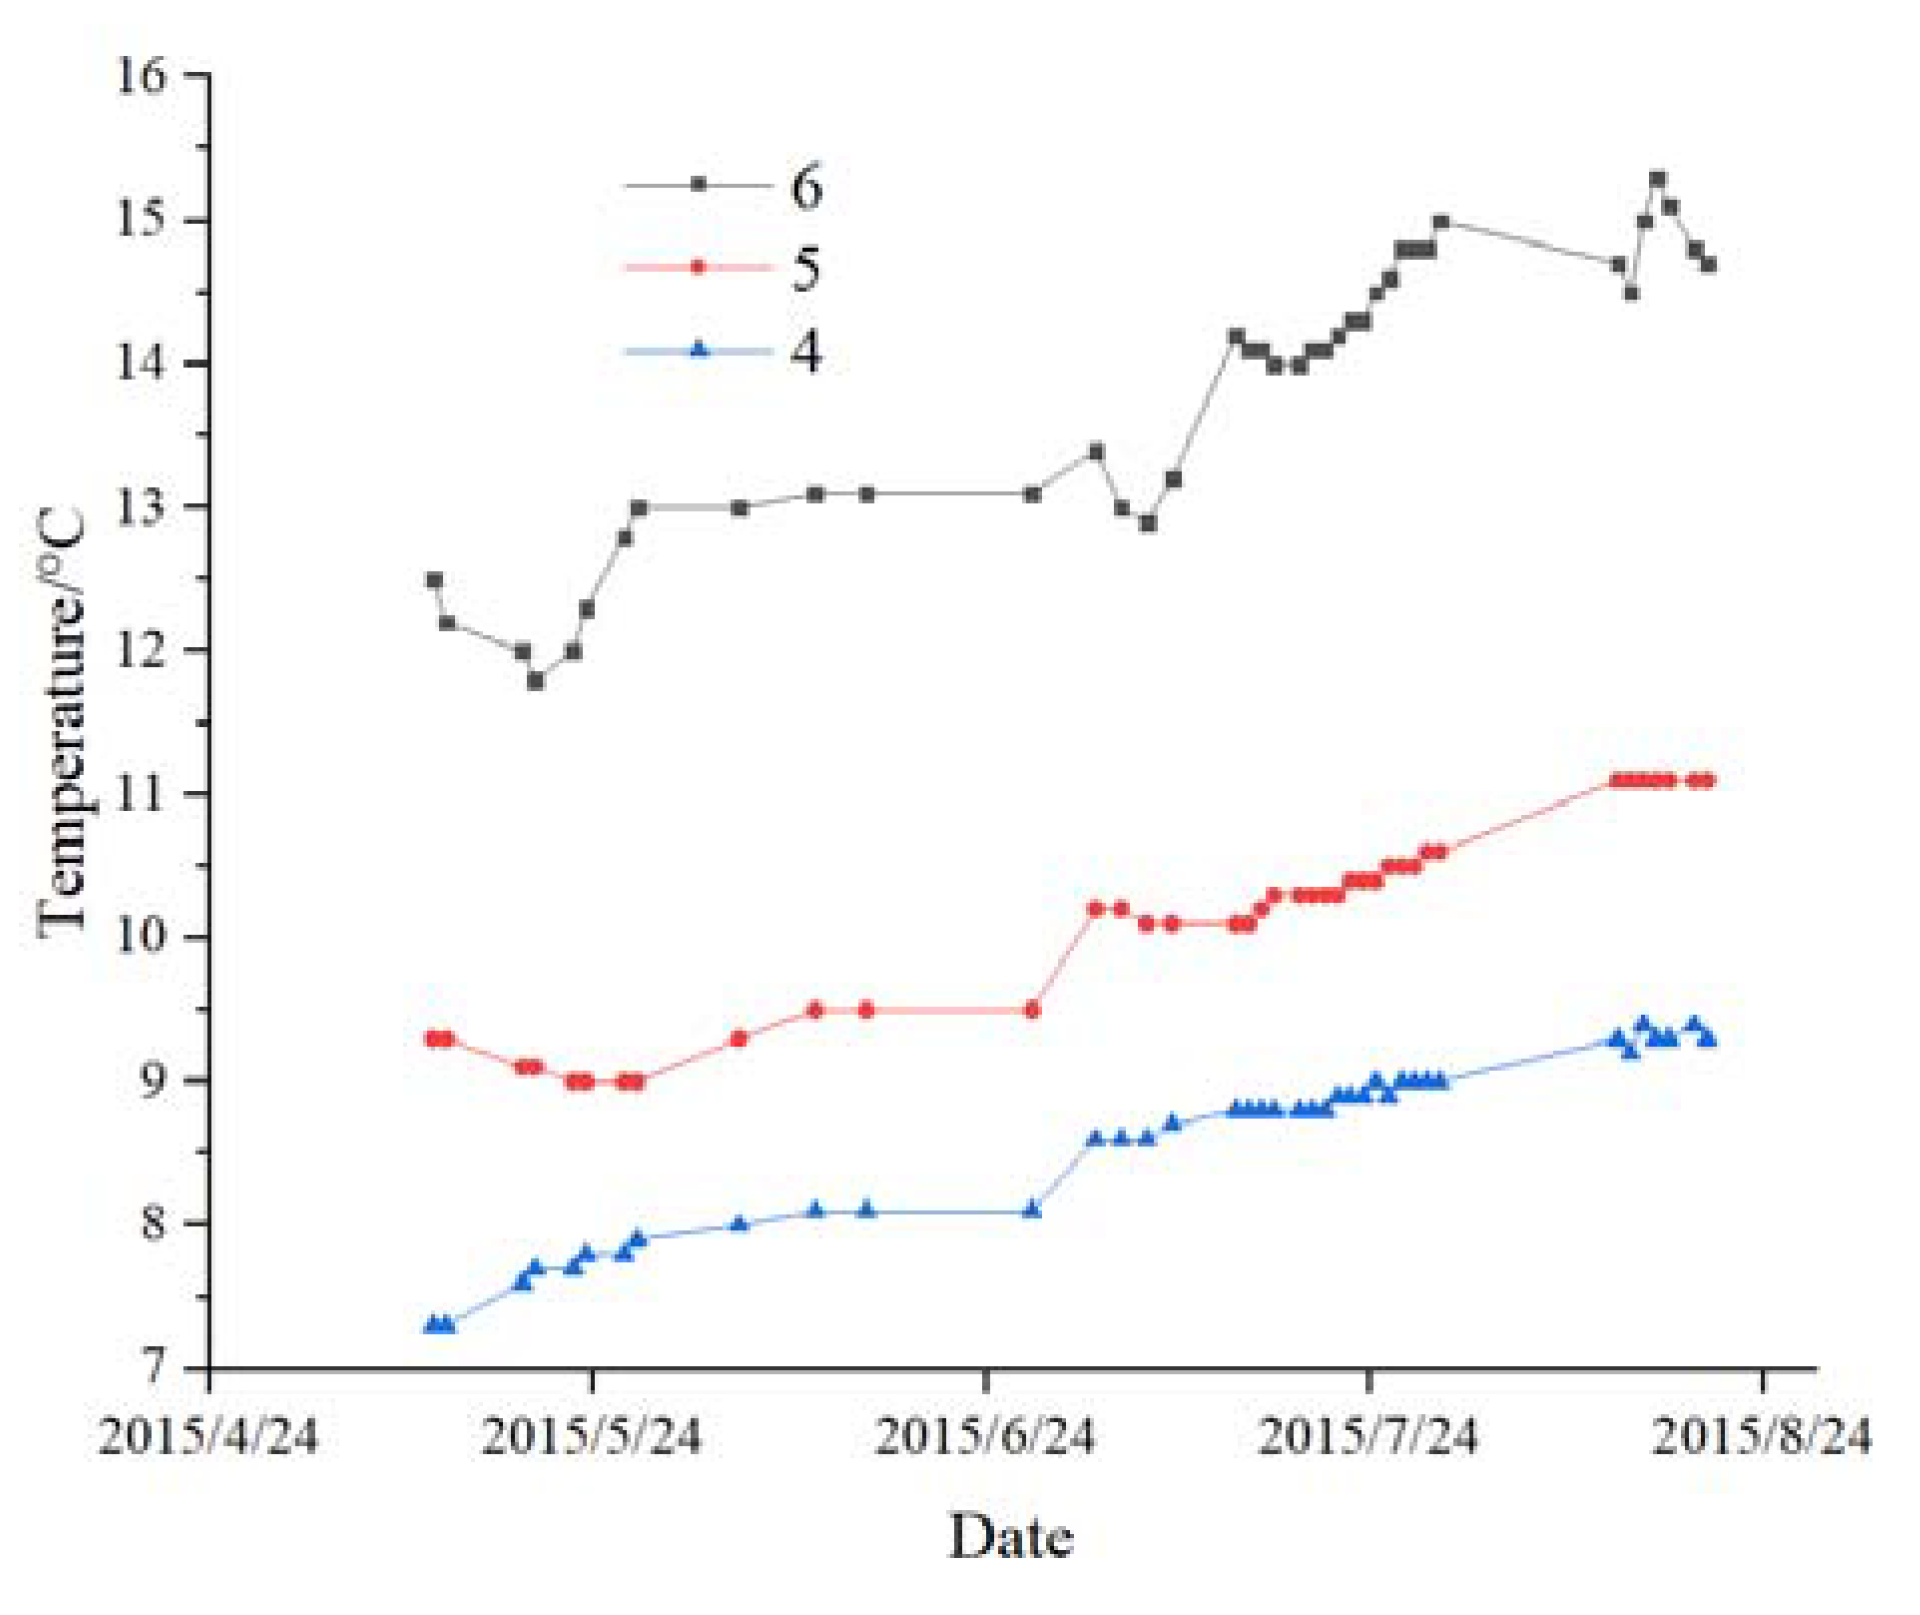
3.3.1. Temperature Changes in the Short-Term after Excavation
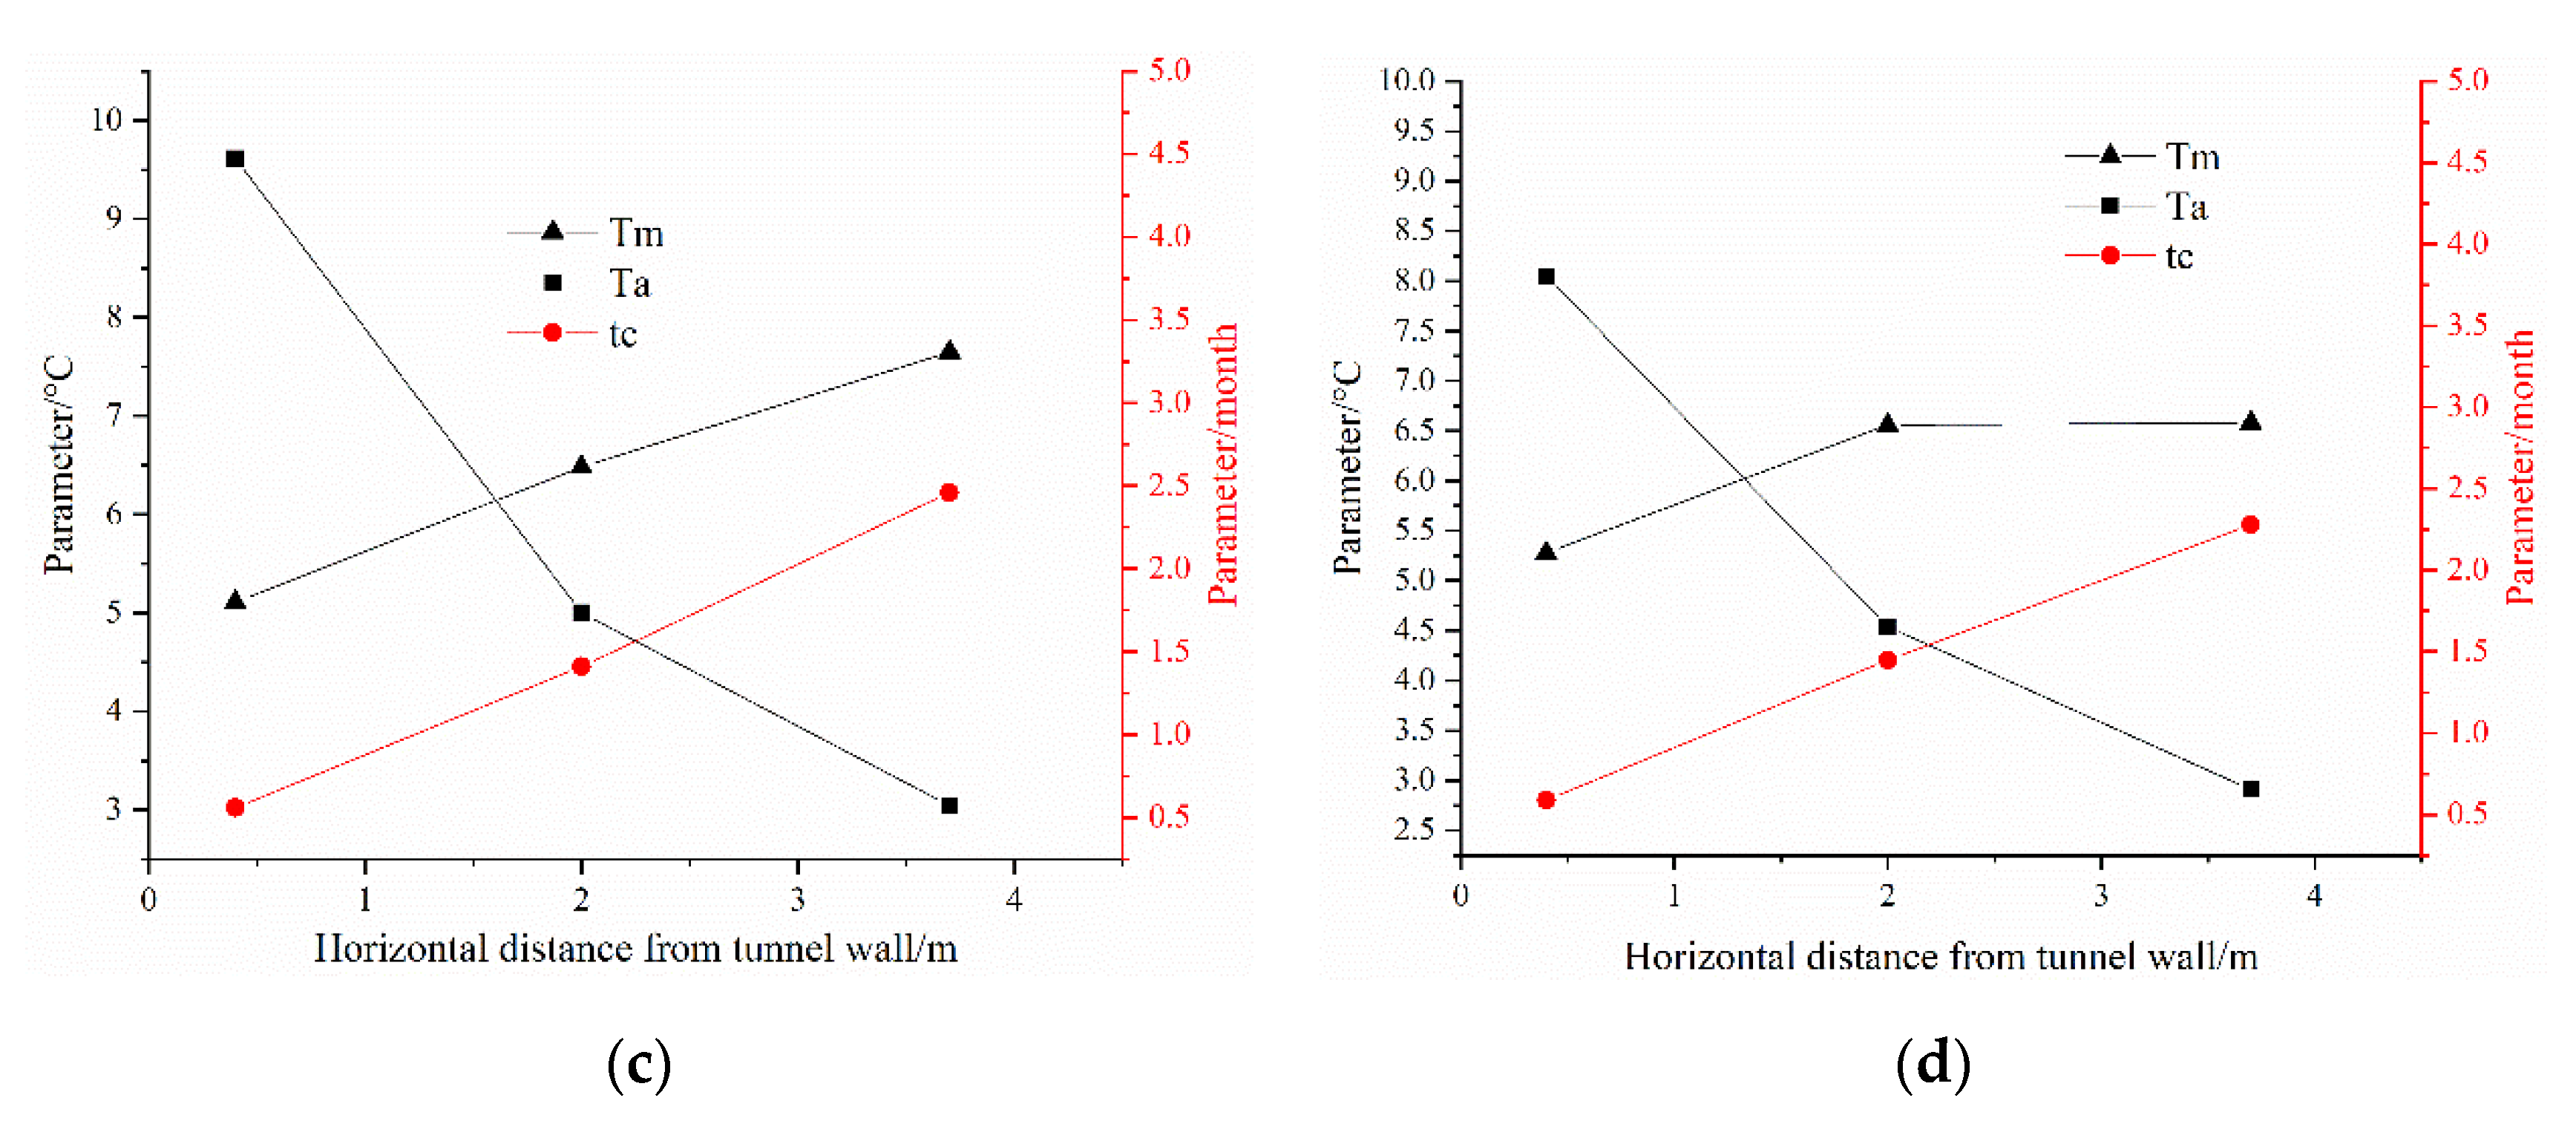
3.3.2. Temperature Change in the Long-Term
4. Discussion
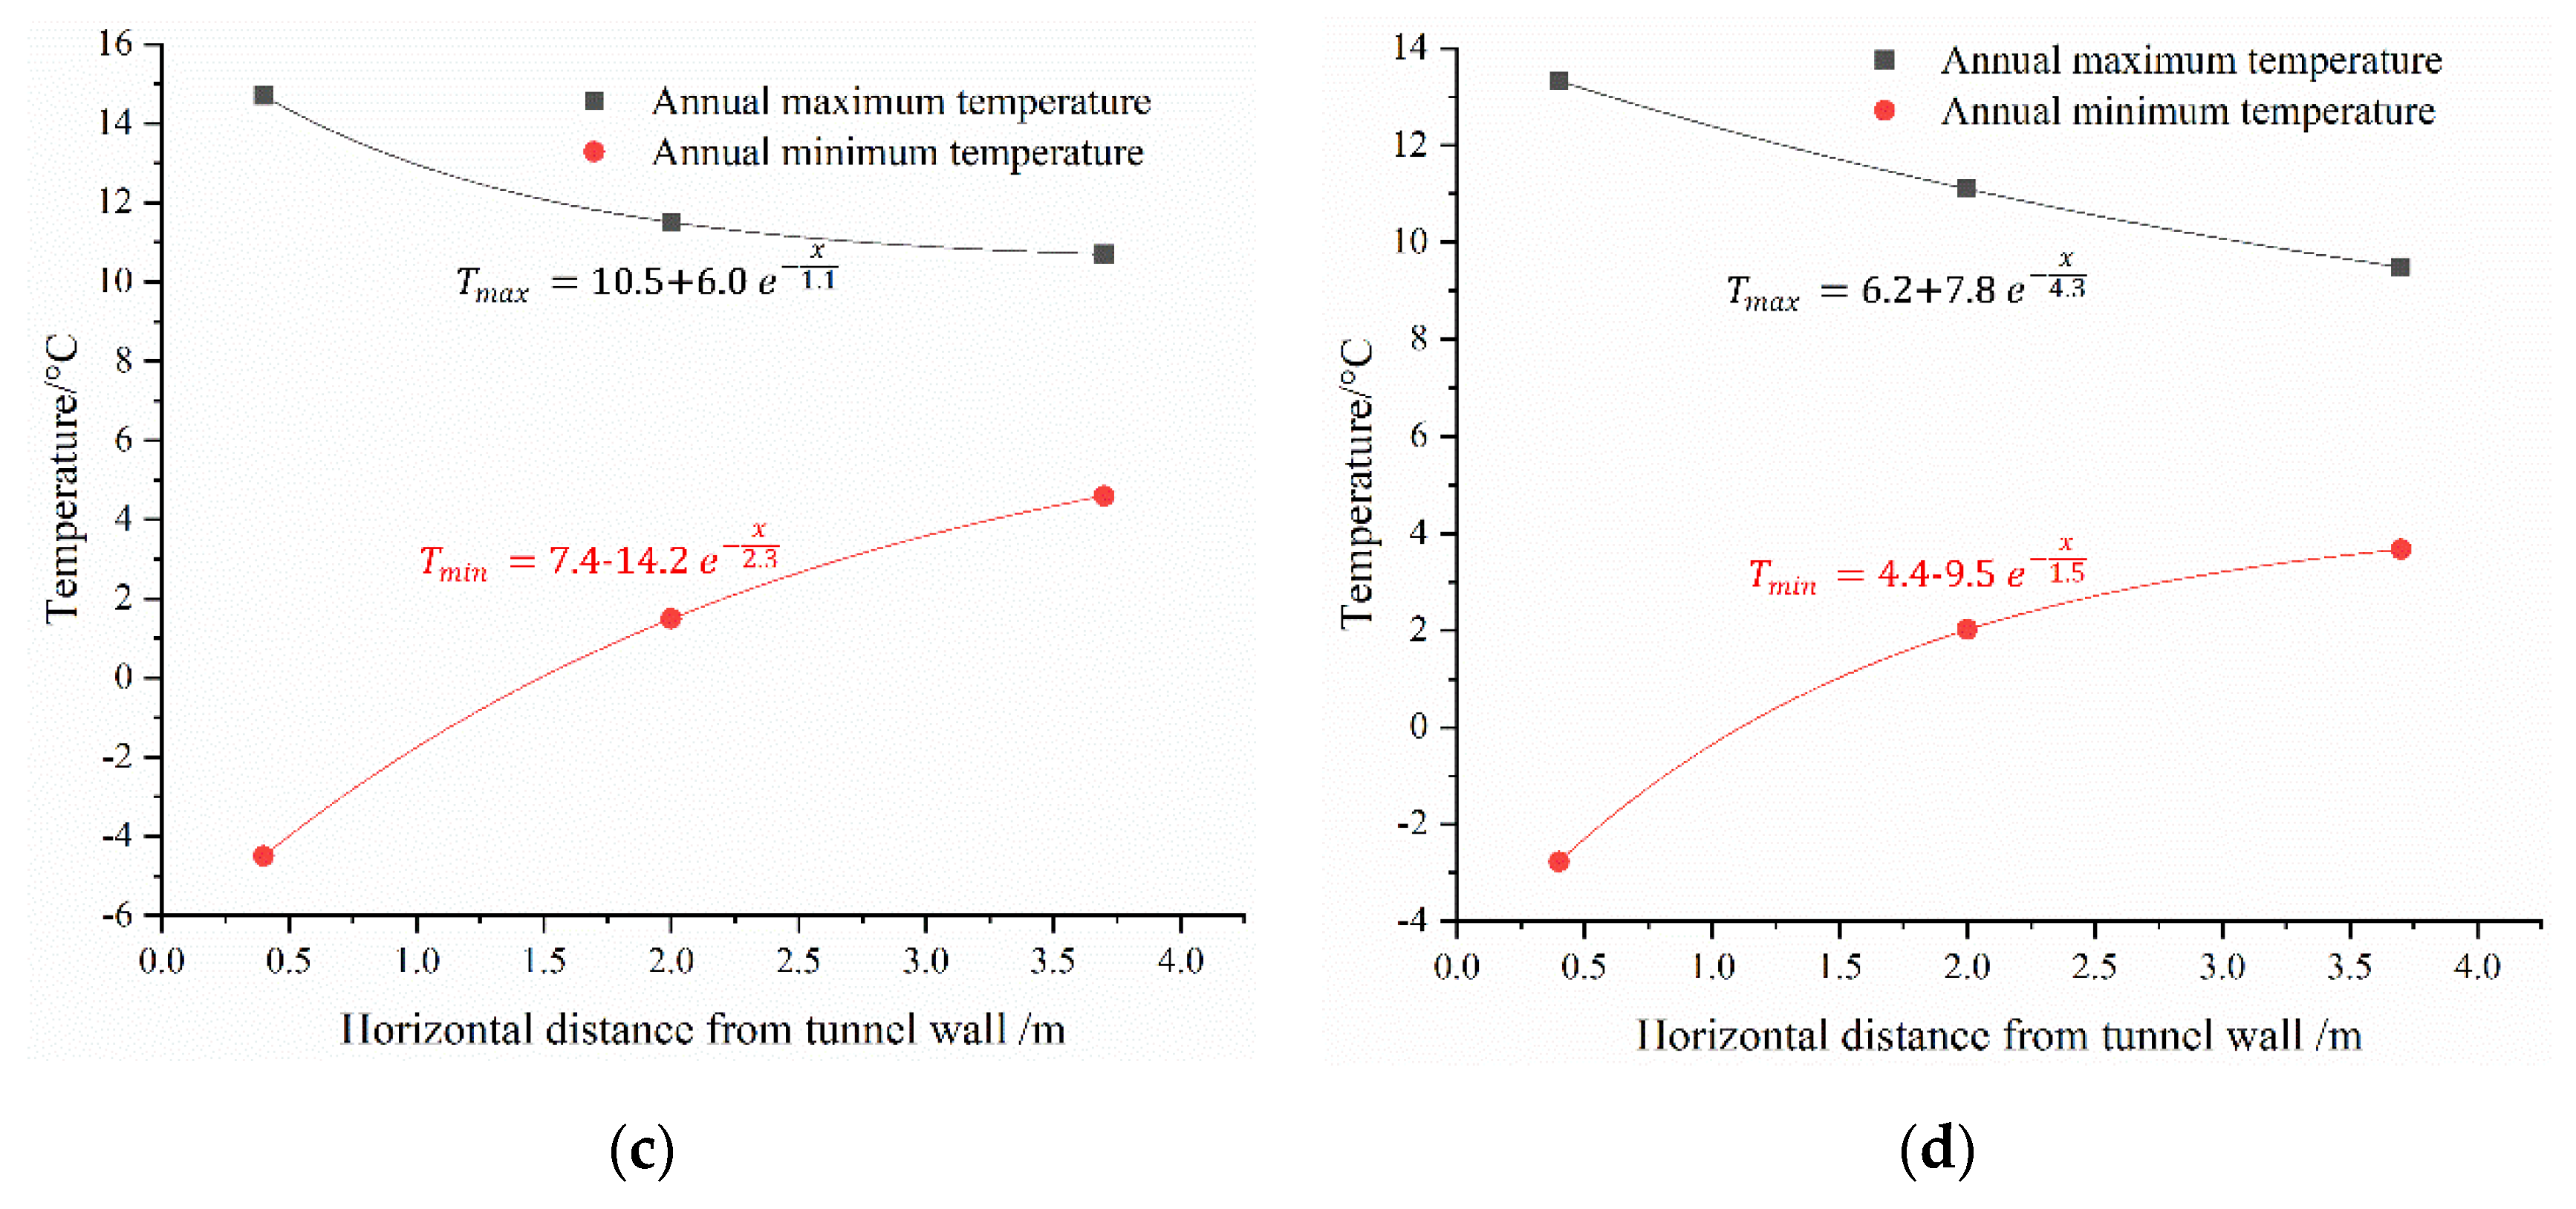
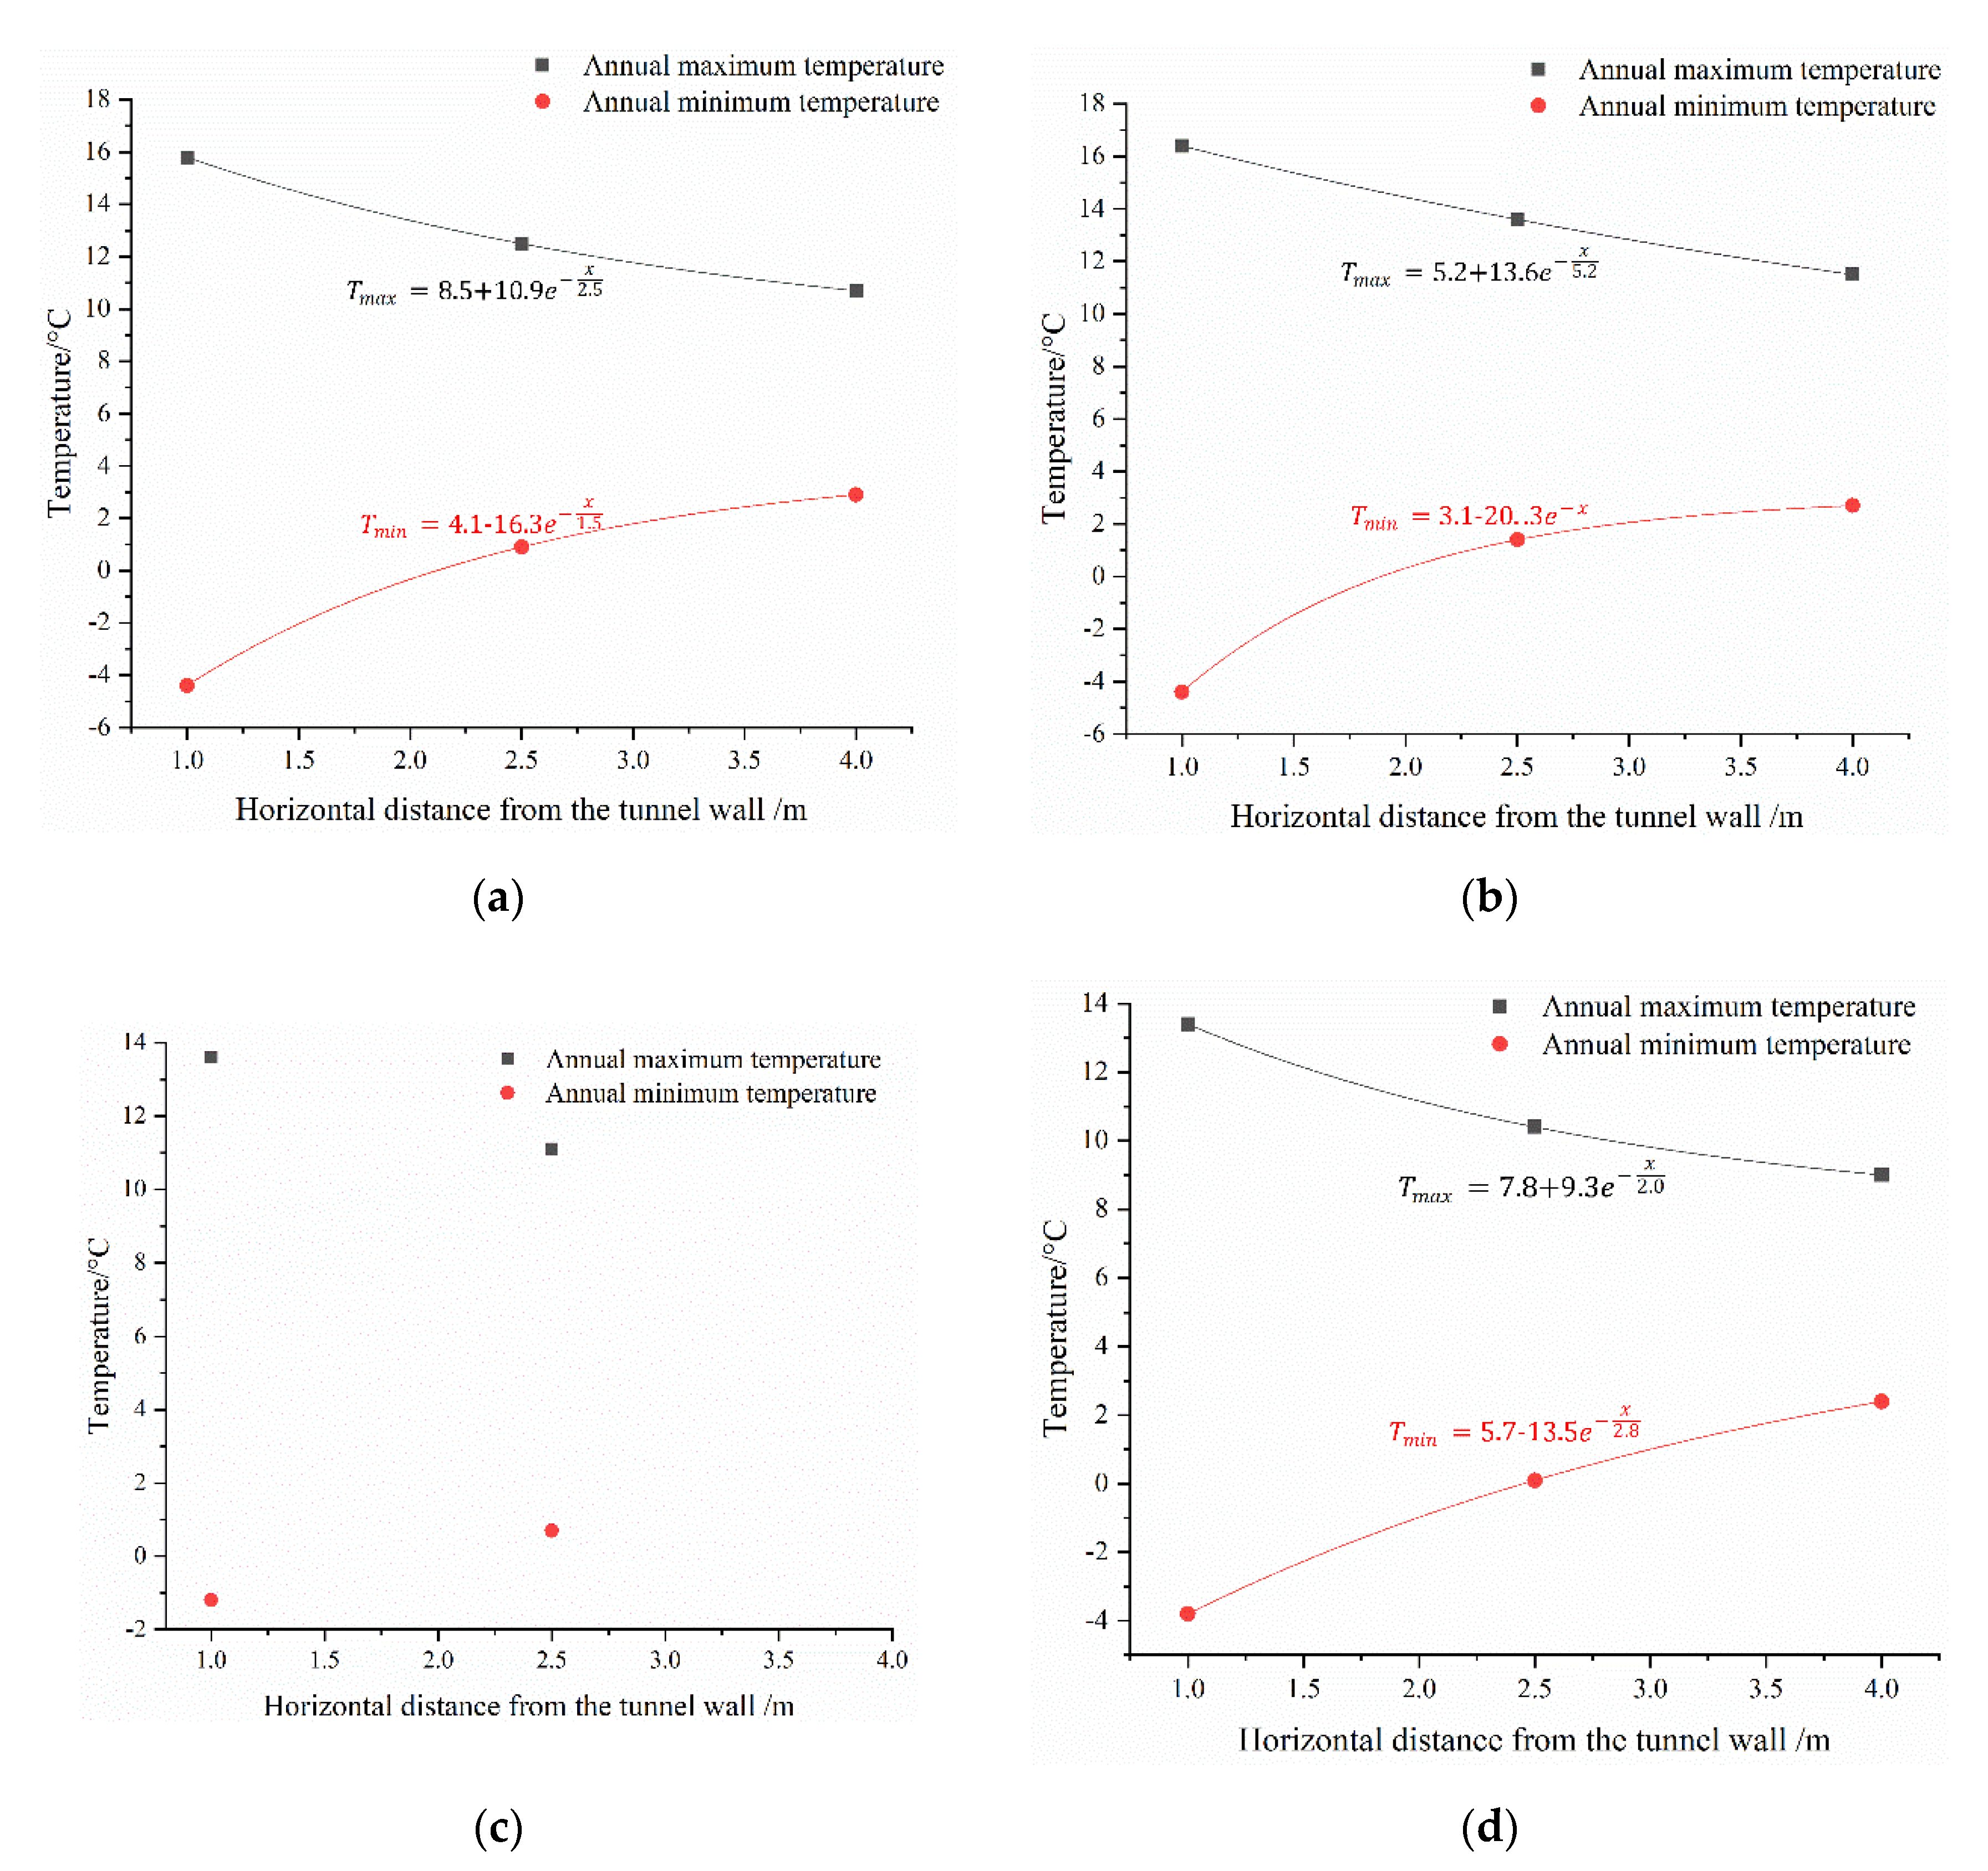
4.1. Frozen Depth
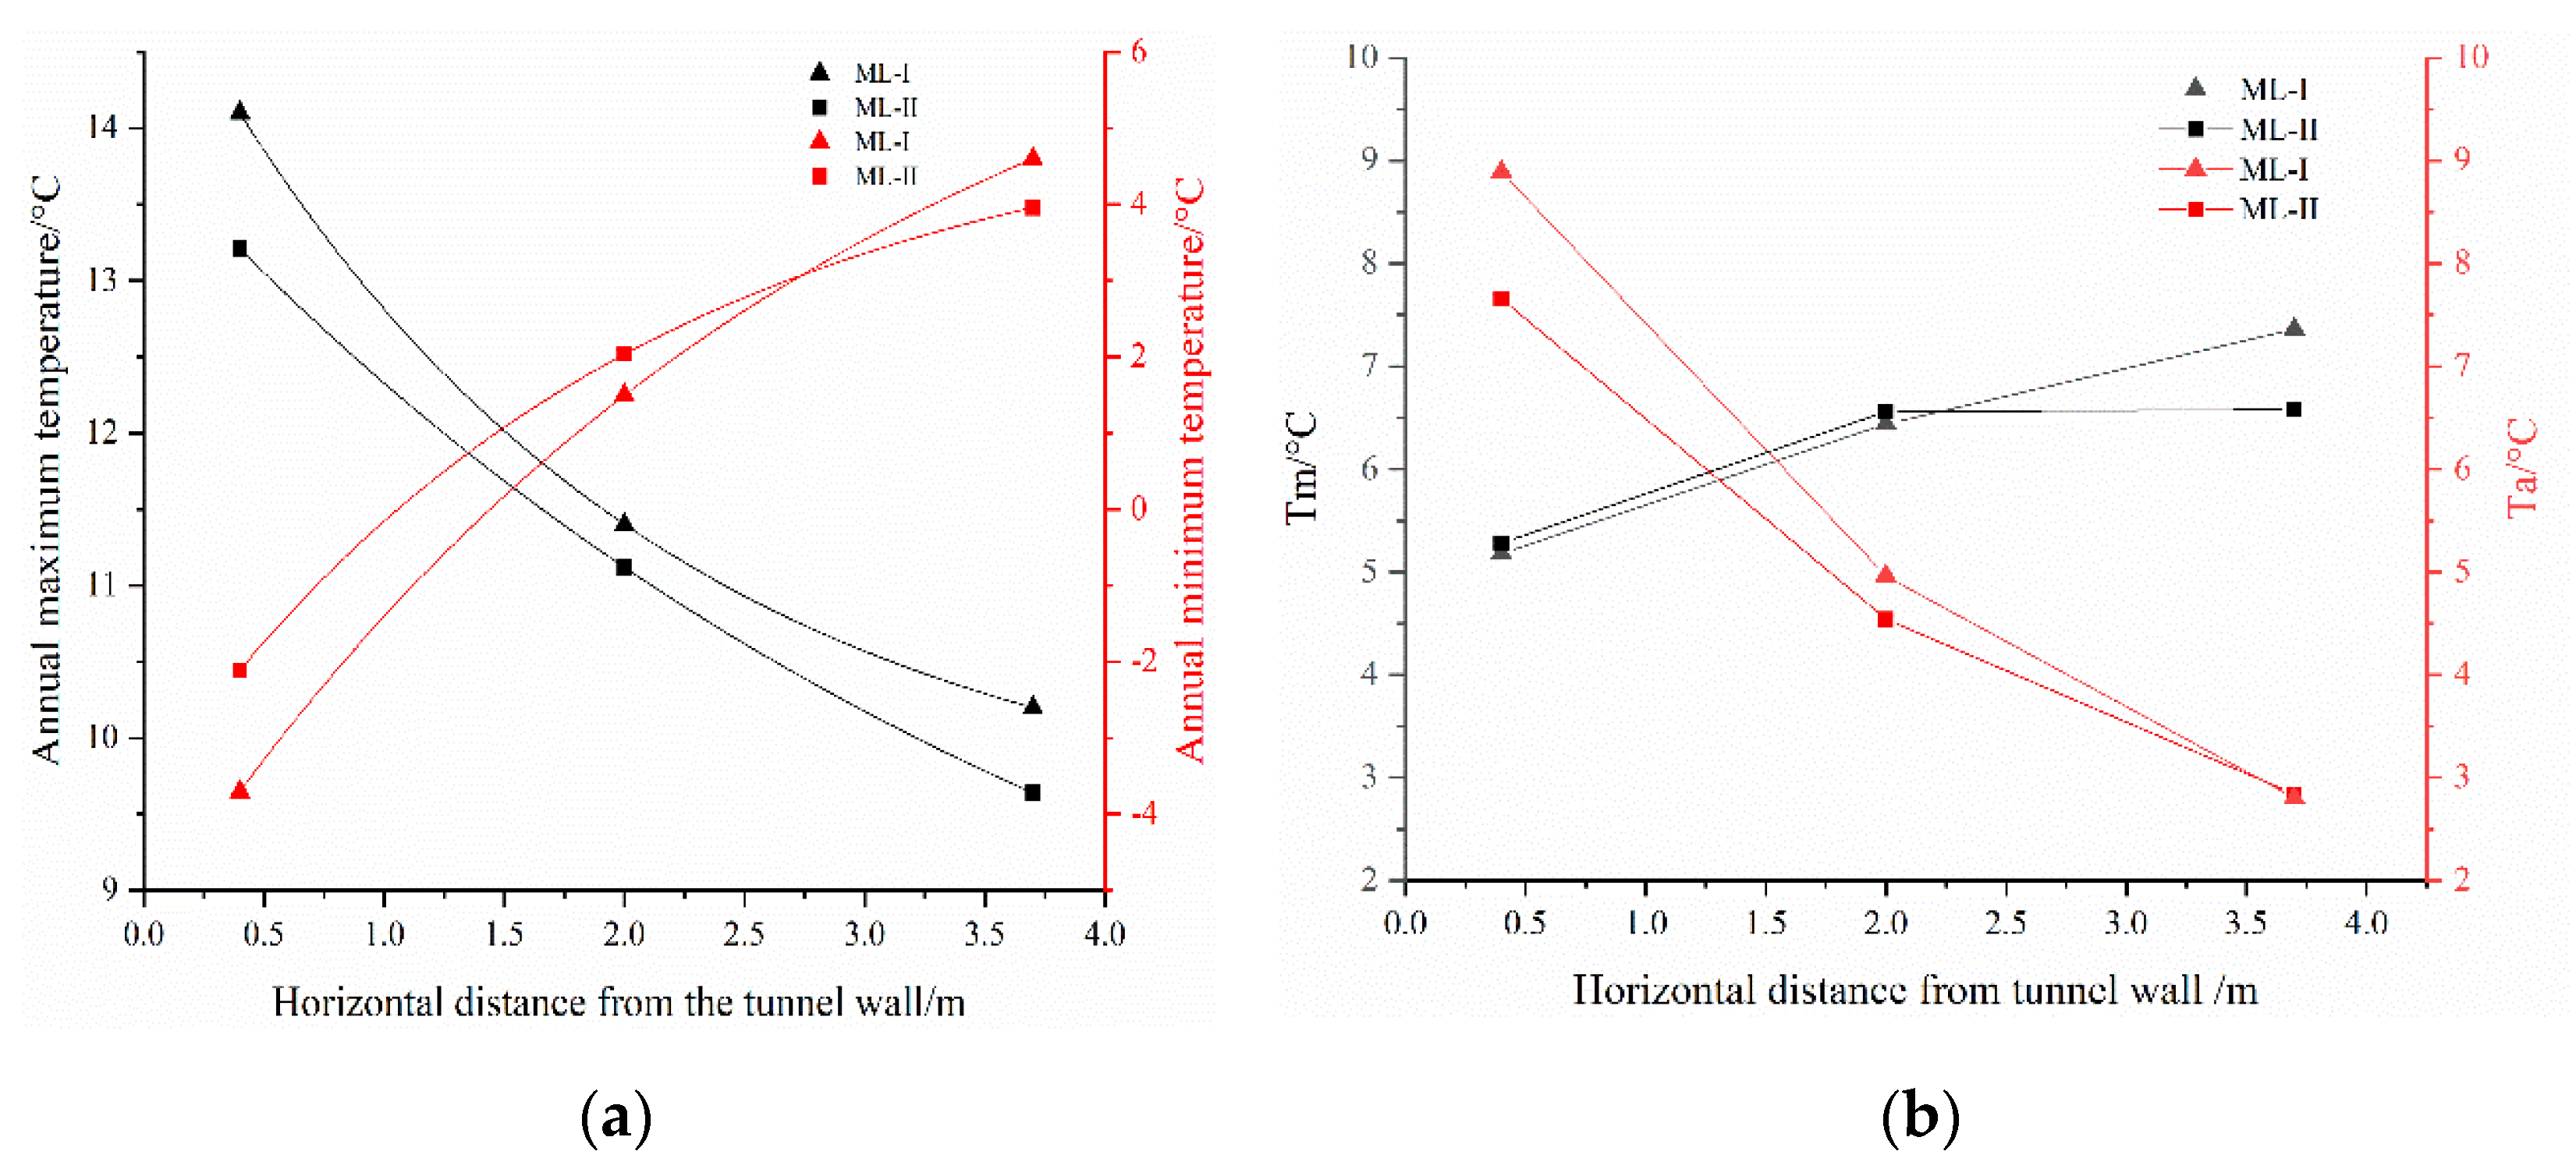
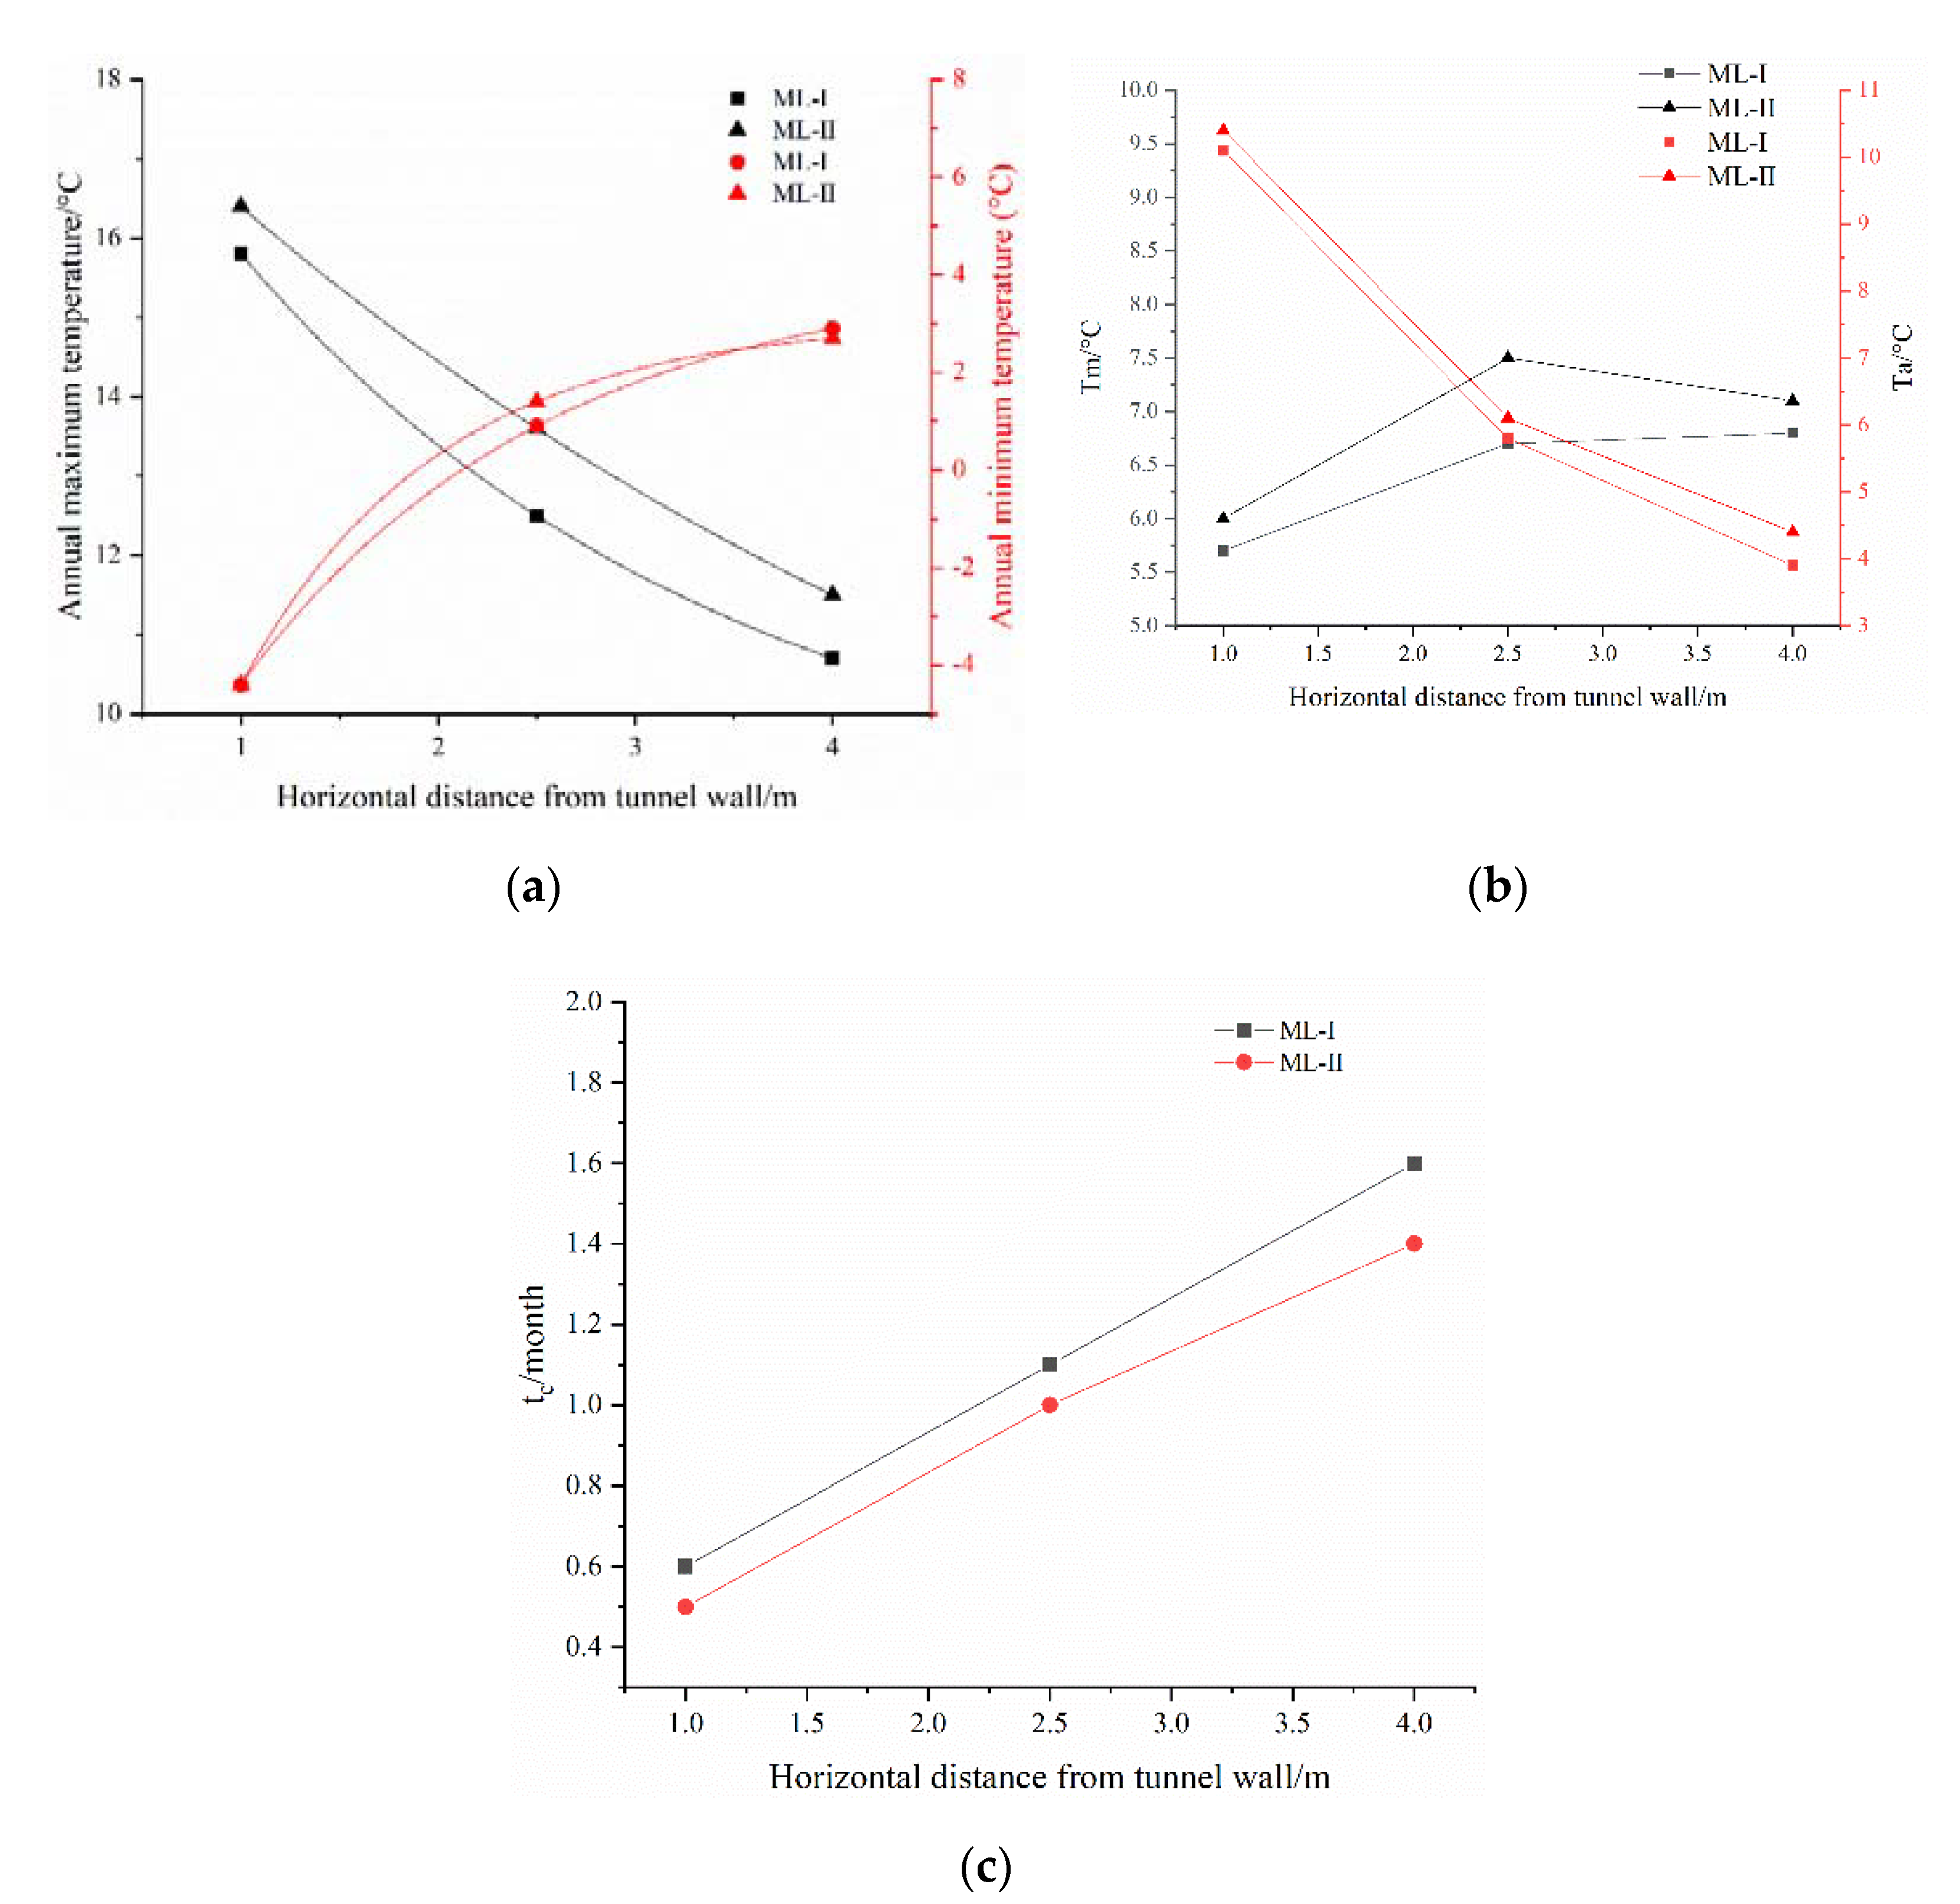
4.2. Asymmetric Temperature Fields
5. Conclusions
Author Contributions
Funding
Conflicts of Interest
References
- Xu, Q.; Ding, W.; Zhu, H.; Tang, Z.; Li, Y. Study on progressive unloading failure characteristics of superlarge tunnel in soft and weak rock mass. China Civ. Eng. J. 2017, 50, 104–114. [Google Scholar]
- Qu, M.; Xie, Q.; Hu, Y.; Li, C. Model test on frost heaving force of unnel lining in cold region. Chin. J. Rock Mech. Eng. 2015, 34, 1894–1900. [Google Scholar]
- Yang, P.; Ke, J.-M.; Wang, J.G.; Chow, Y.K.; Zhu, F.-B. Numerical simulation of frost heave with coupled water freezing, temperature and stress fields in tunnel excavation. Comput. Geotech. 2006, 33, 330–340. [Google Scholar] [CrossRef]
- Tang, G.Z.; Wang, X.H. Effect of temperature control on a tunnel in permafrost. Tunn. Undergr. Space Technol. 2007, 22, 483–488. [Google Scholar] [CrossRef]
- Roy, K.; Lim, J.B.P.; Lau, H.H.; Yong, P.M.; Clifton, G.C.; Johnston, R.P.D.; Wrzesien, A.; Mei, C.C. Collapse behaviour of a fire engineering designed single-storey cold-formed steel building in severe fires. Thin-Walled Struct. 2019, 142, 340–357. [Google Scholar] [CrossRef]
- Zhao, P.; Chen, J.; Luo, Y.; Li, Y.; Chen, L.; Wang, C.; Hu, T. Field measurement of air temperature in a cold region tunnel in northeast China. Cold Reg. Sci. Technol. 2020, 171, 102957. [Google Scholar] [CrossRef]
- Girard, L.; Gruber, S.; Weber, S.; Beutel, J. Environmental controls of frost cracking revealed through in situ acoustic emission measurements in steep bedrock. Geophys. Res. Lett. 2013, 40, 1748–1753. [Google Scholar] [CrossRef] [Green Version]
- Kozlowski, T. A semi-empirical model for phase composition of water in clay-water systems. Cold Reg. Sci. Technol. 2007, 49, 226–236. [Google Scholar] [CrossRef]
- Fei, T.; Antonio, B. Effect of temperature on deep lined circular tunnels in transversely anisotropic elastic rock. Undergr. Space 2016, 1, 79–93. [Google Scholar] [CrossRef]
- Zhou, Y.; Zhang, X.; Deng, J. A mathematical optimization model of insulation layer’s parameters in seasonally frozen tunnel engineering. Cold Reg. Sci. Technol. 2014, 101, 73–80. [Google Scholar] [CrossRef]
- Cui, S.a.; Liu, P.; Li, Z.; Xu, X.; Ju, J.W. Shotcrete performance-loss due to seepage and temperature coupling in cold-region tunnels. Constr. Build. Mater. 2020, 246, 118488. [Google Scholar] [CrossRef]
- He, X.; Li, A.; Ning, Y. Optimization of outdoor design temperature for summer ventilation for undersea road tunnel using field measurement and statistics. Build. Environ. 2020, 167, 106457. [Google Scholar] [CrossRef]
- Jun, K.-J.; Hwang, Y.-C.; Yune, C.-Y. Field measurement of temperature inside tunnel in winter in Gangwon, Korea. Cold Reg. Sci. Technol. 2017, 143, 32–42. [Google Scholar] [CrossRef]
- Zhang, Y.; Li, X. Heat transfer formalism using GFM and FEM in underground tunnels. Build. Environ. 2018, 143, 717–726. [Google Scholar] [CrossRef]
- Lyu, Z.; Xia, C.; Liu, W. Analytical solution of frost heaving force and stress distribution in cold region tunnels under non-axisymmetric stress and transversely isotropic frost heave of surrounding rock. Cold Reg. Sci. Technol. 2020, 178, 103117. [Google Scholar] [CrossRef]
- Zhang, X.; Lai, Y.; Yu, W.; Zhang, S. Numerical analysis for the three-dimension temperature fields in cold region tunnels. J. China Railw. Soc. 2003, 25, 84–90. [Google Scholar]
- Tan, X.; Chen, W.; Yang, D.; Dai, Y.; Wu, G.; Yang, J.; Yu, H.; Tian, H.; Zhao, W. Study on the influence of airflow on the temperature of the surrounding rock in a cold region tunnel and its application to insulation layer design. Appl. Therm. Eng. 2014, 67, 320–334. [Google Scholar] [CrossRef]
- Zhang, X.; Zhou, Z.; Li, J.; Zhou, Y.; Han, F. A physical model experiment for investigating into temperature redistribution in surrounding rock of permafrost tunnel. Cold Reg. Sci. Technol. 2018, 151, 47–52. [Google Scholar] [CrossRef]
- Zeng, Y.; Liu, K.; Zhou, X.; Fan, L. Tunnel temperature fields analysis under the couple effect of convection-conduction in cold regions. Appl. Therm. Eng. 2017, 120, 378–392. [Google Scholar] [CrossRef]
- Liu, W.; Feng, Q.; Wang, C.; Lu, C.; Xu, Z.; Li, W. Analytical solution for three-dimensional radial heat transfer in a cold-region tunnel. Cold Reg. Sci. Technol. 2019, 164, 102787. [Google Scholar] [CrossRef]
- Feng, Q.; Jiang, B.-S.; Zhang, Q.; Wang, G. Reliability research on the 5-cm-thick insulation layer used in the Yuximolegai tunnel based on a physical model test. Cold Reg. Sci. Technol. 2016, 124, 54–66. [Google Scholar] [CrossRef]
- Xu, P.; Wu, Y.; Wang, Z.; Huang, L. Distribution laws of freeze-thaw cycles and unsaturated concrete experiments in cold-region tunnels. Cold Reg. Sci. Technol. 2020, 172, 102985. [Google Scholar] [CrossRef]


| Monitoring Point | Time to First Extremum | First Extreme Temperature/°C | Time to the Second Extremum | Second Extreme Temperature/°C | Time to the Third Extremum | Third Extreme Temperature/°C |
|---|---|---|---|---|---|---|
| 2-4 | 12 May | 28.3 | 15 July | 26.3 | 25 August | 21.4 |
| 2-5 | 14 May | 14 | 20 July | 17.6 | 25 August | 14.6 |
| 2-6 | 22 May | 8.4 | None | None | None | None |
Publisher’s Note: MDPI stays neutral with regard to jurisdictional claims in published maps and institutional affiliations. |
© 2021 by the authors. Licensee MDPI, Basel, Switzerland. This article is an open access article distributed under the terms and conditions of the Creative Commons Attribution (CC BY) license (https://creativecommons.org/licenses/by/4.0/).
Share and Cite
Zhang, T.; Nie, L.; Zhang, M.; Dai, S.; Xu, Y.; Du, C.; Rui, X.; He, Y.; Wang, Y. Study of Temperature Field Distribution in Topographic Bias Tunnel Based on Monitoring Data. Symmetry 2021, 13, 1492. https://doi.org/10.3390/sym13081492
Zhang T, Nie L, Zhang M, Dai S, Xu Y, Du C, Rui X, He Y, Wang Y. Study of Temperature Field Distribution in Topographic Bias Tunnel Based on Monitoring Data. Symmetry. 2021; 13(8):1492. https://doi.org/10.3390/sym13081492
Chicago/Turabian StyleZhang, Tao, Lei Nie, Min Zhang, Shulin Dai, Yan Xu, Chao Du, Xiangjian Rui, Yuanyuan He, and Yuzheng Wang. 2021. "Study of Temperature Field Distribution in Topographic Bias Tunnel Based on Monitoring Data" Symmetry 13, no. 8: 1492. https://doi.org/10.3390/sym13081492
APA StyleZhang, T., Nie, L., Zhang, M., Dai, S., Xu, Y., Du, C., Rui, X., He, Y., & Wang, Y. (2021). Study of Temperature Field Distribution in Topographic Bias Tunnel Based on Monitoring Data. Symmetry, 13(8), 1492. https://doi.org/10.3390/sym13081492