Article

Cytoskeletal Filaments Deep Inside a Neuron Are not Silent: They Regulate the Precise Timing of Nerve Spikes Using a Pair of Vortices

1
International Center for Materials and Nanoarchitectronics (MANA), Research Center for Advanced Measurement and Characterization (RCAMC), NIMS, 1-2-1 Sengen, Tsukuba, Ibaraki 3050047, Japan
2
Amity School of Applied Science, Amity University Rajasthan, Kant Kalwar, NH-11C, Jaipur Delhi Higway, Jaipur, Rajasthan 303007, India
3
Chemical Science and Technology Division, CSIR-North East Institute of Science and Technology, NEIST, Jorhat, Assam 785006, India
4
Academy of Scientific and Innovative Research (AcSIR), CSIR-NEIST Campus, Jorhat, Assam 785006, India
*
Author to whom correspondence should be addressed.
Symmetry 2021, 13(5), 821; https://doi.org/10.3390/sym13050821
Submission received: 23 February 2021 / Revised: 4 May 2021 / Accepted: 5 May 2021 / Published: 7 May 2021
(This article belongs to the Special Issue Quantum Information Applied in Neuroscience)

Abstract

:
Hodgkin and Huxley showed that even if the filaments are dissolved, a neuron’s membrane alone can generate and transmit the nerve spike. Regulating the time gap between spikes is the brain’s cognitive key. However, the time modula-tion mechanism is still a mystery. By inserting a coaxial probe deep inside a neuron, we have re-peatedly shown that the filaments transmit electromagnetic signals ~200 μs before an ionic nerve spike sets in. To understand its origin, here, we mapped the electromagnetic vortex produced by a filamentary bundle deep inside a neuron, regulating the nerve spike’s electrical-ionic vortex. We used monochromatic polarized light to measure the transmitted signals beating from the internal components of a cultured neuron. A nerve spike is a 3D ring of the electric field encompassing the perimeter of a neural branch. Several such vortices flow sequentially to keep precise timing for the brain’s cognition. The filaments hold millisecond order time gaps between membrane spikes with microsecond order signaling of electromagnetic vortices. Dielectric resonance images revealed that ordered filaments inside neural branches instruct the ordered grid-like network of actin–beta-spectrin just below the membrane. That layer builds a pair of electric field vortices, which coherently activates all ion-channels in a circular area of the membrane lipid bilayer when a nerve spike propagates. When biomaterials vibrate resonantly with microwave and radio-wave, simultaneous quantum optics capture ultra-fast events in a non-demolition mode, revealing multiple correlated time-domain operations beyond the Hodgkin–Huxley paradigm. Neuron holograms pave the way to understanding the filamentary circuits of a neural network in addition to membrane circuits.

1. Introduction

1.1. Can the Neuron’s Membrane Alone Generate and Transmit Nerve Spikes?

In 1907, Lapicque proposed that the neuron cell surface passes an electric current following a large electric potential burst in its cell body, or soma [1,2]. In 1928, Katz continued this work in order to understand the communication between neuron fibers by blocking the cells’ ionic transmissions [3]. The fully disconnected neurons can communicate and trigger firing in the other neurons. Hodgkin and Huxley melted the filaments inside a neuron using chemicals and showed that the neuron fires [4,5]. The experiment proved the absoluteness of the neuron membrane. It was concluded that everything inside a neuron remains silent, and its membrane, which is akin to a life form’s skin, is the only active material. However, experiments that were started in 1928 to find alternate forms of communications in a neural network have never stopped. In the last hundred years, researchers have found several instances of wireless communication between neurons [6,7]. If the rate of spike timing changes, at certain values, the endogenous electric field undergoes significant changes, and information edits itself in a neuron [8]. Neuron’s non-synaptic firing responses, like a living life form, have been reported repeatedly [9], and even epileptic seizure-like uncontrolled firing has been attributed to it [10]. One route to understanding alternate forms of signal transmission was to probe the membrane using different forms of energy. For example, electromagnetic radiation is able to initiate or stop a neuron’s firing. Nerves emit infrared bursts [11,12,13]. In short, optical flashing, thermal fluctuation, and electric potential changes in the environment around a neuron trigger a neuron’s firing. Sub-threshold communications play a significant role in spike time modulation [14,15]. While reports of radically distinct non-ionic communication such as heat flow have continued for nearly a century [16,17,18,19,20], no specific neuron component has been identified as responsible for such unorthodox neural responses. Questions have been raised regarding the validity of the Hodgkin–Huxley paradigm. However, so far, a material that resides in the neuron to assist alternate forms of energy transmission has yet to be proposed or observed.

1.2. Communication of Electromagnetic Signals through the Filamentary Bundle

Two major discoveries regarding subcellular neuron structures [21] have not been correlated with signal transmissions and information processing in neuroscience. First, the Hirokawa group used cryo-mapping to discover an ordered internal filament structures all along the neural branches [22,23,24,25]. In the field of contemporary neuroscience [26], it is widely believed that cytoskeletal filaments only provide strength and assist in transport. The highly ordered parallel network of microtubule and neurofilaments that form the core part of the axonal and dendritic branches could exist for several reasons other than providing strength. Moreover, spiral arrangements of tubulins in a microtubule have a rotational direction, and all microtubules have an identical rotational direction in a neural branch [27,28,29]. Similarly, rotational directions have been found for all filamentary structures. Again, a singular orientation has nothing to do with providing strength, therefore, there are probably various other reasons. Second, Xu et al. have shown that just beneath the membrane, there are ordered cross-wires, similar to a checkerboard, made of actin, beta-spectrin, and other associated proteins [30,31,32,33,34]. Such a 4–5 nm wide grid-like architecture, which is sandwiched between the membrane and the filamentary core, is likely to have a certain purpose. The entire internal structure of axonal or dendritic branches has higher-ordered architectures of different symmetries. The relationships between these structures and functional origins are unknown.
Nerve spikes tune the time for cognition, and thus, neurons’ incredible time management has been the subject of rigorous investigations [35,36,37]. In 2016, we published two back-to-back works detailing coaxial probe technology, which has been used for more than half a century to study the dielectric properties of nanomaterials [38,39]. We also introduced dielectric resonance microscopy for imaging neurons for the first time. Using these two distinct tools together, we investigated different ultrafast communications of electromagnetic signals through the filaments by using a coaxial probe. The filamentary transmissions saturate 200 microseconds before a neuron fires, a time-domain that is 1000 times faster than nerve spikes. We also have recently detailed rigorous theoretical works on coaxial probe measurements of filaments and single ion channels [40]. There have been multiple reports on single ion channel measurements; however, building an ion channel sensor at the nanoscale has been a critical challenge. It is not easy to optimize ion neutralization at the nano-pore, which is key to estimating ionic current analogous to a patch-clamp edge. One can set three frequencies in the coaxial probe and simultaneously study three time-domains: milliseconds, microseconds, and nanoseconds [41]. The orthogonal, transistor-like measurement of transmissions across tubulin protein, microtubules, and neurons shows that all these elements have a similar, favorable time-domain pattern. Discrete-time zones group in a triplet of triplet arrangement. Such a scale-free triplet of triplet temporal relationship [41] suggests that the current thrust in spatial mapping may be incomplete, and we need spatiotemporal mapping of the biomaterials. Topographic organization of nerve information was proposed some time ago but will be visualized here [42,43]. Most importantly, we review the feasibility of several studies that have proposed communications beyond the Hodgkin–Huxley paradigm [44,45,46,47].

2. Experimental Details

2.1. Neuron Culture

Following the Lonza company manual, we cultured embryogenic neuron cells as described previously [38,39,40,41]. The cells were incubated in CO2 (5%) at 37 °C temperature for 4 h. After that, we added a fresh, pre-heated medium. On the fifth day, we changed the initial medium and the 50% growth media was changed every four days. A suitable amount of medium was heated at 37 °C in a sterile container. After that, we removed 50% of the medium from the cell culture and replaced it with the warm and fresh medium. Finally, the cells were returned to the incubator. The neural branch adjustment of the grid was continuous with the electrode for 8 to 9 days. We used the rat hippocampal neurons cultured for 6–14 days for dielectric resonance and optical vortex studies. The medium was removed from the cells before exposure to microwave, radio-wave, and monochromatic light (633.5 nm He-Ne light source). Furthermore, we left a small amount of medium to ensure that the cells were not dry. Neurofaschin was used to melt the filaments and obtain the membrane’s optical vortex projection without the filament. Pure membrane’s optical vortex acted as a control measurement for the neuron’s holographic response.

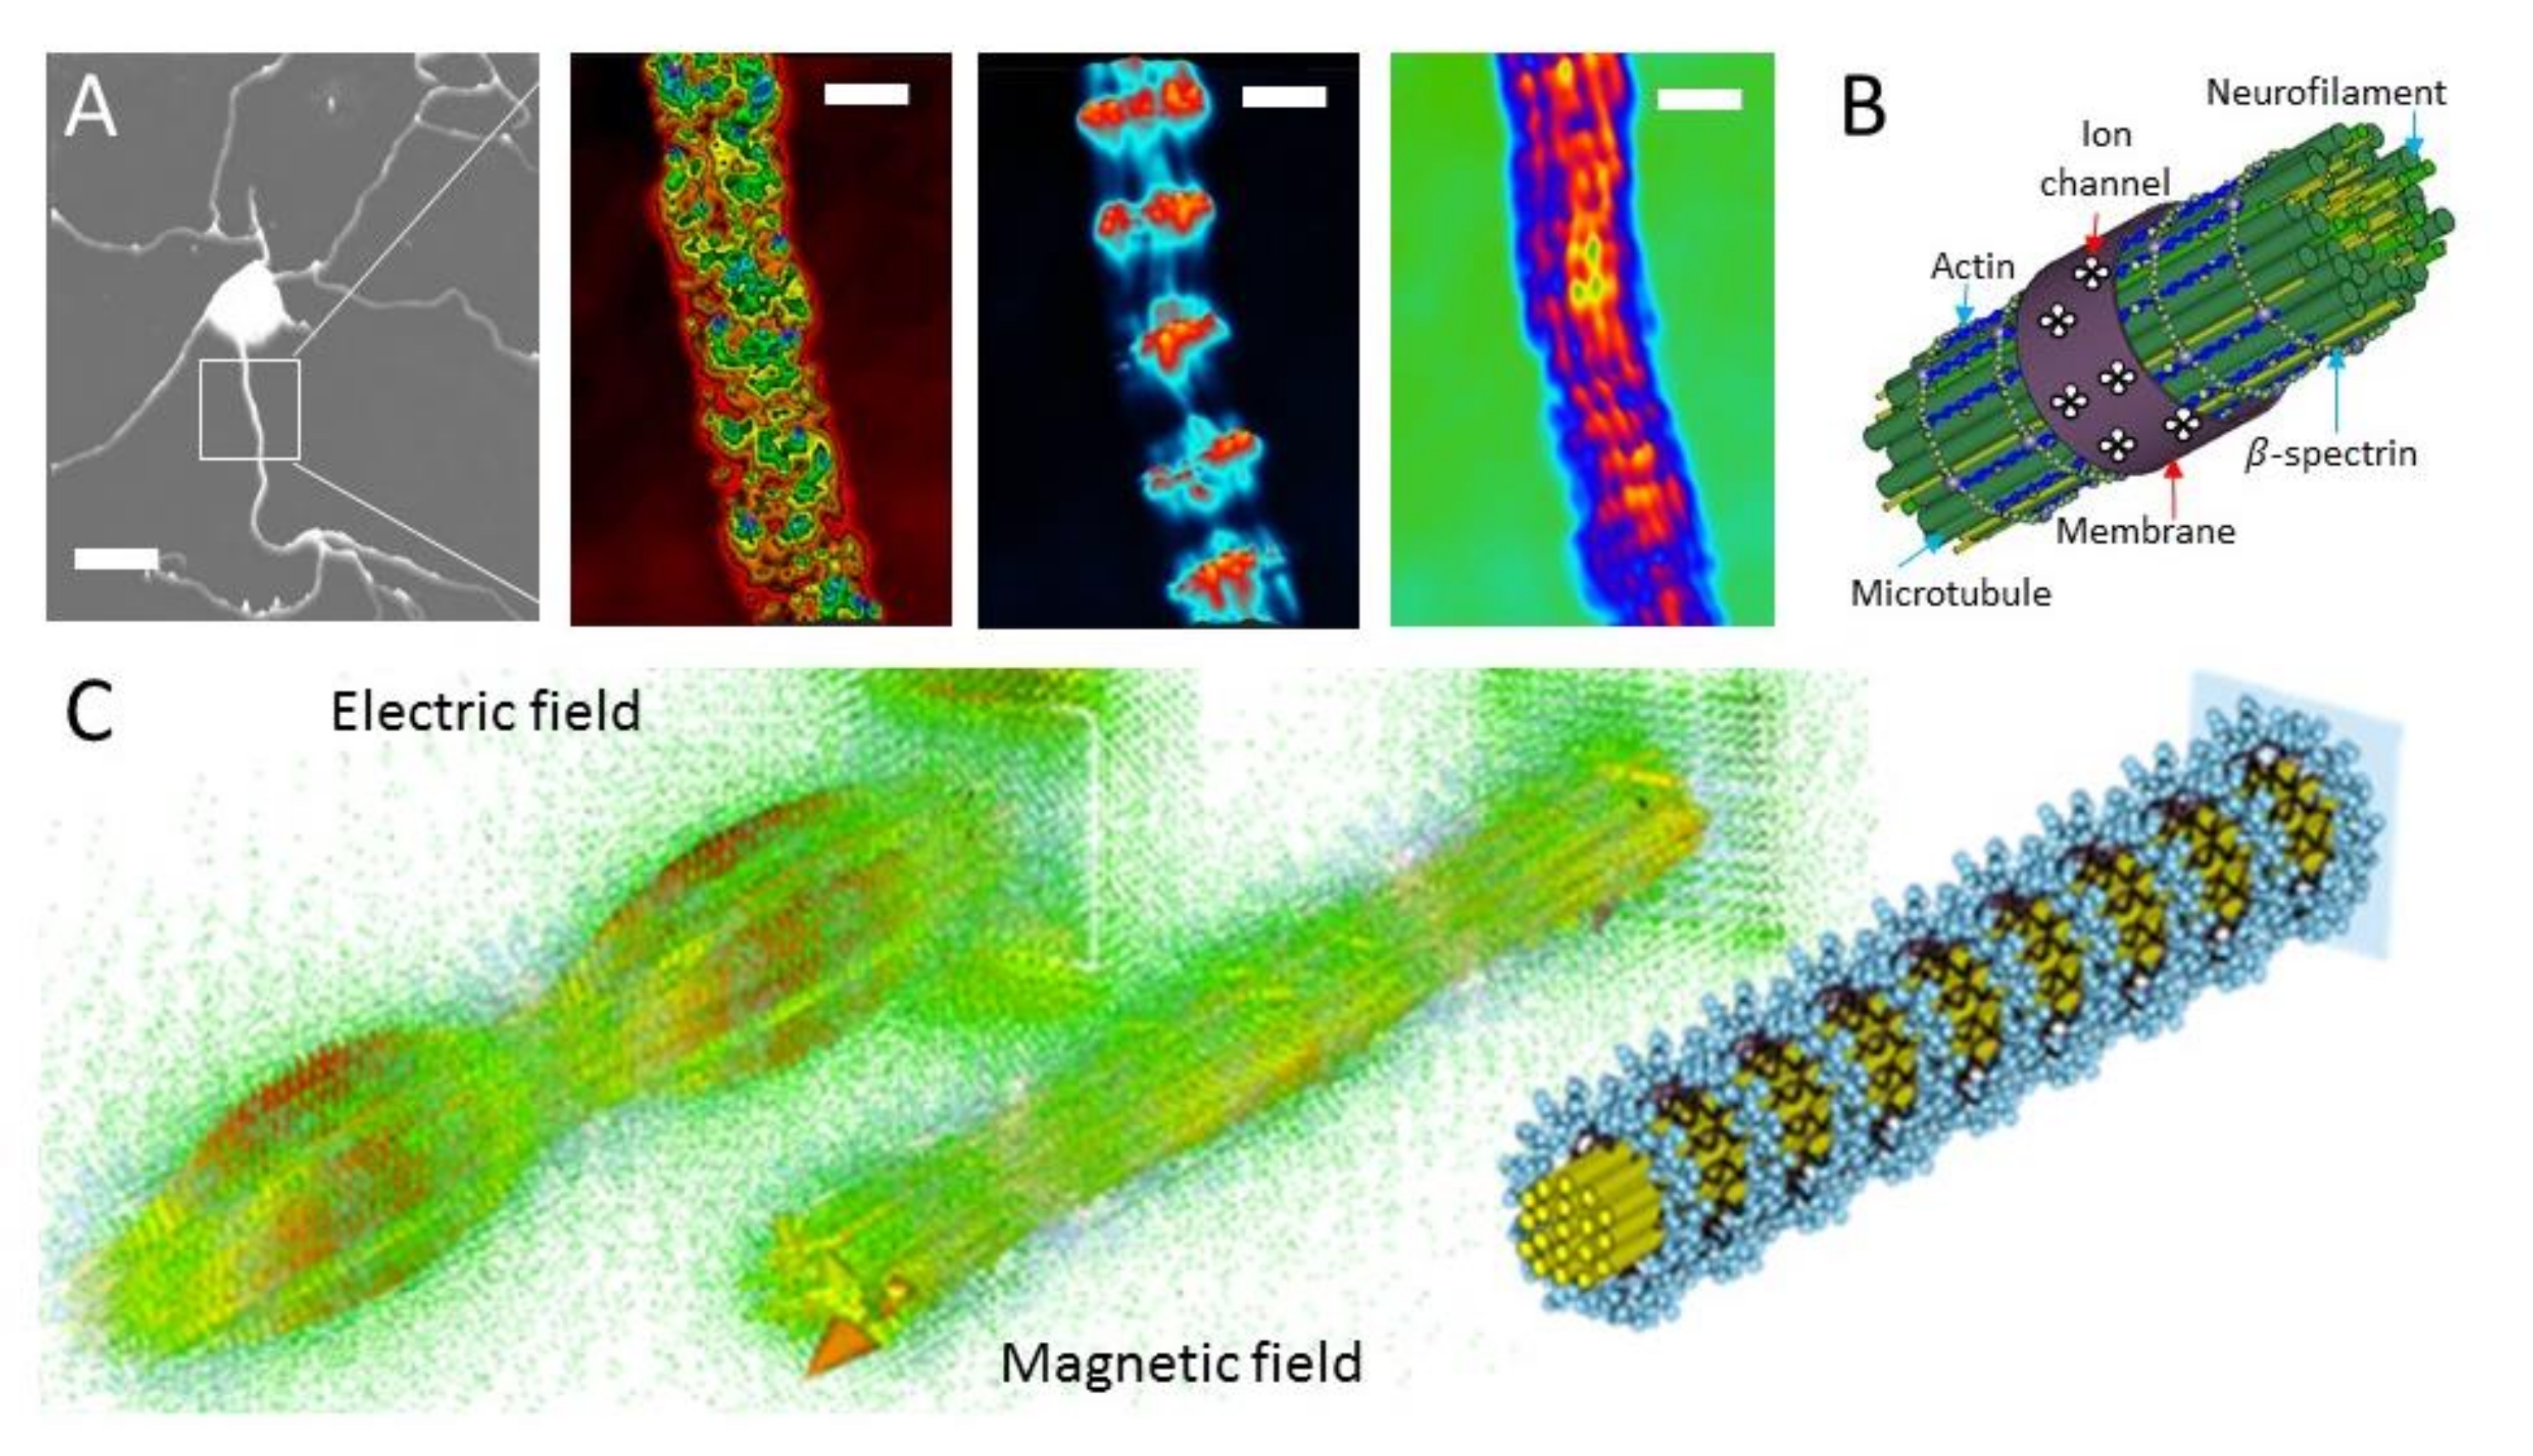
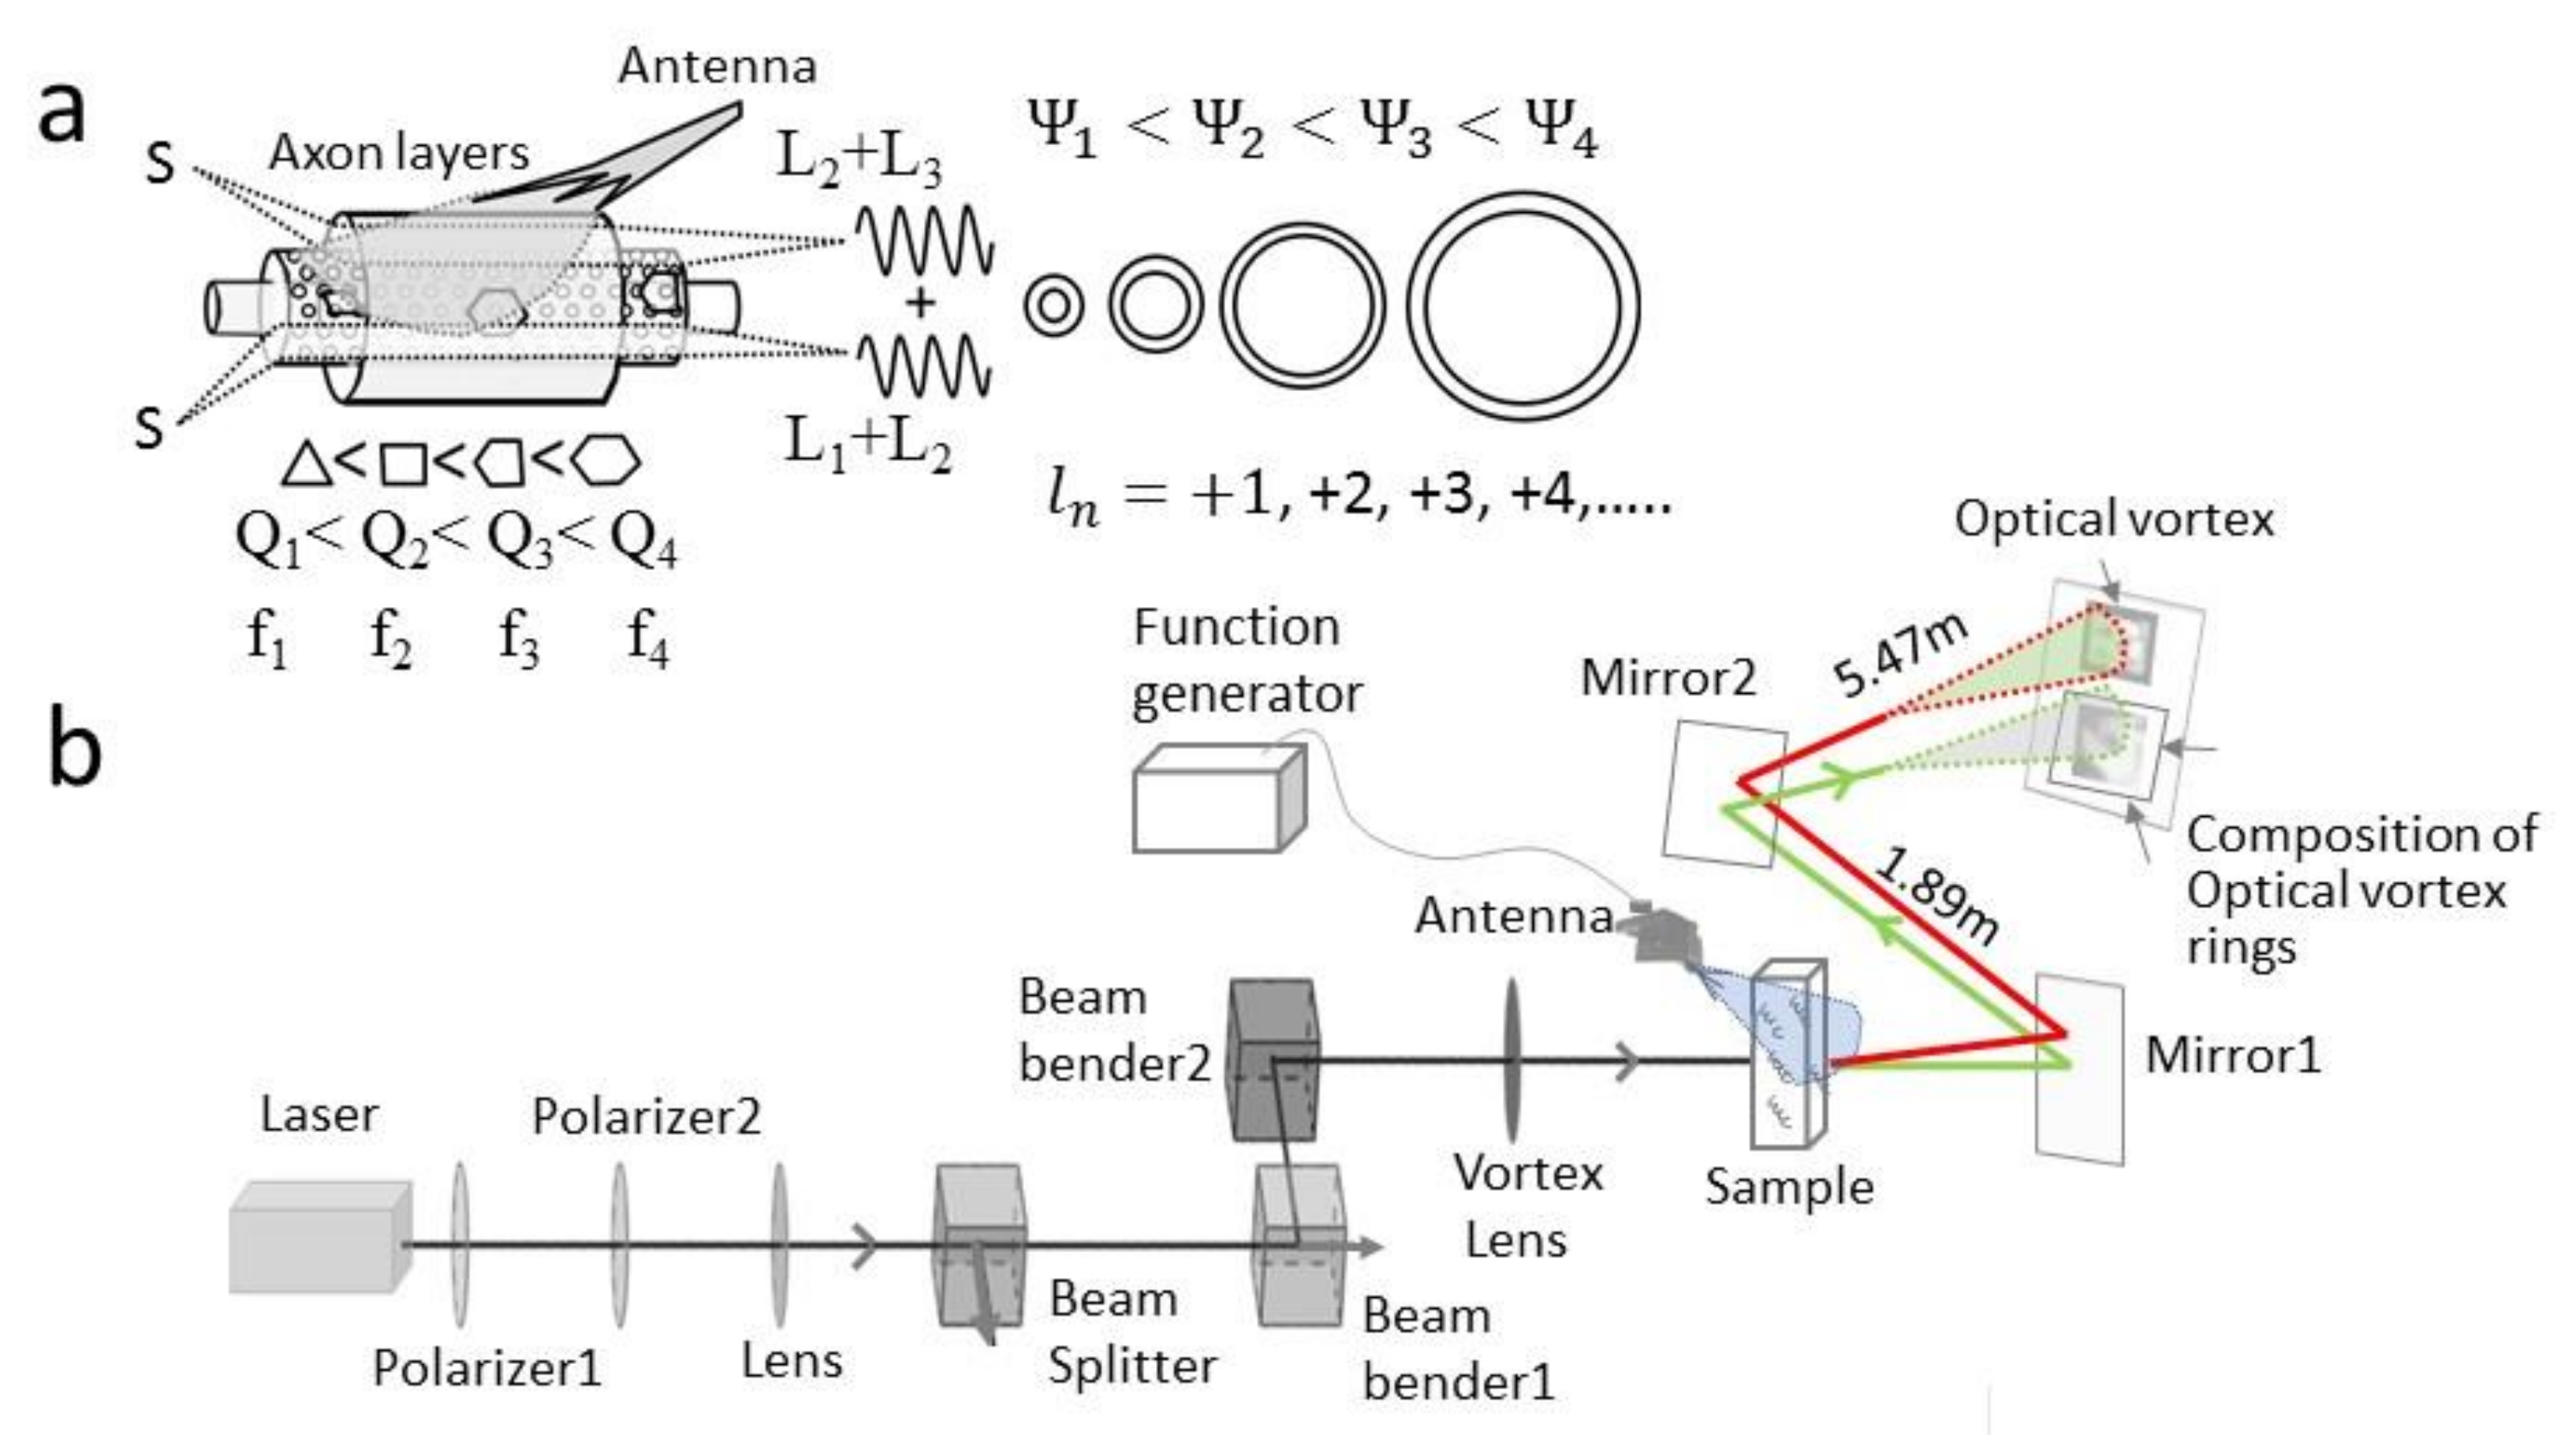
2.2. Dielectric Resonance Imaging and Optical Vortex Study: Simultaneous Measurement of the Membrane, Beta-Spectrin, and Microtubule-Neurofilament Core

In neurons, we have frequently used singular or an array of coaxial probes for capturing various modes of signal transmissions. One singular probe can only study one mode of signal transmission. However, a coaxial probe can send and receive three pairs of distinct signals simultaneously via Au, Pt metal wires and a glass-filled cavity between Au and Pt (Figure 1). Dielectric resonance imaging is achieved by wirelessly pumping electromagnetic signals to the culture plate. The EM wave is mainly reflected from the metal disc kept below the neuron culture plate. A 2D map dielectric resonance image is produced from the reflection and transmission coefficients. Simultaneously, the control software delivers three images. The synchronous signal transmitting through the three elementary structures of a neuron was measured using various instruments such as a vector analyzer, impedance analyzer, and spectrum analyzer. 3D dielectric resonance images of axon initial segment (AIS) generates at its resonance peaks in KHz-MHz frequency domain (Figure 2). In the optical study, the antenna was no longer a coaxial probe, instead it was a wide-range antenna (Figure 3A,B) that applies suitable resonance frequencies, as observed by the coaxial probe study of resonance.

2.3. Microtubule Reconstitution from Tubulin for Deconvolution of Neuron’s Optical Vortex

To reconstitute the microtubule, porcine brain-extracted tubulin protein was purchased from Cytoskeleton Inc. (Denver, CO, USA). The tubulin subunit was protected at a temperature of −80 °C. To polymerize tubulin into microtubule (6.5 um long), microtubule cushion buffer was added to normal tubulin buffer (830 uL), and guanosine 5’-triphosphate-GTP solution (10 uL) was added to the solution. The entire mixture was put into an ice bath for 10 min. The 200 uL solution was added to the mixture and then incubated in an ice bath for 10 min. The mixture was then placed in an incubator for 40 min at 35–37 °C. To stabilize the microtubule, paclitaxel (20 uL) was dissolved in dimethyl sulfoxide methyl sulfoxide (DMSO) and added to the solution. Subsequently, it was incubated at 37 °C for 10 min. The length of the microtubule was between 4–20 μm. The composition of the microtubule cushion buffer and general tubulin buffer was 80 mM PIPES pH 6.8, 1 mM MgCl2, 1 mM EGTA (ethylene glycol tetra-acetic acid), 60% v/v glycol and 1 mM EGTA, 80 mM Pipes pH 7, 2 mM MgCl2, respectively.

2.4. Actin Filament Reconstitution from Actin and Tubulin Solution for Deconvolution of Neuron’s Optical Vortex

A microtubule solution mixed with beta-spectrin and tubulin protein solution was prepared following the instructions of Lonza Inc. (Basel, Switzerland) to find the elementary optical vortices in the vortex assembly. We only obtained a few vortices for optical studies of tubulin; at GHz resonance frequencies, the vortices are modulated. Here, we used tubulin and microtubules to confirm that the optical setup delivered light rings of different shapes and sizes. We prepared solutions independently, and carried out repeated measurements to build a database of optical vortices for the elementary components of a neuron so that neuron’s optical vortices were recognized.

3. Results and Discussion

3.1. Ionic Nerve Spike Is Not a 1D Gaussian Packet but a 3D Ring of Electric Field

Classical neuroscience textbooks and research papers show a nerve spike as a linear propagating 1D perturbation. While propagating on the membrane surface, a nerve spike is never shown as a 3D Gaussian wave packet. In reality, a nerve spike is a ring of electric fields around the circular perimeter of an axonal branch, as shown in Figure 1A. The ring-like feature of a nerve spike has never been presented in the scientific literature. However, reliable transmission without dissipation is a major problem for long axonal branches. Often in the literature, non-dissipative neural transmissions are analyzed as a 1D spike, which does not reveal what truly happens in the network in a real-world scenario. The ring shape is geometrically more stable than a 1D point perturbation or a 2D Gaussian wave packet. Therefore, even a simple conceptual transition from the 3D Gaussian shape of a nerve spike to a ring could have changed the direction of the debate on this issue. In other words, the reasons for the stability of the nerve spike for a ring would differ from concerns explored in 1D or 2D spike-related research. A vortex is defined as a ring of field, and therefore, a nerve impulse is a vortex that covers the perimeter of axonal or dendritic branches in a closed loop. However, the absence of topological features in this case has restricted researchers from investigating the wider implications of a ring of fields. For the first time, we concentrated on the ring shape and aimed to understand how a neuron holds the ring shape of a nerve spike when electric fields travel a long distance. At the same time, we tried to understand the nature of transmissions by microtubule or tubulin proteins. Do they also create vortices made of an electromagnetic field? Then, how do the filaments work together with the ionic vortices?
In summary, in this study we used dielectric resonance microscopy and pumped artificial vortices to the filamentary bundles. We found a one-to-one correlation between the filamentary vortices and membrane vortices. That relationship forms a pair of giant rings of electromagnetic vortices just below the membrane. These two rings allow only the ion channels inside, emits the ions as a nerve spike that travels through the membrane post-firing, as shown in Figure 1B.

3.2. Wirelessly Imaging Internal Neural Components Using Scanning Dielectric Microscope Operating at Selected Frequencies

Our experimental setup is shown in Figure 1C. We shone electromagnetic signals at resonance frequencies onto the axon bundle. Under electromagnetic field exposure, we carried out two independent experiments. First, we scanned the surface and the image reflected and transmitted signals through the neuron at different frequencies [48]. We used those signals to create a surface image. The inner components of neurons that selectively resonate at certain frequencies are visible in the images. Such imaging is popularly known as dielectric resonance imaging [49], and imaging neurons using this technique has been used to understand filamentary resonance. However, thus far, the actual correlation between three ordered structures inside a neural branch has not been shown. The first ordered structure of a neural branch comprises 90% of its volume and includes microtubules and a neurofilament bundle-based core located at the center. Second, beta-spectrin and actin-based grid-like cylindrical wrap around the core that interfaces the top lipid bilayer of the neuron membrane, which is the third structure. We created two different versions of the scanning dielectric microscope. One of them was STM-based, where we could scan molecular-scale materials (Figure 1D). The other version was a coarse scanner (Figure 1E). Depending on the biomaterial dimensions, we changed the scanner.
Using dielectric resonance imaging, we showed the lipid bilayer surface or the membrane when we set the scanner tip at kHz frequency. In the fourth panel of Figure 2A, a high electron density of states horizontal transmission channels at selective frequencies are visible transmitting longitudinally all along the neural core. At MHz resonance, we see the structure. Sections of the neurofilament–microtubule bundle acquire resonating electromagnetic energy, and due to its dielectric resonance and local symmetries of the 3D arrangement of filaments, selectively transport quantized energy [50,51]. However, given the low resolution of dielectric resonance imaging technology, we cannot record events at the nanometer resolution.
Moreover, they contribute to the endogenous field of a neuron [52]. In the third panel, Figure 2A, we selectively resonated the beta-spectrin-actin grid by choosing a proper resonance frequency that shows the formation of bright rings in the dielectric resonance images. These electromagnetic vortices created beneath the membrane transmit the rings. The existence of rings of fields beneath the membrane is interesting because they shift location. The pair of rings has a purpose, and we need to understand why horizontal transmissions along the filamentary bundles at the core transform into a pair of rings in the beta-spectrin–actin grid. The synchronization of actin and microtubule is widely used by a neural network [53]; however, both structures are closely packed.
Hence, the probability of energy transfer is more profound as we can find it theoretically in the CST structure by solving the Maxwell equation (Figure 2B). Here we used the design tool to create the structure. There are various geometric options such as a cube, sphere, cylinder, cone, torus, etc. We assigned the solid components as dielectric resonators and the hollow components as the cavity resonator. A simulation study of its replication was performed under the time domain solver. To obtain the actual resonance behaviour of biomaterials, a suitable selection of simulation parameter conditions is required. We need to scan the entire frequency range (Hz-THz) with appropriate boundary conditions and explore the potential distribution on the model at resonant frequencies. The axon showed the major interference effect in the overall length (Figure 2C). Additionally, the simulation study showed the clocking nature of the electric and magnetic fields, which appears in a node and antinode form, as shown in the left two plots of the panel in Figure 2C. The conversion of the electromagnetic field’s geometric distribution is due to the symmetry breaking in filaments’ arrangement. Horizontal arrays of neurofilaments and microfilaments form a nearly 200 nm × 200 nm square grid. The orthogonal transformation of the field vector leads to the formation of topological rings. The vector plots shown in Figure 2C suggest that the orthogonal transformation selects only the pathways perpendicular to the neurofilament–microfilament arrangements. The square grid’s cross-pathways are therefore selected, which is a ring. Finally, by changing the setup frequency for scanning, we can resonate the top of the membrane with ionic transmissions by tuning the imaging tip to the kHz frequency domain. Actin filaments are known to modulate voltage-gated ion channels [54].

3.3. Optical Vortex: Angular Momentum Modulation, Composition and Superposition

The dielectric resonance imaging reveals the possible key steps of neuron firing; however, it delivers a static image. To learn the dynamic process involved in the three structures noted above, we set up a culture plate, as shown in Figure 3A, that shines a rotating polarized light 633.5 nm wavelength on the neurons using the same setup as in Figure 3B. Our objective was to probe the three primary ordered structures of neural branches, as noted in Figure 3C,D. The shift in the optical angular momentum L under electromagnetic resonance is used to detect proteins [55], but here we used rotating light as shown in Figure 4a. Rotating light is an optical vortex, its angular momentum changes due to light–matter interactions. Figure 4a shows that there could be three primary layers of axonal branches interacting with each other and generating an optical vortex exclusive to the mutual interaction. Here, in this panel, we see that the top membrane layer (L3) and beta-spectrin–actin layer (L2) interacts and generates a new light ring with angular momentum L2 + L3. Similarly, the microtubule–neurofilament core vortex with angular momentum L1 interacts with the beta-spectrin–actin layer (L2) and generates a new vortex. Apart from individual ordered structures editing the diameter of the input optical vortex, an integrated system vibrating together generates additional vortices for each interactive mode. The largest singular clock regulating the entire system is given by | E > = c 1 e i m 1 + c 2 e i m 2 + c 3 e i m 3 , where, m is the topological charge, is the azimuthal angle, 1,2,3 are three layers L1, L2, and L3, respectively. A neuron is an extremely complex system because c i values are a composition of other elements. We have taken an individual microtubule, actin, and protein solutions and by applying the optical vortices, we attempted to decode the vortex assembly generated by a neuron cell.
The application of different resonance frequencies to the dielectric material when an optical vortex interacts with it affects the charge density distribution on the surface. As shown in Figure 4a, larger changes in the charge density distribution would affect a larger shift in the diameter of the light ring. Charge density regulates the reflection and transmission properties of a material. Therefore, each resonating material in the neuron structure would modify the optical vortex, change its diameter and or rotational direction. The vortex beam, containing many vortices, falls on the neuron and creates an ensemble of vortices interacting with various components. A statistical distribution of different electron density distributions in various components is reflected in the projected beam as the composition of vortices of different diameters.
Particularly for the three primary structures of neurons, the vortex’s angular momentum gets modified in three statistically dominating sets, while interacting with the lipid bilayers of neurons, ions and resonating filaments, and the rectangular grid. We carried out several optimizations and background error corrections to identify the structural origin of several distinct vortices as an assembly in the output vortex assembly, as shown in Figure 5. However, it was not possible to detect all light rings. The superposition of many rings in the emitted vortex assembly from the neuron could be observed in Figure 5. Here we provide a generic rule on the protocol for identifying the vortex origin. Three distinct structures in the neural branches have three distinct assemblies of optical vortices that are spatially different in their assembly of optical vortices. Figure 5 shows four of many important ordered sub-structures inside a neuron. We were able to isolate and recreate them separately in the solution and observe the optical vortices produced. The vortex assembly of individual sub-structures appears nearly similar. However, the diameter, angular momentum, and the number of dark spots on the rings help match the database of Figure 5 with the final hologram of a complete neuron in Figure 6. Additional confirmation of proper deconvolution of vortex rings can be done by resonating the sub-parts differently and identifying the modified regions of light rings.
The scheme of the experiment is shown in Figure 3B, while the propagation path of the electromagnetic wave is shown in Figure 4b. Both the setups are integrated into a practical device characterization unit. The concept of the experiment is that we shine an optical vortex into the neuron’s ring exchange system shown in Figure 3C,D. Several neural components change the angular momentum of the input vortex differently. Even the resonantly interactive modes involved in the energy transfer interact and generate a new vortex.
Therefore, the first step to understanding the optical vortices reflected from the neural component is to identify the origin of each ring in the vortex assembly. Using a database of optical vortices, we have shown how elementary components generate optical vortices or holograms in Figure 5. The experimental setup for control experiments remained the same as the neuron’s setup. We replaced the culture plate of the neuron with the solutions of tubulin protein, microtubule, and actin–beta-spectrin mixture so that the materials modified the input optical vortices. In the table of Figure 5, we have listed multiple repeated measurements by preparing the solutions independently. We found standard vortex filtering and sorting of vortices based on angular momentum and rotational direction of angular momentum in the literature. This is a routine task in quantum optics. Each vortex ring or light ring has a distinct signature for angular momentum, rotational direction, and diameter, and dark spots as vector notation.
As demonstrated in Figure 5, the database of the control experiments reveals a few interesting observations. First, the membrane has two-fold symmetries, generating two distinct optical rings. Figure 5 is a phase hologram, and the relative ring locations suggest the possible phase coupling between various dynamic components in the solution, which depends on the applied frequency. The microtubule–neurofilament system generates vector vortex beams, which we can determine from the dark spots along the perimeter of a light ring. Surprisingly, the beta-spectrin–actin grid network also generates vector vortex beams. The implications of vector vortex beams are manifold. They suggest phase coupling with probabilistic relationships in the statistical ensembles of various component dynamics. Phase coupling means two distinct dynamics happening at two different time domains (say milliseconds and microseconds) would have a phase lag, adjusting the time gap more precisely.
Once we understood the elementary neural component’s optical vortices and their distinguishable character, we further deconvoluted the neuron-generated hologram using the elementary component tables of Figure 5. Here, we could only identify those few rings that perturb by selectively changing frequencies for definitive components (as shown in Figure 6A–C). Every component in a neuron structure has a specific set of resonance frequencies, and we tried all our previously reported frequencies to correlate each optical ring with a certain component. Those elements that were identified are noted in Figure 6D,E. The map is an approximation, and in the future, once the technology is more developed, we will identify more components more accurately.
In the emitted vortex assembly, we first identified three key structural components. Then, we supplied external energy to perturb the system, allowing a selective energy exchange. We had three hardware elements under consideration here that could undergo multiple modes of communication. When the neurofilament–microtubule bundle was resonated artificially from external energy input, it directly transferred the vertical projection of field vector to the beta-spectrin–actin grid as an obvious possibility. Neurofilaments have 5–15 nm diameters. They all interact with the incoming optical vortices distinctly and leave their geometric signature on the reflected vortices. Changes in the geometric shape of reflected vortices, such as an increase or decrease in diameter, were obvious. However, neurofilaments interact with microtubules that are 25 nm in diameter, and resonant interactions created a beating of signals, which act as a new neuron component. We could see the birth of a new light ring in the assembly of optical vortices, denoted with a green arrow.

3.4. Light–Matter Interaction

Therefore, while resonating those elements or hindering resonance using antennas wirelessly, we observed the vortex assembly changes. Using an antenna, we sent selective resonating signals to manipulate the light–matter interactive modes as we desired. We de-resonated or suppressed the resonating signals through the microtubule core by sending suitable frequencies through the antenna. We could see the birth of new light rings around mechanical rhythms, periodic ionic oscillations. On the other hand, when beta-spectrin–actin grids were resonated, the rings arising from the axon initial segment got new neighbor rings in the vortex assembly. Some of the rings changed in diameter. Therefore, if we perturb any component resonantly, the local components that are dielectrically coupled vibrate and give rise to new clocks. This is a fundamental property of composite materials.
The optical vortices of the membrane’s ionic conduction part do not change diameter if either grid is silent or has a microtubule core. Both the actin–spectrin grid and the microtubule core complement each other, and the change in spike rate is largely affected by inhibiting the microtubule core or actin grid. We expect that by pumping soma above the threshold at different resonant frequencies (time gap between pulses differ), we should see systematic changes in the optical vortices (Figure 6). We observed that when the core and grid are operating, but not when either of them is inactivated.
By combining two results, the quantum optics and dielectric resonance imaging, we have proposed the time-tuning mechanism shown in Figure 3C. The electromagnetic vortices move randomly along the core and store a pair of EM field rings in the actin grid. The pair moves, and ion channels in between release ions. Thus, the electric vortex passing through the membrane does not dissipate in shape and holds precise millisecond timing via microsecond vortex operators in a two-step mechanism.

4. Conclusions

Our findings explain why several-feet-long axons hold the typical shape of ionic impulse. The existence of a filamentary conduction mechanism does not prove that Hodgkin and Huxley were wrong. It simply adds a value whereby there is an advanced state-of-the-art control mechanism operating beneath the membrane. A millisecond ionic clock that fine tunes its spike time gap for human cognition and consciousness has a superior controller with a microsecond resolution regulation of time. The map of periodic oscillations of neurons has been analyzed theoretically [56,57], and we attempted to find phase correlations between different clocks. The interconnected clocks that represent our experimental findings are depicted in Figure 5. However, there is another aspect of the finding. The ordering and arrangement of clocks reveals symmetry in the information structure of a neuron. In future we would estimate how the combination accounts for the entropy and thermodynamic response of a neuron [58,59]. Optical vortex assembly is a geometric structure and by linking them with different symmetries of the neural architecture, a hardware perspective has been added to the observations of the collective signaling process in filamentary circuits [60].

Author Contributions

A.B., Conceptualization; A.B., P.S. (Pushpendra Singh), P.S. (Pathik Sahoo) and S.G., Data curation; A.B, P.S. (Pushpendra Singh) and P. S. (Pathik Sahoo), Formal analysis; P.S. (Pathik Sahoo) and K.R., Investigation; J.S.M. and K.S., Methodology; A.B., Writing—Review and editing. All authors have read and agreed to the published version of the manuscript.

Funding

The authors acknowledge the Asian Office of Aerospace R&D (AOARD), a part of the United States Air Force (USAF), for the Grant no. FA2386-16-1-0003 (2016–2019) on the electromagnetic resonance-based communication and intelligence of biomaterials.

Institutional Review Board Statement

Not applicable.

Informed Consent Statement

Not applicable.

Data Availability Statement

Not applicable.

Acknowledgments

The authors acknowledge the Asian Office of Aerospace R&D (AOARD), a part of the United States Air Force (USAF), for the Grant no. FA2386-16-1-0003 (2016–2019) on the electromagnetic resonance-based communication and intelligence of biomaterials.

Conflicts of Interest

The authors declare no conflict of interest.

References

  1. Lapicque, L. Recherches quantitatives sur l’excitation électrique des nerfs traitée comme une polarisation. J. Physiol. Pathol. Gen. 1907, 9, 620–635. [Google Scholar]
  2. Brunel, N.; Van Rossum, M.C.W. Lapicque’s 1907 paper: From frogs to integrate-and-fire. Biol. Cybern. 2007, 97, 337–339. [Google Scholar] [CrossRef]
  3. Katz, B.; Schmitt, O.H. Electric Interaction Between Two Adjacent Nerve Fibers. J. Physiol. 1940, 97, 471–488. [Google Scholar] [CrossRef] [Green Version]
  4. Baker, P.F.; Hodgkin, A.L.; Shaw, T.I. Replacement of the Protoplasm of a Giant Nerve Fibre with Artificial Solutions. Nat. Cell Biol. 1961, 190, 885–887. [Google Scholar] [CrossRef]
  5. Baker, P.F.; Hodgkin, A.L.; Shaw, T.I. Replacement of the axoplasm of giant nerve fibres with artificial solutions. J. Physiol. 1962, 164, 330–354. [Google Scholar] [CrossRef] [PubMed]
  6. Arvanitaki, A. Effects Evoked in an Axon by the Activity of a Contigious One. J. Neurophysiol. 1942, 5, 89–108. [Google Scholar] [CrossRef]
  7. Ramon, F.; Moore, J.W. Ephaptic transmission in squid giant axons. Am. J. Physiol. Physiol. 1978, 234, C162–C169. [Google Scholar] [CrossRef]
  8. Radman, T.; Su, Y.; An, J.H.; Parra, L.C.; Bikson, M. Spike Timing Amplifies the Effect of Electric Fields on Neurons: Implications for Endogenous Field Effects. J. Neurosci. 2007, 27, 3030–3036. [Google Scholar] [CrossRef] [PubMed]
  9. Ren, J.; Momose-Sato, Y.; Sato, K.; Greer, J.J. Rhythmic Neuronal Discharge in the Medulla and Spinal Cord of Fetal Rats in the Absence of Synaptic Transmission. J. Neurophysiol. 2006, 95, 527–534. [Google Scholar] [CrossRef] [Green Version]
  10. Dudek, F.E.; Yasumura, T.; Rash, J.E. ‘Non-Synaptic‘ mechanisms in seizures and epileptogenesis. Cell Biol. Int. 1998, 22, 793–805. [Google Scholar] [CrossRef] [Green Version]
  11. Alekseev, S.I.; Ziskin, M.C. Millimeter microwave effect on ion transport across lipid bilayer membranes. Bioelectromagnetics 1995, 16, 124–131. [Google Scholar] [CrossRef]
  12. Maskey, D.; Kim, M.; Aryal, B.; Pradhan, J.; Choi, I.-Y.; Park, K.-S.; Son, T.; Hong, S.-Y.; Kim, S.B.; Kim, H.G.; et al. Effect of 835 MHz radiofrequency radiation exposure on calcium binding proteins in the hippocampus of the mouse brain. Brain Res. 2010, 1313, 232–241. [Google Scholar] [CrossRef] [PubMed]
  13. Fraser, A.; Frey, A.H. Electromagnetic Emission at Micron Wavelengths from Active Nerves. Biophys. J. 1968, 8, 731–734. [Google Scholar] [CrossRef] [Green Version]
  14. Ratte, S.; Lankarany, M.; Rho, Y.A.; Patterson, A.; Prescott, S.A. Subthreshold membrane currents confer distinct tuning properties that enable neurons to encode the integral or derivative of their input. Front. Cell Neurosci. 2015, 8, 452. [Google Scholar] [CrossRef] [PubMed]
  15. Jin, L.; Han, Z.; Platisa, J.; Wooltorton, J.R.; Cohen, L.B.; Pieribone, V.A. Single Action Potentials and Subthreshold Electrical Events Imaged in Neurons with a Fluorescent Protein Voltage Probe. Neuron 2012, 75, 779–785. [Google Scholar] [CrossRef] [Green Version]
  16. Duke, A.R.; Jenkins, M.W.; Lu, H.; McManus, J.M.; Chiel, H.J.; Jansen, E.D. Transient and selective suppression of neural activity with infrared light. Sci. Rep. 2013, 3, srep02600. [Google Scholar] [CrossRef] [Green Version]
  17. Howarth, J.V.; Keynes, R.D.; Ritchie, J.M.; Von Muralt, A. The heat production associated with the passage of a single impulse in pike olfactory nerve fibres. J. Physiol. 1975, 249, 349–368. [Google Scholar] [CrossRef]
  18. Westerfield, M.; Joyner, R.W.; Moore, J.W. Temperature-sensitive conduction failure at axon branch points. J. Neurophysiol. 1978, 41, 1–8. [Google Scholar] [CrossRef] [Green Version]
  19. Abbott, B.C.; Hill, A.V.; Howarth, J.V. The positive and negative heat production associated with a nerve impulse. Proc. R. Soc. London. Ser. B Boil. Sci. 1958, 148, 149–187. [Google Scholar] [CrossRef]
  20. Buzatu, S. The temperature-induced changes in membrane potential. Riv. Boil. 2010, 102, 199–217. [Google Scholar]
  21. Maheswari, U.; Tatsumi, H.; Katayama, Y.; Ohtsua, M. Observation of subcellular nanostructure of single neurons with an illumination mode photon scanning tunneling microscope. Opt. Commun. 1995, 120, 325–334. [Google Scholar] [CrossRef]
  22. Hirokawa, N. From electron microscopy to molecular cell biology, molecular genetics and structural biology: Intracellular transport and kinesin superfamily proteins, KIFs: Genes, structure, dynamics and functions. Microscopy 2011, 60, S63–S92. [Google Scholar] [CrossRef] [PubMed]
  23. Hirokawa, N.; Pfister, K.; Yorifuji, H.; Wagner, M.C.; Brady, S.T.; Bloom, G.S. Submolecular domains of bovine brain kinesin identified by electron microscopy and monoclonal antibody decoration. Cell 1989, 56, 867–878. [Google Scholar] [CrossRef]
  24. Hirokawa, N.; Shiomura, Y.; Okabe, S. Tau proteins: The molecular structure and mode of binding on microtubules. J. Cell Biol. 1988, 107, 1449–1459. [Google Scholar] [CrossRef]
  25. Chen, J.; Kanai, Y.; Cowan, N.J.; Hirokawa, N. Projection domains of MAP2 and tau determine spacings between microtubules in dendrites and axons. Nat. Cell Biol. 1992, 360, 674–677. [Google Scholar] [CrossRef] [PubMed]
  26. Stone, M.C.; Roegiers, F.; Rolls, M.M. Microtubules Have Opposite Orientation in Axons and Dendrites of Drosophila Neurons. Mol. Biol. Cell 2008, 19, 4122–4129. [Google Scholar] [CrossRef] [PubMed] [Green Version]
  27. Heidemann, S.R.; Landers, J.M.; A Hamborg, M. Polarity orientation of axonal microtubules. J. Cell Biol. 1981, 91, 661–665. [Google Scholar] [CrossRef]
  28. Heidemann, S.R.; A Hamborg, M.; Thomas, S.J.; Song, B.; Lindley, S.; Chu, D. Spatial organization of axonal microtubules. J. Cell Biol. 1984, 99, 1289–1295. [Google Scholar] [CrossRef] [PubMed] [Green Version]
  29. Baas, P.W.; Deitch, J.S.; Black, M.M.; Banker, G.A. Polarity orientation of microtubules in hippocampal neurons: Uniformity in the axon and nonuniformity in the dendrite. Proc. Natl. Acad. Sci. USA 1988, 85, 8335–8339. [Google Scholar] [CrossRef] [Green Version]
  30. Xu, K.; Zhong, G.; Zhuang, X. Actin, spectrin and associated proteins form a periodic cytoskeleton structure in axons. Science 2013, 339, 452–456. [Google Scholar] [CrossRef] [Green Version]
  31. He, J.; Zhou, R.; Heller, E.; Freeman, M.R.; Shen, K.; Maniatis, T.; Tessier-Lavigne, M.; Zhuang, X.; Wu, Z.; Carrasco, M.A.; et al. Prevalent presence of periodic actin–spectrin-based membrane skeleton in a broad range of neuronal cell types and animal species. Proc. Natl. Acad. Sci. USA 2016, 113, 6029–6034. [Google Scholar] [CrossRef] [PubMed] [Green Version]
  32. D’Este, E.; Kamin, D.; Velte, C.; Göttfert, F.; Simons, M.; Hell, S.W. Subcortical cytoskeleton periodicity throughout the nervous system. Sci. Rep. 2016, 6, 22741. [Google Scholar] [CrossRef] [PubMed] [Green Version]
  33. Gervasi, M.G.; Xu, X.; Carbajal-Gonzalez, B.; Buffone, M.G.; Visconti, P.E.; Krapf, D. The actin cytoskeleton of the mouse sperm flagellum is organizedin a helical structure. J. Cell Sci. 2018, 131, jcs215897. [Google Scholar] [CrossRef] [Green Version]
  34. D’Este, E.; Kamin, D.; Göttfert, F.; El-Hady, A.; Hell, S.W. STED Nanoscopy Reveals the Ubiquity of Subcortical Cytoskeleton Periodicity in Living Neurons. Cell Rep. 2015, 10, 1246–1251. [Google Scholar] [CrossRef] [PubMed] [Green Version]
  35. Seidl, A.H.; Rubel, E.W.; Harris, D.M. Mechanisms for Adjusting Interaural Time Differences to Achieve Binaural Coincidence Detection. J. Neurosci. 2010, 30, 70–80. [Google Scholar] [CrossRef] [PubMed] [Green Version]
  36. Lundstrom, B.N.; Famulare, M.; Sorensen, L.B.; Spain, W.J.; Fairhall, A.L. Sensitivity of firing rate to input fluctuations depends on time scale separation between fast and slow variables in single neurons. J. Comput. Neurosci. 2009, 27, 277–290. [Google Scholar] [CrossRef]
  37. Usher, M.; Stemmler, M.; Koch, C.; Olami, Z. Network Amplification of Local Fluctuations Causes High Spike Rate Variability, Fractal Firing Patterns and Oscillatory Local Field Potentials. Neural Comput. 1994, 6, 795–836. [Google Scholar] [CrossRef] [Green Version]
  38. Ghosh, S.; Sahu, S.; Agrawal, L.; Shiga, T.; Bandyopadhyay, A. Inventing a co-axial atomic resolution patch clamp to study a single resonating protein complex and ultra-low power communication deep inside a living neuron cell. J. Integr. Neurosci. 2016, 15, 1–31. [Google Scholar] [CrossRef]
  39. Agrawal, L.; Sahu, S.; Ghosh, S.; Shiga, T.; Fujita, D.; Bandyopadhyay, A. Inventing atomic resolution scanning dielectric microscopy to see a single protein complex operation live at resonance in a neuron without touching or adulterating the cell. J. Integr. Neurosci. 2016, 15, 435–462. [Google Scholar] [CrossRef]
  40. Singh, P.; Ghosh, S.; Sahoo, P.; Ray, K.; Fujita, D.; Bandyopadhyay, A. Reducing the Dimension of a Patch-Clamp to the Smallest Phyisical Limit using a Coaxial Atom Probe. Prog. Electromagn. Res. B 2020, 89, 29–44. [Google Scholar] [CrossRef]
  41. Saxena, K.; Singh, P.; Sahoo, P.; Sahu, S.; Ghosh, S.; Ray, K.; Fujita, D.; Bandyopadhyay, A. Fractal, Scale Free Electromagnetic Resonance of a Single Brain Extracted Microtubule Nanowire, a Single Tubulin Protein and a Single Neuron. Fractal Fract. 2020, 4, 11. [Google Scholar] [CrossRef] [Green Version]
  42. Amari, S. Topographic organization of nerve fields. Bull. Math. Biol. 1980, 42, 339–364. [Google Scholar] [CrossRef]
  43. Giustia, C.; Pastalkovac, E.; Curto, C.; Itskov, V. Clique topology reveals intrinsic geometric structure in neural correlations. Proc. Natl. Acad. Sci. USA 2015, 112, 13455–13460. [Google Scholar] [CrossRef] [PubMed] [Green Version]
  44. Best, E.N. Null Space and Phrase Resetting Curves for the Hodgkin-Huxley Equations. Ph.D. Thesis, Purdue University, West Lafayette, IN, USA, 1976. [Google Scholar]
  45. Guckenheimer, J.; Labouriau, J.S.; Labouriau, I. Bifurcation of the Hodgkin and Huxley equations: A new twist. Bull. Math. Biol. 1993, 55, 937–952. [Google Scholar] [CrossRef]
  46. Sardi, S.; Vardi, R.; Sheinin, A.; Goldental, A.; Kanter, I. New Types of Experiments Reveal that a Neuron Functions as Multiple Independent Threshold Units. Sci. Rep. 2017, 7, 1–17. [Google Scholar] [CrossRef] [Green Version]
  47. McCormick, D.A.; Shu, Y.; Yu, Y. Neurophysiology: Hodgkin and Huxley model–still standing? Nature 2007, 445, E1–E2. [Google Scholar] [CrossRef] [PubMed]
  48. Pethig, R. Dielectric and Electronic Properties of Biological Materials; Wiley: New York, NY, USA, 1979; p. 139. [Google Scholar]
  49. Asami, K. The scanning dielectric microscope. Meas. Sci. Technol. 1994, 5, 589–592. [Google Scholar] [CrossRef] [Green Version]
  50. Nixon, R.A.; Shea, T.B. Dynamics of neuronal intermediate filaments: A developmental perspective. Cell Motil. Cytoskelet. 1992, 22, 81–91. [Google Scholar] [CrossRef]
  51. Zhong, G.; He, J.; Zhou, R.; Lorenzo, D.; Babcock, H.P.; Bennett, V.; Zhuang, X. Developmental mechanism of the periodic membrane skeleton in axons. eLife 2014, 3, 04581. [Google Scholar] [CrossRef]
  52. Qiu, C.; Shivacharan, R.S.; Zhang, M.; Durand, D.M. Can Neural Activity Propagate by Endogenous Electrical Field? J. Neurosci. 2015, 35, 15800–15811. [Google Scholar] [CrossRef] [PubMed]
  53. Zaromytidou, A.-I. Synchronizing actin and microtubules for axonal branching. Nat. Cell Biol. 2012, 14, 792. [Google Scholar] [CrossRef]
  54. Schubert, T.; Akopian, A. Actin filaments regulate voltage-gated ion channels in salamander retinal ganglion cells. Neuroscience 2004, 125, 583–590. [Google Scholar] [CrossRef]
  55. Vollmer, F.; Braun, D.; Libchaber, A.J.; Khoshsima, M.; Teraoka, I.; Arnold, S. Protein detection by optical shift of a resonant microcavity. Appl. Phys. Lett. 2002, 80, 4057–4059. [Google Scholar] [CrossRef]
  56. Singh, P.; Saxena, K.; Singhania, A.; Sahoo, P.; Ghosh, S.; Chhajed, R.; Ray, K.; Fujita, D.; Bandyopadhyay, A. A Self-Operating Time Crystal Model of the Human Brain: Can We Replace Entire Brain Hardware with a 3D Fractal Architecture of Clocks Alone? Information 2020, 11, 238. [Google Scholar] [CrossRef]
  57. Bandyopadhyay, A. Nanobrain: The Making of an Artificial Brain from a Time Crystal; Taylor & Francis Inc. Imprint CRC Press Inc.: Boca Raton, FL, USA, 2020; pp. 1–336. [Google Scholar]
  58. Andersen, S.S.L.; Jackson, A.D.; Heimburg, T. Towards a thermodynamic theory of nerve pulse propagation. Prog. Neurobiol. 2009, 88, 104–113. [Google Scholar] [CrossRef] [PubMed]
  59. Hasenstaub, A.; Otte, S.; Callaway, E.; Sejnowski, T.J. Metabolic cost as a unifying principle governing neuronal biophysics. Proc. Natl. Acad. Sci. USA 2010, 107, 12329–12334. [Google Scholar] [CrossRef] [Green Version]
  60. Singh, P.; Saxena, K.; Sahoo, P.; Ghosh, S.; Bandyopadhyay, A. Electrophysiology using coaxial atom probe array: Live imaging reveals hidden circuits of a hippocampal neural network. J. Neurophysiol. 2021. [Google Scholar] [CrossRef]
Figure 1. (A) More than a century-old model for neuron signal transmission is shown using a snapshot. (B) Our model for filamentary (EM) communication modes complementary to the ionic communication mode. In six steps, left to right, distinct features of the electromagnetic communication modes are shown. (C) Experimental setup, schematic for dielectric resonance imaging of a neuron membrane and its internal structures. Coaxial atom probe (Au-glass-Pt system) is used as three distinct signal sensors operating simultaneously. Au captures membrane signal (Δ2), Pt core is used for a lock-in or filtering/amplifying the signal from the microtubule–neurofilament core deep inside the axonal or dendritic branches (Δ1). Phase-locked-loop (PPL) differential amplifier captures signal from the beta-spectrin–actin rectangular grid (Δ3). Diff. Amp. = differential amplifier, Inv Micro = inverted microscope, Piezo = piezo resonator. (D) Scanning tunneling microscope-based dielectric resonance scanner. (E) Fully homemade dielectric resonance scanner (frequency range works between kHz to 178 GHz).
Symmetry 13 00821 g001
Figure 2. (A) Microscopic image of a single rat hippocampal neuron, 8–10 days old in cultured media, scale bar, is 1.5μm (first from left). The axon initial segment (AIS) is zoomed and three dielectric resonance images (S21(x,y)) of the membrane (S21(1 Hz–10 kHz, scale bar 200 nm), actin-spectrin layer (10 kHz to 100 kHz, scale bar 150 nm) are shown. The neurofilament, microtubule layer (1 MHz–200 MHz, scale bar 100 nm) is shown in the center (B). The dielectric resonator architecture of membrane, actin–spectrin layer, and neurofilament, microtubule layer in the center are shown in an integrated structure. This structure, created in CST is used for solving Maxwell’s equations, wherein the used materials’ dielectric constants were set as experimentally derived (membrane’s lipid bi-layer, 3.5D; actin–beta-spectrin layer, 7.6D; microtubule-neurofilament bundle, 13.2D, D = Debye). The dimensions and widths of the structure were kept similar to the biological structure. Membrane 6 nm, actin–beta-spectrin-adducin layer 3.5 nm, neurofilament-microtubule layer 200 nm. (C) The axon structure is theoretically designed in the CST simulator (CST, computer simulation technology is a 3D EM analysis software for the design, analysis, and optimization of electromagnetic systems and components), as revealed in the extreme right panel of panel C. Electric and magnetic fields generated in the structure at resonance are plotted, which represent wave-like interference. Simulation details: selected solver: time domain; simulation frequency range: 0–10 THz; boundary condition: open space; applied energy source dimension: 35 µm × 35 µm.
Symmetry 13 00821 g002
Figure 3. (A) Experimental setup for combined patch-clamp and our coaxial probe measurement on a cultured plate. The patch clamp’s glass-tube is supplied with buffer salt solution to maintain the pressure of the membrane-glass patch. The atomic resolution tip is connected to a GHz amplifier for instant signal amplification. Patch clamps only sense ion flows that resonate ~1 ms, read only one piece of data, and cannot sense anything below 50–100 nm. In contrast, our recently invented coaxial atom probe senses several time domains at a time, even below 0.5 nm. Its cavity is between a Pt metal needle and an Au metal cylinder and traps (10−20 watt) vibrations in its vicinity, the cavity’s conical geometry amplifies that signal. The embedded dielectric resonator (glass) increases Q factor (~105) at all frequencies that its conical geometry allows (3 kHz to 40 GHz. Probe geometry needs to be changed for different frequency range). Unlike the patch-clamp, an atom probe reads four signals simultaneously, filters the noise, measures four distinct vibrations of protein complexes, noise-free (S/N~105), deep inside a neuron. (B) Experimental setup for simultaneous microwave-radio wave combination with quantum optics. Monochromatic laser (633.5 nm) passes through vortex lens to generate optical vortex, that is shone on the axon region. A semiconductor camera images the reflected or transmitted vortex assembly. (C) The schematic of three dynamic model controls for precise ionic firing time. (D) Two panels show that at the first step, beta-spectrin-actin Ring 1, Ring 2 are active, ions release in the circular pathway between them. Then Ring 1 switches off, Ring 2 and Ring 3 are active. Ion channels in between them are activated for ion release.
Symmetry 13 00821 g003
Figure 4. (a) Schematic experimental setup of generating vortex assembly side by side from different components of a neuron. Here, polarized laser light (632 nm) passes through a beam splitter (BS1, HP 10701A Beam Splitter), beam benders, and used to see the vortex (VL) image (with and without sample); inset shows an optical vortex. (b) Optical vortices generated by the system, current results belong to microtubule-neurofilament core, beta-spectrin–actin layer and finally the membrane layer when a neuron is triggered by 1 to 10 GHz frequency, using a function generator.
Symmetry 13 00821 g004
Figure 5. Optical vortices generated by four neuron components, membrane (control experiment, where filaments are all dissolved), microtubule and neurofilament composition (control experiment by removing neuron membrane), beta-spectrin–actin composition in solution and tubulin protein solution. Along the row, four different experiments for four different batches of materials are demonstrated. At various frequencies, the membrane mechanically vibrates with the passing of polarized laser light through the solution, so we see differences in the repeated measurements. However, noisy peaks are temporary, they appear momentarily and disappear, therefore, do not affect deconvolution as shown Figure 6.
Symmetry 13 00821 g005
Figure 6. Panels (AC) show optical vortex output under thermal noise at 37 °C with no electromagnetic signal by the antenna (Panel (A)), actin–beta-spectrin resonated (10 kHz to 100 kHz; Panel (B)) and microtubule–neurofilament resonated (1 MHz–200 MHz, Panel (C)). Below each panel, we demonstrate the simple circular presentation with arrowed changes. Green arrows of panel B depict the addition of new clocks in the assembly of panel A. The green arrows of panel C show changes in clock diameters as actin–beta-spectrin layer are resonated. (D,E) These two panels attempt to identify two distinct regions of vortex assembly as indicated by arrows. Clocks are identified by perturbing particular regions by modulating the antenna frequency as obtained from CST-based theoretical studies.
Symmetry 13 00821 g006
Publisher’s Note: MDPI stays neutral with regard to jurisdictional claims in published maps and institutional affiliations.

