1. Introduction
The most traditional and standard method that we know of to authenticate ourselves in a system or computer is the use of user names and alphanumeric passwords. It happens that, practically, this method has been proven to be insecure [
1]. Its insecurity is mainly due to the human factor, since users tend to use passwords that are easy to guess, leave the password in writing, in case it is a difficult one to remember, or use the same password for multiple authentication systems. This is why an important alternative to alphanumeric passwords today is graphical passwords. This is mainly due to the well-documented fact that humans are more adept at remembering images than text [
2,
3]. That is why graphical authentication systems base their security on the user recognizing images, or parts of them, instead of remembering long and complex sequences of characters. Among the Graphical Authentication techniques, the Passpoint [
4,
5,
6] has received particular attention.
The Passpoint technique requires the user to select as their graphical password a set of five points (pixels) on an image in the so-called registration phase. Every time the user wants to authenticate, they must select five points in a neighborhood of the five points selected as his password during the registration phase [
5,
6]. For these graphical passwords to be considered secure, they must follow a random pattern; otherwise, they can be obtained by an attacker because they are weak passwords [
1,
3,
7,
8]. For this reason, it is necessary to have a tool capable of alerting the user about a possible graphic password with insufficient randomness during the registration phase, thus increasing the password’s security, and therefore, of the system.
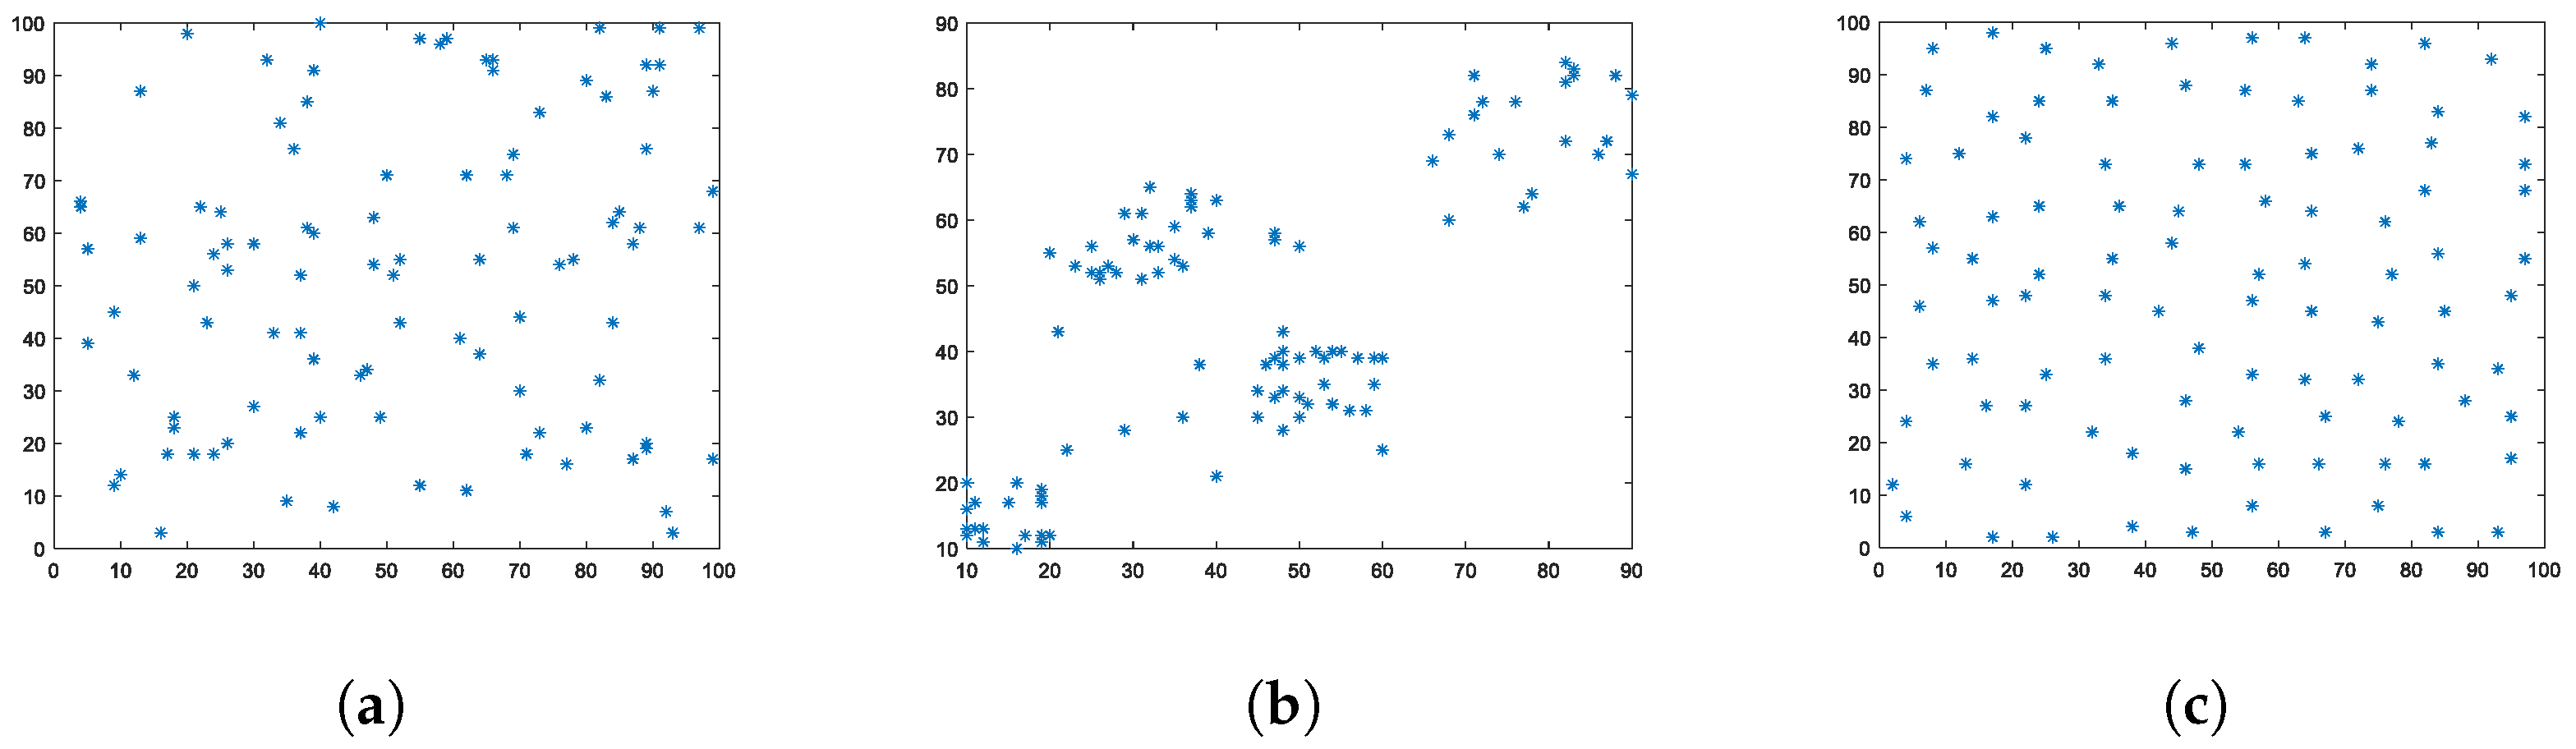
Said graphical passwords can be interpreted as a point spatial pattern [
9,
10,
11,
12,
13,
14,
15] of five points studied by the various techniques of the theory of spatial randomness to determine their behavior. Precisely, two of the tests mostly used in this area to verify spatial randomness are the Ripley’s K function test [
9,
11,
13,
16,
17,
18,
19,
20,
21,
22], and the test of the distance to the nearest neighbor [
9,
10,
11,
17], which were tested in [
23] to measure their effectiveness in detecting clustered graphical passwords in the Passpoint scenario. Within it, they concluded that both tests were not effective in detecting the clustered five-point patterns, but they did not conclude anything about the effectiveness of these tests in detecting regular five-point patterns; therefore, it was not possible to conclude whether these tests are not generally effective in detecting non-random five-point patterns. The experiments carried out in [
23] were extended in this article to regular graphical passwords, and the effectiveness of a third test, the empty space function test, in detecting non-random passwords, was also analyzed. The experiments carried out in this article show that such tests are not effective in detecting non-random graphical passwords. Therefore, as the main result of this article, a new test was proposed based on the mean distance between the points of a graphical password that detects non-random graphical passwords with good precision.
Generative adversarial networks (GANs) [
24] have recently been used to assess the strength of alphanumeric passwords and improve attacks against them. This technology appears to be another promising option for evaluating the strength of graphical passwords as well.
The proposed test can be applied to any Cued-Recall system that uses five points of an image as a graphic password. We also consider that it can be extendable to cases where the amount is greater than but close to 5, although the experiments that demonstrate it are pending.
In [
25], five forms of symmetrical patterns were identified that tend to follow the passwords chosen by users: line shape, W shape, Z, V, or C. Approximately only
of graphical passwords chosen by users do not follow one of these forms.
This work experimentally demonstrates the ineffectiveness of Ripley’s K function, the nearest neighbor technique, and the empty space F-function, which are three of the tests most used in the theory of spatial point patterns, in the Graphical Authentication scenario with Passpoint to validate whether a graphical password belongs to a random pattern. For this, two experiments were carried out to detect clustered patterns, and the other for regular patterns. The results obtained show that, in this scenario, both Ripley’s K function test and the distance to the nearest neighbor were not effective in detecting clustering and it was theoretically demonstrated that they were incapable of detecting regularity; the space function test is theoretically shown to be unable to detect clustering and it is totally ineffective in detecting regular patterns. The results obtained were attributed to the small sample (only five points); the tests cannot differentiate between groups of five clustered, regular and random points. Consequently, a test based on the mean distance between the points of a password capable of efficiently detecting non-random graphical passwords was proposed. The experiments were carried out taking as reference dimensions of images of 1080, and , since they are the most common sizes in personal computers and smartphones. However, the experiments can be extended to other dimensions of images obtaining similar results. All the point patterns and experiments were generated in MATLAB R2018a, using a PC Laptop with an Intel (R) Pentium (R) processor, CPU N5000@1.10GHz (2 CPUs), ∼1.6 GHz and 4 GB of RAM.
The work in this article is structured as five sections:
Section 1 presents the introduction, then
Section 2 is composed of spatial point patterns, Ripley’s
K function,
G function, nearest neighbor distance and
F function, empty space distance.
Section 3 shows the evaluation of the classic tests most used in CSR in the Passpoint scenario; and
Section 4 shows our main contribution: the test for the detection of weak graphical passwords in Passpoint based on the mean distance between points. Finally,
Section 5 presents the conclusions.
3. Evaluation of the Classic Tests Most Used in CSR in the Passpoint Scenario
In these CSR tests, as the number
n of pattern points decreases, the power of the test also decreases, and its ability to discern between different patterns is lost [
29,
30]—but what is the minimum value of
n for these three tests to be considered accurate? We have not found this datum in the literature consulted. In [
31], Ripley’s K test and the nearest neighbor distance test were applied to a 22-point pattern, the smallest pattern we have as a reference for which both tests are applied; however, they did not conclude the result of said experiment or whether any of the tests were effective or not. In [
31], they also experimented with a 36-point pattern for which they concluded that both tests were effective. So what will happen in the Passpoint scenario where patterns with only five points are available?
This question was given an initial answer in [
23], but only for clustered patterns and only for Ripley’s K and nearest neighbor tests, resulting in these tests not being effective in detecting graphical passwords clustered in Passpoint. This section expands the experiments carried out in [
23] for a third CSR test, the empty space function F test, and also analyzes the detection of regular 5-point patterns by these three tests, thus allowing to conclude whether or not these tests are capable of detecting non-random patterns in a general way. Unlike [
23], the experiments in this section were performed for 199 Monte Carlo simulations which guarantees, according to [
9], a significance level of
.
3.1. Design of Experiments
To analyze the detection of non-random patterns in this section, two experiments were designed:
Experiment 1: To measure clustering, the three tests were applied to two databases, DB.1.1 and DB.1.2, of clustered graphic passwords. Said passwords were generated following a Poisson aggregate process with radius of 686 u and 315 u, respectively; therefore, they approximately delimited a maximum area equivalent to one fourth and eighth parts, respectively, of a rectangle of dimensions . We will refer to these databases as the first level of clustering and third level of clustering, respectively (the second level of clustering will be introduced in later experiments).
Experiment 2: For the second experiment, the three tests were applied to the
pattern, with:
being the pattern that expresses the maximum possible regularity for five points in the rectangle in question.
For each of the tests, the critical values were estimated using 199 Monte Carlo simulations of sets of five random points on a rectangle of size
; in addition to Ripley’s K function, the confidence intervals were estimated according to the approximation Ripley’s
, where
and
. These Monte Carlo simulations guarantee critical intervals with a significance level
for each test [
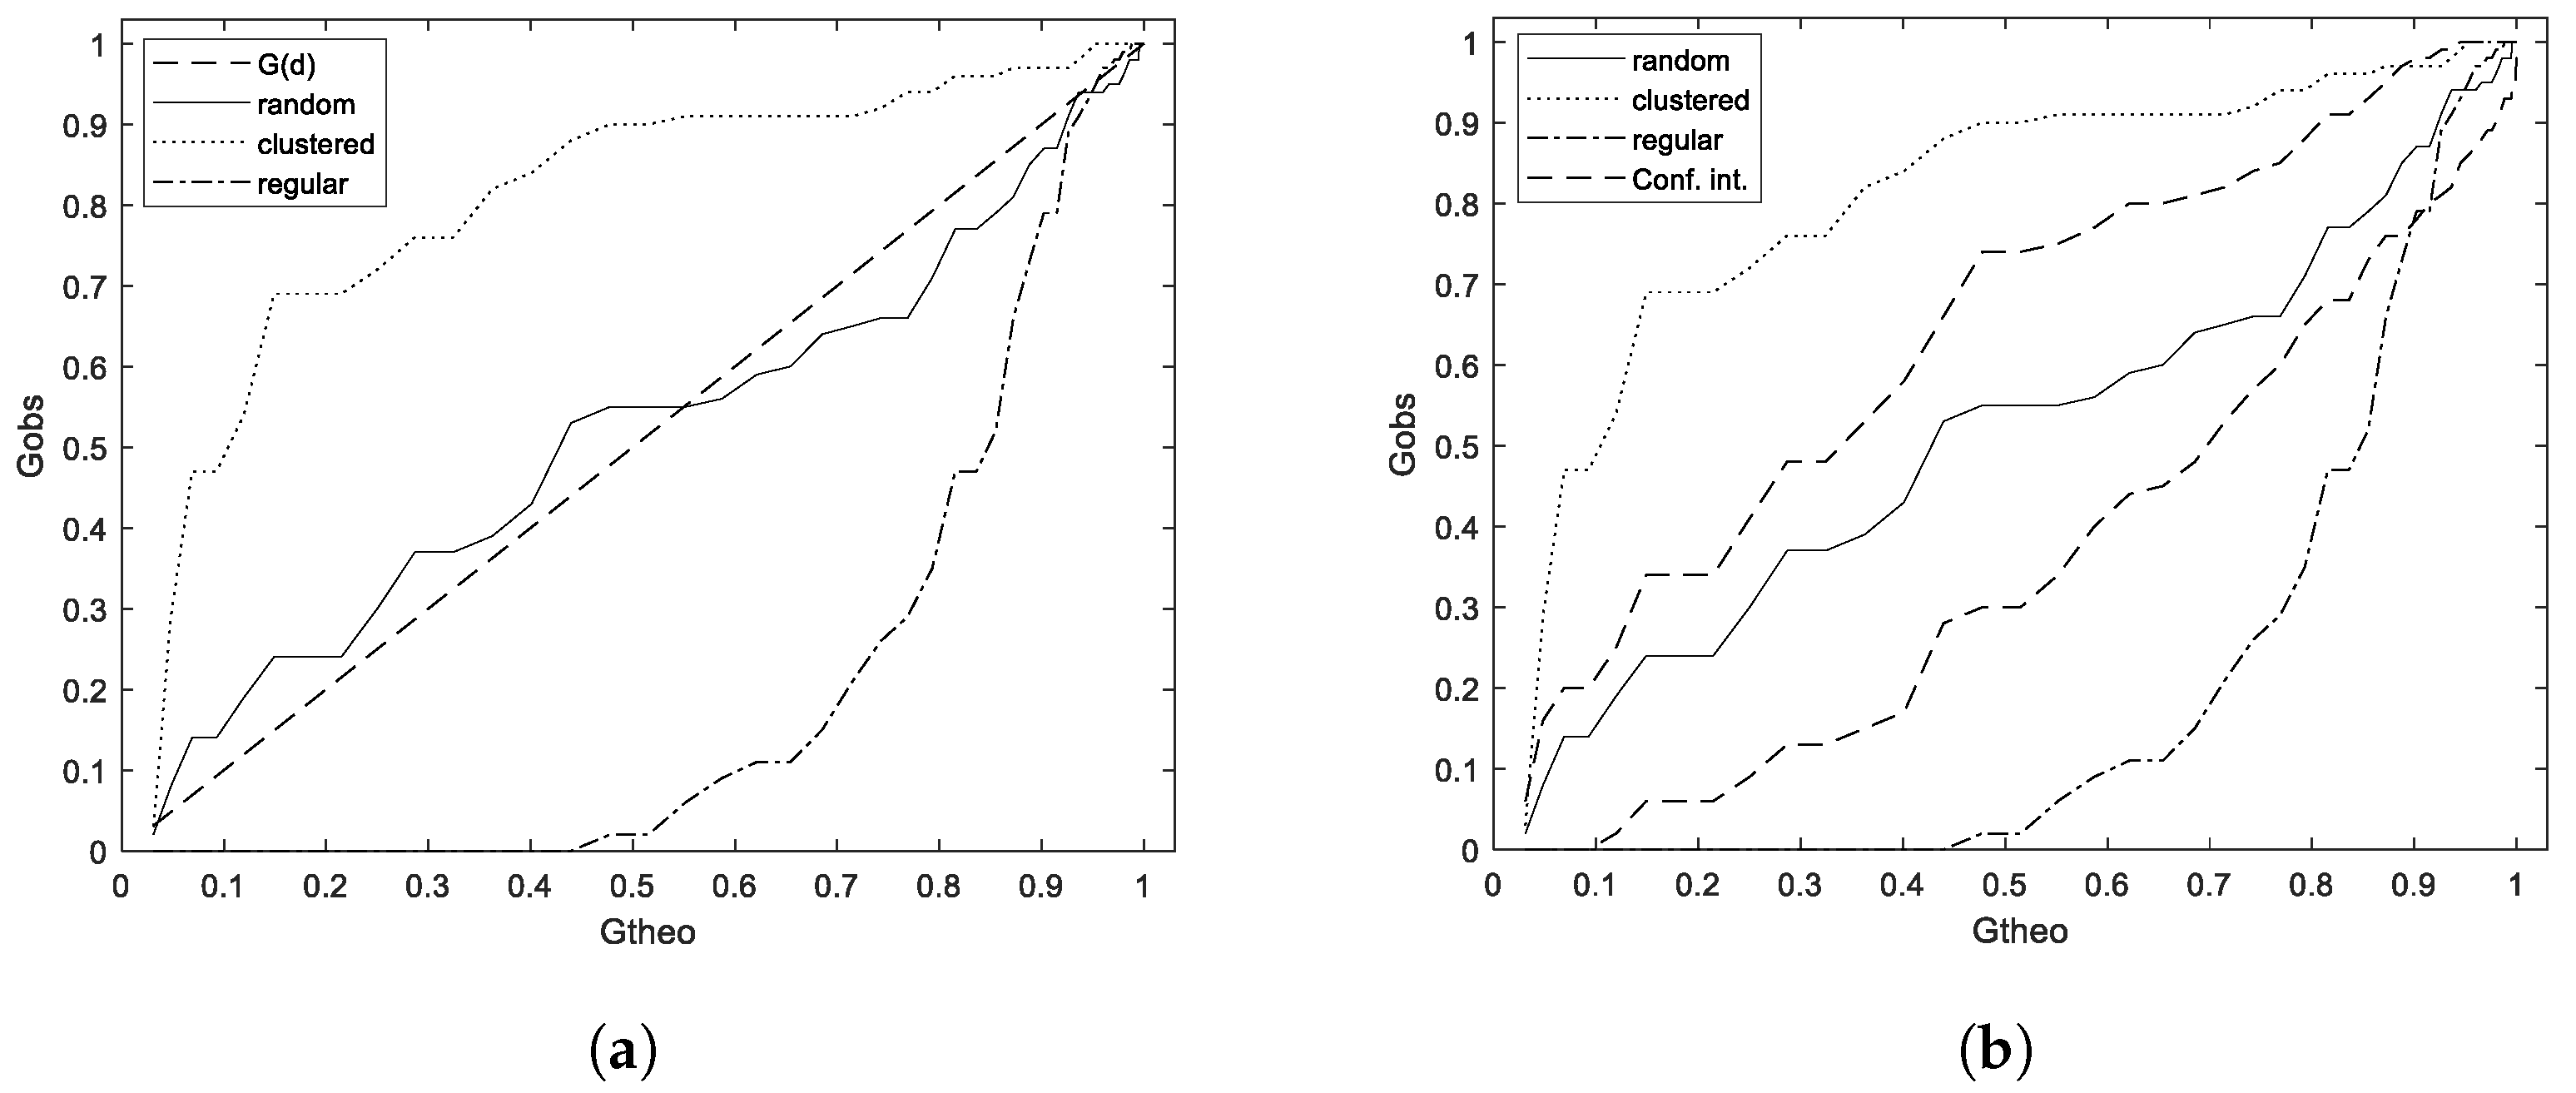
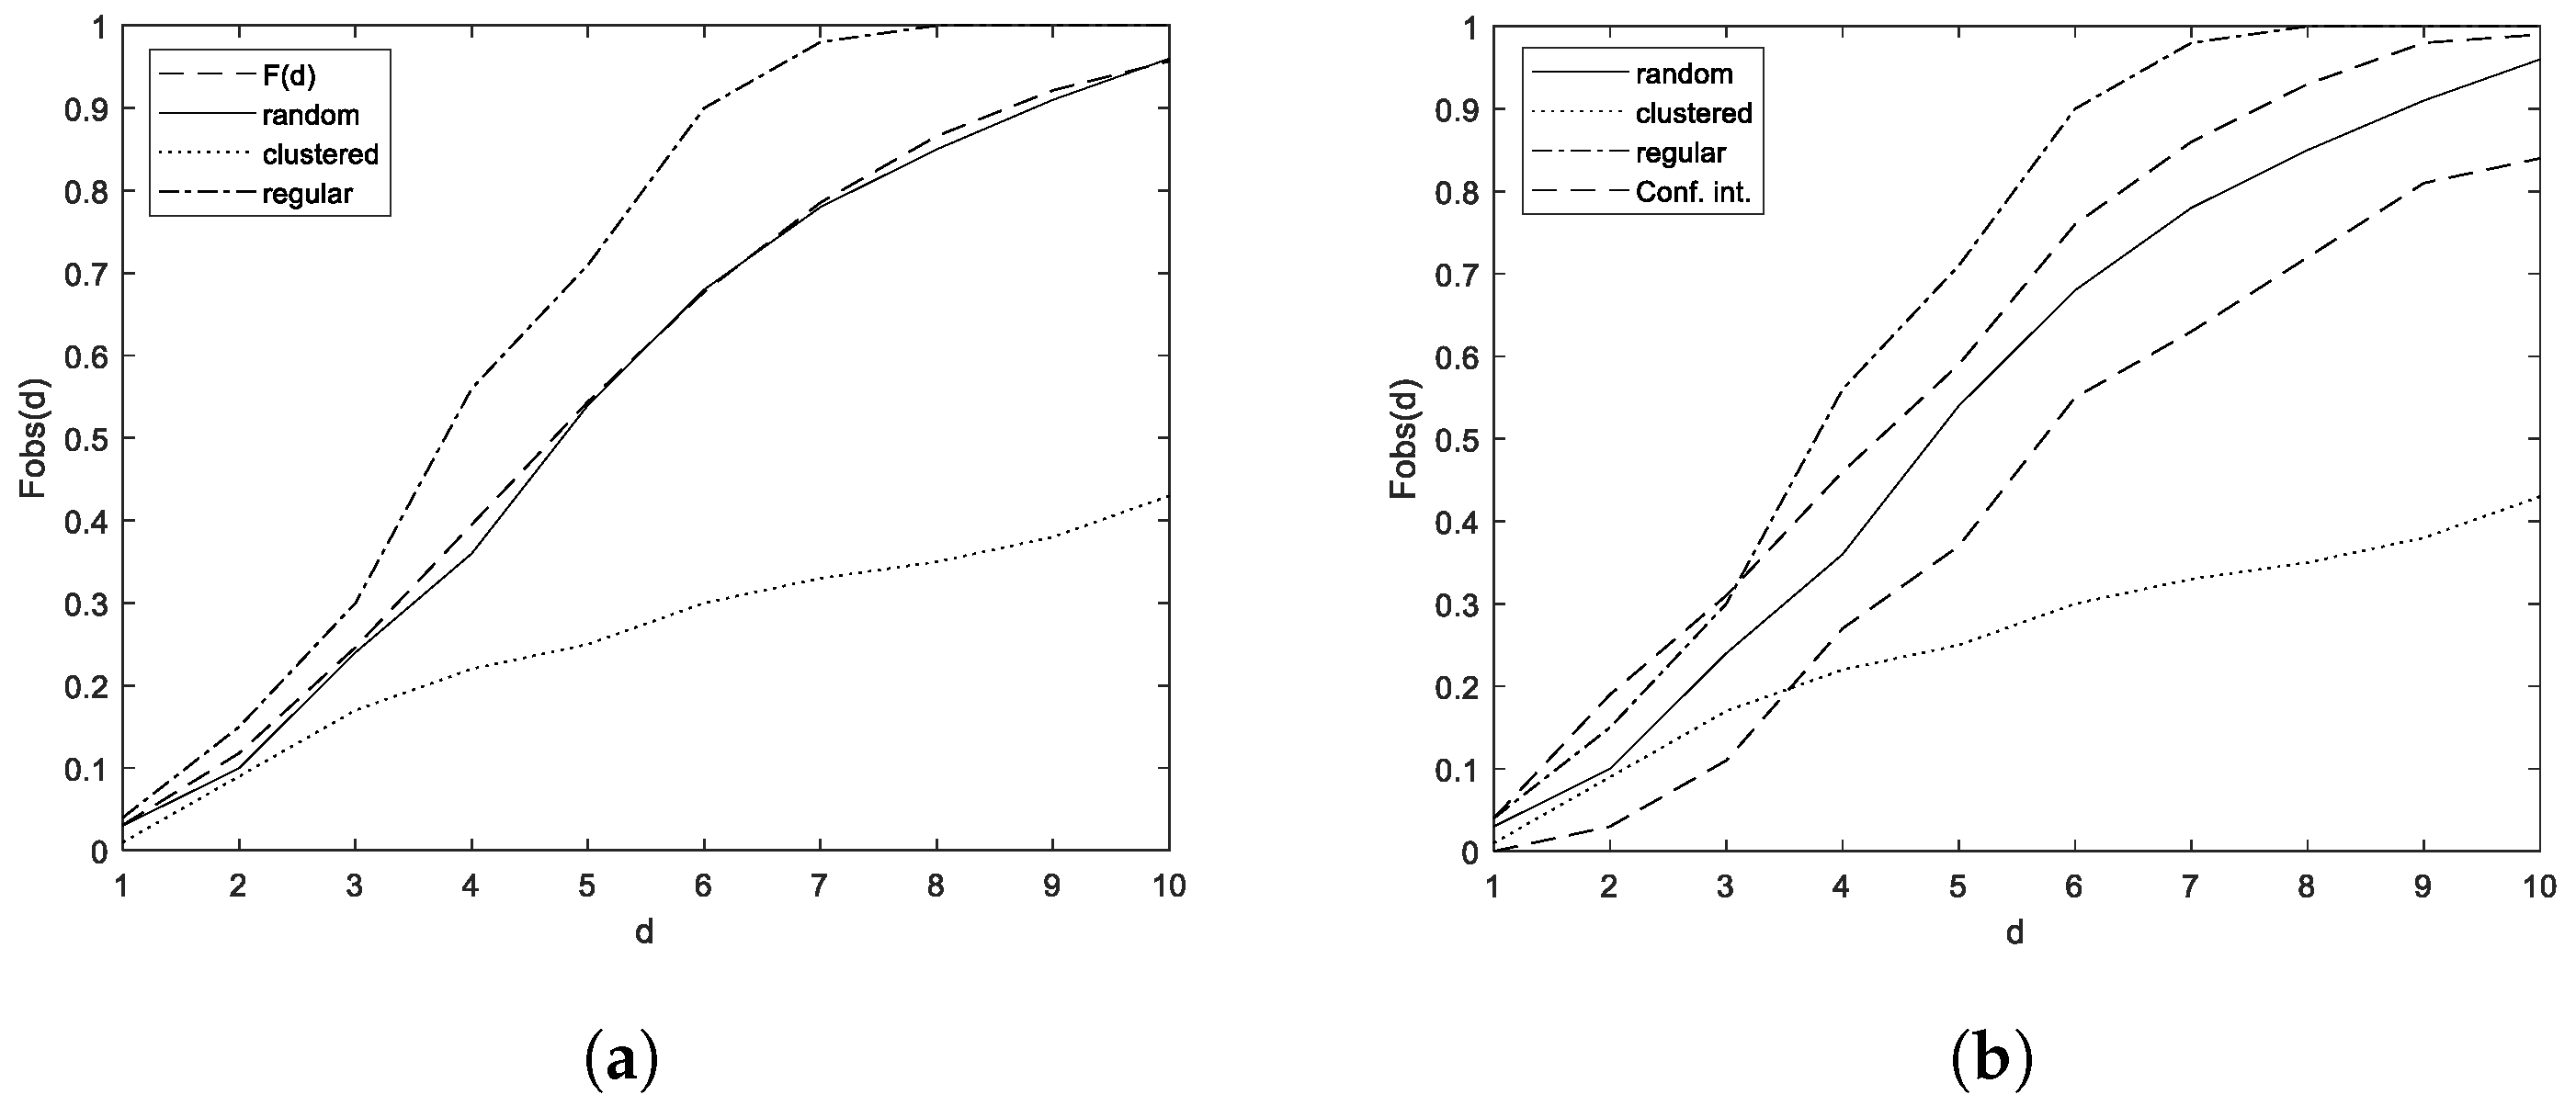
9], and can be seen in
Figure 5, where the solid line represents the theoretical value of the null hypothesis, the dashed lines represent the critical values of each of the tests in 199 random pattern simulations, in the case of Ripley’s K function, the dotted lines represent the confidence intervals for
of the test according to Ripley’s approximation.
From the estimated critical values, the immediate conclusion that was obtained is that Ripley’s K function and the nearest neighbor tests are not effective in detecting regular patterns, and the empty space function test is not effective in detecting clustered patterns.
3.2. Results
3.2.1. Ripley’s K Test Effectiveness
Ripley’s K function test applied to DB.1.1 shows that only 531 of the 10,000 sets exceeded the critical values estimated for the Monte Carlo simulation test, which represent of all the cases analyzed and only 25 of these sets of five points are above the confidence interval estimated by the Ripley approximation, which represent of the cases analyzed. For the DB.1.2 of the 10,000 sets of points with second-level clustering, 2655 of them exceeded the critical values obtained by the Monte Carlo simulation for the test, which represents of the total of cases analyzed; and 262 reported values of Ripley’s K function as more significant than the confidence intervals estimated by the Ripley approximation, which represents of the cases analyzed.
From the expression of the function , it is evident that its minimum possible value is : this minimum value coincides with the critical values estimated by Monte Carlo simulations, therefore, it is impossible that this test detects a pattern as regular since a pattern is considered regular if it is below the critical values estimated by the test.
3.2.2. Nearest Neighbor Test Effectiveness
The results obtained by the distance to the nearest neighbor test for DB.1.1 show that only 188 of the 10,000 sets of five points with first-level clustering exceeded the critical values estimated for the test by Monte Carlo simulation, which represent of all cases. In the experiment with the 10,000 sets of five points with second-level clustering of DB.1.2, only 890 sets exceeded the critical values obtained by Monte Carlo simulation, which represent of the cases analyzed. The function fulfills that , and the lower critical interval estimated for this test is , and therefore, this test will not be able to detect clustered patterns either.
3.2.3. Effectiveness of the Empty Space Distance Test
Like the function, the minimum value that the function can take is 0. This minimum value coincides with the lower critical values estimated by Monte Carlo simulations; therefore, this test cannot detect clustered patterns. Of the 10,000 iterations of the test of function F for the pattern , which expresses the greatest possible regularity between 5 points in a rectangle, it turns out that none of them detect said pattern as regular.
3.3. Discussion of the Results
3.3.1. Clustering Detection
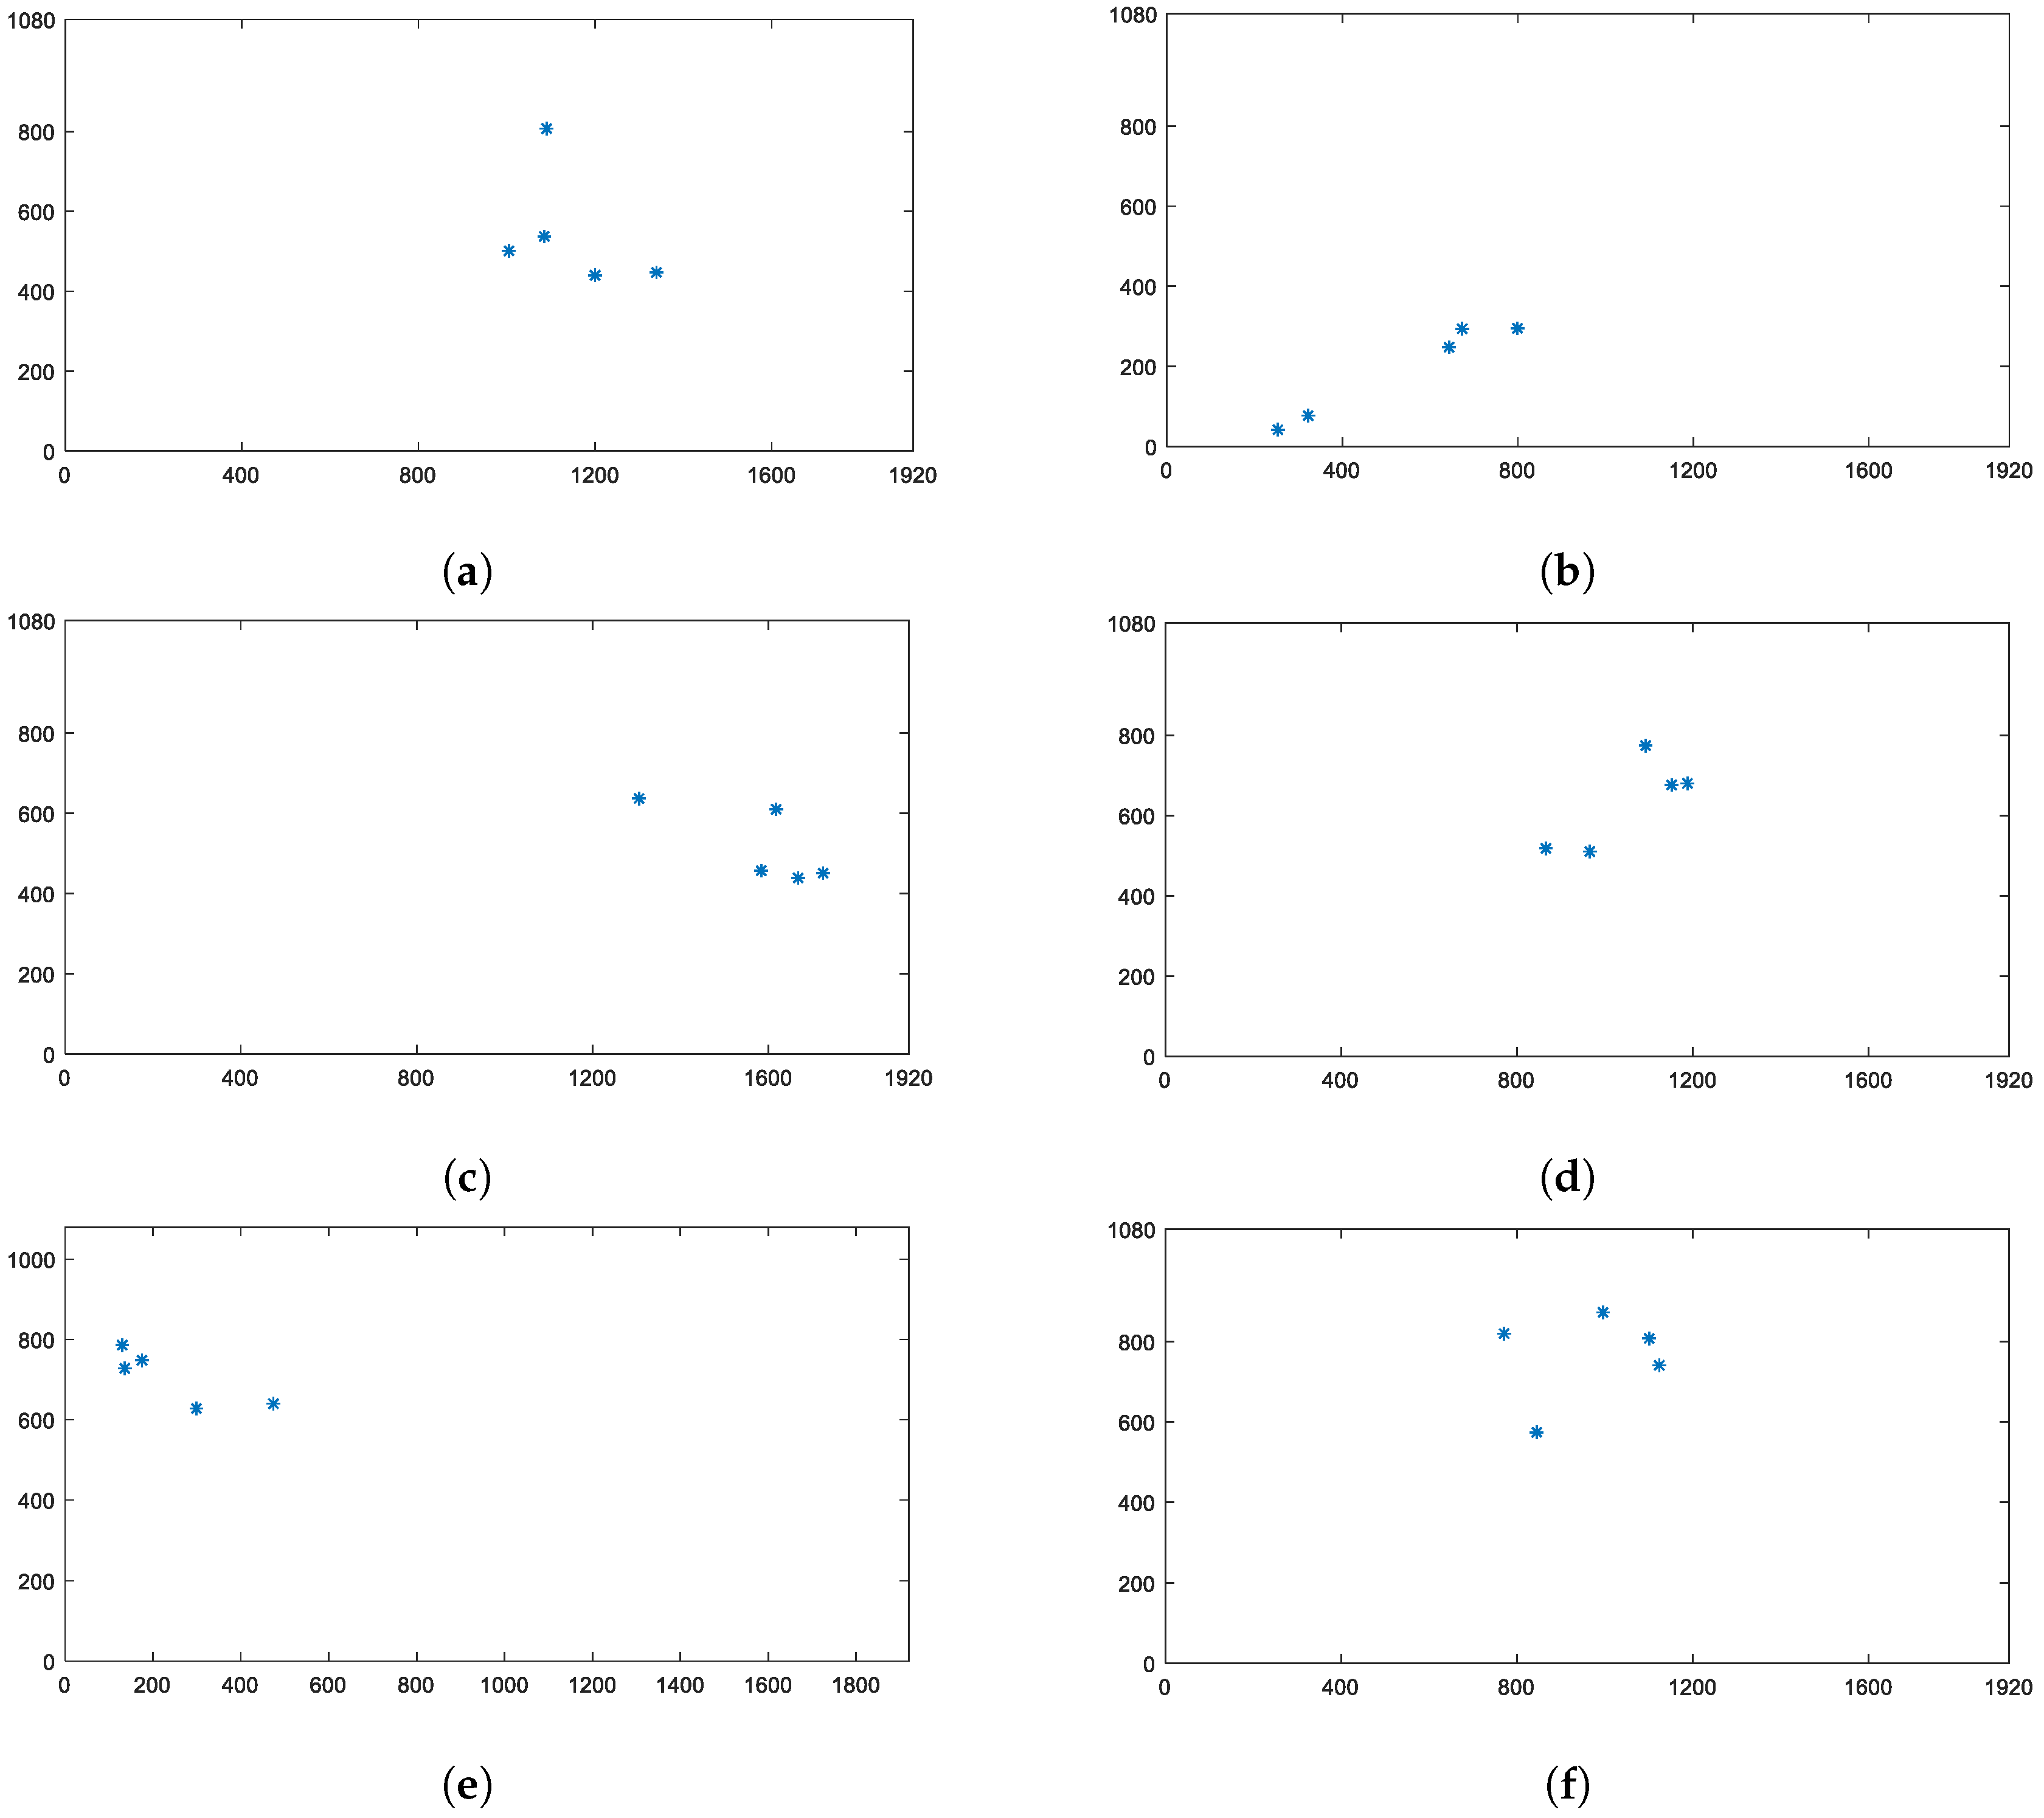
The F function test is totally ineffective in detecting clustering in Passpoint since the lower critical values were estimated using Monte Carlo simulations to coincide with their theoretical minimum value. Despite the visible clustering of the graphical passwords generated in DB.1.1 and DB.1.2, as shown in
Figure 6, both Ripley’s K test and the nearest neighbor test were ineffective in detecting the DB.1.1 sets as clustered. Ripley’s K test offered the best results, which detected only
of the cases. In the database DB.1.2, it was expected that the function has a better success rate due to the strong clustering of the sets. However, these patterns of points belonging to the second level of clustering are unlikely to be found in practice since it would suppose selecting the five points in an area equivalent to one eighth of the image area, something unlikely that a responsible user will do, a graphical password with these characteristics would undoubtedly offer inadequate security. However, experiments with DB.1.2 confirm the ineffectiveness of both tests in detecting clustering in five-point patterns. Once again, the best results were obtained by Ripley’s K test, which detected
of the cases, a considerable improvement compared to the
obtained for DB.1.1, but a very discreet value yet to be considered effective as it fails in more than
of the cases analyzed. These results are summarized in
Table 1, where the “-” means that the corresponding test is not applicable in this case.
3.3.2. Regularity Detection
The lower critical values estimated using Monte Carlo simulations coincide with the minimum values that the
and
functions can reach; therefore, the tests of the Ripley’s K function and the nearest neighbor are totally ineffective at detecting regular patterns in this scenario. For its part, the test of the empty space function F was not able to detect any of the 10,000 iterations made to the pattern
as regular,
the one being the pattern that expresses the maximum possible regularity between five points in a rectangle. These results are summarized in
Table 1.
4. Test for Detection of Weak Graphical Passwords in Passpoint Based on the Mean Distance between Points
The main reason that the classical tests presented above were constructed using the Monte Carlo method is that the theoretical distribution, even for simple point patterns, could be mathematically unknown or intractable; therefore, this method is used whose main advantage is its easy application to estimate the mean, the sample distribution of the test statistic and the confidence intervals. This method has one main disadvantage: it involves randomness; therefore, the values obtained may change if the process is repeated. This brings a certain loss of power to the test that, together with the small sample typical of our scenario, leads to the results set out above. Therefore, our approach to finding a spatial randomness test capable of detecting non-random graphical passwords in Passpoint with good efficiency will be to find a test statistic that allows us to differentiate between random, clustered, and regular passwords—and whose sample distribution is calculable. In this way, a hypothesis test could be built without using the typical Monte Carlo simulations and thus avoiding its intrinsic randomness and associated loss of power.
4.1. Statistic and Sampling Distribution
The statistic that is proposed to be used is that of the mean distance between the points of the pattern, in this case, the five points corresponding to the graphical password. It is not possible to assume the normal distribution of the mean in this scenario due to the small sample size (
) [
32]. In order to estimate the sampling distribution of the mean distance between 5 points, the following experiment was carried out:
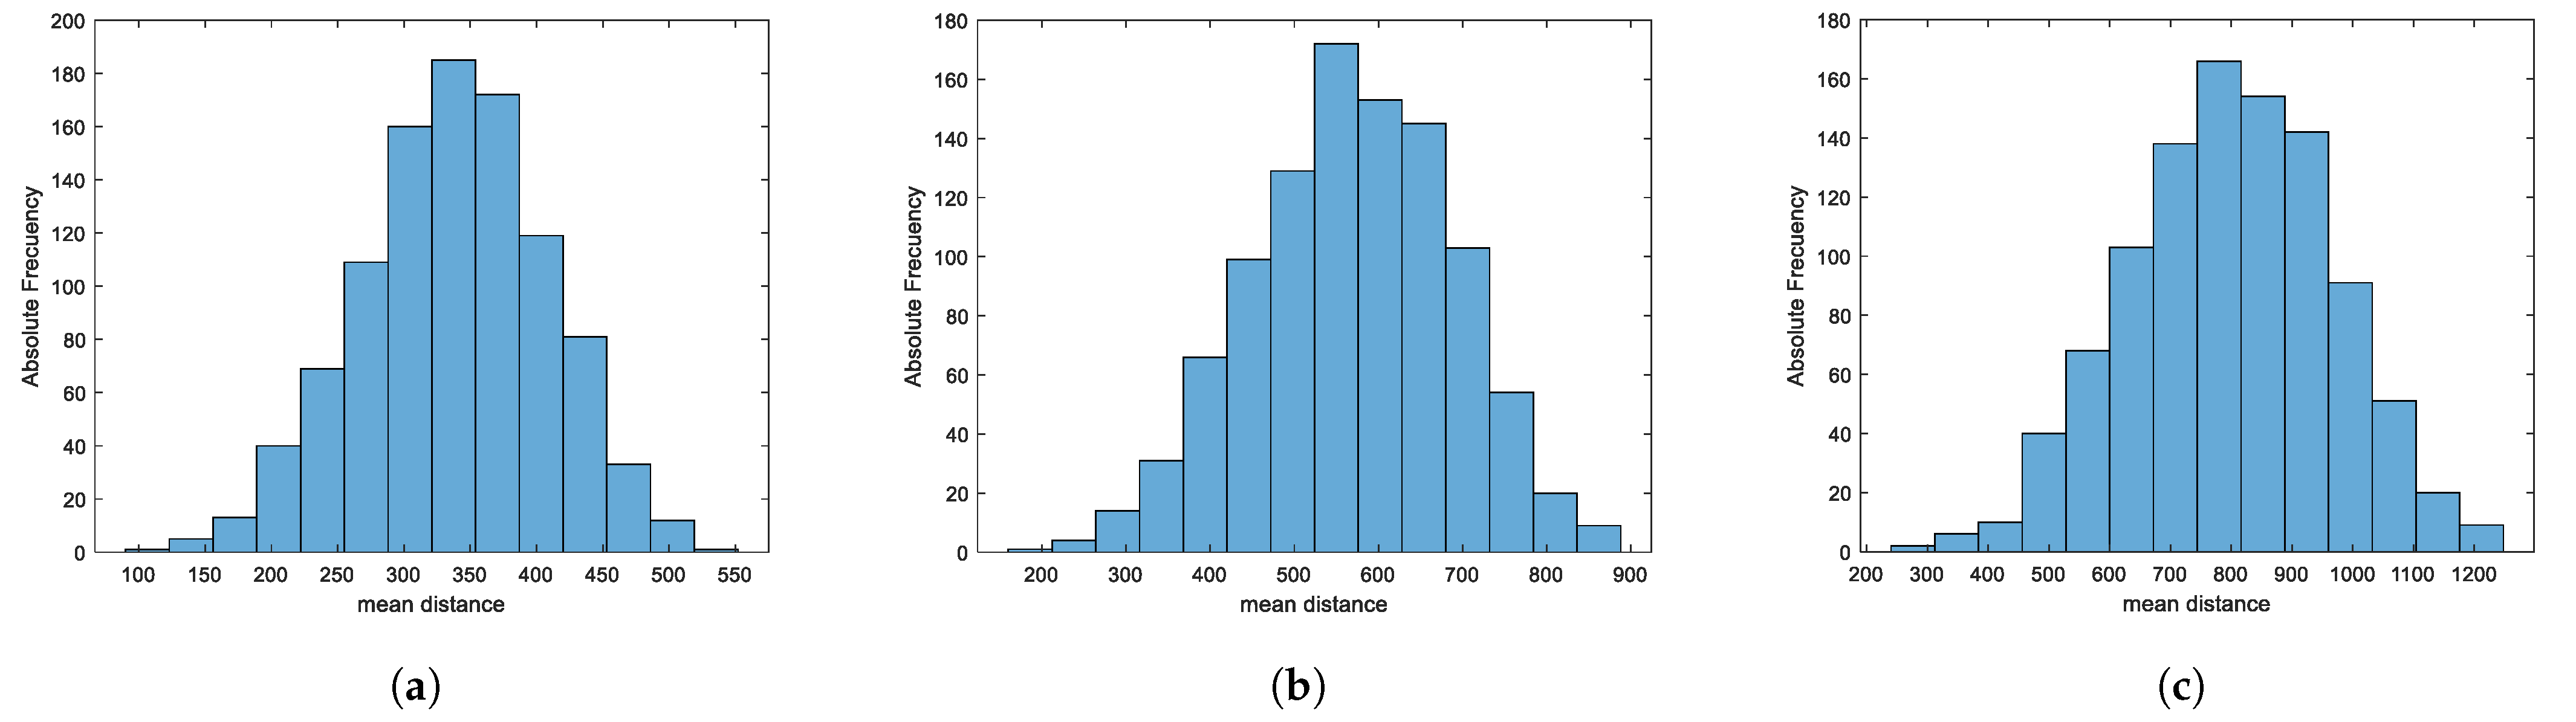
Experiment 3: 1000 sets of five random points were generated on three different image sizes—, and —sizes which were selected for being the most common in the use of computers and smartphones. For each of these 1000 sets, their mean distances were found, so there are three databases of 1000 random mean distances, each DB.2.1, DB.2.2, and DB.2.3 respectively, for each one of the image sizes.
Results of experiment 3:Figure 7 shows the frequency histograms for each of the databases found; the histograms have the traditional symmetric bell shape, so the data seem to come from a normal distribution.
It was estimated that the intervals cover the parameters for said distribution
,
for DB.2.1;
,
for DB.2.2 and
,
for DB.2.3 to the
. In [
33], they present a formula to determine the expected mean distance between two random points within a rectangle of dimensions
:
therefore, we can precisely calculate at
,
and
, that these values approximately coincide with the mean value of their respective confidence intervals; on the other hand,
,
and
were estimated by point estimation. These parameter values and the estimated normal distribution to which each database fits are shown in
Table 2.
Figure 8 shows the fit of each database to its standardized normal distribution, and in each case the visual fit is good.
Three normality tests were applied to check whether DBs.2.1, 2.2, 2.3 came from a normal distribution: Anderson–Darling, Kolmogorov–Smirnov and chi-square. The results are shown in
Table 3.
4.2. Construction of the Proposed Test
The proposed test is a classical hypothesis test. Let X be the random variable of the distance two by two between five random points; the sample in each case will be the 10 resulting distances, this sample is rather small in the sense of the Central Limit Theorem, however, it was already shown previously that distributes normally, therefore, the test statistic () distributes in each case. Since under the randomness hypothesis, a 5-point graphical password has a mean distance of , then it can be assumed that those graphical passwords whose mean distances are significantly different from come from a non-random pattern. In that sense, it can be found in the left hand tail or the right hand tail of the distribution: if it is the left tail, the distances between the points will be less than the mean, so the evidence points to a clustered pattern; if it is the right tail, the distances between the points are greater than the mean, so the evidence points towards a regular pattern. In the case of non-random patterns, the hypotheses of the test will be the following:
Null hypothesis : the points have a mean distance of so they are assumed to be random.
Alternative hypothesis : the points have a mean distance other than so they are assumed to be non-random.
The significance level can be set by the user or system, depending on the level of non-randomness that one wishes to allow in the password. The critical region of the test will be .
4.3. Experimental Validation of the Proposed Test
In order to estimate the errors made by the proposed test and check if they conform to the known theoretical errors of the normal distribution, the following experiments were carried out:
Experiment 4: It is well known that the error that was committed for a normal distribution in the intervals may be , , , from the left tail and , , , from the right tail. In order to estimate in the proposed test, the probability that the Z statistic belongs to each of these intervals and to compare whether they correspond to the known theoretical probabilities, 10,000 sets of five random points were generated in each of the image sizes, obtaining three databases DB.3.1, DB.3.2, DB.3.3 of 10,000 random graphic passwords each.
Results of experiment 4: The result of the experiment for each of the estimated distributions
,
,
are shown in the
Table 4.
As can be seen, for the three image sizes, the estimated probabilities that the statistic Z of the test belongs to each of the intervals from the left and right tails of the distribution fit well with the theoretical probabilities. This contributes to the validity and accuracy of the test.
Experiment 5: To experimentally verify the type I error committed by the test, it was applied to each of the sets of databases DBs.3.1, 3.2, and 3.3 for five of the most common significance levels 0.2, 0.1, 0.05, 0.02, 0.01.
Experiment results 5:Table 5 shows how the frequency obtained in the experiment for each of the databases of random graphic passwords detected as non-random by the proposed test is adjusted to the theoretical probabilities.
The type I errors observed and those expected for the proposed test fit well for the five levels of significance analyzed in each image.
Experiment 6: To measure the proposed test’s effectiveness, five non-random graphic password databases were generated for each image, of which three were clustered passwords and two were regular. The clustered databases were generated following a Poisson aggregate process; the regular ones were generated establishing inhibition distances.
For the image , the aggregation distances were 175 u, 145 u, and 125 u of the radius, obtaining the clustered databases DB.5.1.1, DB.5.1.2, and DB.5.1.3, respectively; the regular databases DB.5.2.1 and DB.5.2.2 were generated by inhibition distances of 140 u and 220 u, respectively.
For the image , the aggregation distances were 290 u, 240 u, and 210 u of the radius, obtaining the clustered databases DB.6.1.1, DB.6.1.2, and DB.6.1.3, respectively; the regular databases DB.6.2.1 and DB.6.2.2 were generated by inhibition distances of 210 u and 350 u, respectively.
For the image , the aggregation distances were 410 u, 335 u, and 290 u of the radius, obtaining the clustered databases DB.7.1.1, DB.7.1.2, and DB.7.1.3, respectively; the regular databases DB.7.2.1 and DB.7.2.2 were generated by inhibition distances of 300 u and 505 u, respectively.
It should be noted that the first aggregation distances in each of the image dimensions (175 u, 290 u, 410 u) determine graphic passwords that cover approximately a maximum area equivalent to a quarter of the total area of their respective images—a fact which will generally assumed to refer to databases DBs.5.1.1, 6.1.1, 7.1.1 as first level clustering. Similarly, the second distances (145 u, 240 u, 335 u) determine approximately one sixth of the area of their respective images and generalize the databases DBs.5.1.2, 6.1.2, 7.1.2 as the second level of clustering and the third distances (125 u, 210 u, 290 u) of one eighth, generalizing the databases (DBs.5.1.3, 6.1.3, 7.1.3) as the third level of clustering. The databases DBs.5.2.1, 6.2.1, 7.2.1 will be generalized as the first level of regularity and the databases DBs.5.2.2, 6.2.2, 7.2.2 as the second level of regularity.
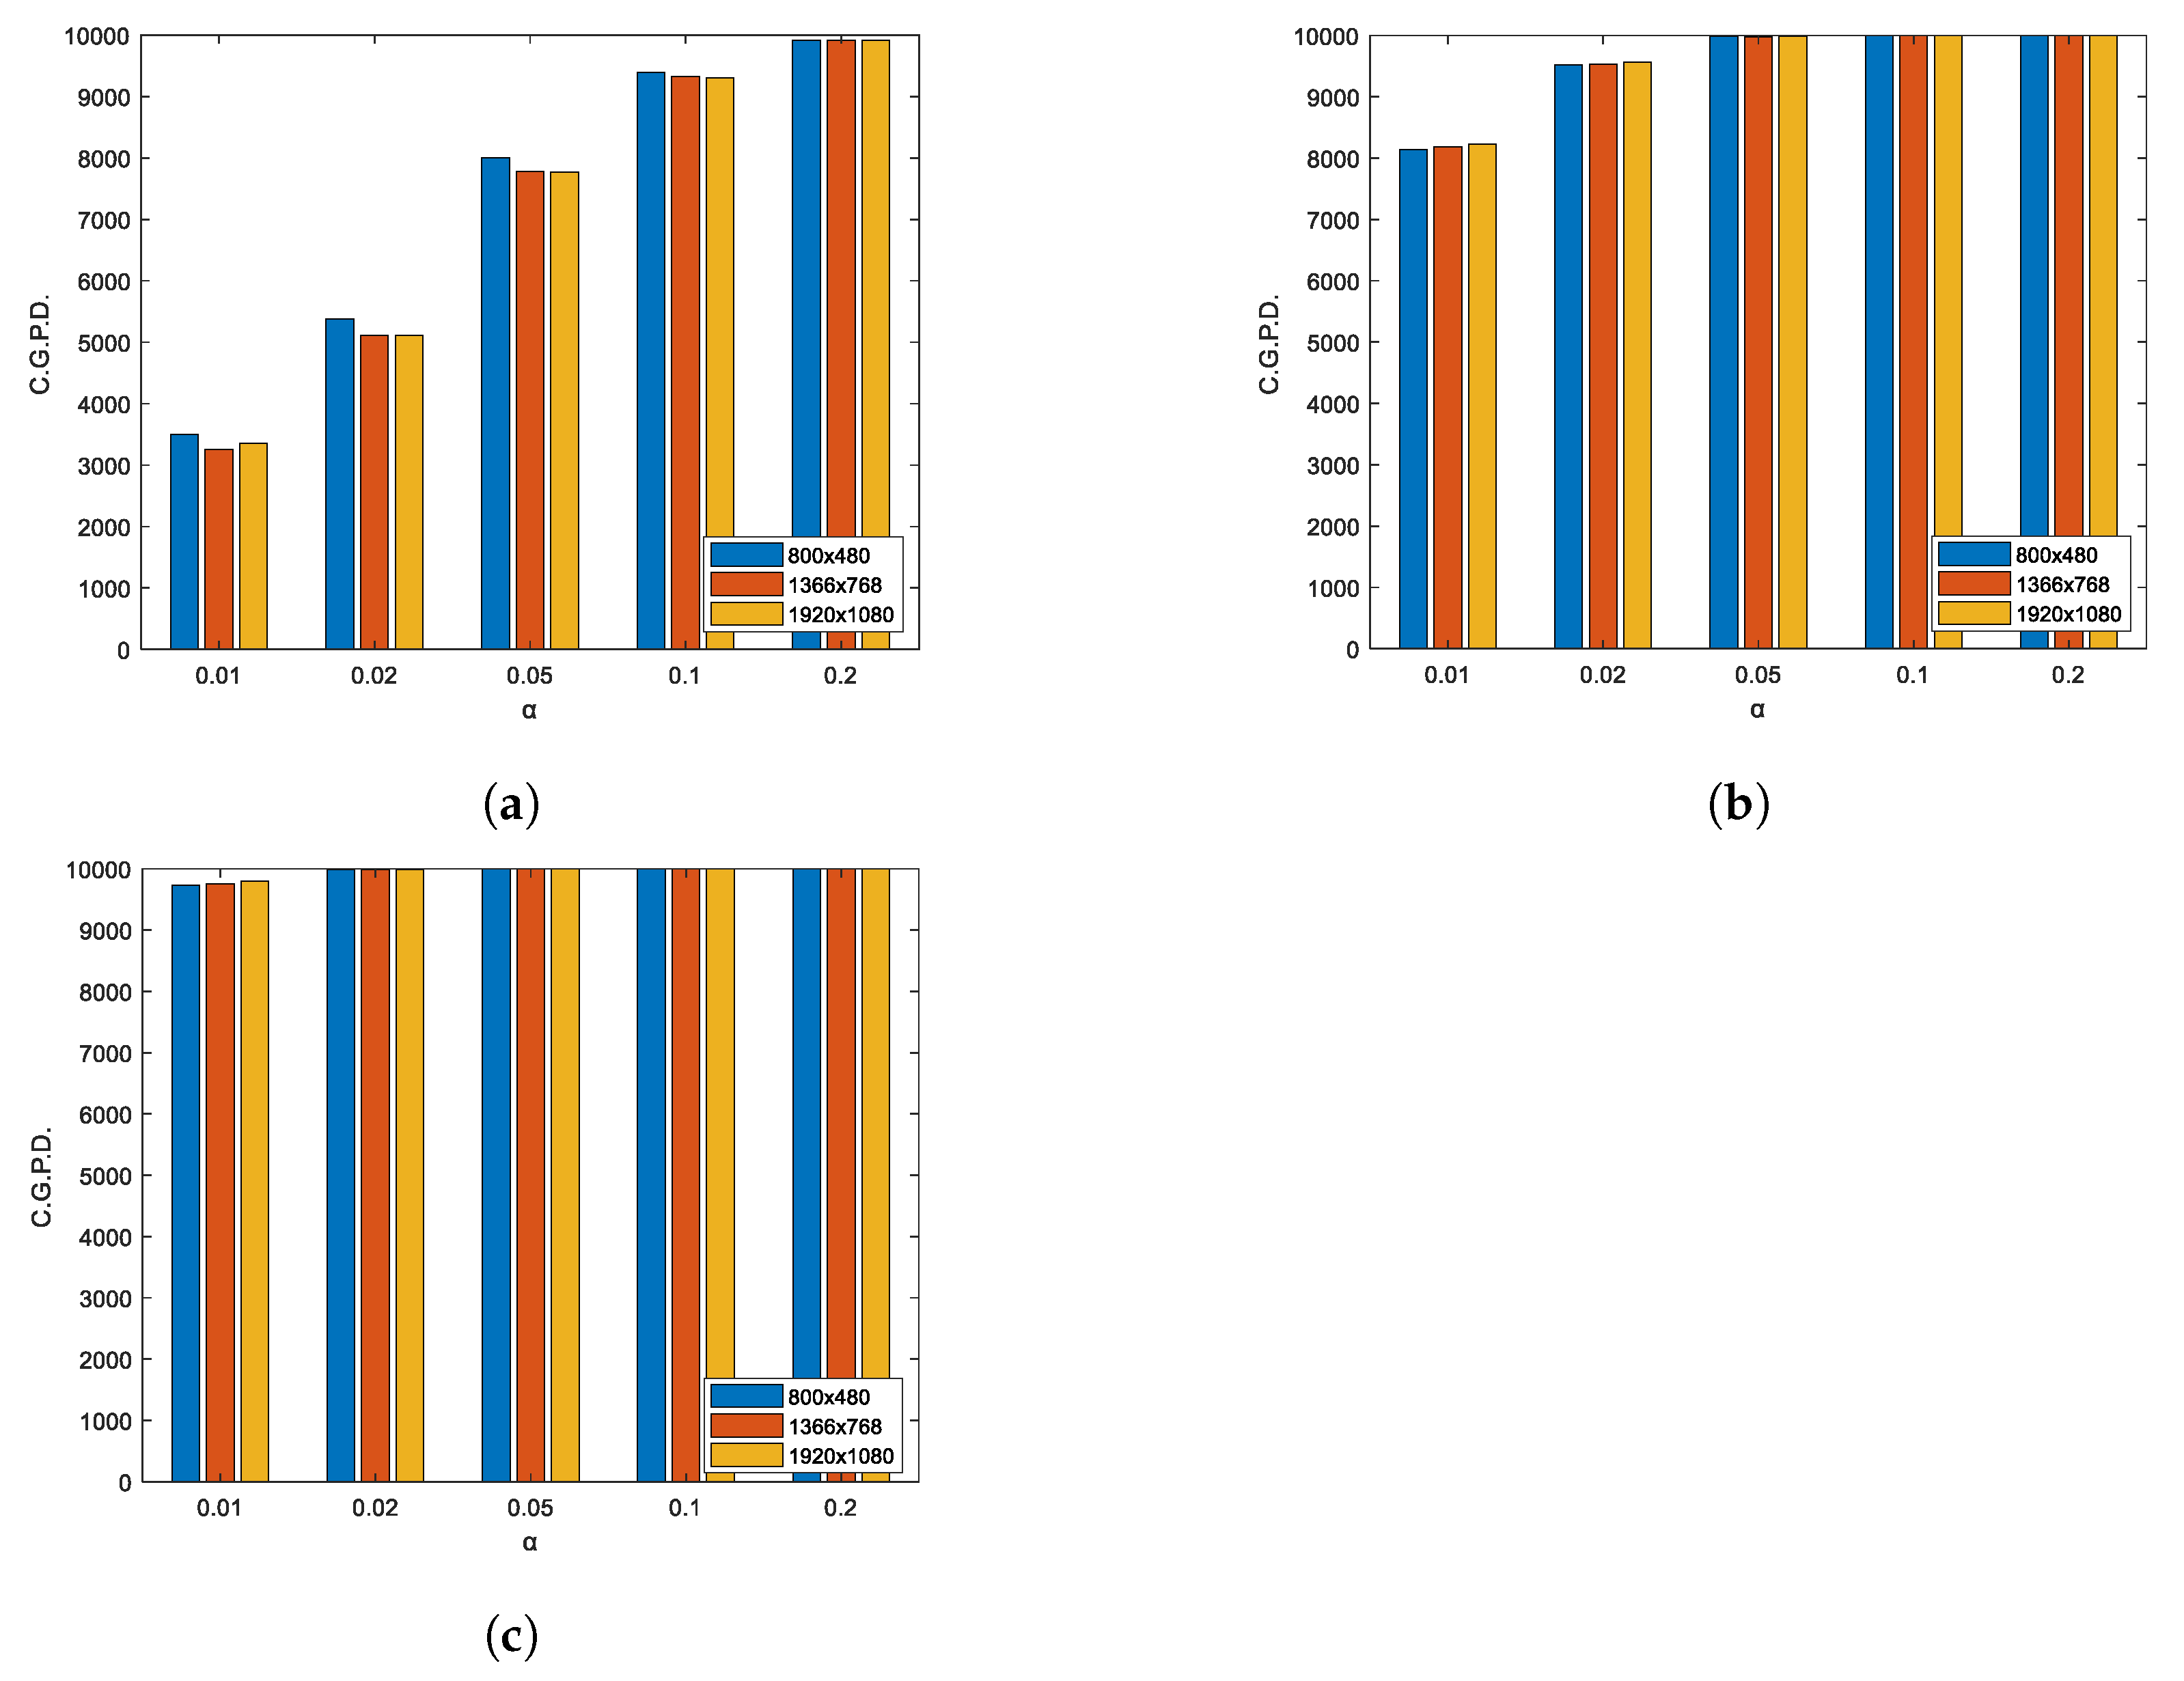
Experiment results 6: In
Table 6,
Table 7 and
Table 8, the estimates of type
error are shown, through the number of non-random graphical passwords detected by the test proposed, for each of the image dimensions respectively.
A comparison between the three tables shows that the type
errors made by the proposed test for each image size are similar. This visual comparison is provided in
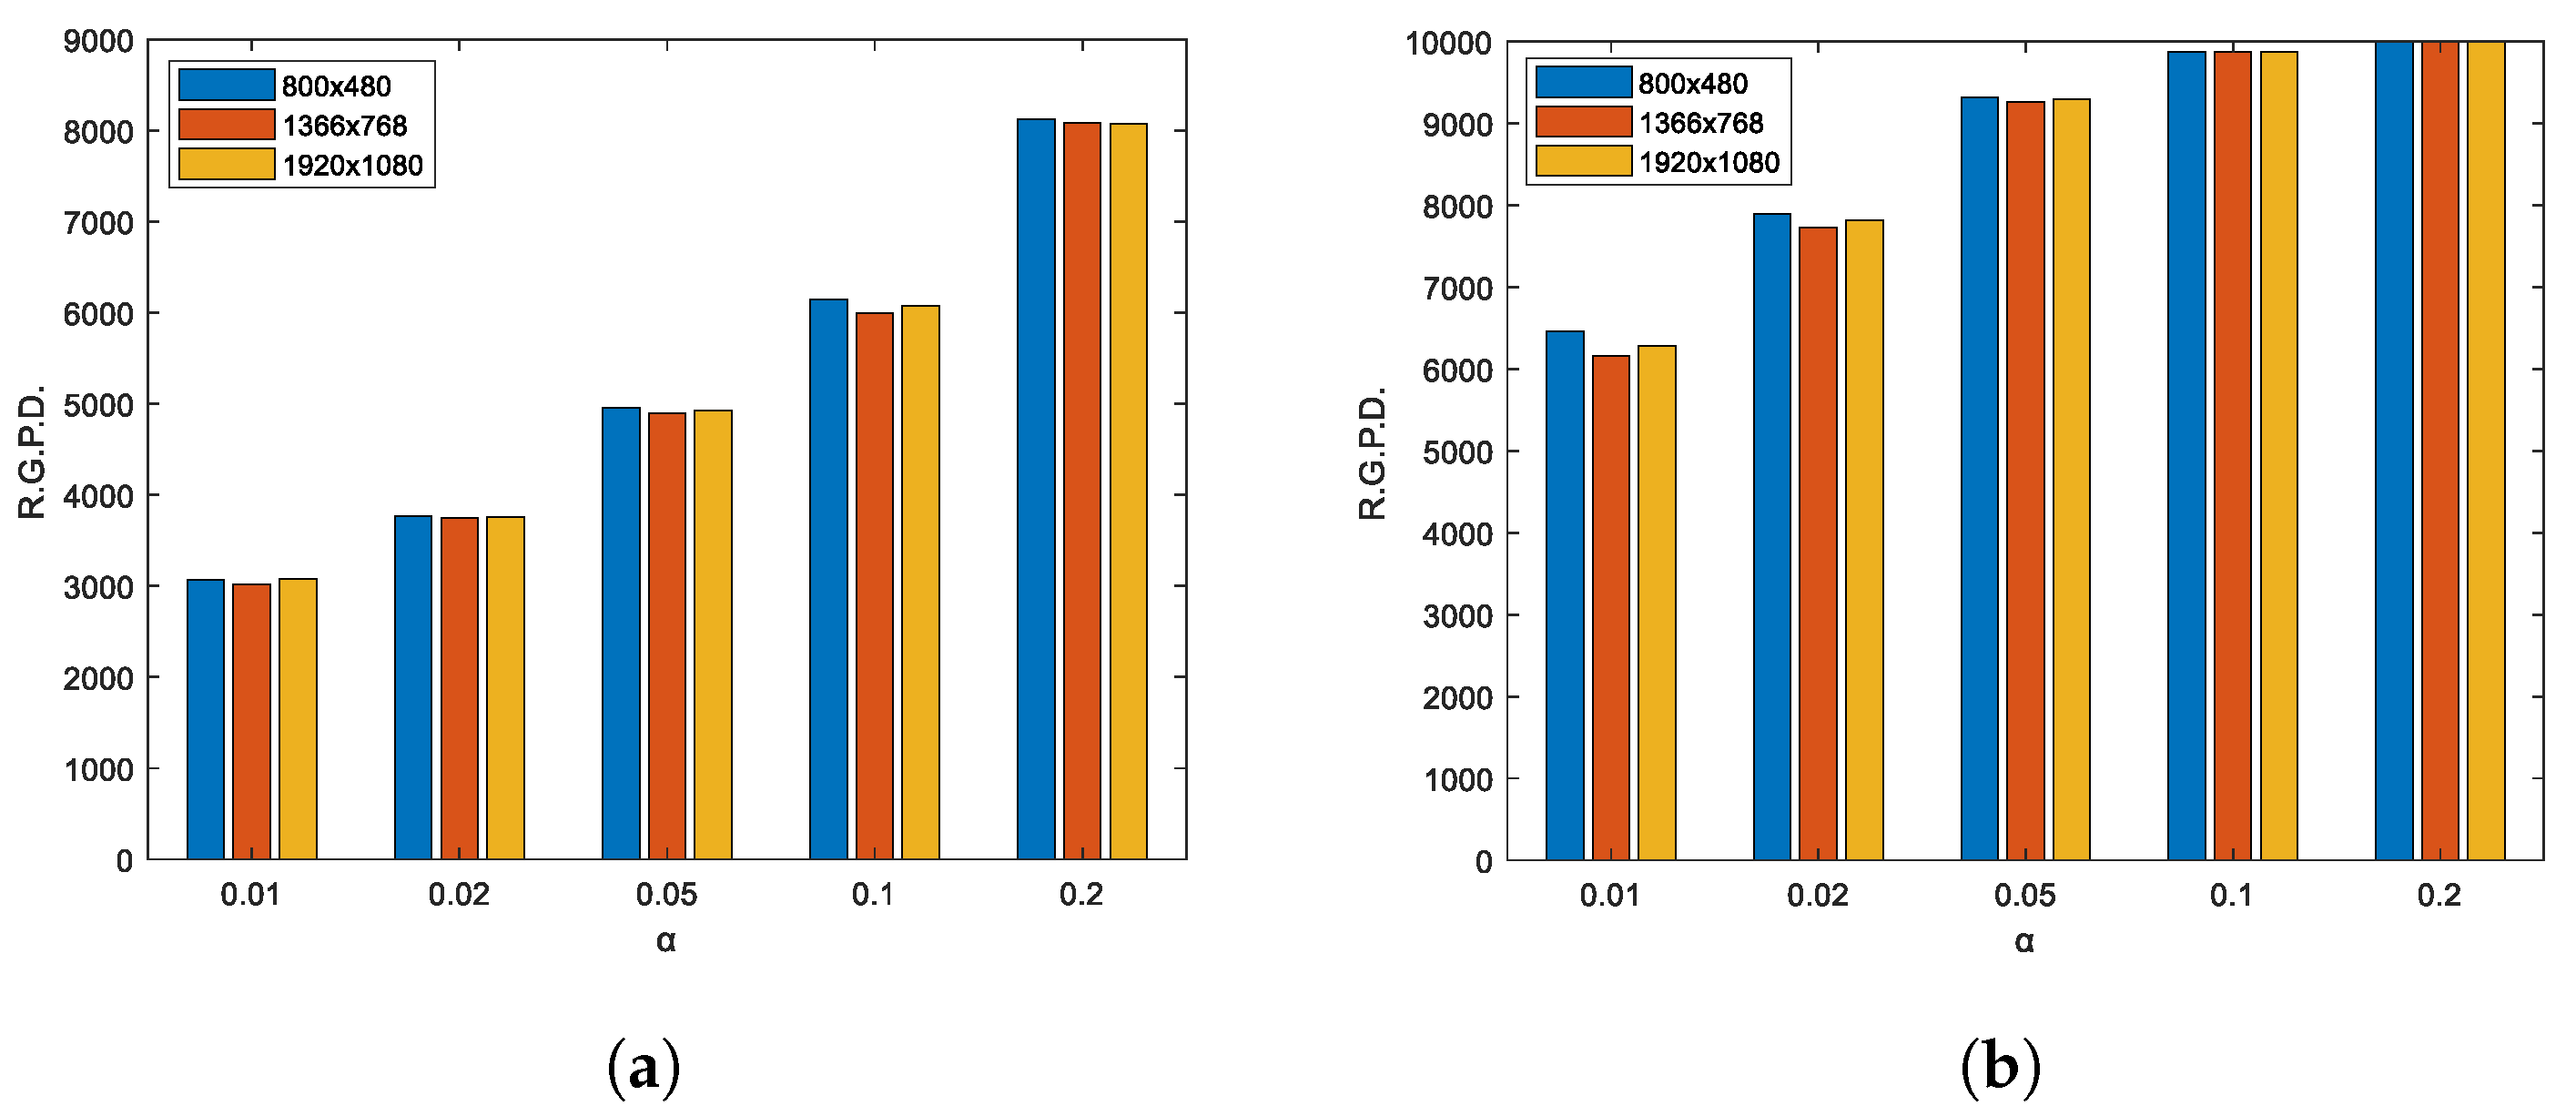
Figure 9 for clustered passwords, and in
Figure 10 for regular passwords.
4.4. Discussion of the Results
In
Table 5 it can be seen how the errors of type
I made by the test are very close for each of the three dimensions of the images analyzed; the same happens for errors of type
(
Figure 9 and
Figure 10) in each of the levels of clustering and regularity analyzed for the three sizes of images. Therefore, it is possible to discuss the results and conclude regardless of the size of the image used.
The theoretical errors committed in the standard normal distribution are adjusted to those observed in the experiments, which validates and gives reliability to the proposed test. The same happens for the error of type I committed, which closely matches those observed experimentally for the test for each of the significance levels . The test turned out to be quite effective in detecting the graphical passwords clustered in a general way. For the first clustering level analyzed, the best detection rates were reached for the levels and for which it detects more than and of passwords, respectively, and for the other three levels tested, the detection rate was close to , and for the levels , , and , respectively. For the 2nd level of clustering, the test detected all the graphical passwords analyzed for the level, more than 99.8 % for the levels and and approximately 93 % and 81% for the levels and . For the case of the third level of clustering, the test detected all the passwords analyzed for the levels , and ; more than for level and more than for level .
In the case of regularity, the proposed test turns out to be less effective compared to clustering, for the databases corresponding to the first level of regularity, the test detected , , , and , respectively, for each of the significance levels , , , , . For the second level of regularity, the detection levels reached were , , , and for each of the significance levels, respectively.
Although the selection of the optimal parameter is left to the choice of the user or the system, it should be noted that values of minimize the probability of type I error but are not very sensitive to non-random passwords, as it fails in more than of the cases for clustered passwords and in more than for regular passwords; on the other hand, a value of would be susceptible to non-randomness, but in turn, it would detect more than one out of five random passwords as clustered. Therefore, the recommended significance levels are and , highlighting the level that guarantees the detection of more than of clustered passwords and more than of the regular ones—this being the level of significance recommended by the authors for general purposes. However, a user or system with high-security requirements might want to default to the level, which achieves the detection of more than of clustered passwords and more than of regular passwords with the disadvantage of erroneously detecting one random one out of five.
4.5. Comparison of the Proposed Test with the CSR Tests Analyzed in Passpoint
Table 9 shows the comparison between the proposed test, Ripley’s K function, the nearest neighbor distance test, and the empty space function in terms of the effectiveness in detecting random non-graphical passwords in Passpoint. The comparison was made considering the image size of
and the significance level
. This comparison is valid for the other two sizes of images studied since, as mentioned above, the proposed test’s detection values are similar in each one of them.
The difference between the proposed test’s effectiveness and the classic ones is evident, so it leaves no doubt from our point of view of its superiority in the Passpoint scenario. The most notable difference is perhaps in the regular patterns, since the classic tests could not detect even the most regular pattern possible. In contrast, the proposed test detects it in more than
of the cases and detects it with good effectiveness compared to other levels of regularity (
Figure 10).
4.6. Application of the Test Proposed in Passpoint
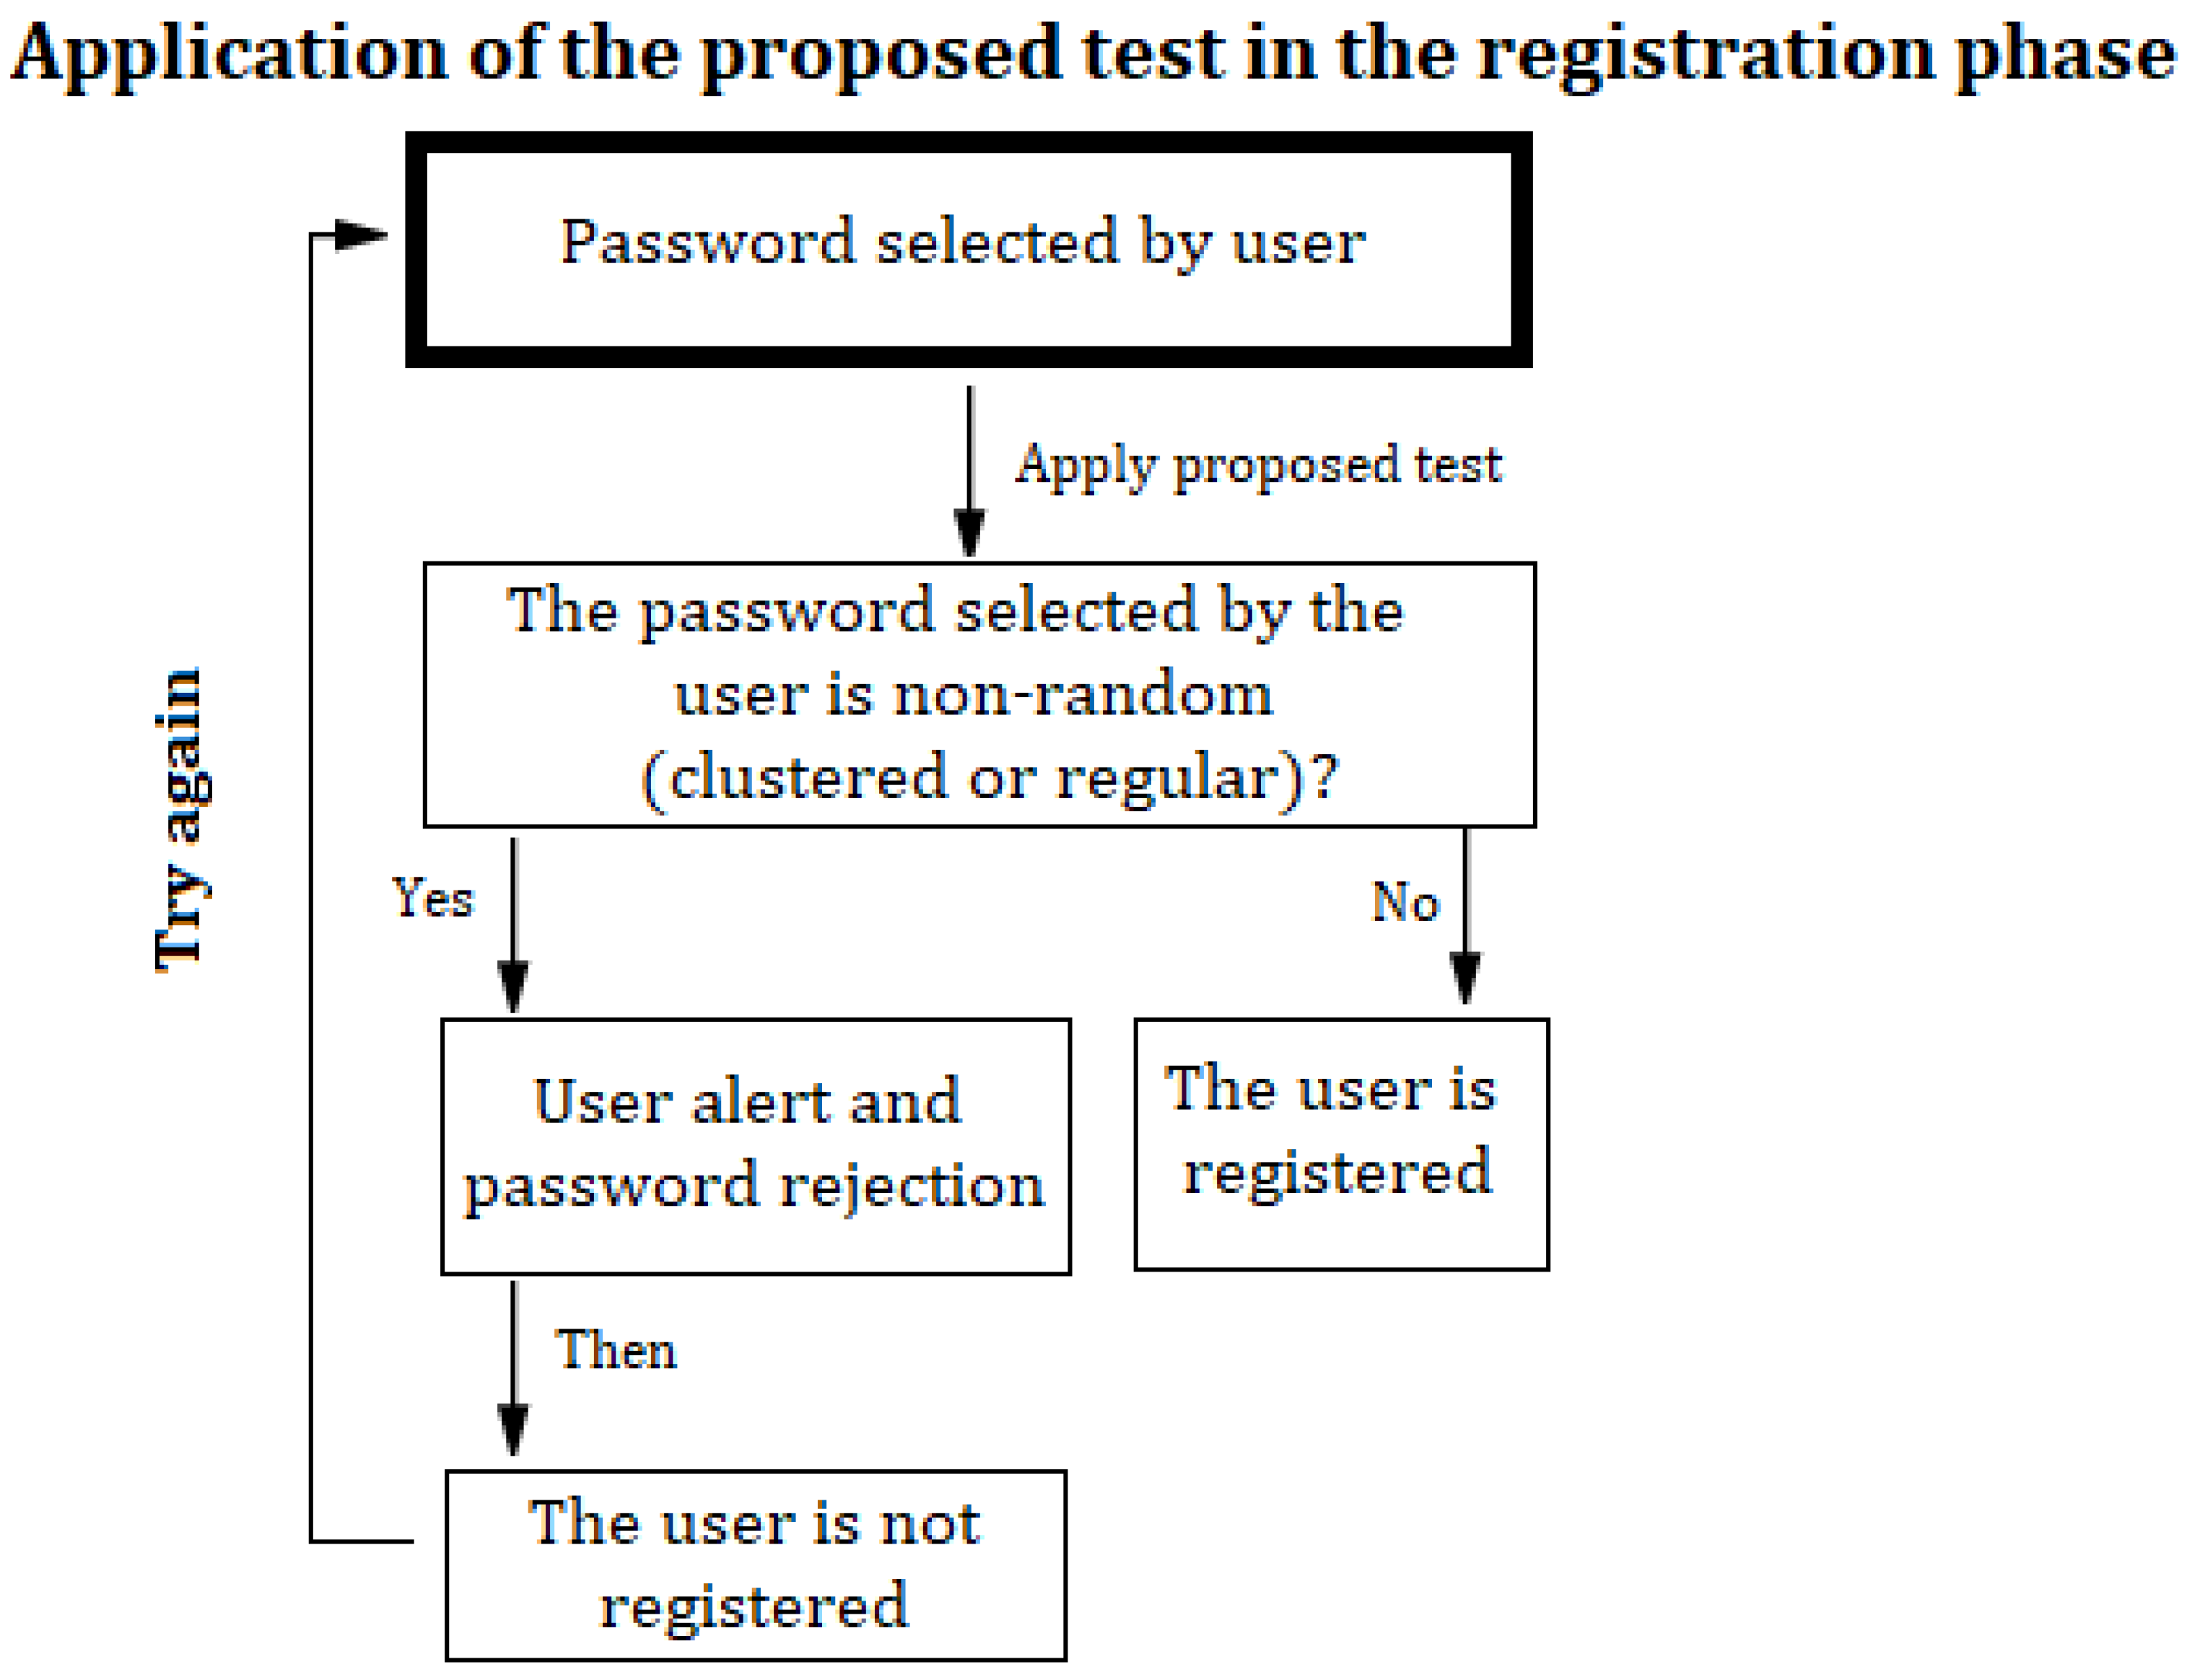
The proposed spatial randomness test was designed to be included in the Graphic Authentication systems with the Passpoint technique so that it allows the system to check the security of a password established by the user during the registration phase. The level of significance, and therefore the level of non-randomness to be allowed, must be established in advance by the user or by the system itself depending on its security requirements. For general purposes, is recommended; for high levels of security, it would be best to use . The test would be executed by following the following steps:
Step 1: The user selects the five points (pixels) of their password on an image (it is assumed that the image selected by the user or those offered by the system are of one of the following dimensions , or );
Step 2: Calculate the mean distance between the points of the set password;
Step 3: Calculate the Z statistical according to the dimension of the chosen image;
Step 4: Determine the critical region taking into account the specified significance level;
Step 5: If the statistic calculated in step 3 does not belong to the critical region, the password is accepted and the registration phase ends. If it falls in the critical region, the user is notified that the password is weak (depending on whether it falls in the critical region of the left or right tail of the distribution, the user can be notified about the type of weak, clustered or regular password respectively) and returns to step 1. These steps are shown in
Figure 11.
Example 1. Let (982, 318); (729, 379); (550, 435); (1289, 571); (1056, 266), be five points corresponding to a graphical password, on an image of size and :
Therefore, it is rejected that the points have a mean distance of 798 and therefore that they are random, in favor of the fact that the mean distance is significantly different from 798, and therefore that the points are clustered with a significance level of .
5. Conclusions and Future Work
The experiments show that Ripley’s K tests, the distance to the nearest neighbor and the empty space function, despite being some of the most used tests in the detection and characterization of non-random patterns, are not effective in the detection of non-random graphical passwords in the Passpoint scenario, where these passwords only consist of five points. Consequently, a test was proposed based on the mean distance between the five points of a graphical password that allows detecting non-random graphical passwords with good effectiveness. It was shown that the mean distances between sets of five points follow a normal distribution, which made it possible to carry out a hypothesis test and classify the observed patterns of points into clustered or regular according to the negative or positive deviation, respectively, of the mean distance observed with respect to the mean calculated for random patterns, the normal distribution also allows knowing the theoretical errors committed by the test, thus avoiding the intrinsic randomness of the confidence intervals characteristically obtained for these CSR tests using Monte Carlo simulations. The estimated probabilities that the Z statistic belongs to each of the intervals of the left tail and right tail of the distribution fit the known theoretical probabilities for the normal distribution, and the observed probability of making a type error I is adjusted with each of the five significance levels analyzed , , , , . The experiments carried out show that the test is effective in general to detect non-random graphical passwords, being particularly effective in detecting clustered patterns in which it managed to detect approximately , and of the three clustering levels, respectively, analyzed for the significance level recommended by the authors for general use. The regular pattern detection values reached were and , respectively, for the two levels of regularity analyzed with the significance level ; these values, although more discrete than the clustering ones, represent the greatest difference concerning the classic CSR tests compared, since their effectiveness in detecting regular patterns was . The application proposed for the test was to alert a user about a possible non-random (and therefore weak) password during the registration phase in a system that has Graphic Authentication implemented as a security system using Passpoint.
It is suggested to explore two aspects in future works: first, the application of GAN to evaluate the strength of graphic passwords; second, symmetric patterns due to their non-random nature are potentially detectable by our test; however, the necessary experiments and the criteria to discern between each pattern are left proposed; a possible approximation would be to use the maximum likelihood estimator, as done in [
34].
Although the analyzes carried out in this article were made in particular for images of the dimensions , and , as they are the most used sizes in ordinary computers and smartphones, and are extensible to images of any other dimension.


 ,
, 


