Article

High Harmonic Generation in Monolayer and Bilayer of Transition Metal Dichalcogenide

1
Department of Physics and Center for Attosecond Science and Technology, POSTECH, Pohang 37673, Korea
2
Max Planck POSTECH/KOREA Research Initiative, Pohang 37673, Korea
*
Author to whom correspondence should be addressed.
These authors contributed equally to this work.
Symmetry 2021, 13(12), 2403; https://doi.org/10.3390/sym13122403
Submission received: 10 November 2021 / Revised: 2 December 2021 / Accepted: 3 December 2021 / Published: 12 December 2021
(This article belongs to the Section Physics)

Abstract

:
In transition metal dichalcogenides (TMDCs), charge carriers have spin, pseudospin, and valley degrees of freedom associated with magnetic moments. The monolayers and bilayers of the TMDCs, in particular, MoS 2 , lead to strong couplings between the spin and pseudospin effects. This feature has drawn attention to TMDCs for their potential use in advanced tech devices. Meanwhile, high-order harmonic generation (HHG) has recently been applied to the characterization of the electronic structure of solids, such as energy dispersion, Berry-curvature, and topological properties. Here, we show theoretical results obtained with the ‘philosophy’ of using HHG to investigate the structural effects of the monolayer and bilayers of MoS 2 on nonlinear optical emission. We use a simple model for MoS 2 in the 3R AB staking. We find that the pseudospin and valley indexes (the Berry curvature and the dipole transition matrix element) in TMDC driven by a circularly polarized laser (CPL) can encode in the high-energy photon emissions. This theoretical investigation is expected to pave the way for the ultrafast manipulation of valleytronics and lead to new questions concerning the spin-obit-coupling (SOC) effects on TMDC materials, Weyl Semimetals, and topological phases and transitions in topological insulators.

1. Introduction

Since high-order harmonics were first experimentally observed in ZnO [1,2,3], their potential in the nonlinear optical spectroscopy of solids has attracted the attention of ultrafast sciences and condensed matter physics [3,4,5,6].
The High-order Harmonic Generation (HHG) is a highly nonlinear phenomenon in the sense that an incoming middle infrared or infrared (MIR or IR) ω 0 ∼0.326 eV (with wavelength λ 0 = 3.8 μ m) interacting with the solid produces a new spectrum, as a consequence of the optical responses of the lattice to the strong laser field (illustrated in Figure 1) [6,7,8]. The outgoing emission contains high-energy photons, n ω 0 , regarding the fundamental driving laser, ω 0 , where n is typically an integer [6,8,9] (for a mathematically formal description, see Appendices Appendix A and Appendix B). This paper explores the high-order harmonics emission from a monolayer and bilayer of a typical TMDC such as MoS 2 .
The monolayer and bilayer crystalline structures of MoS 2 are illustrated in Figure 1a,b, respectively [10,11,12]. Note, however, the Mo and S atoms in a layer are not in the same plane in real space. Hence, this figure has to be taken as a schematic diagram to describe the hexagonal lattice structure of MoS 2 . In the case of the bilayer, the stacking is featured by the AB type stacking, which is the so-called 3R polytype [12]. This means that the ‘S1’ atom of Layer1 interacts with an ‘empty space’ (dashed black link in Figure 1b) of Layer2; and, the ‘Mo’ atom of Layer1 interacts with an orbital of ‘S2’ atom in Layer2. This is the nearest neighbor interaction between inter-layers. The interactions between the ‘Mo’ and ‘S’ atoms in different layers are mediated by the hopping parameter t 11 [10,11], which is described in Section 2 and Section 3. The manipulation of monolayers, bilayers and bulk TMDCs has been studied in several experimental and theoretical efforts using the Angle Resolved Photoemission Spectroscopy (ARPES) technique [13,14]. However, its complete characterization remains a downright challenging research field.
Returning to the key physical insight of HHG in solids, the simplified description of the HHG mechanism is depicted in Figure 1c,d for both monolayer and bilayer MoS 2 [11]. The accelerated carriers in the conduction (valence) band have two intrinsic mechanisms [7]: intraband current and interband current. Note that our theory is subjected to the Keldysh approximation in which ϵ 0 ω 0 , where ϵ 0 is the band gap of the crystal (see Appendix B). Thus, the interband mechanism of HHG can be interpreted in terms of three simple steps [15,16,17]: (i) at a time t when the driving laser-field, E ( t ) , reaches its maximum, electron-hole (e) and (h) pairs are created (see Figure 1c,d) by the action of the oscillating external electric field E ( t ) , (ii) between t and t, e and h are accelerated or propagated under the quasi-classical action S ( k , t , t ) Equation (A2) in the bands of the MoS 2 (see Appendices Appendix A and Appendix B.2), gaining a ‘considerable’ amount of energy from the laser and bands, and simultaneously encoding rich information of the lattice structure in the crystal (see Figure 1a,b) [3,7,15,16,18]. Finally, (iii) after these, e and h are accelerated in the Brillouin zone (BZ), the e and h can find a time t at which they annihilate each other. Through the conservation of energy [15], this physical picture converts the accumulated e-h energy into a high-energy photon with respect to the fundamental-laser as depicted in Figure 1c,d.
Surprisingly, this HHG process encodes rich information about the atomic structure and electron dynamics in the TMDCs. This opens the door to investigate fundamental questions and technological development such as symmetries of the Hamiltonian in the solids, the fermion-dynamics, the effects of the Berry curvature, pseudospin, spin-valley, topological phases and transitions [16,18,19,20,21,22,23]. Additionally, these features are relevant to the study of the fundamental protections of the symmetries, carrier measurements, Bloch oscillations at the natural time-scale of the electrons, sub-femtoseconds ( 10 18 s) [24].
In addition, it has been demonstrated that in TMDCs, the number of layers and the polytype geometrical features modify the electron structure of the TMDCs and their transport features [10,11]. This turns MoS 2 from a simple semiconductor to a material with a strong-spin orbit coupling (SOC) effect [11,25,26].
In this paper, we use HHG spectroscopy to explore the effects of interlayer coupling in bilayer MoS 2 and to investigate how the pseudospin and valley-index can differentiate the monolayer from the bilayer. Furthermore, we pursue to understand whether or not the Berry Curvature and Dipole Transition Matrix Elements (DTMEs) have an impact on the harmonic emissions [25].
Pioneering studies of HHG spectra from monolayer and bilayer graphene have shown qualitative differences [27,28] and, in addition, shown an attractive non-typical enhancement of the emissivity as a function of the ellipticity of the driving laser, particularly when the fundamental field is elliptically polarized. Similar effects have also been theoretically observed by Tancogne-Dejean in bulk MgO [20] by the fully time-dependent density functional theory [29].
Here, we calculate the HHG spectra using the time-dependent density matrix and analyze them using a tight-binding model (TBM), described in Section 2 and Section 3. The Berry curvature around the K/K’ under the k · p approach yields [10,11,18,25]:
Ω v ( k ) = τ 2 a 0 2 t 1 2 M 0 M 0 2 + 4 ( a 0 t 1 k ) 2 3 / 2 .
The parameters in Equation (1) are described in Reference [11] for the monolayer of TMDC. Note, M 0 is related to the onsite potential of the lattice (Figure 1a), t 1 is nearest neighbor (NN), and a 0 is lattice constant and τ the valley index for this simple monolayer model. This is the Berry curvature for the monolayer system MoS 2 of our TBM up to a linear expansion of the field-free Hamiltonian H ^ 0 ( k ) obtained from References [18,19]. According to Kormányos et al. in Reference [10], the Berry curvature induced by interlayer coupling, about K/K’ for the valence band of the bilayer, is written as
Ω v ( k ) = τ 2 δ E l l λ 1 ± λ 2 1 + ( λ 3 k / δ E b g ) 2 1 / 2 .
The parameters τ , δ E l l , are defined according to the spin-valley index and the onsite energies Reference [10]. λ 1 and λ 2 are related to the hoping strength between the layers of MoS 2 . Interestingly, the bilayer Berry curvatures shows the dependence of the interlayer interaction strength. Suggesting the main hypothesis of this paper: “whether or not HHG can encode information of the monolayer pseudospin and valley indexes once the system is subjected to strong middle infrared (MIR) lasers”.
We numerically examine the HHG spectra in terms of the Berry Curvature and the DTMEs for both monolayer and bilayer MoS 2 . The results show an interesting interconnection between the selection rules as well as a particular enhancement in the HHG spectrum for a few harmonic orders (HOs). We define HO as the ratio between the emitted photon frequency ω and the freq. of fundamental driver ω 0 , i.e., HO = ω / ω 0 .
Further, the analysis of angular rotation and pattern of emission reveals a slight difference between mono and bilayers for the high-order harmonics. However, for the harmonic about the band gap (Figure A1), we find an interesting difference, which might be attributable to the Berry Curvature and the DTMEs. These quantities contain pseudospin and valley indexes information of Mo 2 for the monolayer or bilayer. This suggests that the angular rotation of the harmonics can be linked to DTMEs. Surprisingly, in our HHG produced by RCP light, we notice that the HOs in the plateau region exhibit a layer difference with respect to the Berry Curvature and DTMEs. We take advantage of these quantities to analyze our numerical results, the selection rules that these quantities impose and the accumulating phase of the electron and hole wavepackets at each band (Appendix B). In the next section, we will review the total currents on the Bloch basis and split them into interband and intraband currents. Additionally, we will describe the time-dependent density matrix formalism to compute the density at the time and k -space.

2. Current and Time-Dependent Density Matrix

The microscopic electron-charge current j ( k , t ) in a periodical crystalline structure is subjected to an external oscillating laser E ( t ) , and the macroscopic ‘measurement’ is calculated by integrating the k -elementary-microscopic currents in the BZ (atomic units are used throughout this paper unless otherwise indicated):
J ( t ) = BZ d 2 k ( 2 π ) 2 j ( k , t ) .
Here, we define the elementary-microscopic current j ( k , t ) as,
j ( k , t ) = e Tr ρ ^ v ^ = e Tr ρ ^ ( k , t ) p ^ = e m , n ρ m n ( k , t ) P n m ( k ) .
This is the expectation value of the velocity operator v ^ = i H ^ ( t ) , x ^ where H ^ ( t ) is the full time-dependent Hamiltonian in the length-gauge H ^ ( t ) = H ^ 0 + x ^ · E ( t ) . The current j ( k , t ) is defined in terms of the density matrix ρ ^ = ρ ^ ( k , t ) , and the momentum matrix element P m , n ( k ) = u m , k | k H ^ 0 ( k ) | u n , k [18,30,31,32]. Equation (3) is conventionally split into two different contributions, the interband current, J er ( t ) , (associated with the momentum or dipole matrix element transition between the valence and conduction bands) and the intraband current, J ra ( t ) , which show how the electron-wave and hole-wave move in each band (see Figure 1c,d, respectively). Mathematically, those contributions are written as follows [18,19,30]:
J er ( t ) = e m , n m n BZ d 2 k ( 2 π ) 2 ρ m n ( k , t ) P n m ( k ) ,
J ra ( t ) = e m , n m = n BZ d 2 k ( 2 π ) 2 ρ m n ( k , t ) P n m ( k )
which obviously lead to the total current,
J ( t ) = J er ( t ) + J ra ( t ) .
To further evaluate the time-propagation density matrix ρ ^ ( k , t ) , and the interband and intraband currents, we numerically solve, in the time–k space, the density matrix given by the Liouville-von Neumann equation,
i ρ ^ ( k , t ) t = H ^ ( k , t ) , ρ ^ ( k , t ) i D ^ 2 , ρ ^ ( k , t ) ,
where ρ ^ ( k , t ) is evaluated in the electro-magnetic length-gauge representation of H ^ ( t ) . We will also consider the effects of the dissipation of scattering electrons in the lattice and potential thermal bath influences by D ^ 2 . As a state-of-the-art method in high-order harmonics, the phenomenological dephasing time, T 2 , is included in the off-diagonal of the ‘dissipation’ D ^ 2 . We adopt our numerical method, following References [19,33,34] in the moving frame of BZ ¯ = K A ( t ) , where K and A ( t ) denote the crystal canonical momentum and the vector potential of the laser-field, respectively. The vector potential is computed according to E ( t ) = t A ( t ) [7,15]. Given ρ ^ ( k , t ) matrix and the transition ‘canonical’ momentum matrix element, P n m ( k ) , we compute the HHG spectra by Fourier transforming the total current (Equation (7)) and taking its absolute square. This procedure allows us to compare the nonlinear optical response from the monolayer with that from bilayer MoS 2 .

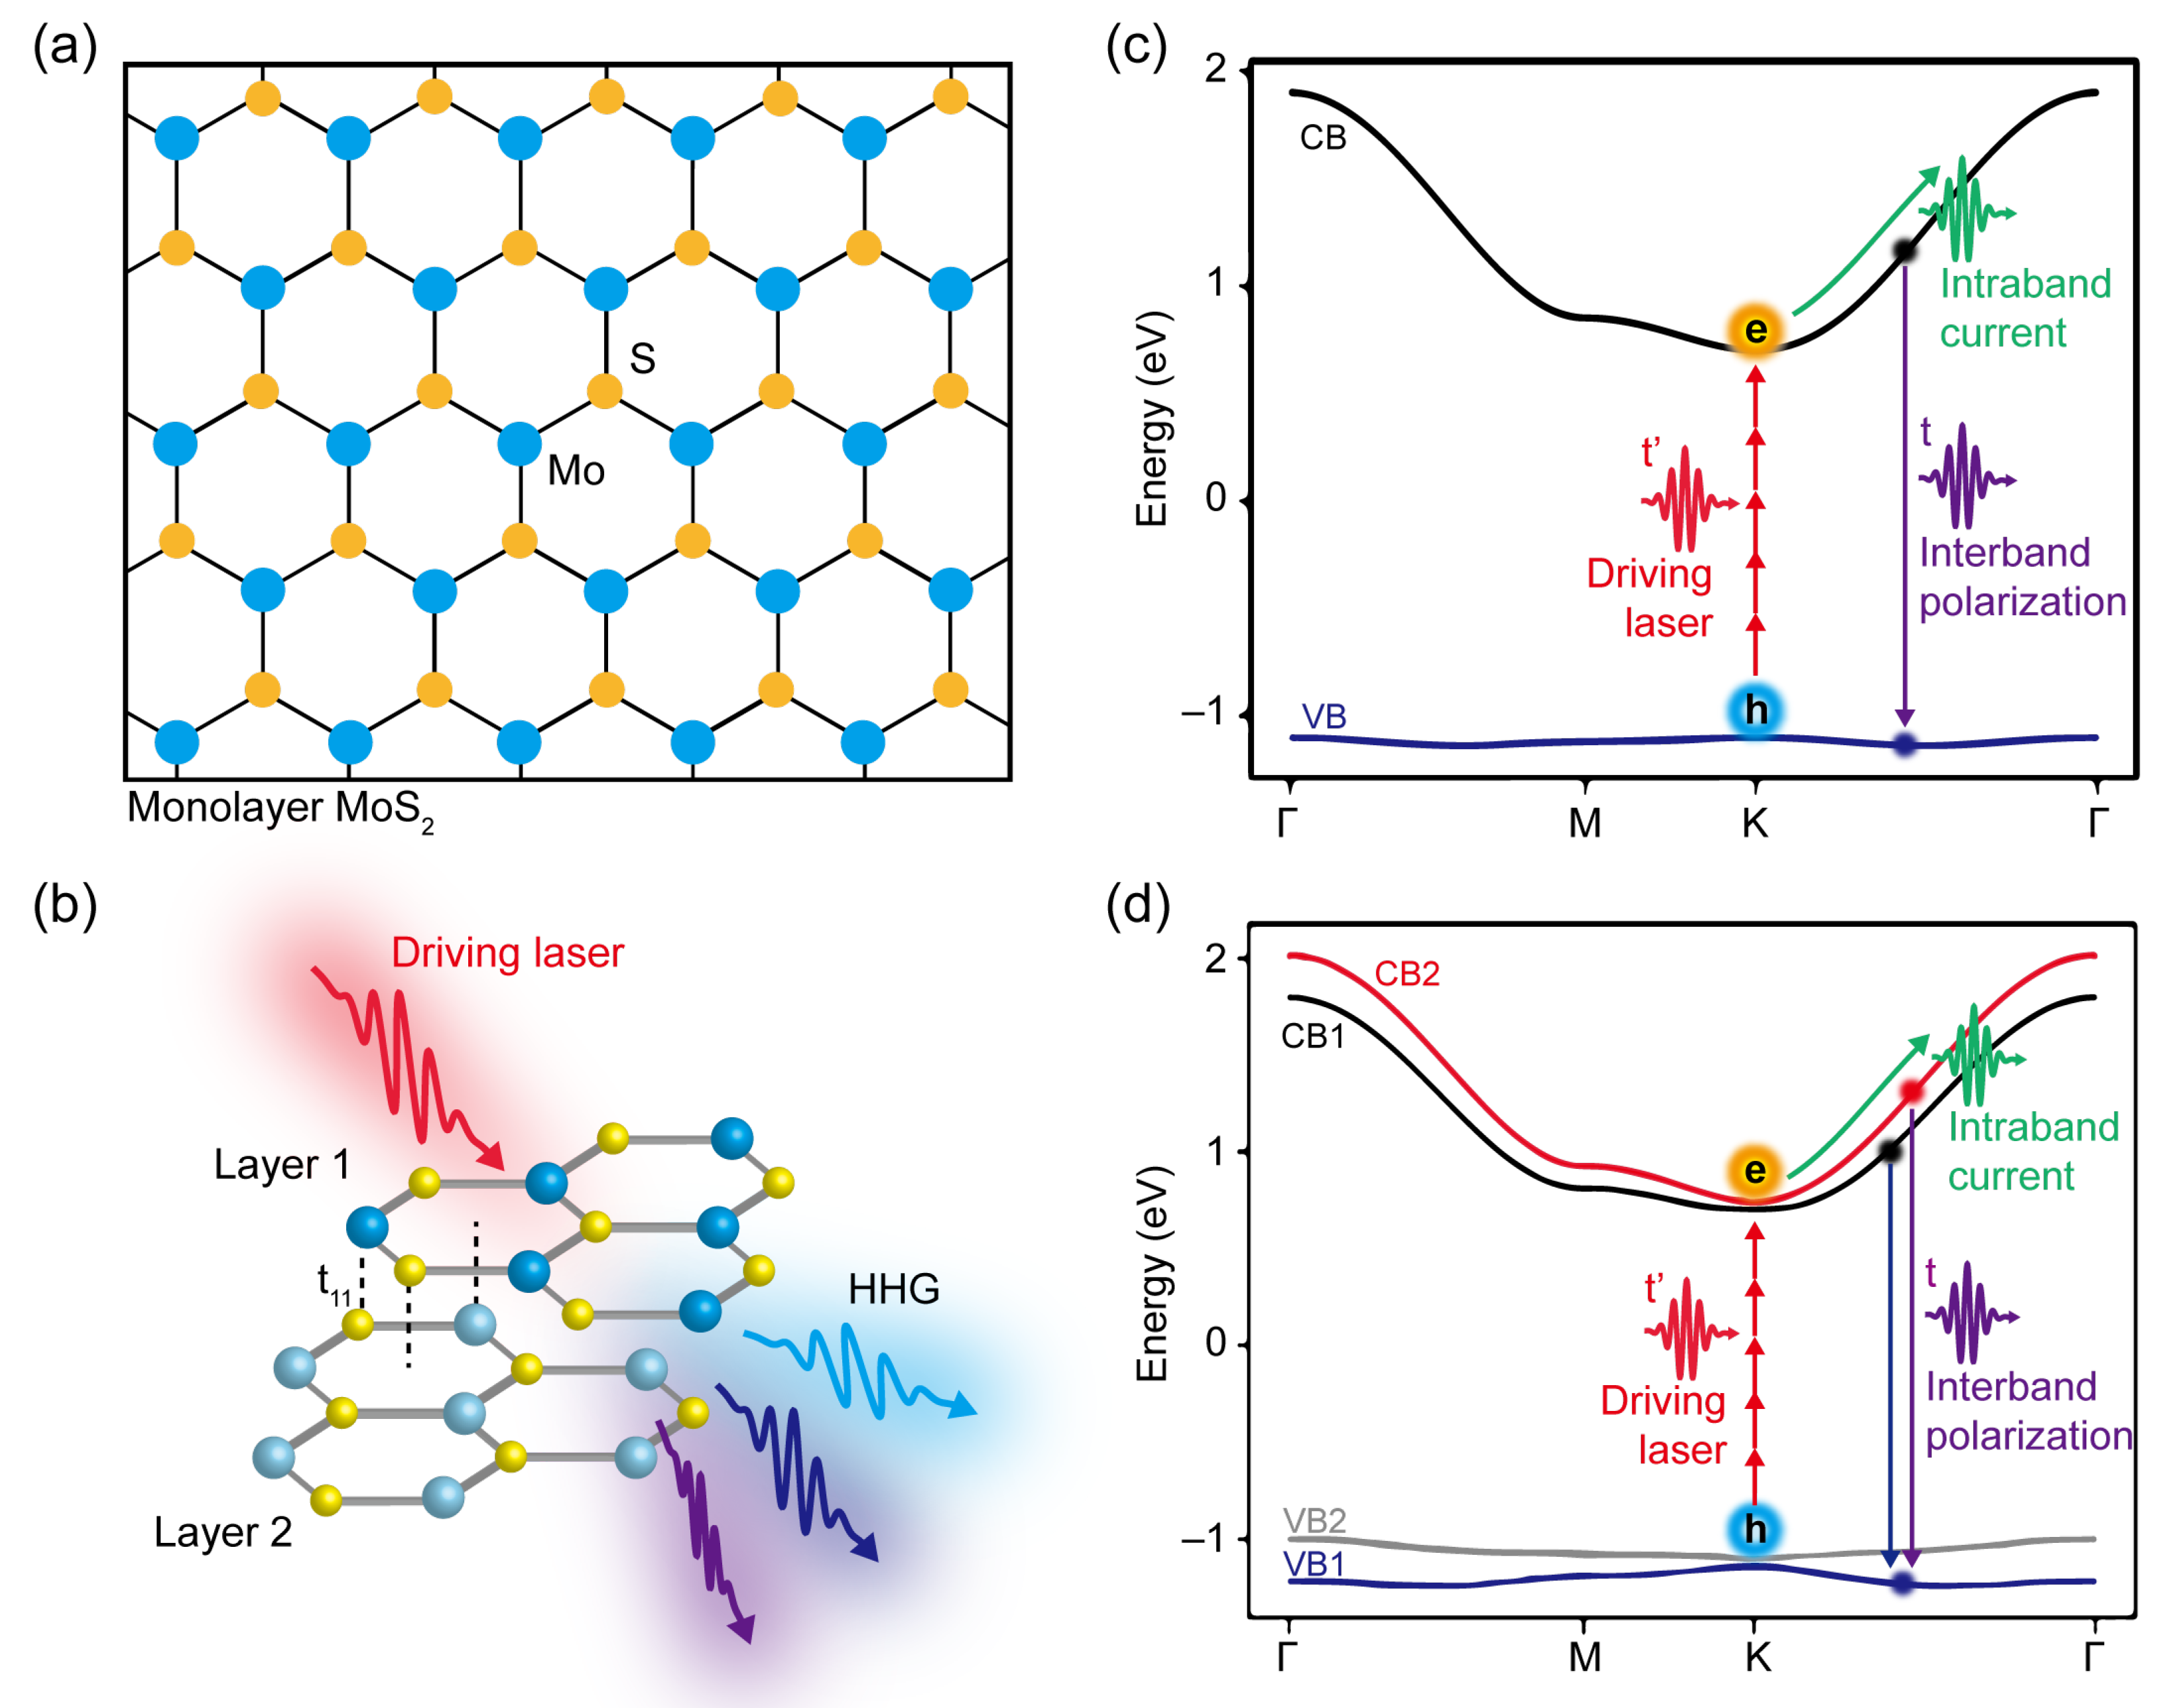
3. Hamiltonian Model for Monolayer and Bilayer MoS 2

According to the tight-binding model (TBM), the laser-free field Hamiltonian H ^ 0 of the monolayer [25] and bilayer of TMDC, under the 3R-polytype symmetry for the bilayer [10,35,36] (Figure 1a,b) is written as:
H ^ 0 = n = 1 N i ϵ n c ^ i n c ^ i n t 1 i , j c ^ i n c ^ j n + i , j t i j c ^ i n c ^ j n + n = 2 N t 11 c ^ i n c ^ j n 1 + h . c .
where summatory indices n, i , j , and i , j are number of layers, the intra-layer nearest-neighbor (NN) and the next nearest-neighbor (NNN) indices. ϵ n is the onside potential of each atom in the lattice. c ^ j n And c ^ i n are the creation operators at the jth lattice site and the annihilation operator at the ith atom of the nth layer (Figure 1a,b, respectively). t 1 , t 2 and t 11 are the hoping parameters of the NN, NNN intra-layers, as well as the inter-layer, respectively [10,25,35].

4. Harmonics from Monolayers and Bilayers

In the following sub-sections, we will demonstrate the high-order harmonics emitted from a monolayer and bilayer MoS 2 subjected to a strong MIR laser-field. In our simulations, we use both a linearly polarized laser (LPL) and a circularly polarized laser-field (CPL). We also analyze the emitted HHG spectra as a function of the interlayer strength t 11 .

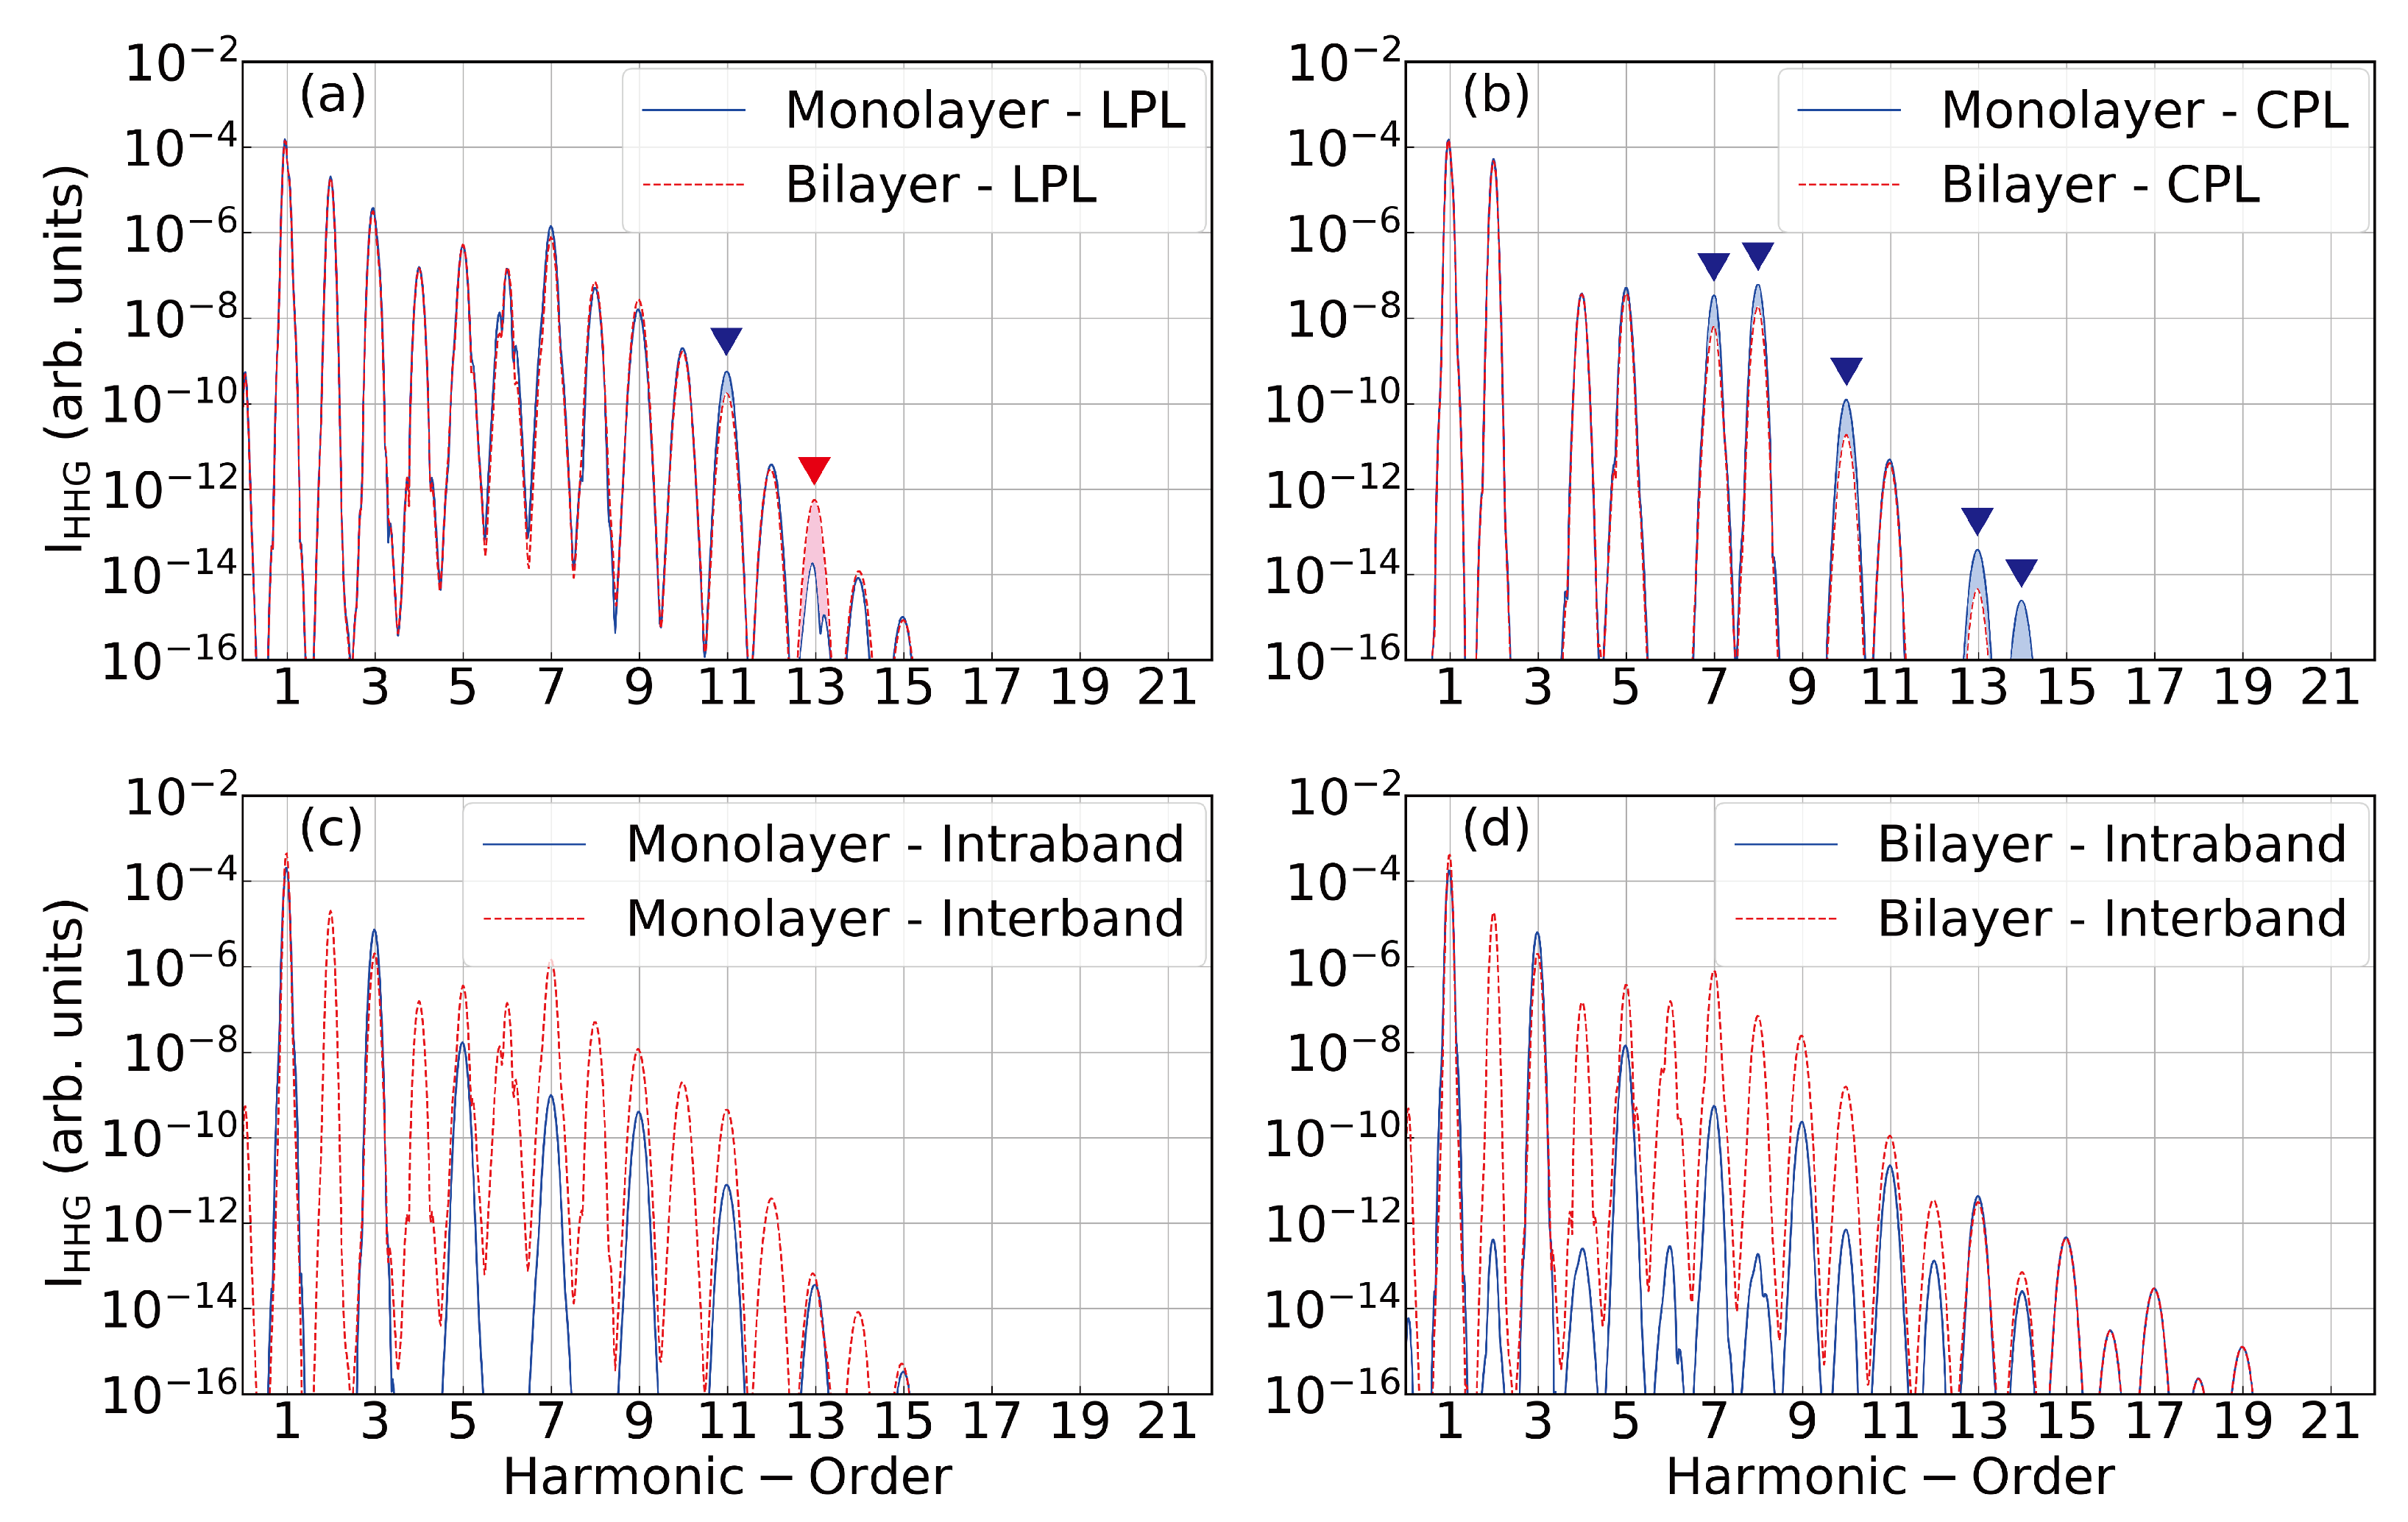
4.1. Response to Linear Polarized Lasers

We begin presenting our numerical results by showing simulated HHG spectra from monolayer and bilayer MoS 2 driven by linearly (or circularly) polarized laser-fields (LPL or CPL) with respect to the Γ –K direction. The results are shown in Figure 2a,b.
The HHG spectra from monolayer MoS 2 show a few differences with respect to the normalized (normalization of the current with respect to the number of layers) HHG from bilayer MoS 2 . In particular, there is no substantial difference in the intensity of HHG emissions below the band gap (harmonic orders ( HOs ) ϵ 0 / ω 0 ). This observation is indicated in blue and red triangles. This result is surprising, since one can intuitively expect that the bilayer will enhance the emission due to more channels for tunneling excitation and interband transition.
By contrast, only the 13th order shows an enhancement of more than one order of magnitude for the MoS 2 bilayer. This can be interpreted to indicate a complex e-h recombination. In addition, Figure 2a shows the same cut-off regions for both monolayer and bilayer geometrical configurations.
This chaotic intensity behavior observed in Figure 2a is rationalized via the selection rules and accumulated phase of the radiation emission, and of course, via the breaking inversion symmetry of the Hamiltonian. These selection rules are imposed by the DTMEs, d m n ( k ) = i u m , k | k | u n , k , and the quasi-classical action phase, S ( k , t , t ) (Appendix B), between conduction and valence bands for the monolayer system with respect to the bilayer system [18,19,30]. We think that the different coherences in the density matrix ρ ^ ( k , t ) lead to larger effects on the 13th-order, from when the interband and intraband contributions take place (Figure 2c,d) [7,15]. While the electron (hole) wavepacket is driven in the conduction (valence) bands and its corresponding dipolar selection rules are shown in Figure A2 (Appendix), these ‘complex propagation’ effects can easily lead to constructive or destructive interfering channels.
These results exhibit even and odd HOs and illustrate the selection rules because the interband currents are governed by the dipole matrix element [34], which breaks the inversion symmetry of the laser-field free Hamiltonian, H ^ 0 ( k ) . In case of the intraband current, which is moving the carrier through energy bands, the HHG spectra show a complete symmetry behavior in the sense that only odd HOs are allowed. For the bilayer case, the interlayer coupling plays the role of mixing bands. Hence, more bands contribute to the HHG process; therefore, the electron paths increase considerably in comparison to the monolayer case. Some electron paths include both inter- and intra-band transition, in other words, the intraband current can be affected by the electrons coming from not only two bands but multiple bands. Thus, interband transition partially contributes to the intraband current. This induces coherences in that the intraband current cannot be perfectly canceled. This leads to weak even harmonics showing up in the bilayer MoS 2 , as shown in Figure 1d.

4.2. Response to Circularly Polarized Lasers

The HHG produced by a contra-wise clock of the circularly polarized laser is shown in Figure 2b. For the different geometrical-phases, i.e., monolayer and bilayer, HHG spectra exhibit interesting differences.
  • A surprising enhancement by almost one order of magnitude in the harmonics emitted around the plateau region is observed between the monolayer and bilayer (see blue triangles),
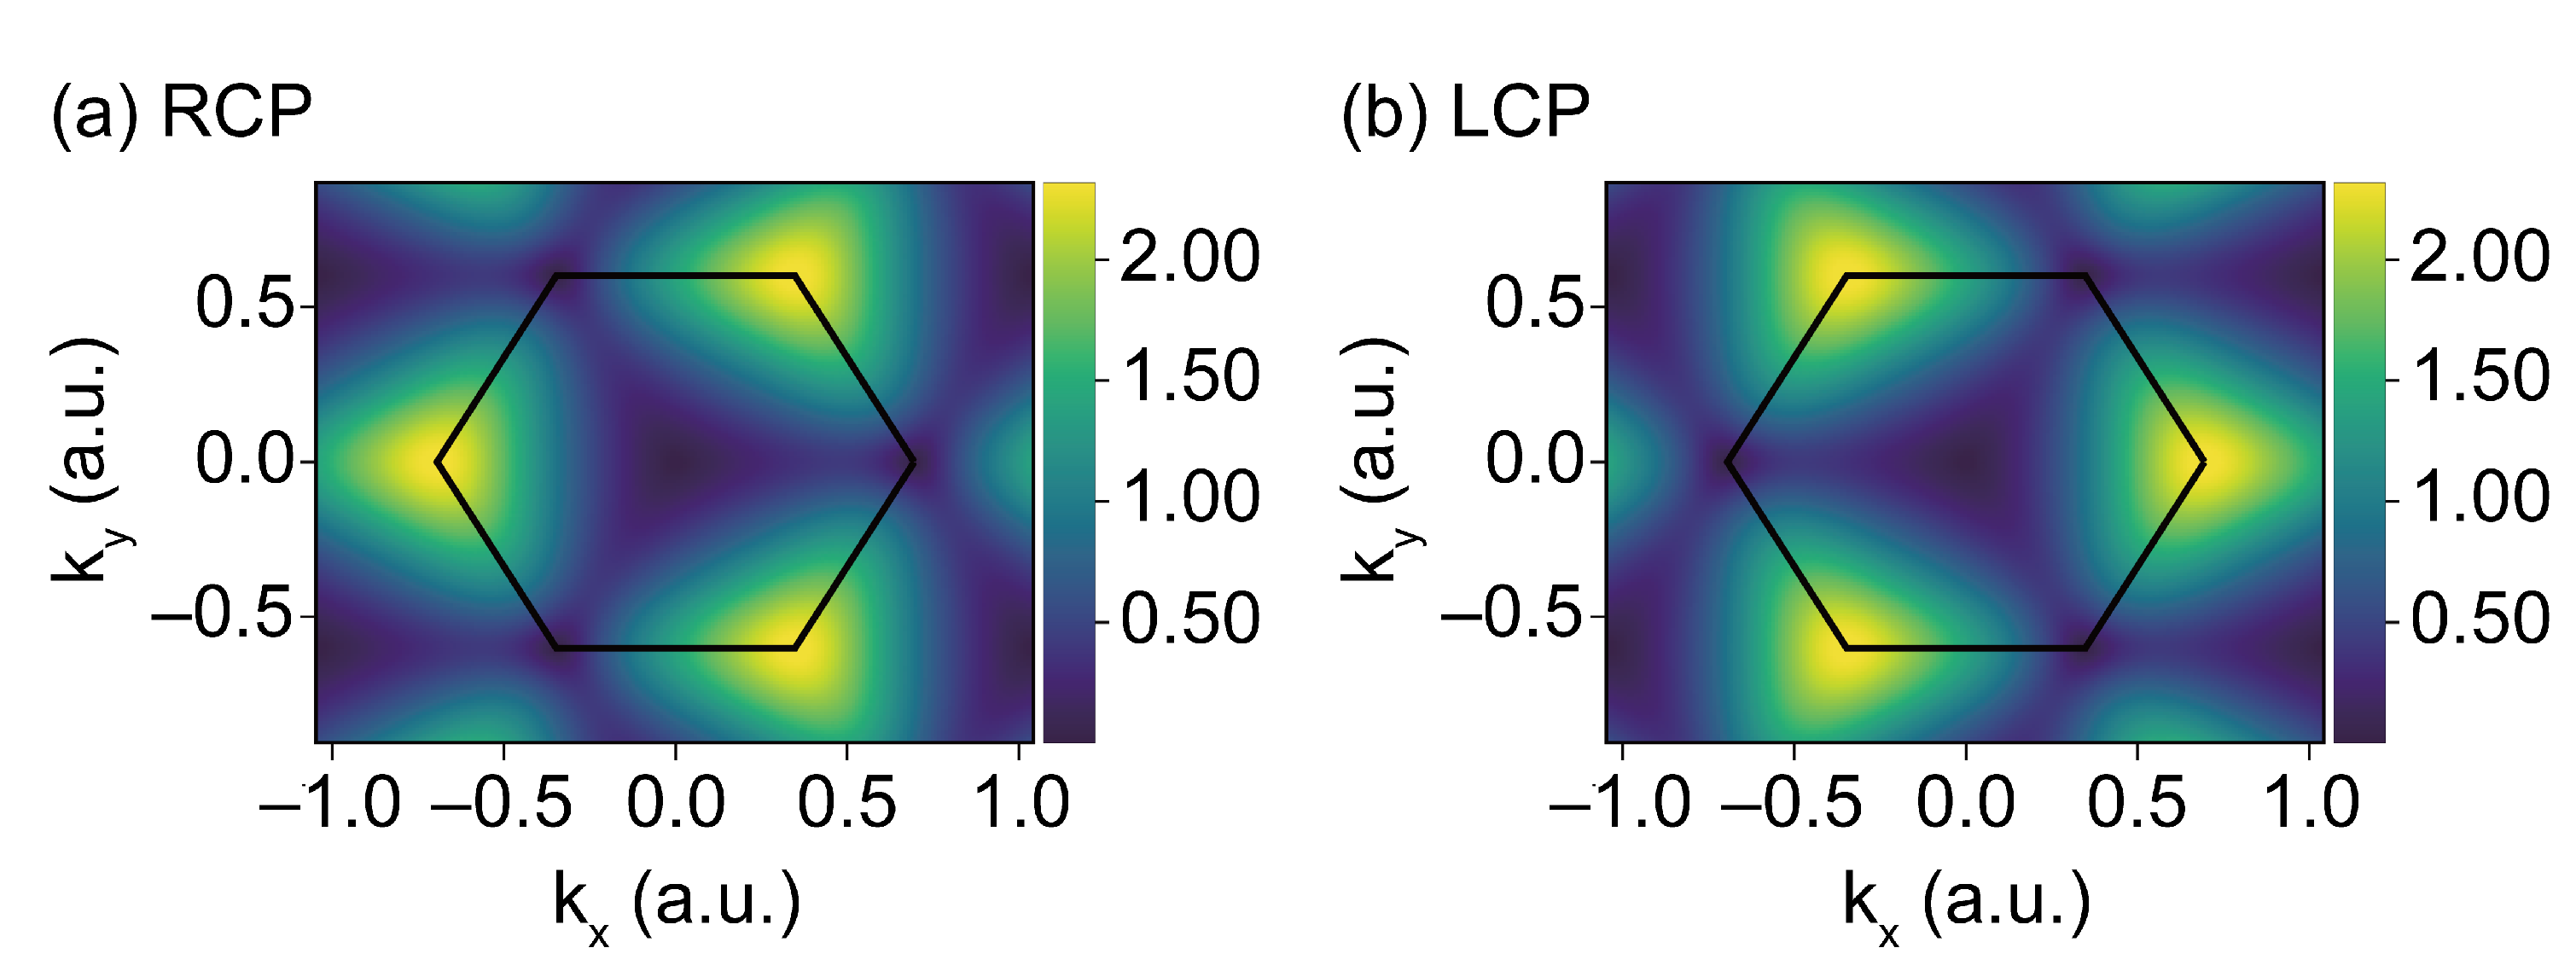
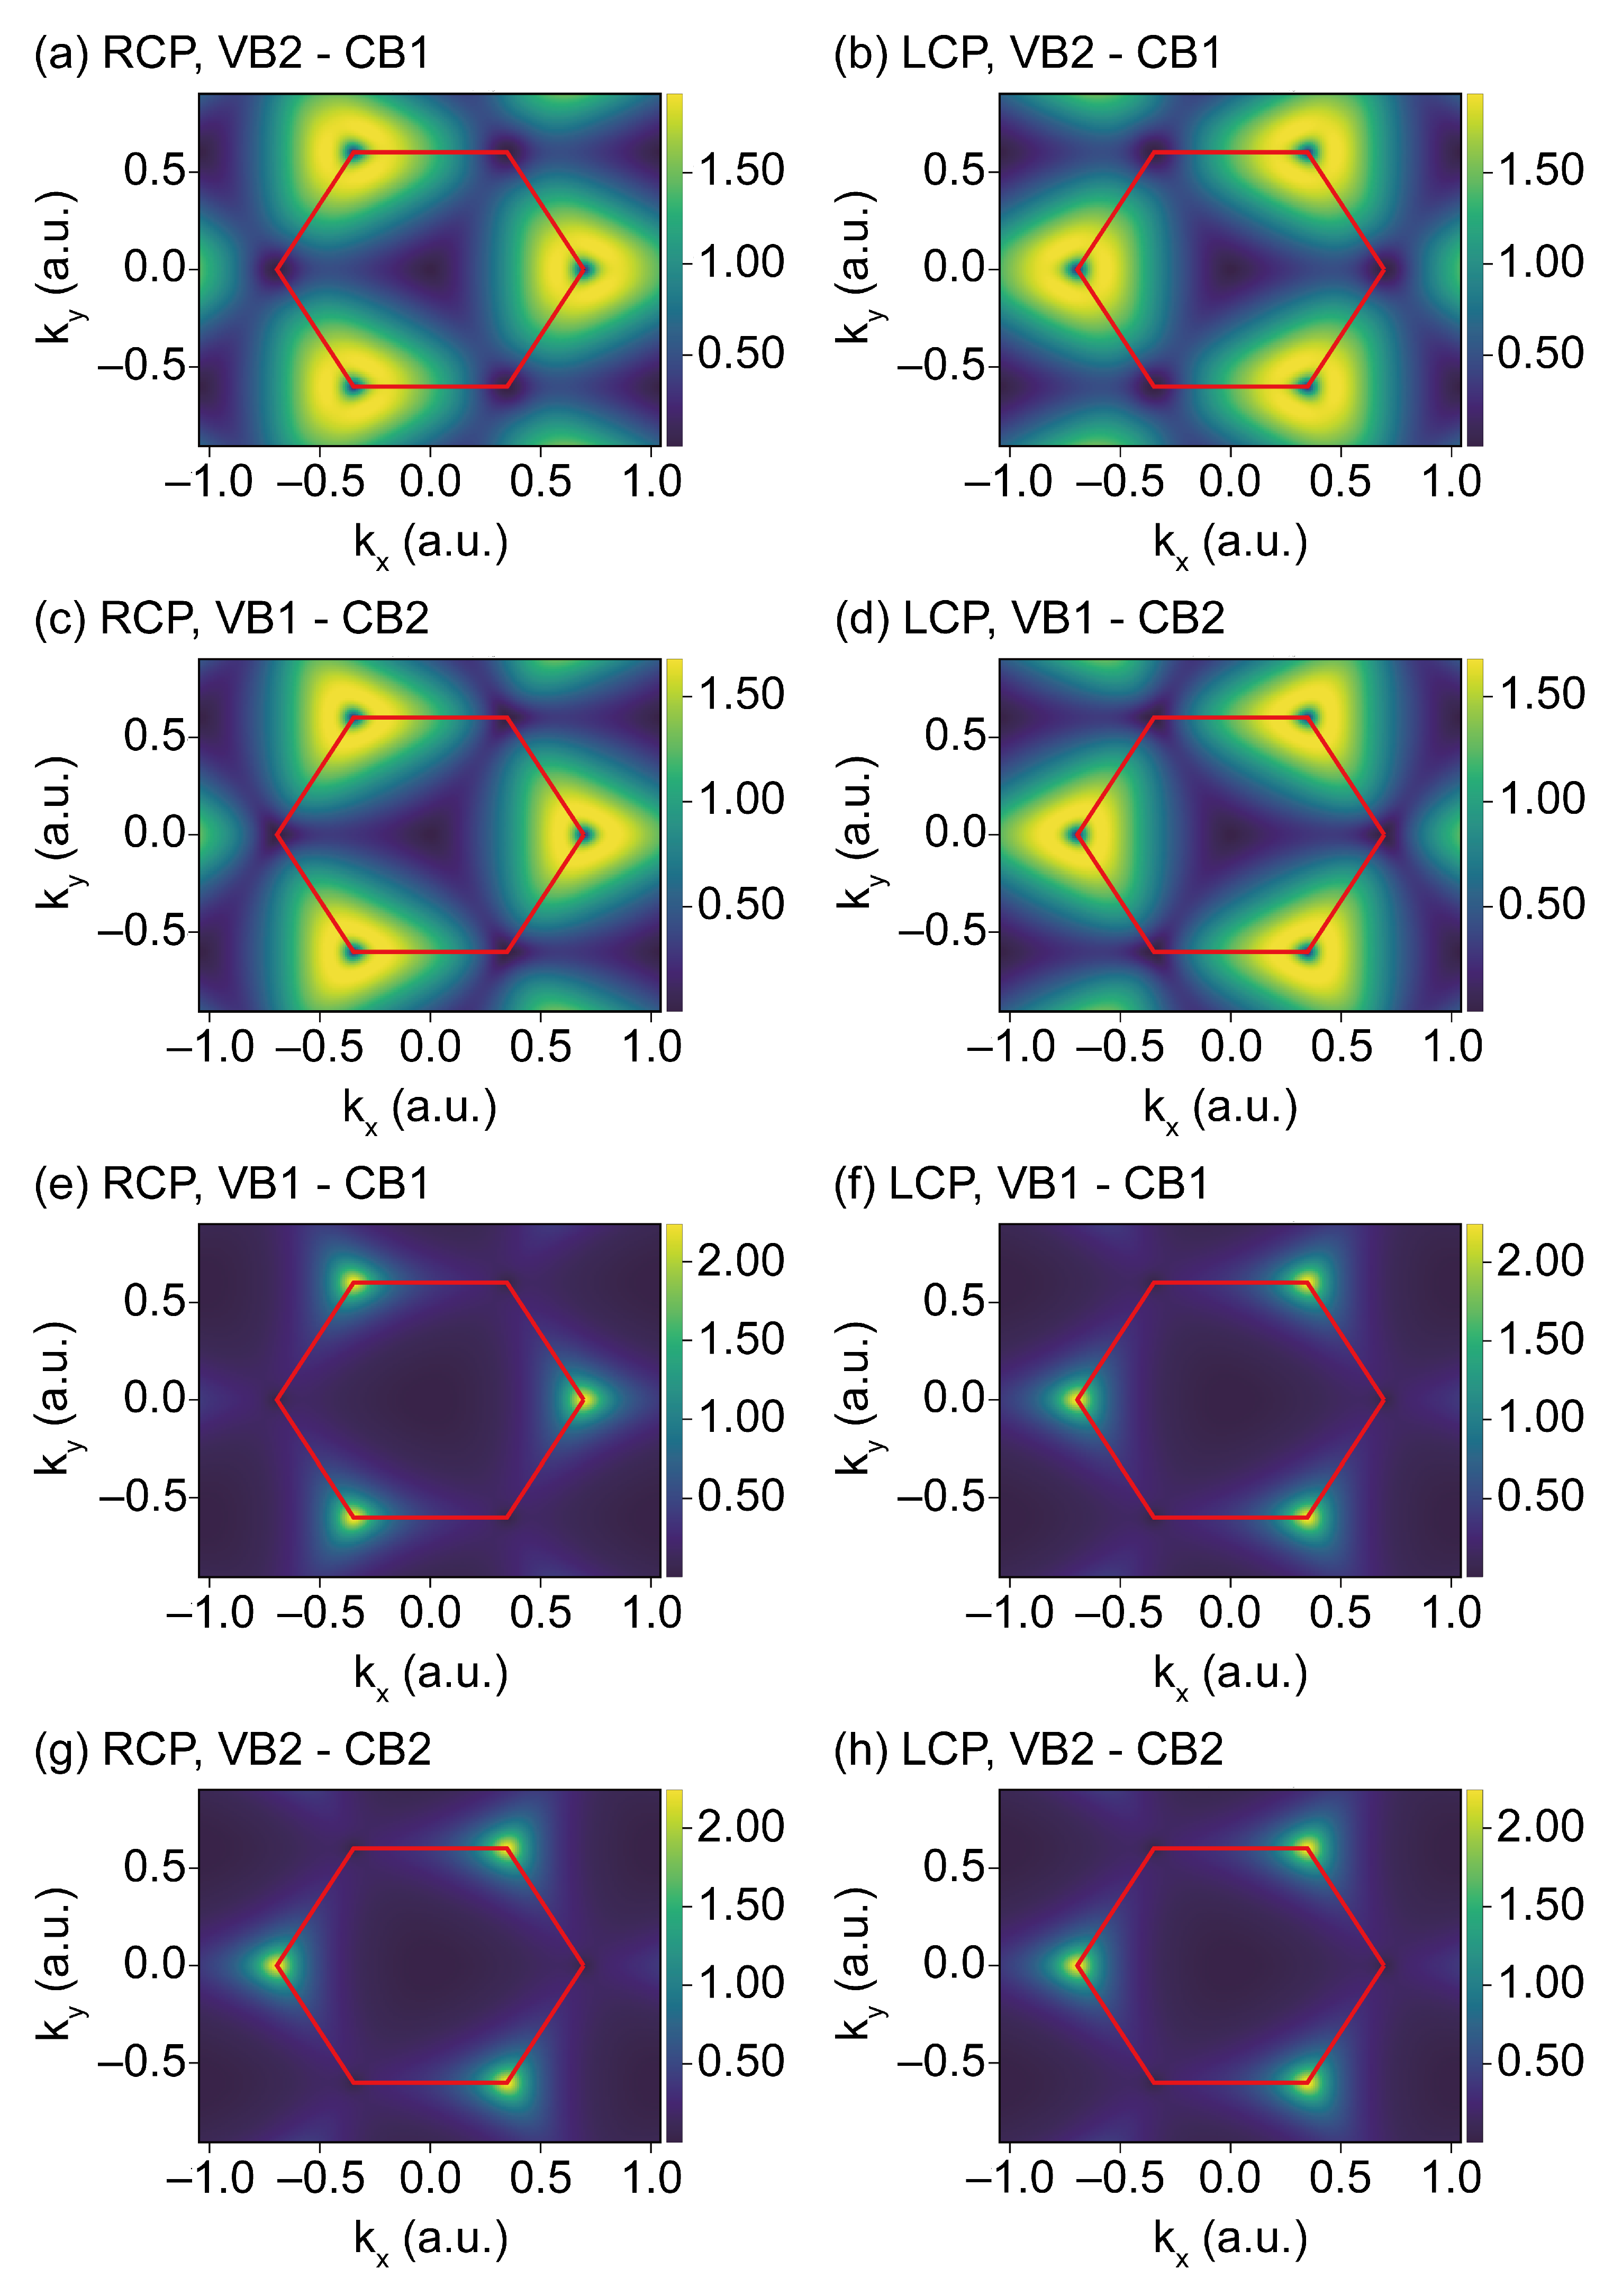
  • All the harmonics follow the three-fold symmetry of the system with the co-rotating ( 3 n + 1 ) and contra-rotating ( 3 n + 2 ) harmonic orders in the plateau region, as has already been experimentally observed in Reference [37] in solids with a three-fold rotational symmetry. Our results fully capture these selection rules. As such, it is clear that circularly-polarized drivers have significant potential in bringing out the signatures between the monolayers and bilayers configurations, their differences and, in particular, the valley index and pseudospin information as a function of the layers [10].
As the selection rules in the HHG spectra are well described for the LPL and CPL, inversion symmetry breaking is manifested in the HHG spectra. This implies that the Berry curvature and the transition dipoles have interesting effects on harmonic emission [16,19,38] for both the monolayer and bilayer MoS 2 . The results shown in Figure 2b can be attributed to Berry Curvature effects about the K’-point in the BZ and the rotation of DTMEs coupled to the CPL and the action phase S ( k , t , t ) (Appendix B.1). Since the dipolar selection rules P m n ( ± ) ( k ) = P m n ( x ) ( k ) ± i P m n ( y ) ( k ) also govern the photon emission via P m n ( ± ) ( k ) (the momentum matrix element is proportional to the dipole transition matrix element d m n ( k ) , obviously the indexes m n [19,34]), the RCP or LCP will excite the e-h about the K’ and K point, respectively. Note, however, that RCP-light will only excite electrons around the K’ points of the BZ as clearly indicated in Figure A2, Figure A3 and Figure A4. The mathematical definition of the CPL selection rule weighs the Berry curvature around the excitation e (h) wave packet and the recombination of the electron and hole. Thus, we find the potential physical picture, which explains approximately the enhancement of the harmonics in the plateau region in monolayer MoS 2 compared to the bilayer.

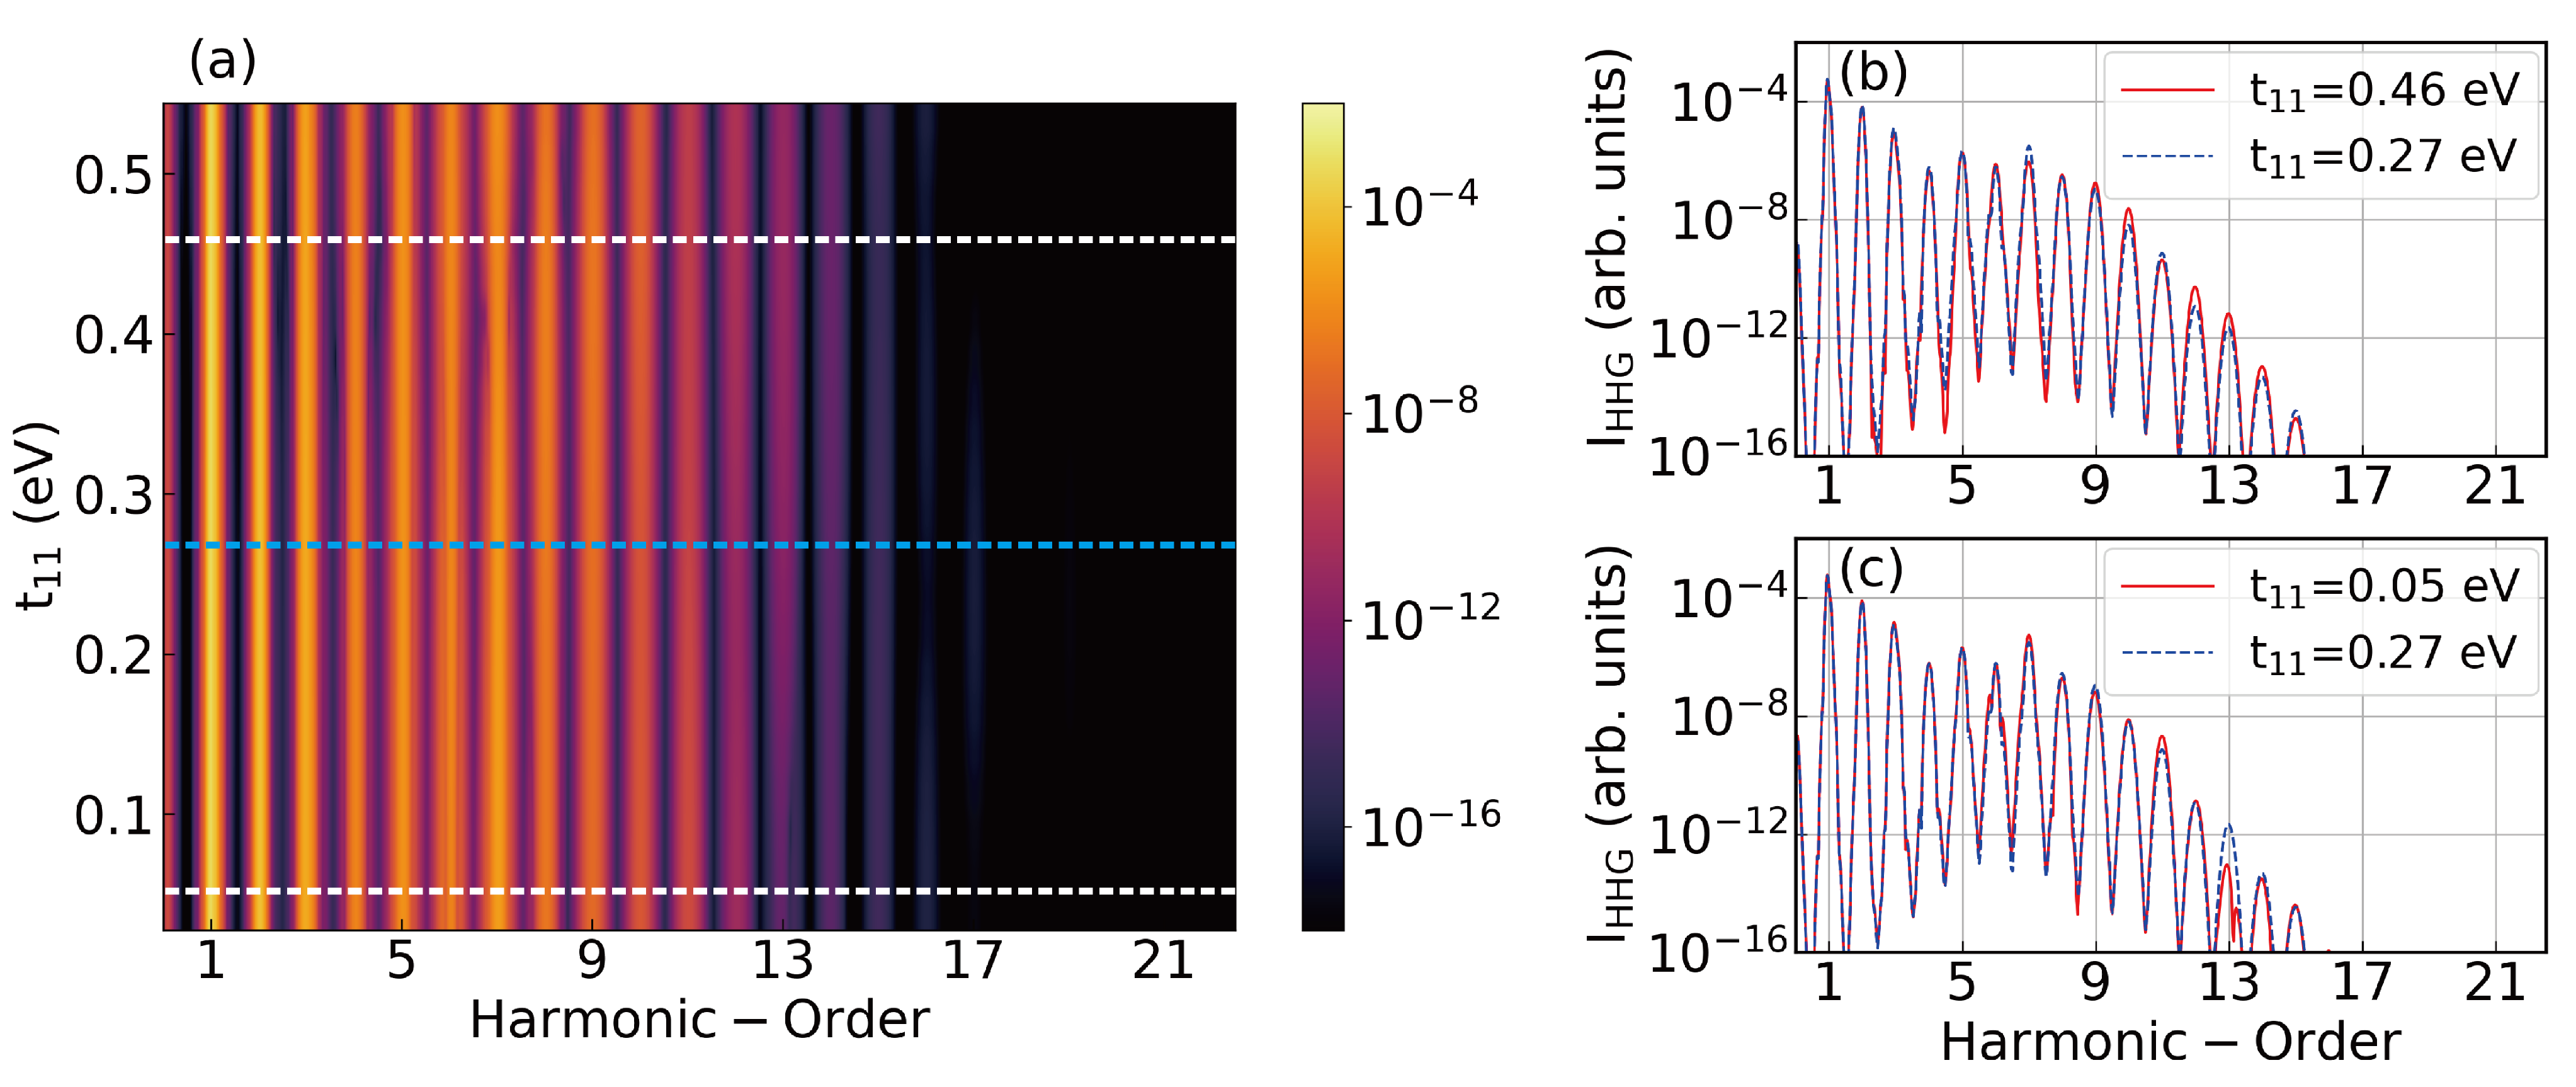
4.3. Interlayer Strength in High-Order Harmonics

Here, we discuss the role of the inter-layer parameter t 11 in the HHG spectra.
Figure 3 reports the HHG spectra as a function of the inter-layer interaction t 11 . We find small differences in the range of t 11 = 0 , 0.55 eV. This range of t 11 is logically expected to be in the order of the magnitude of the NN parameter t 1 . Naturally, the coupling between the atoms Mo of Layer1 and S of Layer2 is not strong enough within our approximation to observe dramatic modifications on the HHG spectrum for the bilayer MoS 2 (see Figure 3a–c, as well as their corresponding comparisons between the approximated interaction strength of t 11 0.27 , 0.46 and 0.05 eV, respectively). However, note that once the interaction strength t 11 increases up to 2–3 eV, dramatic differences are observed between the monolayer and bilayer MoS 2 . We did not present or address this result, since it is unlikely that the interplay hopping interaction will reach such a large energy value of 2 or 3 eV.

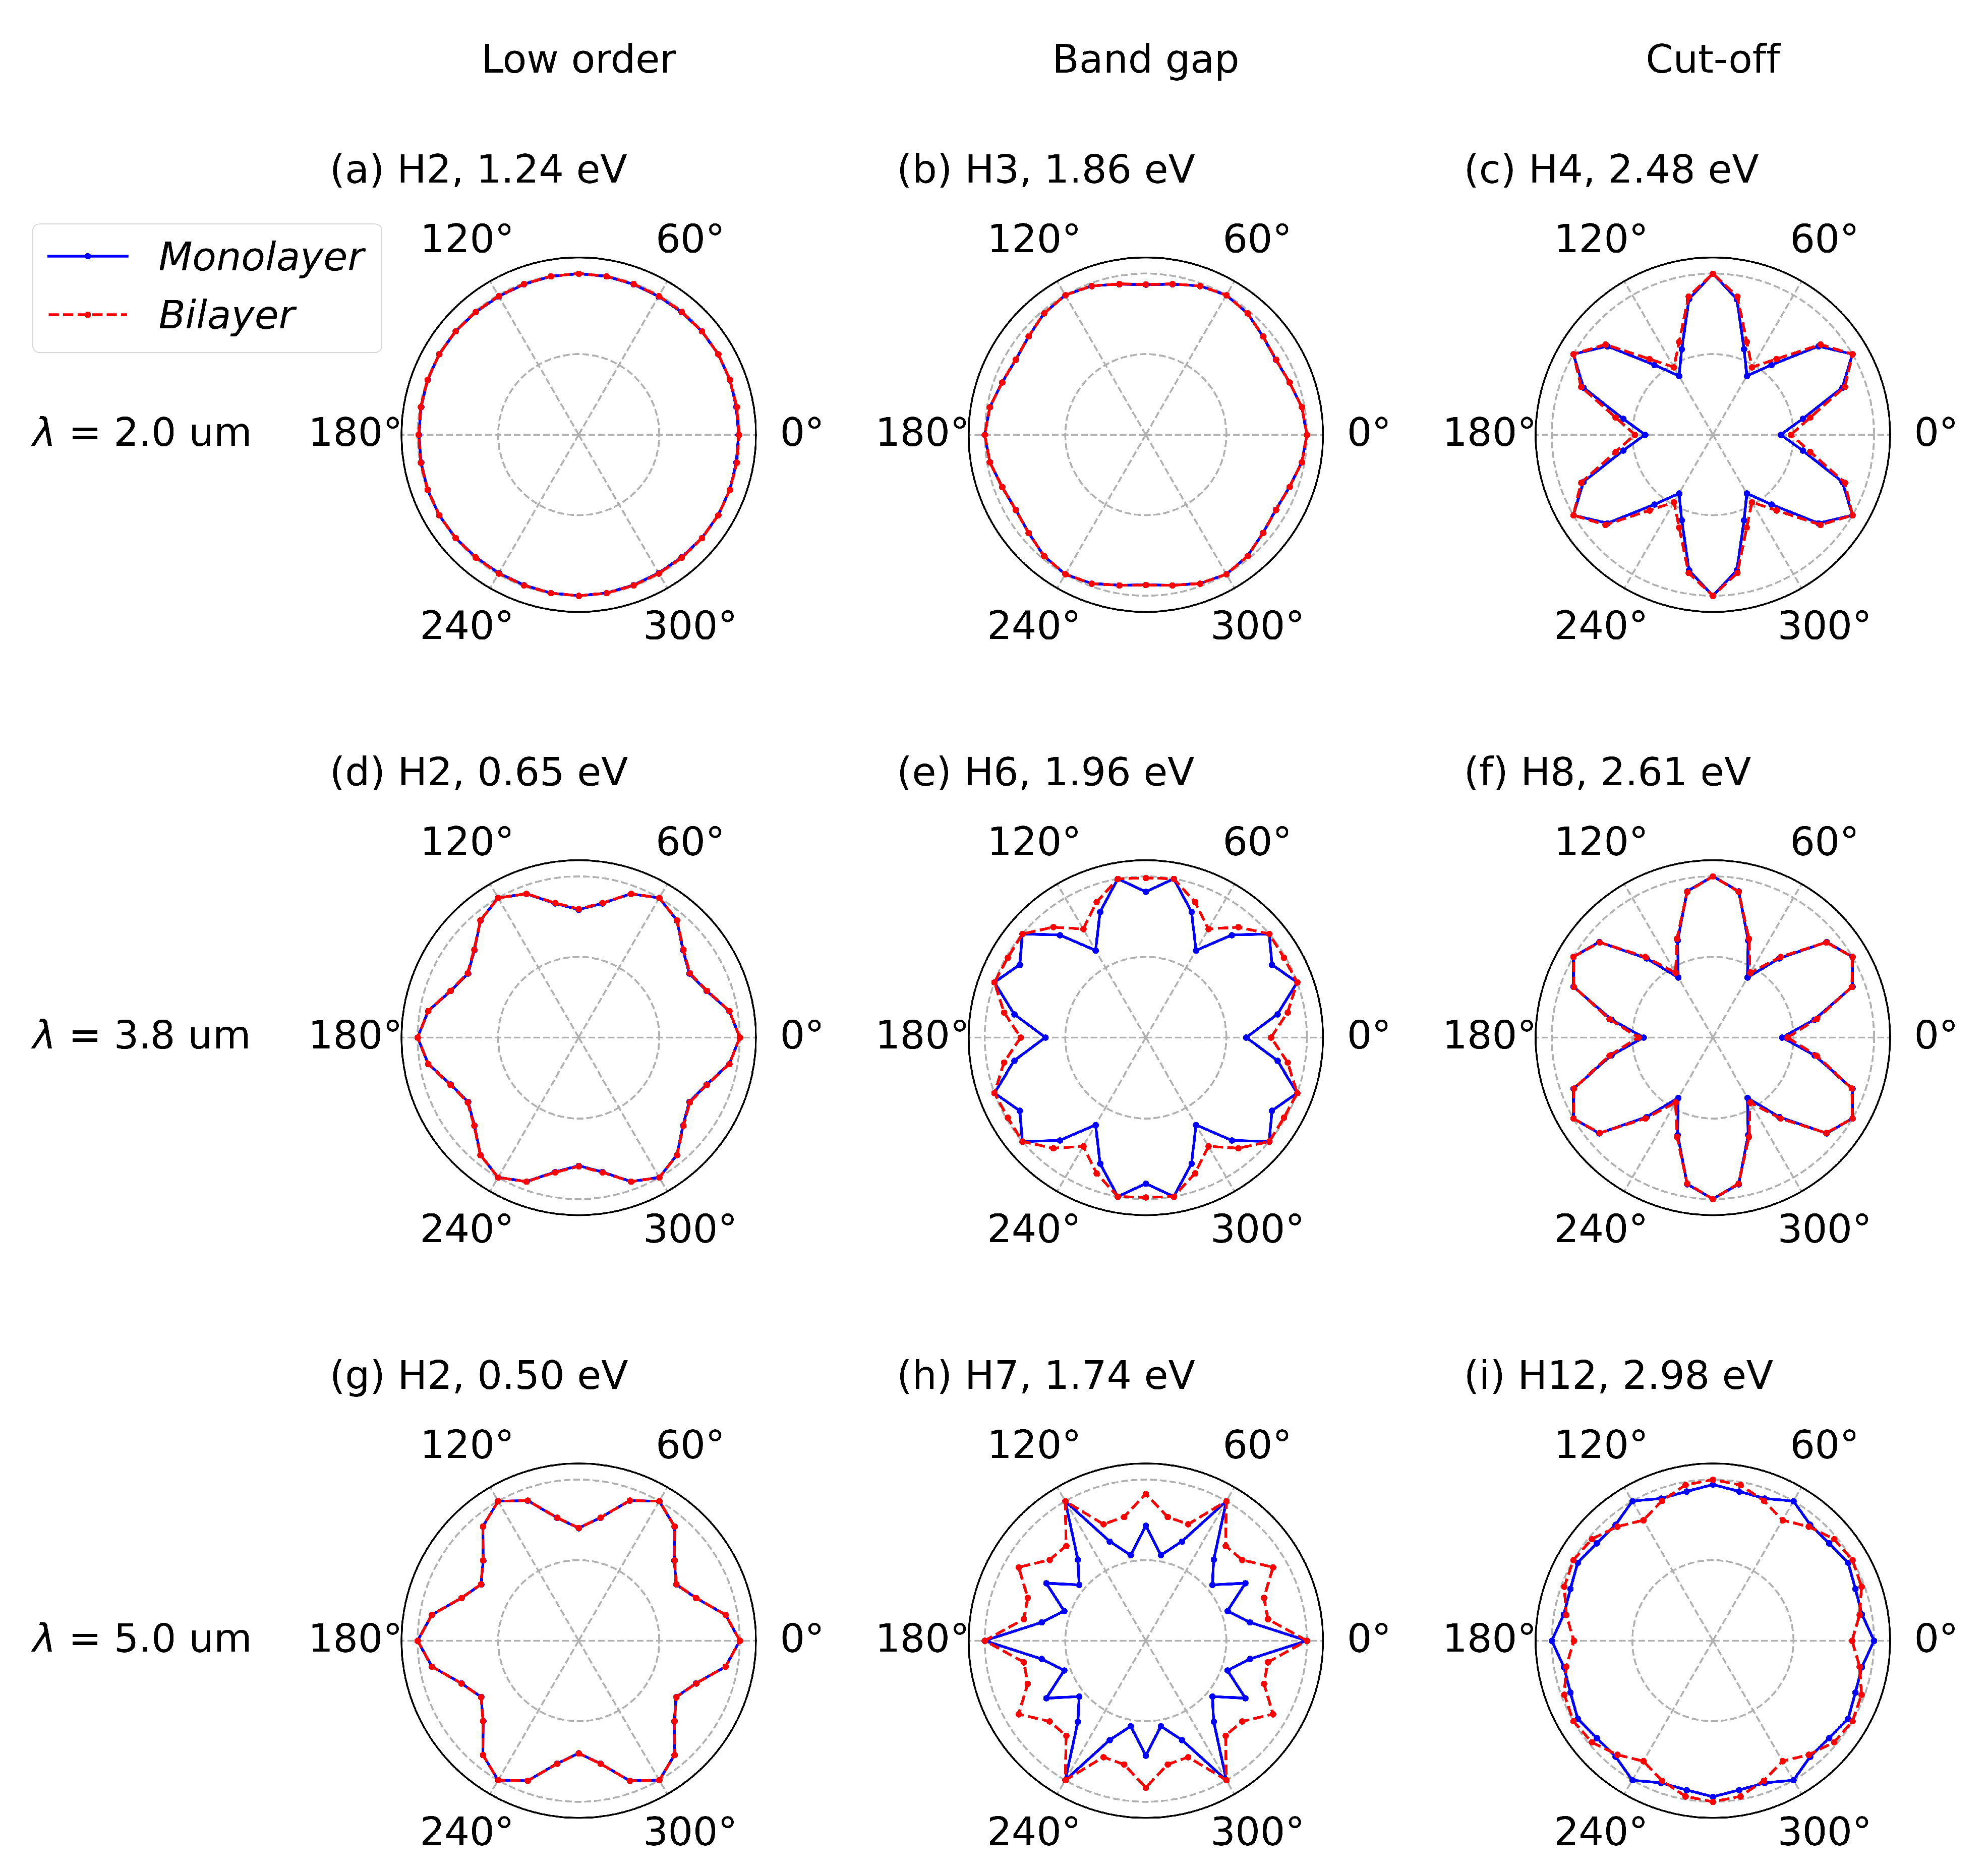
4.4. Structural Angular Rotation of the High-Order Harmonics

Now we explore the angular rotation of HHG emission for low HOs (those below the band gap), the plateau and the cut-off region as a function of the laser wavelength. We also study the response of the HHG spectra as a function of the ellipticity of the laser for the monolayer and bilayers of MoS 2 . This interestingly links our model’s pseudospin and valley effects to the HHG signal. The angular rotation of the harmonic orders is another interesting quantity, which might contain information of the band energy structure, the dipole matrix element and the Berry Curvature as well as [2,16,24,39,40,41]. Therefore, we calculate the angular rotation of the harmonics using the following procedure: (1) the electric field, E ( t ) , of the driving laser is linearly polarized at an angle of θ 0 with respect to the Γ –K crystal orientation (x-direction on the k x , k y crystal momentum space), (2) we project the resulting charge current components J x ( t ) and J y ( t ) with respect to the laser orientation to obtain parallel J ( ω ) and perpendicular J ( ω ) components with respect to the violet laser polarization to obtain parallel J ( ω ) and perpendicular J ( ω ) components [24], (3) we then compute the angular rotation of the harmonic orders for the parallel and perpendicular components as a function of the laser wavelengths for low HOs, the band gap and the cut-off region of the HHG spectra. As a result, total HHG, I HHG ( ω , θ 0 ) = | J | 2 ( ω , θ 0 ) + | J | 2 ( ω , θ 0 ) are shown in Figure 4.
The second-order shown in Figure 4a,d,g for different laser wavelengths can be understood in terms of DTMEs and its selection rules. The DTMEs show, in Figure A2, a star-like structure for the monolayer and bilayer of MoS 2 . The difference comes from the selection rules and the laser via the Bloch theorem in the BZ, i.e., k = k 0 + A ( t ) A ( t ) , where k 0 and t are the excitation crystal momentum and time, and t is the emission time. A ( t ) is the vector potential of the laser field E ( t ) = t A ( t ) . Additionally, we can understand the difference easily by applying perturbative theory to our formalism. Note, however, that this is out of the scope of the current paper.
The most interesting aspect of this angular analysis, in between the mono and bilayer of MoS 2 , is: the angular rotation of the harmonic orders around the band gap depicted in Figure 4e,h, especially for driven wavelengths λ 0 = 3.8 and 5.0 μ m at HO6th and HO7th, respectively.

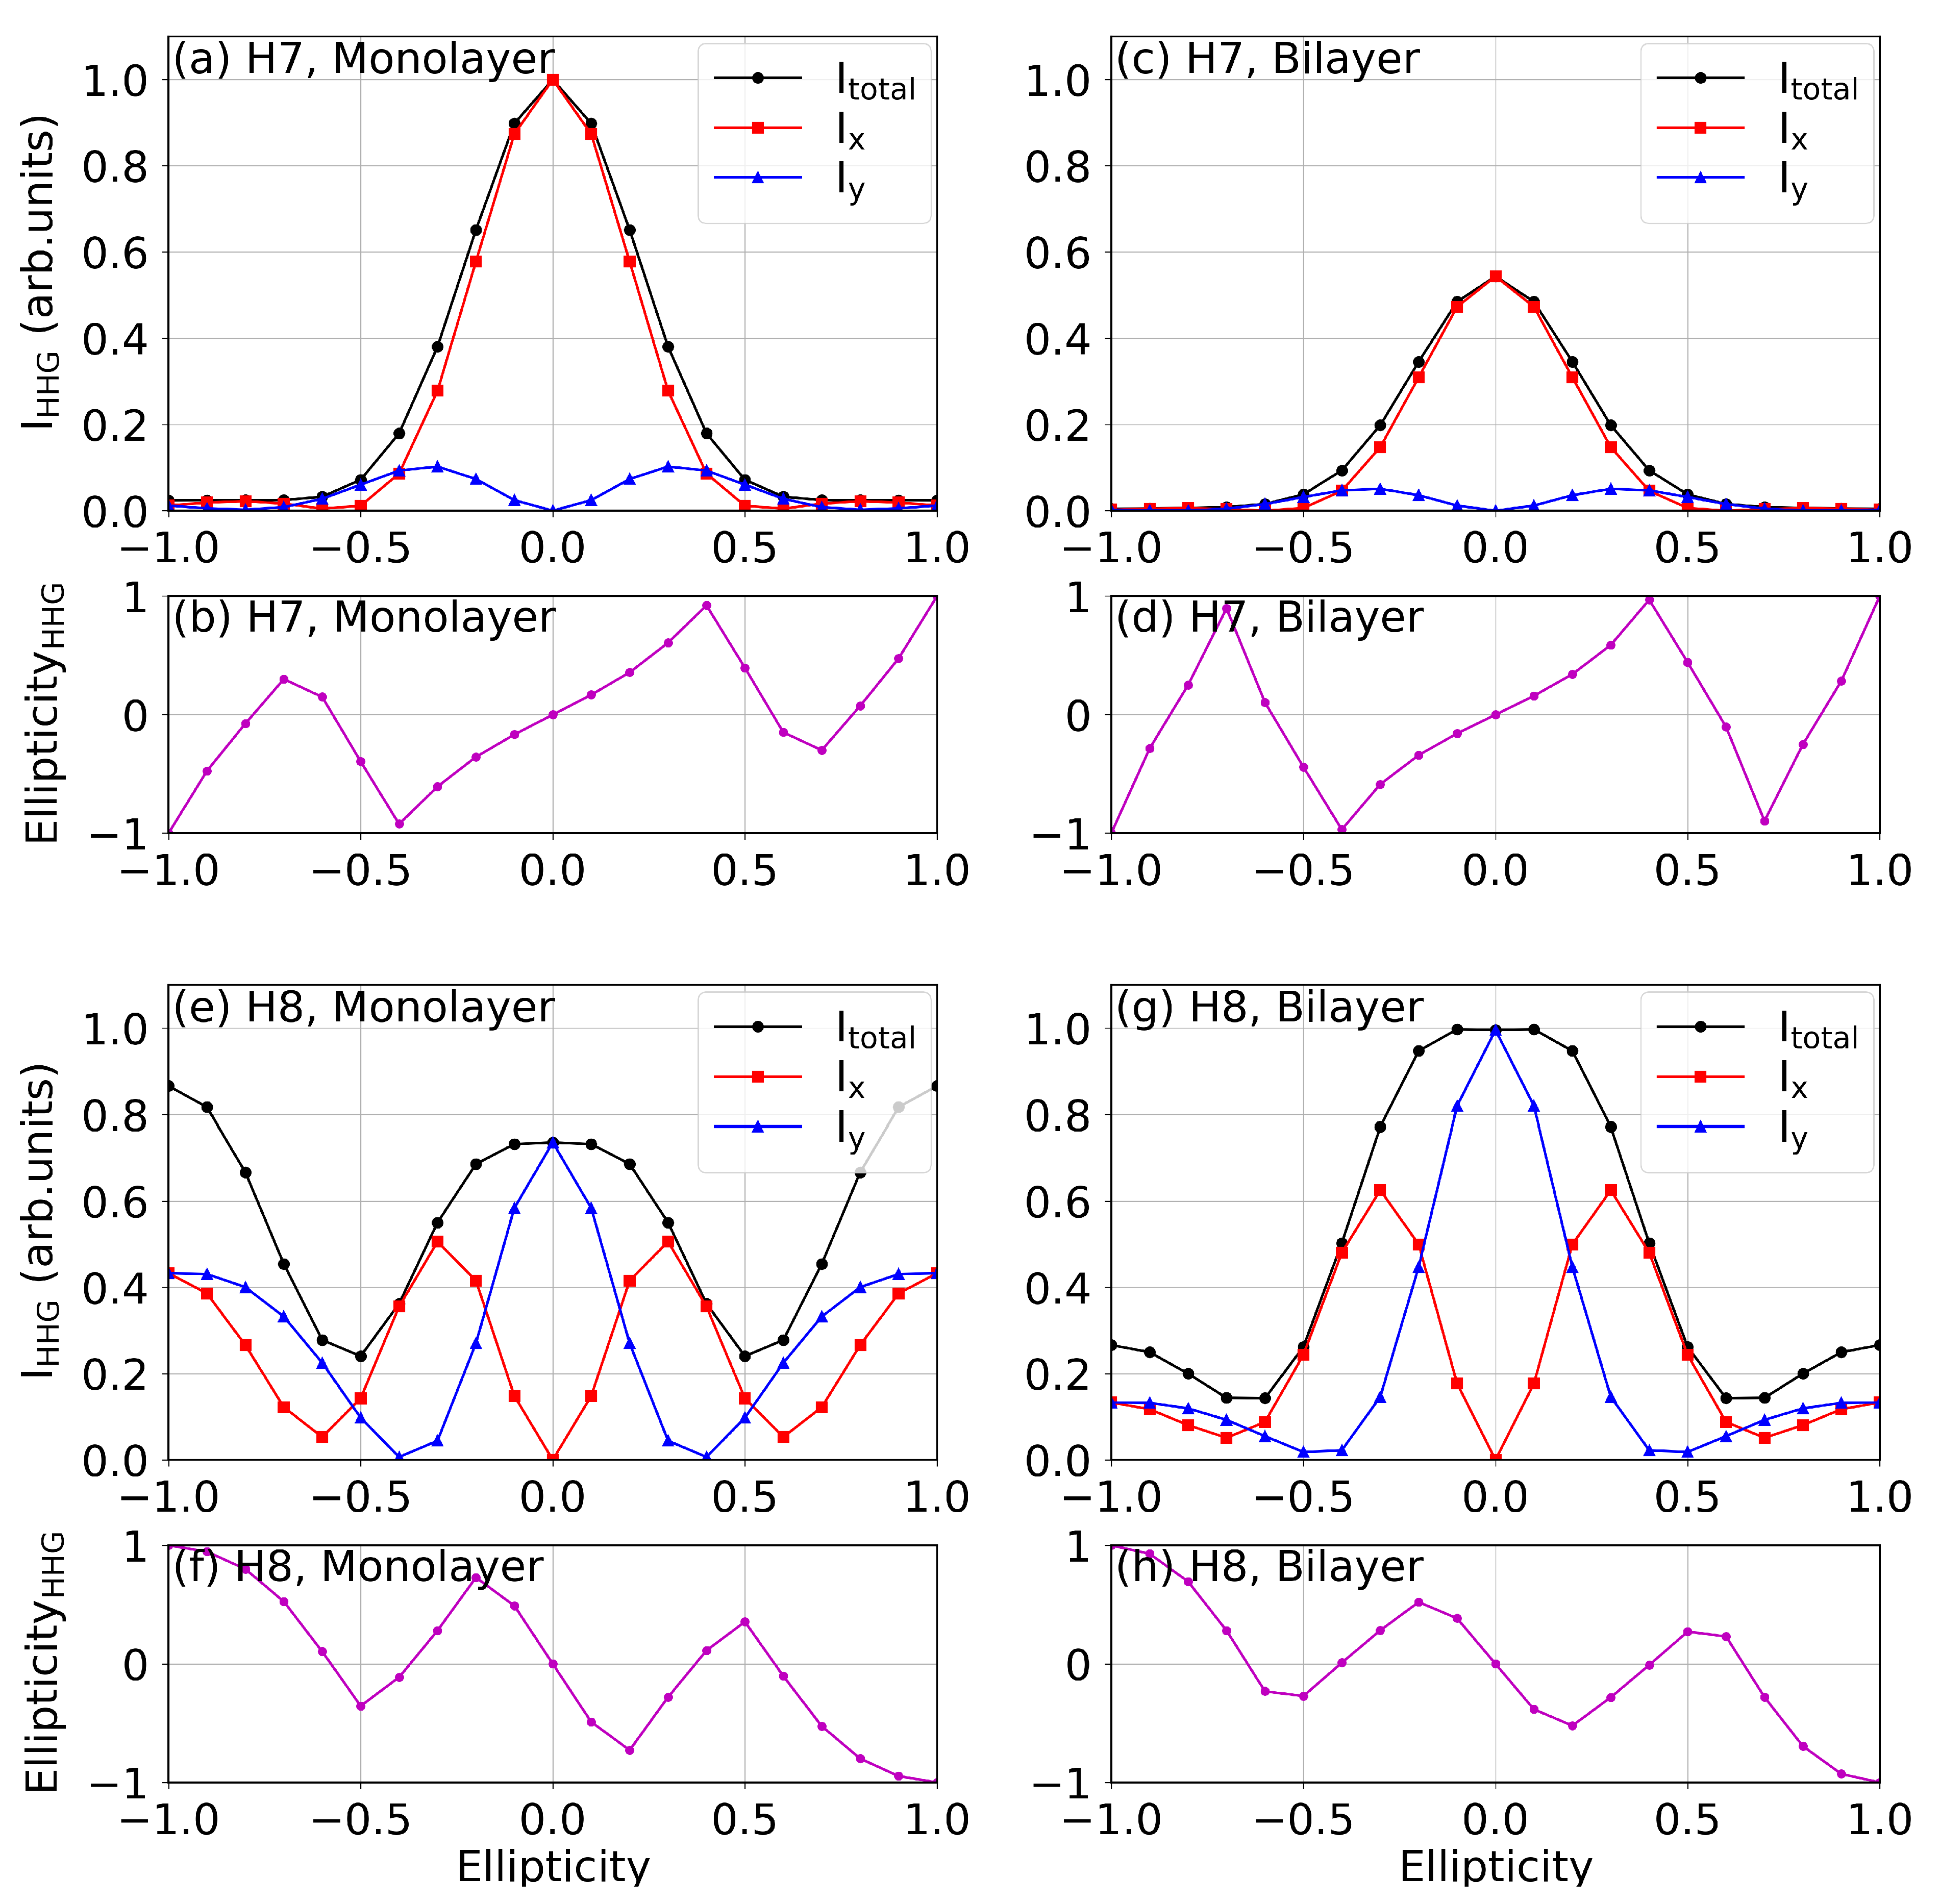
4.5. Ellipticity Dependence of Low- and High-Order Harmonics

In this section, we present the result of the HHG spectra as a function of the ellipticity ε of the driving-MIR laser. This ε takes values between ε = 1 , 0 , 1 , meaning left-circularly polarized-laser (LCP), linear-polarized laser (LPL) and right-circularly polarized-laser (RCP).
Figure 5 shows the calculated HHG spectra for co-rotating the harmonic order (HO7th) and contra-rotating harmonic order (HO8th) between the monolayer and bilayer of MoS 2 .
Two harmonic orders, HO7th and HO8th, show interesting differences as a function of the ellipticity of the incoming laser for both the monolayer and bilayer of MoS 2 . In Figure 5a–d, the ellipticity of the HO7th with respect to the ellipticity of the laser is shown. We observe almost the same tendencies with the difference that the emission yield from the monolayer is larger with respect to the bilayer emission for the LPL. The harmonic yield of the LCP vs. RCP is almost zero in both monolayer and bilayer cases (Figure 5a,c).
The HO8th, contra-rotating order with respect to the incident RCP (LCP), shows an impressive enhancement at ε = ± 1 (Figure 5e) for the emission from monolayers. In contrast, the yield of HO8th for the bilayer MoS 2 shows a dramatic reduction of 67% in comparison to the monolayer case (Figure 5g).
Finally, the contra-rotating harmonic order exhibits totally different ellipticity from the co-rotating HO. This is expected, according to the selection rules (Figure A3,Figure A4,Figure A5). The quasi-classical action phase, S ( k , t , t ) (see Equation (A2)), allows us to link this signature to pseudospin localized at K’ or K valley. The valley index τ can be associated with the ellipticity analysis of the HOs of Figure 5f,h with signs of the Berry curvatures for mono and bilayer MoS 2 at the K or K’ points.

5. Conclusions and Outlook

In summary, our theory shows that the high-harmonic generation (HHG) spectrum is:
  • Capable of observing differences of the nonlinear optical emission related to the band gap between monolayers and bilayers of TMDCs.
  • Capable of describing a unique difference between the angular rotations and ellipticity dependence of the emitted harmonics as a function of the number of layers concerning the ellipticity of the laser, via the selection rule of the dipole matrix element and Berry Curvature to a linear and circularly polarized laser beam.
  • Susceptible to breaking the inversion symmetries (IS, respectively) and thus sensitives to the Berry Curvature and its pseudospin character.
These features promise the applications of the TMDC into spin-valley manipulation of the information, thanks to its geometrical and pseudo metallic properties. The TMDC in 2D can especially exhibit topological insulating phases, making them attractive for quantum computing, storage of information, and other applications [25]. Finally, it is important that all of these ideas can be applied in quantum simulators [42], in particular using ultracold atoms and lattice shaking [43], as well as Rydberg atoms, polaritons, or circuit QED [44,45,46,47,48,49]. The usage to study strong-field phenomena is an emerging application of the spintronic and valleytronic technological advances [50,51,52]. Since the pseudospin is related to magnetic properties and is naturally suited to the study of the ordered system, it should provide additional clarity to the role of pseudospin couplings and valley indexes in high-harmonic emissions.

Author Contributions

Data curation and visualization, Y.L.; formal analysis and investigation, D.K.; methodology and writing—original draft, A.C.; project administration and funding acquisition, D.-E.K., Y.L. and D.K. contributed equally to this work as first authors. All authors have read and agreed to the published version of the manuscript.

Funding

The work has been supported in part by Grant No 2016K1A4A4A01922028 (the Max Planck POSTECH/KOREA Research Initiative Program), Grant No 2020R1A2C2103181 through the National Research Foundation of Korea (NRF) funded by the Ministry of Science and ICT, and Korea Institute for Advancement of Technology (KIAT) grant (No. P0008763, The Competency Development Program for Industry Specialists) funded by MOTIE.

Institutional Review Board Statement

Not applicable.

Informed Consent Statement

Not applicable.

Data Availability Statement

Not applicable.

Acknowledgments

We thank the Max Planck Institute for the Structural Dynamics of matter (MPI-SD) for providing generous computational resources for the intense calculation.

Conflicts of Interest

The authors declare no conflict of interest. The funders had no role in the design of the study; in the collection, analyses, or interpretation of data; in the writing of the manuscript, or in the decision to publish the results.

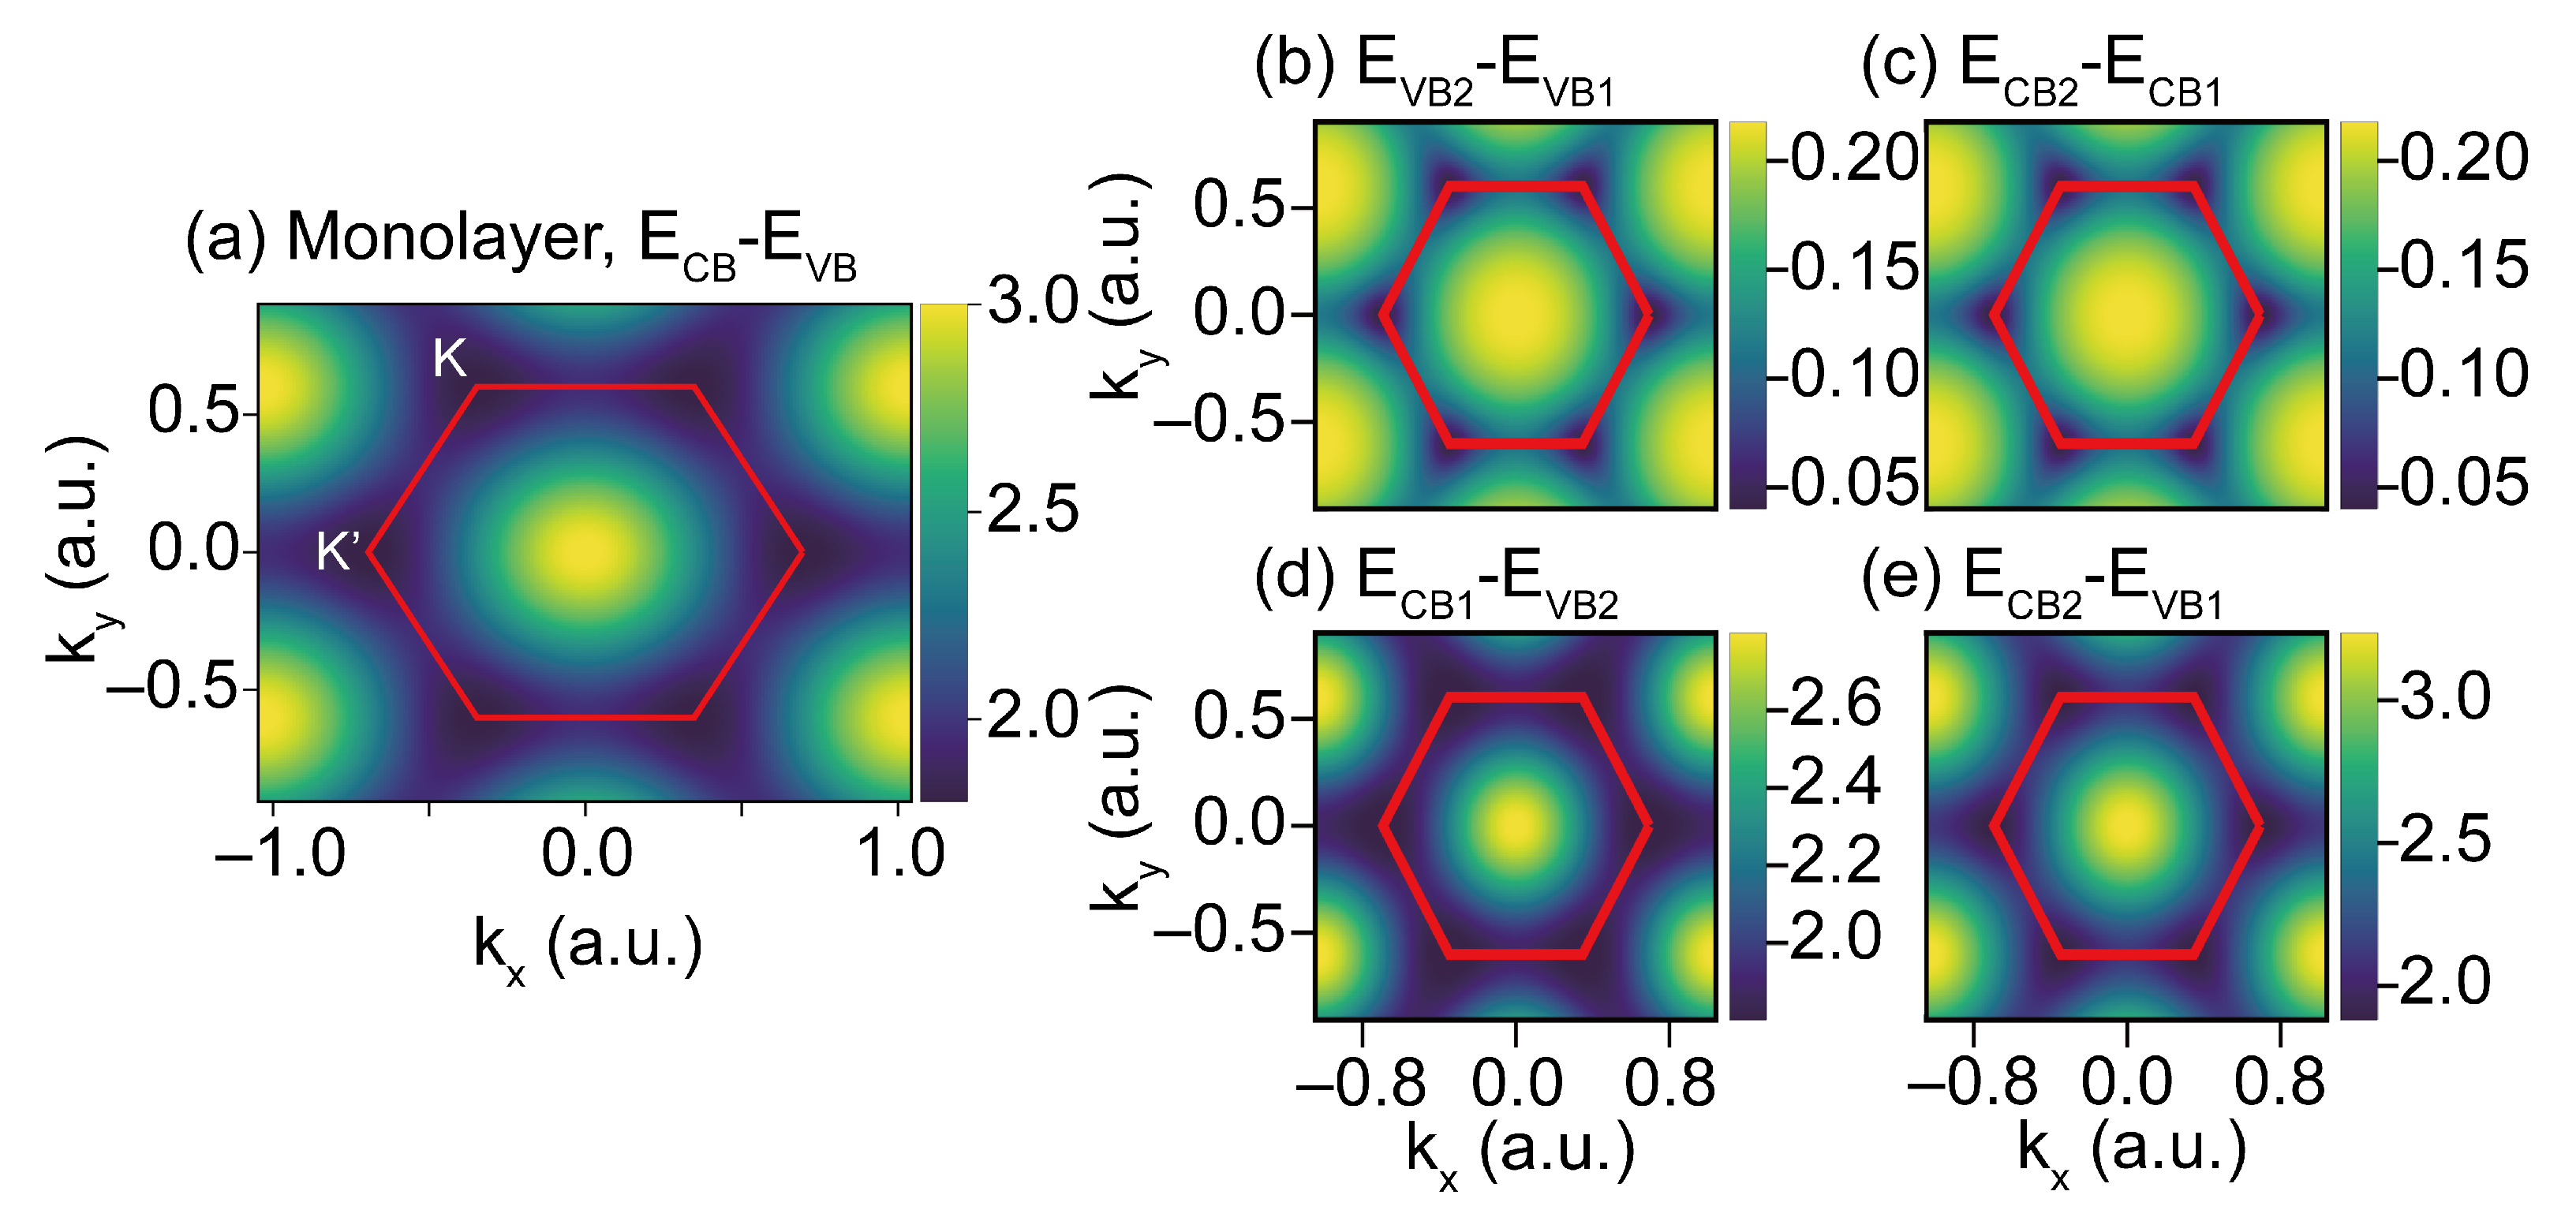
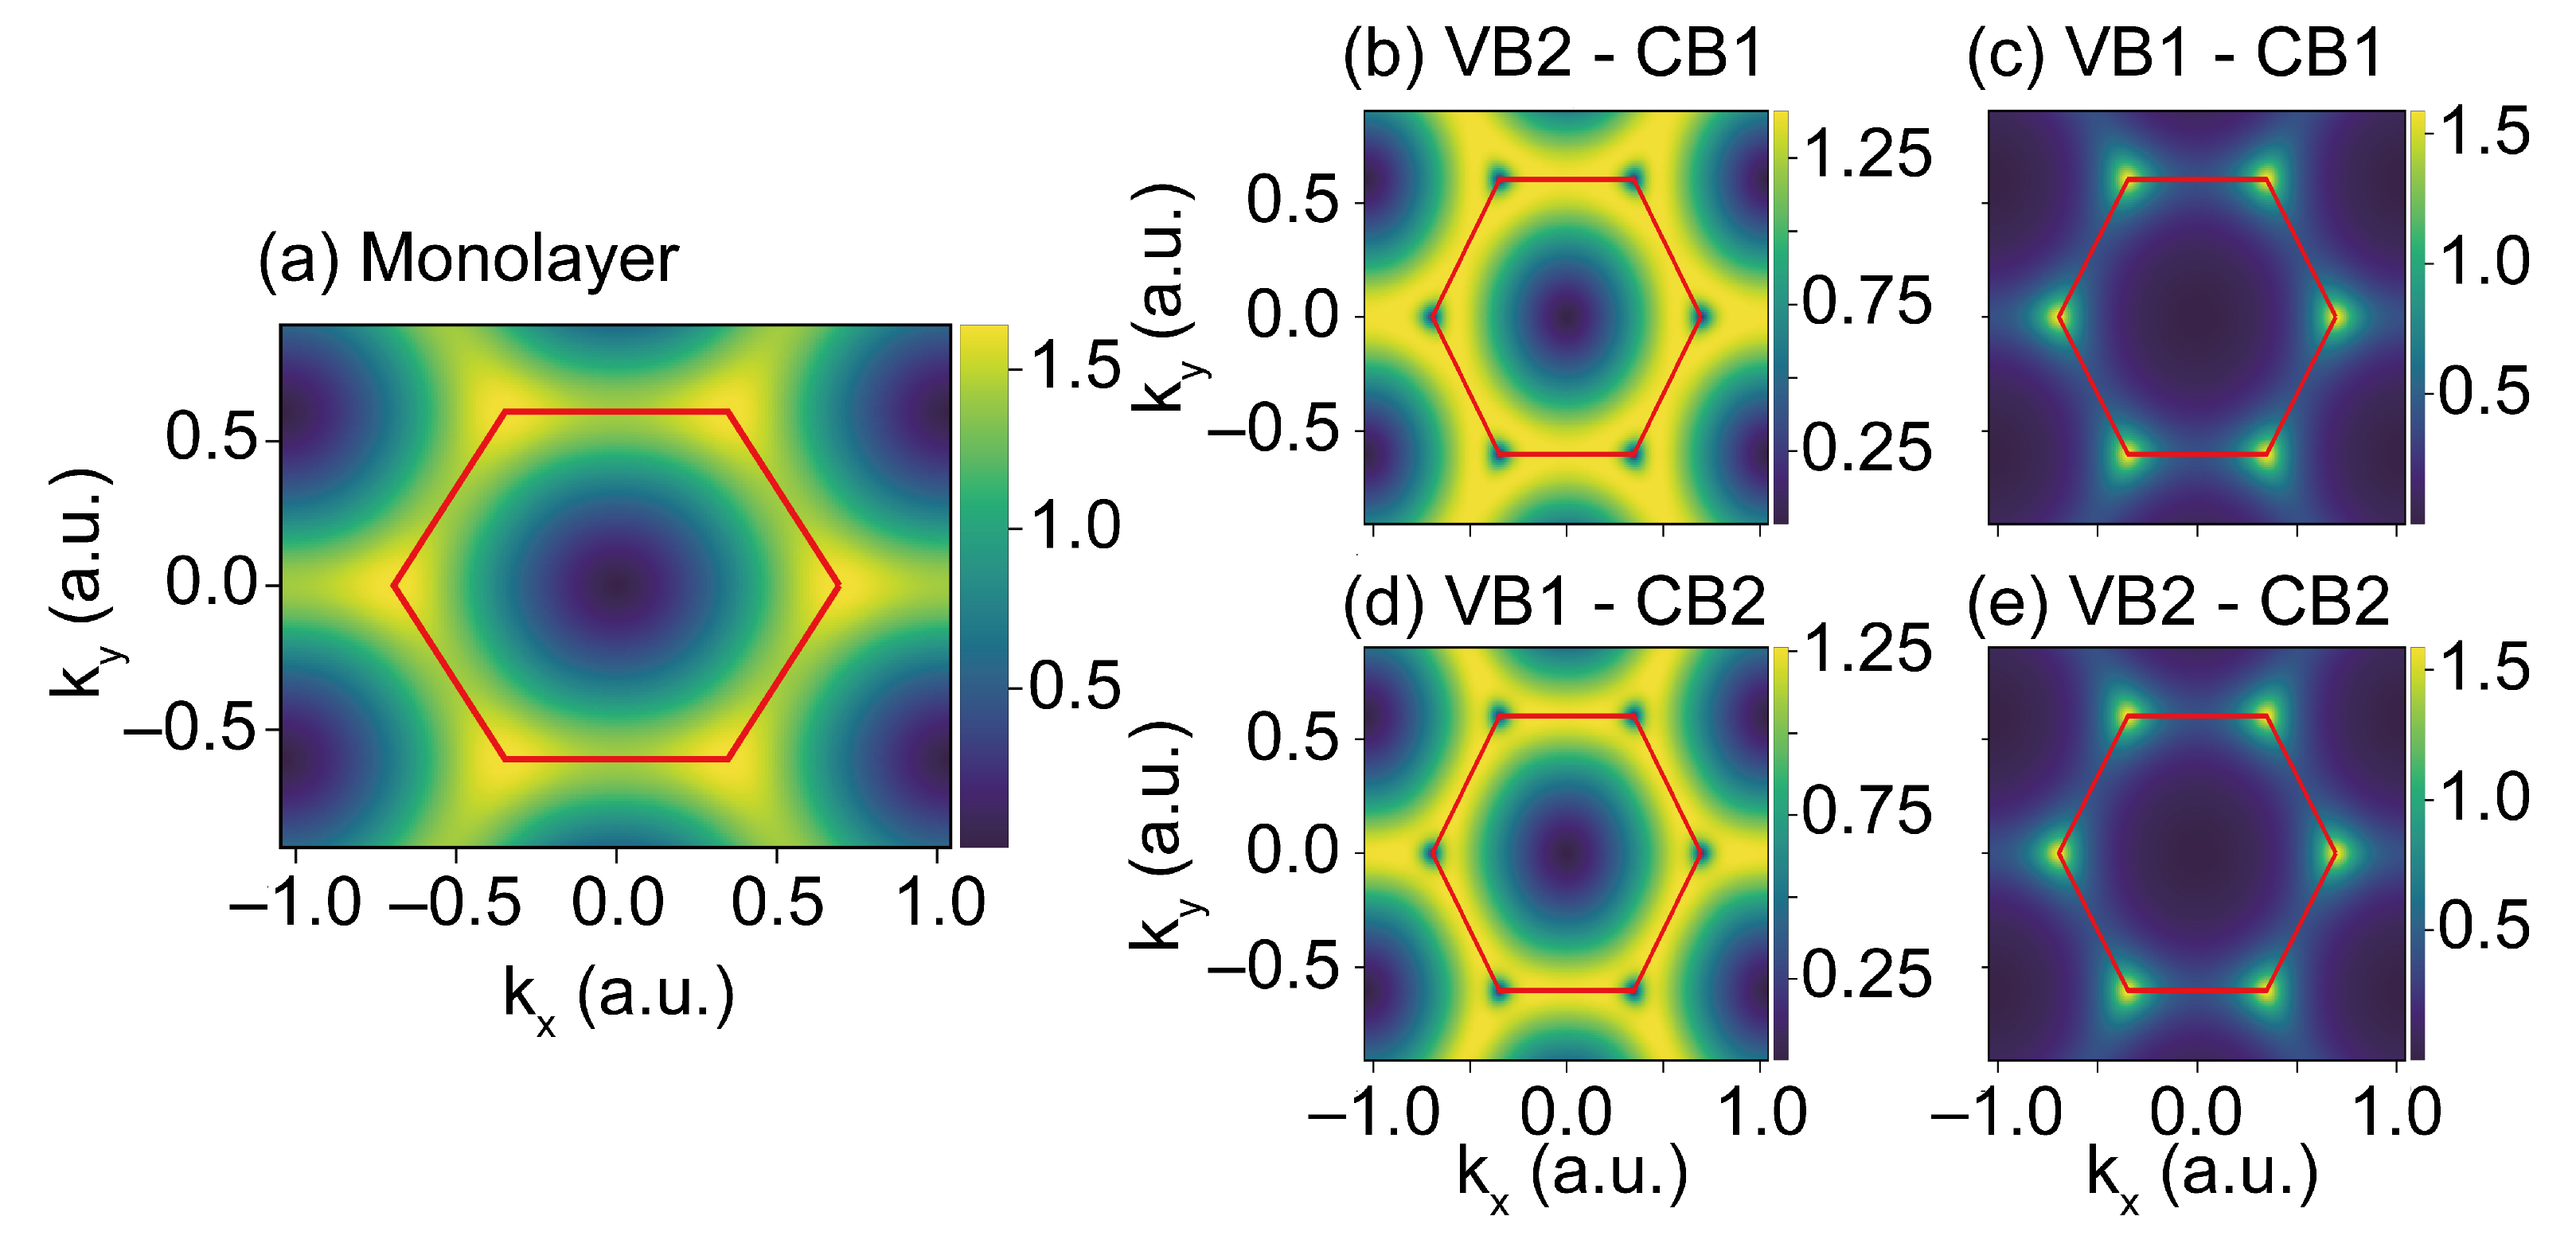
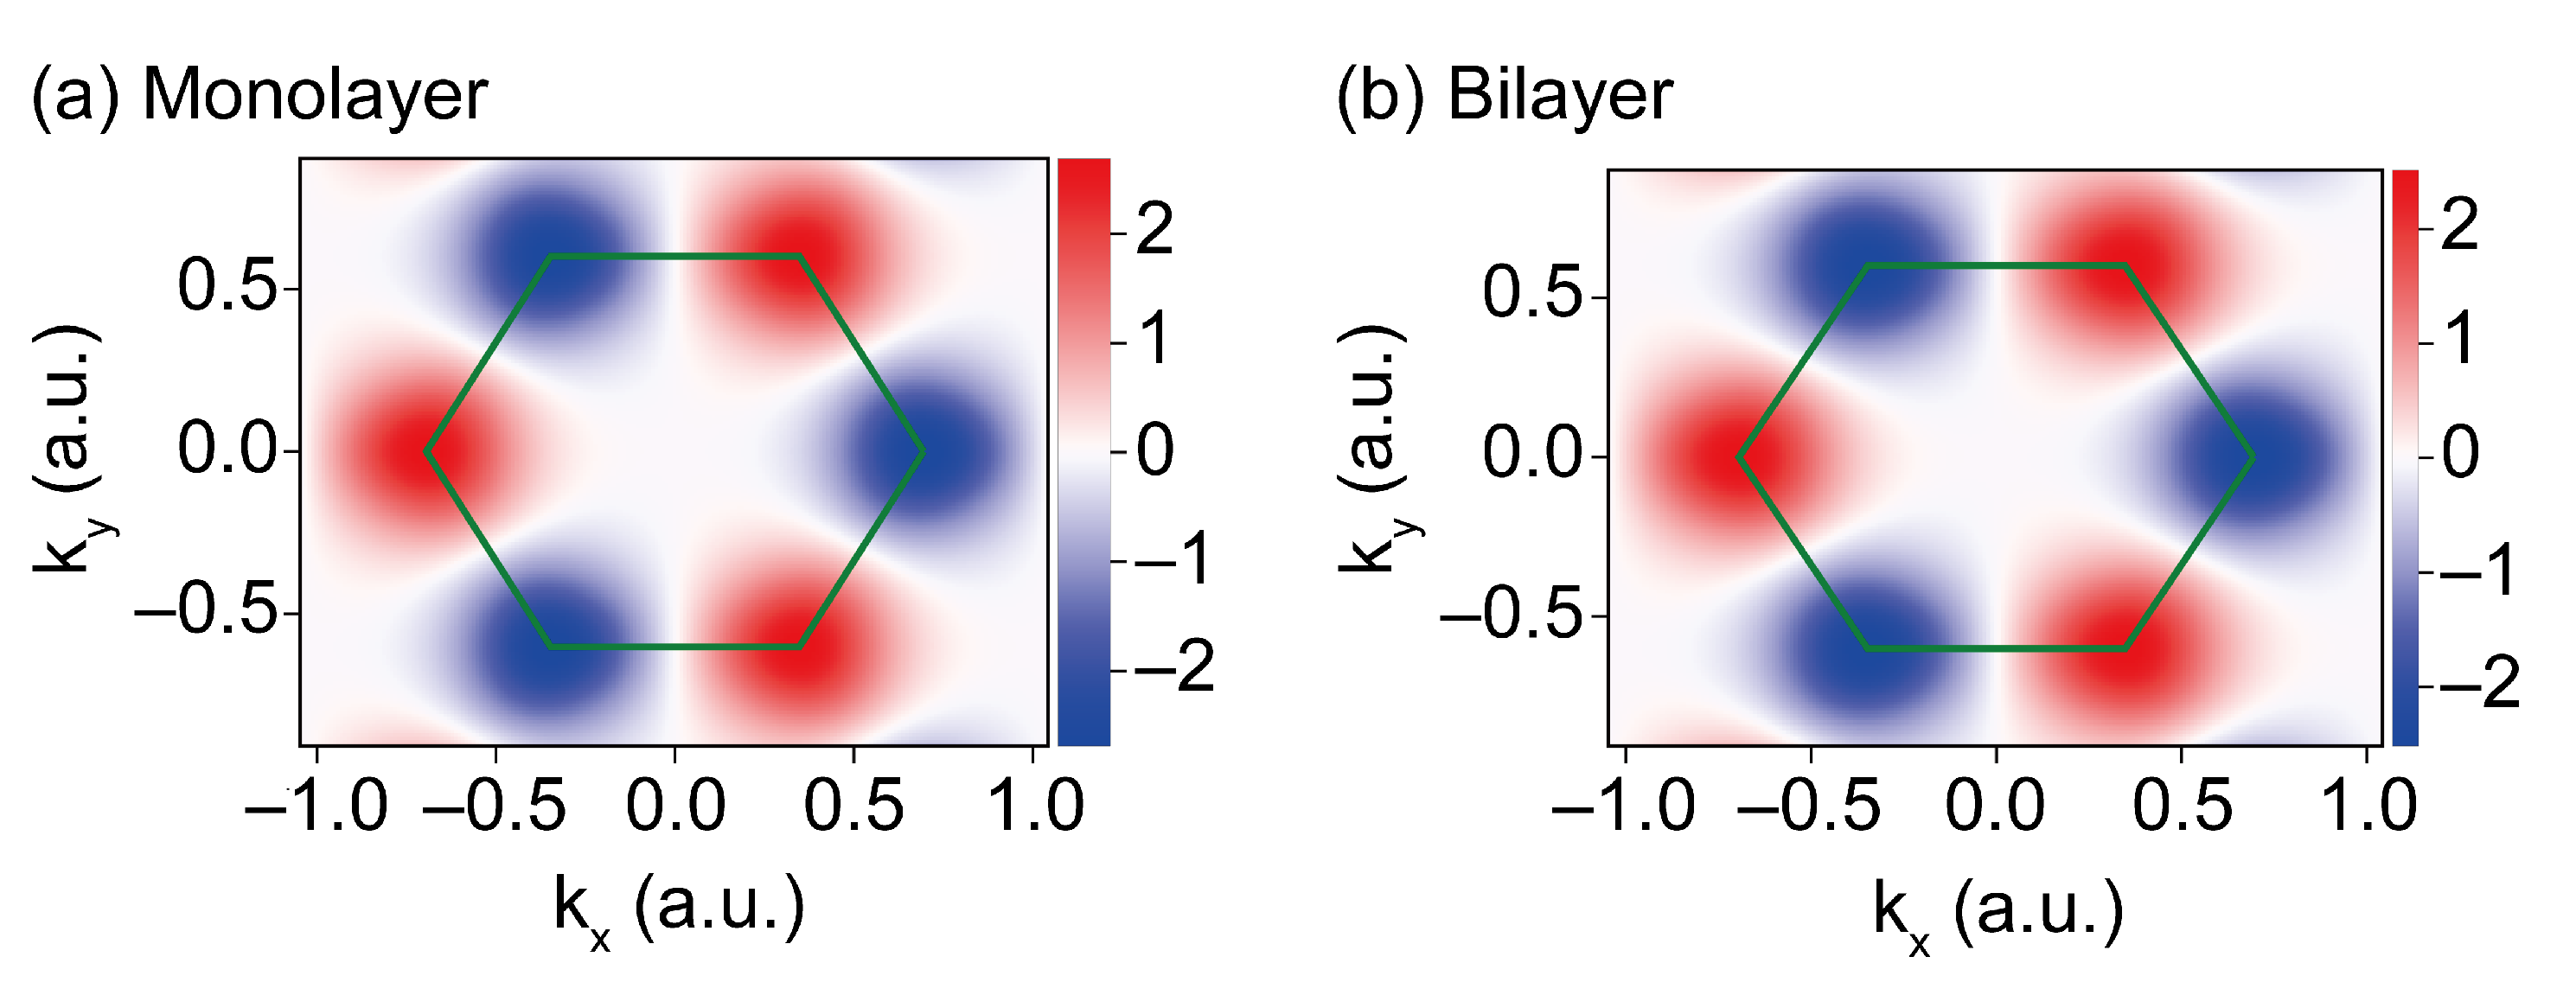
Appendix A. Band Gap Structure in the BZ

The energy difference band between different conduction and valence bands for monolayers and bilayers MoS 2 are depicted in Figure A1. These energy differences are important once the high-order harmonic spectrum is dominated by the interband currents [7,18]. We then can discover a unique physical feature by the interplay between the energy dispersion and the interband currents.
Figure A1. Diference between conduction bands (CBs) and valence bands (VBs) for monolayer and bilayers. (a) Energy difference for the monolayer model of MoS 2 . In the case of the bilayer model of MoS 2 , the energy difference (or energy gap) for the highest VB2 and the lowest VB1 is depicted in (b), and the energy difference of the highest CB2 and the lowest CB1 in (c), respectively. (d,e) depict the energy difference for the CBs and VBs in the case of the bilayer of MoS 2 . The first Brillouin zone is shown as a red line.
Symmetry 13 02403 g0a1

Appendix B. Keldysh Approximation and Quasi-Classical Analysis

Here we can gain more physical insight into the HHG spectra by applying the Keldysh approximation [7]. This approximation reads: m ρ m ( k , t ) ∼0, where m is an integer index that stands for the number of conduction bands. Thus, the Keldysh approximation is valid in the limit that a 0 E 0 ϵ 0 and ϵ 0 ω 0 . This essentially indicates that the population excited into the conduction band is very small compared to that remaining in the valence band. This approximation is very similar to the Strong Field Approximation (SFA), which was originally developed for atoms and molecules [6,18,53,54]—we will thus hereafter term it SFA. We will discuss the inter-band current in this appendix.

Appendix B.1. Inter-Band Current

In this approximation, we will restrict ourselves to the harmonic radiation produced by the interband current according to Reference [18]. We obtain a closed form of the expression for the ith vectorial-component ( i = x , y ) within the Hamiltonian matter-gauge [33] for 2D materials,
J er ( i ) ( t ) = i j d d t t 0 t d t BZ ¯ d 2 K d c v ( i ) K + A ( t ) × d c v ( j ) K + A ( t ) E ( j ) ( t ) × e i S ( K , t , t ) ( t t ) / T 2 + c . c . ,
where S ( K , t , t ) is the quasi-classical action for the electron-hole, which is expressed as
S ( K , t , t ) = t t ε g ( K + A ( t ) ) + E ( t ) · ξ g ( K + A ( t ) ) d t .
Here, j = x , y indicates the component of the electric field and the transition-dipole product, which depends on the polarization of the driving laser. Expressions (A1) and (A2) are direct analogs of the Landau–Dykhne formula for HHG in atoms [54], derived following the idea of the simple man’s model [6,53]. These expressions will be analyzed below using the saddle point approximation over crystal momentum to derive the effects of the Berry curvature on the relevant trajectories. For multiband systems, see Reference [15].
Figure A2. Absolute dipole transition matrix element between VBs and CBs for (a) monolayer and (be) bilayer MoS 2 . The dipole transition matrix elements for the bilayer case are corresponding to (b) highest VB2–lowest CB1, (c) lowest VB1–lowest CB1, (d) lowest VB1–highest CB2, and (e) highest VB2–highest CB2.
Symmetry 13 02403 g0a2
Figure A3. Rotational selection rules of the dipole transition matrix element for the monolayer of MoS 2 while the material interacts with a circularly polarized laser. Rotational dipole corresponding to the (a) right (counter clockwise) circularly polarized laser and (b) left (clockwise) circularly polarized laser is plotted.
Symmetry 13 02403 g0a3

Appendix B.2. Quasi-Classical Electron-Hole Pair Quantum Paths

Assuming that the exponential function of quasi-classical action e i S = e i S ( K , t , t ) oscillates rapidly as a function of the canonical crystal momentum K , the saddle-point approximation can be applied to specify the K s points at which the integrand’s contributions to the inter-band current (A1) are concentrated. These are solutions to the saddle-point equation K S ( K , t , t ) | K s 0 , which can be rephrased as
Δ x c ( K s , t , t ) Δ x v ( K s , t , t ) 0 .
This equation defines two different trajectories, the first one is related to the excited electron Δ x c ( K s , t , t ) in the conduction band, whereas the second one involves the trajectory Δ x v ( K s , t , t ) followed by the hole in the valence band. Then, a general mth trajectory for the electron ( m = c ) and hole ( n = v ) is obtained as
Δ x m ( K s , t , t ) = t t [ v gr , m + E ( t ) × Ω m + E ( t ) · K ξ m + ( 1 ) m 1 2 K ϕ c v ( j ) ] d t ,
where ( 1 ) m is the alternating sign ( 1 ) c = + 1 and ( 1 ) v = 1 , and v gr , m = K ε m is the group velocity of the mth band. Here, the Berry curvature Ω m and the anomalous velocity v a , m are given by Ω m = K × ξ m and v a , m = E ( t ) × Ω m , respectively. The expression for the electron-hole trajectories can be rewritten as
Δ x m ( K s , t , t ) = t t [ v gr , m + v a , m d d t ξ m + ( 1 ) m 2 K ϕ c v ( j ) ] d t .
These electron-hole trajectories under the saddle point condition Equation (A3) should produce complex-valued solutions for K s , as is the case of HHG in gas materials. However, determining the saddle points K s is not trivial since it depends explicitly on the geometrical features, such as the Berry Curvature and connection and the phase of the dipole matrix elements. This becomes further complicated as the eigenstates and eigenvalues that make up the energy bands are expected to exhibit branch cuts and branch points connecting the two bands [55,56]. Once the momentum is allowed to take on complex values (as it does in complex band structure theory [57]), this leads to a nontrivial geometrical problem with a high dimensionality whose analysis requires detailed attention.
Nevertheless, these saddle points K s should have a component perpendicular to the driving laser field E ( t ) (in the case of linearly polarized drivers), which appears due to anomalous-velocity features and of the Berry curvature Ω m ( k ) in particular.

Appendix B.3. Berry Connection, Berry Curvature, and Chern Number

To calculate the radiation-interaction features of these eigenstates, the DTMEs between each state from conduction to valence bands are required or vice versa. This DTME is unique since it contains the full information of the selection rules for the emitted radiation. We define it on the basis of the Bloch function [58],
Φ m , k | x | Φ n , k = i k δ m n δ ( k k ) + δ ( k k ) d m n ( k ) ,
where
d m n ( k ) = i u m , k | k | u n , k
is a regular function that encodes the momentum gradient of the periodic part of the Bloch functions. For n m , d m n ( k ) defines the DTME, which has also been noted in the text. The main diagonal of Equation (A7) elements is the Berry connection of the mth-band,
ξ m ( k ) = d m m ( k ) = i u m , k | k | u m , k ,
which demonstrates the parallel transport of the wave function phase around the band. The parallel transport is measured by the Berry curvature, given by the gauge-invariant curl
Ω m ( k ) = k × ξ m ( k )
This parallel transport is observed in the quasi-classical action phase of Equation (A7).
Figure A4. Rotational selection rules of the dipole transition matrix element for bilayer MoS 2 while the material interacts with the circularly polarized laser. The left column (a,c,e,g) shows the rotational dipole for the right circularly polarized laser, and the right column (b,d,f,h) is for the left circular polarization. Each row corresponds to different interband transitions between VBs and CBs. Corresponding interband transitions are (a,b) highest VB2–lowest CB1, (c,d) lowest VB1–highest CB2, (e,f) lowest VB1–lowest CB1, and (g,h) highest VB2–highest CB2.
Symmetry 13 02403 g0a4
Figure A5. Selection valley Berry curvature effect for monolayer and bilayer MoS 2 . (a,b) show the Berry Curvature of the valence band for the monolayer and bilayer, respectively. We use the average of the Berry Curvature of the valence bands.
Symmetry 13 02403 g0a5

Appendix B.4. Dipole Moment and Berry Curvature in the Haldane Model (HM)

We now turn to the dipole transition matrix element Equation (A7) and its deep relationship with the Berry Curvature, which is given here as [18]
d c v ( k ) = 1 2 ( sin θ k ) ( k ϕ k ) + i k θ k .
Furthermore, the cross product of the dipole matrix element Equation (A10) can be written as
( d c v x d c v y * ) = 1 4 sin θ k k y θ k k x ϕ k k x θ k k y ϕ k .
Expanding Equation (A9), the Berry Curvature in the Haldane model, one obtains [18]
Ω v / c ( k ) = 1 2 sin θ k ( k θ k × k ϕ k ) = z ^ 1 2 sin θ k k y θ k k x ϕ k k x θ k k y ϕ k .
We, therefore, conclude that [18]:
Ω v / c = 2 [ d c v ( x ) d c v * ( y ) ] ,
which demonstrates the close relationship between dipole matrix elements and the Berry Curvature in the HM. This relationship is extremely important, as it leads to a direct connection of the inter-band current of Equation (A1) and the topological invariant.

References

  1. Ghimire, S.; Di Chiara, A.D.; Sistrunk, E.; Agostini, P.; DiMauro, L.F.; Reis, D.A. Observation of high-order harmonic generation in a bulk crystal. Nat. Phys. 2011, 7, 138–141. [Google Scholar] [CrossRef]
  2. Liu, H.; Li, Y.; You, Y.S.; Ghimire, S.; Heinz, T.F.; Reis, D.A. High-harmonic generation from an atomically thin semiconductor. Nat. Phys. 2017, 13, 262. [Google Scholar] [CrossRef]
  3. Vampa, G.; Hammond, T.; Thiré, N.; Schmidt, B.; Légaré, F.; McDonald, C.; Brabec, T.; Corkum, P. Linking high harmonics from gases and solids. Nature 2015, 522, 462. [Google Scholar] [CrossRef] [PubMed]
  4. Itatani, J.; Levesque, J.; Zeidler, D.; Niikura, H.; Pépin, H.; Kieffer, J.C.; Corkum, P.B.; Villeneuve, D.M. Tomographic imaging of molecular orbitals. Nature 2004, 432, 867–871. [Google Scholar] [CrossRef] [PubMed]
  5. Ghimire, S.; Reis, D.A. High-harmonic generation from solids. Nat. Phys. 2019, 15, 10–16. [Google Scholar] [CrossRef]
  6. Amini, K.; Biegert, J.; Calegari, F.; Chacón, A.; Ciappina, M.F.; Dauphin, A.; Efimov, D.K.; de Morisson Faria, C.F.; Giergiel, K.; Gniewek, P.; et al. Symphony on strong field approximation. Rep. Prog. Phys. 2019, 82, 116001. [Google Scholar] [CrossRef] [PubMed] [Green Version]
  7. Vampa, G.; McDonald, C.R.; Orlando, G.; Klug, D.D.; Corkum, P.B.; Brabec, T. Theoretical Analysis of High-Harmonic Generation in Solids. Phys. Rev. Lett. 2014, 113, 073901. [Google Scholar] [CrossRef] [PubMed]
  8. Osika, E.N.; Chacón, A.; Ortmann, L.; Suárez, N.; Pérez-Hernández, J.A.; Szafran, B.; Ciappina, M.F.; Sols, F.; Landsman, A.S.; Lewenstein, M. Wannier-Bloch Approach to Localization in High-Harmonics Generation in Solids. Phys. Rev. X 2017, 7, 021017. [Google Scholar] [CrossRef] [Green Version]
  9. Kruchinin, S.Y.; Krausz, F.; Yakovlev, V.S. Colloquium: Strong-field phenomena in periodic systems. Rev. Mod. Phys. 2018, 90, 021002. [Google Scholar] [CrossRef] [Green Version]
  10. Kormányos, A.; Zólyomi, V.; Fal’ko, V.I.; Burkard, G. Tunable Berry curvature and valley and spin Hall effect in bilayer MoS2. Phys. Rev. B 2018, 98, 035408. [Google Scholar] [CrossRef] [Green Version]
  11. Gong, Z.; Liu, G.B.; Yu, H.; Xiao, D.; Cui, X.; Xu, X.; Yao, W. Magnetoelectric effects and valley-controlled spin quantum gates in transition metal dichalcogenide bilayers. Nat. Commun. 2013, 4, 2053. [Google Scholar] [CrossRef] [Green Version]
  12. Zhai, X.; Blanter, Y.M. Spin-valley polarized quantum anomalous Hall effect and a valley-controlled half-metal in bilayer graphene. Phys. Rev. B 2020, 101, 155425. [Google Scholar] [CrossRef]
  13. Damascelli, A.; Hussain, Z.; Shen, Z.X. Angle-resolved photoemission studies of the cuprate superconductors. Rev. Mod. Phys. 2003, 75, 473–541. [Google Scholar] [CrossRef] [Green Version]
  14. Chiu, C.K.; Teo, J.C.Y.; Schnyder, A.P.; Ryu, S. Classification of topological quantum matter with symmetries. Rev. Mod. Phys. 2016, 88, 035005. [Google Scholar] [CrossRef]
  15. Vampa, G.; Brabec, T. Merge of high harmonic generation from gases and solids and its implications for attosecond science. J. Phys. B At. Mol. Opt. Phys. 2017, 50, 083001. [Google Scholar] [CrossRef]
  16. Luu, T.T.; Wörner, H.J. Measurement of the Berry curvature of solids using high-harmonic spectroscopy. Nat. Commun. 2018, 9, 916. [Google Scholar] [CrossRef] [PubMed] [Green Version]
  17. Vampa, G.; Hammond, T.J.; Thiré, N.; Schmidt, B.E.; Légaré, F.; McDonald, C.R.; Brabec, T.; Klug, D.D.; Corkum, P.B. All-Optical Reconstruction of Crystal Band Structure. Phys. Rev. Lett. 2015, 115, 193603. [Google Scholar] [CrossRef] [Green Version]
  18. Chacón, A.; Kim, D.; Zhu, W.; Kelly, S.P.; Dauphin, A.; Pisanty, E.; Maxwell, A.S.; Picón, A.; Ciappina, M.F.; Kim, D.E.; et al. Circular dichroism in higher-order harmonic generation: Heralding topological phases and transitions in Chern insulators. Phys. Rev. B 2020, 102, 134115. [Google Scholar] [CrossRef]
  19. Baykusheva, D.; Chacón, A.; Kim, D.; Kim, D.E.; Reis, D.A.; Ghimire, S. Strong-field physics in three-dimensional topological insulators. Phys. Rev. A 2021, 103, 023101. [Google Scholar] [CrossRef]
  20. Tancogne-Dejean, N.; Mücke, O.D.; Kärtner, F.X.; Rubio, A. Ellipticity dependence of high-harmonic generation in solids originating from coupled intraband and interband dynamics. Nat. Commun. 2017, 8, 2041. [Google Scholar]
  21. Baykusheva, D.; Chacón, A.; Lu, J.; Bailey, T.P.; Sobota, J.A.; Soifer, H.; Kirchmann, P.S.; Rotundu, C.; Uher, C.; Heinz, T.F.; et al. All-Optical Probe of Three-Dimensional Topological Insulators Based on High-Harmonic Generation by Circularly Polarized Laser Fields. Nano Lett. 2021, 21, 8970. [Google Scholar] [CrossRef] [PubMed]
  22. Hasan, M.Z.; Kane, C.L. Colloquium: Topological insulators. Rev. Mod. Phys. 2010, 82, 3045–3067. [Google Scholar] [CrossRef] [Green Version]
  23. Haldane, F.D.M. Nobel Lecture: Topological quantum matter. Rev. Mod. Phys. 2017, 89, 040502. [Google Scholar] [CrossRef]
  24. Langer, F.; Schmid, C.P.; Schlauderer, S.; Gmitra, M.; Fabian, J.; Nagler, P.; Schüller, C.; Korn, T.; Hawkins, P.G.; Steiner, J.T.; et al. Lightwave valleytronics in a monolayer of tungsten diselenide. Nature 2018, 557, 1476–4687. [Google Scholar] [CrossRef]
  25. Xiao, D.; Liu, G.B.; Feng, W.; Xu, X.; Yao, W. Coupled Spin and Valley Physics in Monolayers of MoS2 and Other Group-VI Dichalcogenides. Phys. Rev. Lett. 2012, 108, 196802. [Google Scholar] [CrossRef] [Green Version]
  26. Shin, D.; Sato, S.A.; Hübener, H.; De Giovannini, U.; Kim, J.; Park, N.; Rubio, A. Unraveling Materials Berry Curvature and Chern Numbers from Real-Time Evolution of Bloch States. Proc. Natl. Acad. Sci. USA 2019, 116, 4135–4140. [Google Scholar] [CrossRef] [Green Version]
  27. Yoshikawa, N.; Tamaya, T.; Tanaka, K. High-harmonic generation in graphene enhanced by elliptically polarized light excitation. Science 2017, 356, 736–738. [Google Scholar] [CrossRef]
  28. Mrudul, M.S.; Dixit, G. High-harmonic generation from monolayer and bilayer graphene. Phys. Rev. B 2021, 103, 094308. [Google Scholar] [CrossRef]
  29. Tancogne-Dejean, N.; Oliveira, M.J.T.; Andrade, X.; Appel, H.; Borca, C.H.; Le Breton, G.; Buchholz, F.; Castro, A.; Corni, S.; Correa, A.A.; et al. Octopus, a computational framework for exploring light-driven phenomena and quantum dynamics in extended and finite systems. J. Chem. Phys. 2020, 152, 124119. [Google Scholar] [CrossRef] [PubMed]
  30. Yue, L.; Gaarde, M.B. Structure gauges and laser gauges for the semiconductor Bloch equations in high-order harmonic generation in solids. Phys. Rev. A 2020, 101, 053411. [Google Scholar] [CrossRef]
  31. Kruchinin, S.Y.; Korbman, M.; Yakovlev, V.S. Theory of strong-field injection and control of photocurrent in dielectrics and wide band gap semiconductors. Phys. Rev. B 2013, 87, 115201. [Google Scholar] [CrossRef] [Green Version]
  32. Wismer, M.S.; Yakovlev, V.S. Gauge-independent decoherence models for solids in external fields. Phys. Rev. B 2018, 97, 144302. [Google Scholar] [CrossRef]
  33. Silva, R.E.F.; Martín, F.; Ivanov, M. High harmonic generation in crystals using maximally localized Wannier functions. Phys. Rev. B 2019, 100, 195201. [Google Scholar] [CrossRef] [Green Version]
  34. Kim, D.; Shin, D.; Landsman, A.S.; Kim, D.E.; Chacón, A. Theory for all-optical responses in topological materials: The velocity gauge picture. arXiv 2021, arXiv:2105.12294. [Google Scholar]
  35. Li, S.; Liu, C.C.; Yao, Y. Floquet high Chern insulators in periodically driven chirally stacked multilayer graphene. New J. Phys. 2018, 20, 033025. [Google Scholar] [CrossRef]
  36. Toh, R.J.; Sofer, Z.; Luxa, J.; Sedmidubský, D.; Pumera, M. 3R phase of MoS2 and WS2 outperforms the corresponding 2H phase for hydrogen evolution. Chem. Commun. 2017, 53, 3054–3057. [Google Scholar] [CrossRef] [PubMed] [Green Version]
  37. Saito, N.; Xia, P.; Lu, F.; Kanai, T.; Itatani, J.; Ishii, N. Observation of selection rules for circularly polarized fields in high-harmonic generation from a crystalline solid. Optica 2017, 4, 1333–1336. [Google Scholar] [CrossRef]
  38. Drake, G.W.F.; Cassar, M.M. Springer Handbooks of Atomic, Molecular and Optical Physics; Springer Science & Business Media: Berlin/Heidelberg, Germany, 2006. [Google Scholar]
  39. Karsten, L.H.; Smith, J. Lattice fermions: Species doubling, chiral invariance and the triangle anomaly. Nucl. Phys. B 1981, 183, 103–140. [Google Scholar] [CrossRef]
  40. Li, J.; Zhang, Q.; Zhu, X.; Huang, T.; Lan, P.; Lu, P. Orientation dependence of high-order harmonic generation in nanowire. Phys. Rev. A 2019, 99, 033421. [Google Scholar] [CrossRef]
  41. Zhang, Y.; Li, L.; Li, J.; Huang, T.; Lan, P.; Lu, P. Orientation dependence of high-order harmonic generation in graphene. Phys. Rev. A 2021, 104, 033110. [Google Scholar] [CrossRef]
  42. Acín, A.; Bloch, I.; Buhrman, H.; Calarco, T.; Eichler, C.; Eisert, J.; Esteve, D.; Gisin, N.; Glaser, S.J.; Jelezko, F.; et al. The quantum technologies roadmap: A European community view. New J. Phys. 2018, 20, 080201. [Google Scholar] [CrossRef]
  43. Lewenstein, M.; Sanpera, A.; Ahufinger, V. Ultracold Atoms in Optical Lattices: Simulating Quantum Many-Body Systems; Oxford University Press: Oxford, UK, 2012. [Google Scholar]
  44. Bloch, I.; Dalibard, J.; Zwerger, W. Many-body physics with ultracold gases. Rev. Mod. Phys. 2008, 80, 885–964. [Google Scholar] [CrossRef] [Green Version]
  45. Cirac, J.I.; Zoller, P. Goals and opportunities in quantum simulation. Nat. Phys. 2012, 8, 264–266. [Google Scholar] [CrossRef]
  46. Bloch, I.; Dalibard, J.; Nascimbène, S. Quantum simulations with ultracold quantum gases. Nat. Phys. 2012, 8, 267–276. [Google Scholar] [CrossRef]
  47. Blatt, R.; Roos, C.F. Quantum simulations with trapped ions. Nat. Phys. 2012, 8, 277–284. [Google Scholar] [CrossRef]
  48. Aspuru-Guzik, A.; Walther, P. Photonic quantum simulators. Nat. Phys. 2012, 8, 285–291. [Google Scholar] [CrossRef] [Green Version]
  49. Houck, A.A.; Türeci, H.E.; Koch, J. On-chip quantum simulation with superconducting circuits. Nat. Phys. 2012, 8, 292–299. [Google Scholar] [CrossRef]
  50. Sala, S.; Förster, J.; Saenz, A. Ultracold-atom quantum simulator for attosecond science. Phys. Rev. A 2017, 95, 011403. [Google Scholar] [CrossRef] [Green Version]
  51. Senaratne, R.; Rajagopal, S.V.; Shimasaki, T.; Dotti, P.E.; Fujiwara, K.M.; Singh, K.; Geiger, Z.A.; Weld, D.M. Quantum simulation of ultrafast dynamics using trapped ultracold atoms. Nat. Commun. 2018, 9, 2065. [Google Scholar] [CrossRef] [PubMed] [Green Version]
  52. Ramos, R.; Spiering, D.; Racicot, I.; Steinberg, A.M. Measuring the time a tunnelling atom spends in the barrier. arXiv 2019, arXiv:1907.13523. [Google Scholar]
  53. Corkum, P.B. Plasma perspective on strong field multiphoton ionization. Phys. Rev. Lett. 1993, 71, 1994. [Google Scholar] [CrossRef] [PubMed] [Green Version]
  54. Lewenstein, M.; Balcou, P.; Ivanov, M.Y.; L’Huillier, A.; Corkum, P.B. Theory of high-harmonic generation by low-frequency laser fields. Phys. Rev. A 1994, 49, 2117. [Google Scholar] [CrossRef] [PubMed]
  55. Pechukas, P.; George, T.F.; Morokuma, K.; McLafferty, F.J.; Laing, J.R. Analytic structure of the eigenvalue problem as used in semiclassical theory of electronically inelastic collisions. J. Chem. Phys. 1976, 64, 1099–1105. [Google Scholar] [CrossRef]
  56. Hwang, J.T.; Pechukas, P. The adiabatic theorem in the complex plane and the semiclassical calculation of nonadiabatic transition amplitudes. J. Chem. Phys. 1977, 67, 4640–4653. [Google Scholar] [CrossRef]
  57. Reuter, M.G. A unified perspective of complex band structure: Interpretations, formulations, and applications. J. Phys. Condens. Matter 2016, 29, 053001. [Google Scholar] [CrossRef] [PubMed] [Green Version]
  58. Blount, E. Formalisms of Band Theory. In Solid State Physics; Seitz, F., Turnbull, D., Eds.; Academic Press: Cambridge, MA, USA, 1962; Volume 13, pp. 305–373. [Google Scholar]
Figure 1. Monolayer and 3R-polytype bilayer MoS 2 . (a) Top view of the monolayer MoS 2 (Mo atom is in blue and S atoms in yellow, respectively). A 3D view of bilayer MoS 2 with a MIR driving laser (red-oscillations) and harmonic emission (white-blue, blue and violet oscillations) is shown in (b). The red pulse indicates the driving laser field while the blue-violet pulses represent the high harmonic emission. The black vertical dashed lines point out the interlayer coupling between two layers of MoS 2 denoted by t 11 . (c,d) Schematic diagram of high-order harmonic generation process from the monolayer and bilayer MoS 2 , respectively. For the monolayer valence and conduction bands, we choose the tight-binding parameters: t 1 = 0.3998 , t 2 = 0.066 eV are the NN and NNN parameters (see text) and the ‘Dirac Mass’ or local potential M 0 = 0.900 eV at ‘Mo’ and ‘S’ atoms, described by the laser-field free Hamiltonian of Equation (9). These parameters match the minimum ( ϵ g ( 0 ) 1.8 eV) and maximum energy between the valence and conduction bands. The electron oscillation in the conduction band generates an intraband current, while the electron-hole recombination causes the interband currents depicted by vertical blue and violet lines, respectively. The main difference between (c) and (d) corresponds to the multi excitation and harmonic emissions of inter- and intra-bands.
Symmetry 13 02403 g001
Figure 2. (a) HHG spectra from monolayer (blue) and 3R phase bilayer (red) MoS 2 driven by linearly polarized laser along the Γ -K direction. The HHG intensity is normalized with respect to the number of layers. (b) HHG spectra with the right handed circularly polarized driving pulse for monolayer (blue) and bilayer (red). (c,d) Interband and intraband components of the HHG spectrum for monolayer and bilayer MoS 2 , respectively, driven by linearly polarized pulse. The laser parameter used for these simulations are: λ 0 = 3.8 μ m ( ω 0 = 0.3263 eV ), the carrier-envelop phase is fixed to zero and the number of optical cycles N cy = 10 at FWHM under a Gaussian envelope. The intensity of the laser is I 0 = 0.315 × 10 12 W · cm 2 . The dephasing time is fixed to T 2 = 5.2 fs. In the spectra, the harmonic order (HO) corresponding to the band gap are localized at about HO6th. According to our formalism, the e (h) can be driven in several regions of the energy dispersion of the BZ for the monolayer and bilayer MoS 2 (see Figure A1).
Symmetry 13 02403 g002
Figure 3. (a) HHG spectra from 3R polytype bilayer MoS 2 as a function of interlayer coupling strength, t 11 . The blue dashed line ( t 11 = 0.272 eV) points out the t 11 value used in most of the simulations discussed in this work. (b,c) show the HHG spectrum for weak interlayer coupling ( t 11 = 0.054 eV) and strong coupling ( t 11 = 0.462 eV), respectively, (white dashed lines in (a)).
Symmetry 13 02403 g003
Figure 4. Angular rotation analysis of HHG for monolayer (blue) and bilayer (red) MoS 2 . Polarization angle dependence of the harmonic yield is shown for the driving laser with the wavelength (ac) 2 μ m, (df) 3.8 μ m and (gi) 5.0 μ m. The low order harmonics (below the band gap), the harmonics near the band gap and the harmonics around the cut-off are plotted for each driving laser wavelength.
Symmetry 13 02403 g004
Figure 5. Ellipticity profiles of the 7th and 8th order harmonics from monolayer and bilayer MoS 2 . The dependence of harmonic yield on the driving laser ellipticity and the ellipticity of the generated harmonic are shown (ad) for the 7th order harmonic and (eh) for the 8th order harmonic. The laser parameters are the same as those used in Figure 2.
Symmetry 13 02403 g005
Publisher’s Note: MDPI stays neutral with regard to jurisdictional claims in published maps and institutional affiliations.

