Article

Analysis of Sound Absorption Characteristics of Acoustic Ducts with Periodic Additional Multi-Local Resonant Cavities

School of Naval Architecture and Ocean Engineering, Huazhong University of Science and Technology, Wuhan 430074, China
*
Author to whom correspondence should be addressed.
Symmetry 2021, 13(12), 2233; https://doi.org/10.3390/sym13122233
Submission received: 22 October 2021 / Revised: 8 November 2021 / Accepted: 10 November 2021 / Published: 23 November 2021
(This article belongs to the Special Issue The Study of Low Frequency Vibration and Noise Reduction)

Abstract

:
With the aim of applying various Helmholtz resonant cavities to achieve low-frequency sound absorption structures, a pipe structure with periodic, additional, symmetrical, multi-local resonant cavities is proposed. A thin plate with additional mass is placed in the cylindrical Helmholtz resonant cavity structure to form a symmetric resonant cavity structure and achieve multi-local resonance. The simulation results show that the periodic structure proposed in this paper can produce multiple, high acoustic transmission loss peaks and multiple lower broadband sound absorption frequency bands in the low-frequency range. In this paper, this idea is also extended to the Helmholtz resonant cavity embedded with multiple additional mass plates. The results show that the periodic arrangement of the multi-local resonant symmetric cavity inserted into multiple plates with mass can significantly increase its transmission loss and show a better performance on low-frequency sound absorption characteristics.

1. Introduction

Not only can noise affect the use and performance of the apparatus, but noise pollution can negatively affect human health. Sound waves are divided by the frequency ranges into three kinds: low-frequency sound wave, intermediate-frequency sound wave and high-frequency sound wave. Due to their strong penetration power and slow dissipation, it is challenging to control low-frequency sound waves. Moreover, resonance in organs of the body caused by low-frequency sound waves would severely influence physical health. Therefore, low-frequency sound control is always a popular subject for scholars [1,2]. The Helmholtz resonator is employed widely in the field of noise control due to its simple structure and excellent acoustic properties [3], such as its application in ducts for its effective sound absorption characteristics [4]. Pipe systems are widely used in ships, and the sound transmission of pipes in engineering, as well as the sound radiation of sea-going pipeline nozzles, is too large. This affects the sound radiation performance of ships and submarines, reduces their stealth performance, and seriously affects their survivability and combat effectiveness; therefore, the design of a pipeline system with effective sound absorption characteristics is vital for noise control.
Based on extensive use of Helmholtz resonators, domestic and foreign scholars conducted an array of relevant studies. Cai et al. [5] first put forward the theoretical formulas of noise reduction in Helmholtz resonators and found that their noise attenuation capacity was related to geometric shapes. They [6] also proposed a periodic, dual-Helmholtz resonator array and found that it could reduce mixed noise at a low frequency; many researchers also improve the necks of the Helmholtz resonators. Langfeldt et al. [7] designed Helmholtz resonators with multiple necks and obtained the explicit equations to explain the acoustic performances of their structure. They came to a conclusion that the increase in the number of the necks will cause the addition of their resonance frequencies. Ge et al. [8] adopted the four-pole parameters method to build double necks for the Helmholtz resonators. They found that increasing the number of necks could widen the resonance band and increasing the offset of the necks could achieve a larger transmission loss. Zhang et al. [9] combined Helmholtz resonators with necks from different locations and acquired acoustic metamaterials to accessibly control noise from 1300 Hz to 1500 Hz and from 1500 Hz to 2000 Hz.
Researchers also tried to insert different structures into the Helmholtz cavity. Guan et al. [10] proposed an improved resonator with an additional rigid baffle, and studied the influence of five different variables on the transmission loss of the improved resonator. Zhou et al. [11] inserted a thin film into a Helmholtz resonance cavity to form an acoustic metamaterial, and found that the curve had multiple peaks, its natural frequency shifted to low frequencies, and its low frequency bandwidth was also broadened. By optimizing the geometric size of the structure, the curve with the lowest transmission coefficient (around 280–350 Hz) could also be obtained. Inserting other structures in the cavity could shift the natural frequency to low frequencies. By optimizing the size of the composite structure, a better sound absorption effect could be obtained.
However, the studies of Helmholtz resonators mentioned above are focus on rigid cavities. Each traditional, rigid Helmholtz resonator can only generate a single-frequency sound absorption peak. In practical applications, on the contrary, the materials are elastic. There are a few scholars who pay attention to the influence of the elasticity of the cavity top and wall. Zhou et al. [12] studied the influence of the elastic cavity walls on acoustic performances of a water-filled Helmholtz resonator and employed the electroacoustic analogy to analyze its acoustic impedance. Cui et al. [13] designed an adaptive Helmholtz resonator with flexible structures and found it could customize the sound attenuation properties by its adaptive constructions.
In order to control the noise of pipeline system, researchers introduced the concept of acoustic metamaterials to the design of pipe. Liu et al. [14] installed the acoustic metamaterials of a thin film at the wall of the acoustic metamaterial and found that it demonstrated effective noise elimination performances by theoretical calculations and simulations. As the common elements in noise elimination of pipes, there are a number of studies on acoustic pipes which focus on Helmholtz resonators. Li et al. [15] distributed Helmholtz resonators at equal distances along the pipeline, which was proven to contain Bragg bandgaps and local resonance bandgaps to attenuate sound waves. Zhang et al. [16] carried out a kind of pipeline-united Helmholtz resonance with spring–mass resonance, which could simultaneously modulate noises in two frequency ranges and achieve self-adaption control. Hu et al. [17] suggested applying Helmholtz resonators with thin films and to an acoustic pipe system. They found that this could develop many bandgaps among the low frequencies. Shen et al. [18] devised a fluid-filled pipe of dark acoustic metamaterial type and proved its ability to produce extra-wide bandgaps in the low-frequency range to achieve noise reduction. It can be concluded through many studies that considering the elasticity of the wall and inserting the elastic structures into a Helmholtz cavity can develop effective sound absorption characteristics.
Because the periodic arrangement structure has a better effect on sound transmission loss, researchers also carried out many studies on periodic configurations. Catapane et al. [19] studied the acoustic transmission loss of a glass wool structure embedded with periodic inclusions, considering the influence of the unit cell size, the angle and the quality of the inclusions on the structural acoustic transmission loss. In addition to the multi-parameter simulation study of the periodic configuration of the structure, some scholars proposed a semi-analytical model of the structure containing periodic inclusions. Weisser et al. [20] established a semi-analytical model of a porous medium containing periodic inclusions with a rigidly supported pore–elastic layer, and verified it using a finite element code. The absorption of large frequency bands can also be obtained by adjusting the characteristics of the thin shell inclusions.
This paper focuses on the design of a periodic, multi-local, resonant, local-resonance acoustic pipe structure that can be applied to underwater ships and sea-to-sea pipelines. This design ensures the structure of vibrator attached on the plate embedded in the cavity. The resonance generated by mass on plate and cavity achieves the absorption of the sound-wave energy in a single cavity with multiple resonance modes, thereby achieving a multi-local resonance and multi-frequency sound absorption of the pipeline.

2. Characteristics of Acoustic Pipe Added Multiple Local Resonant Cavities

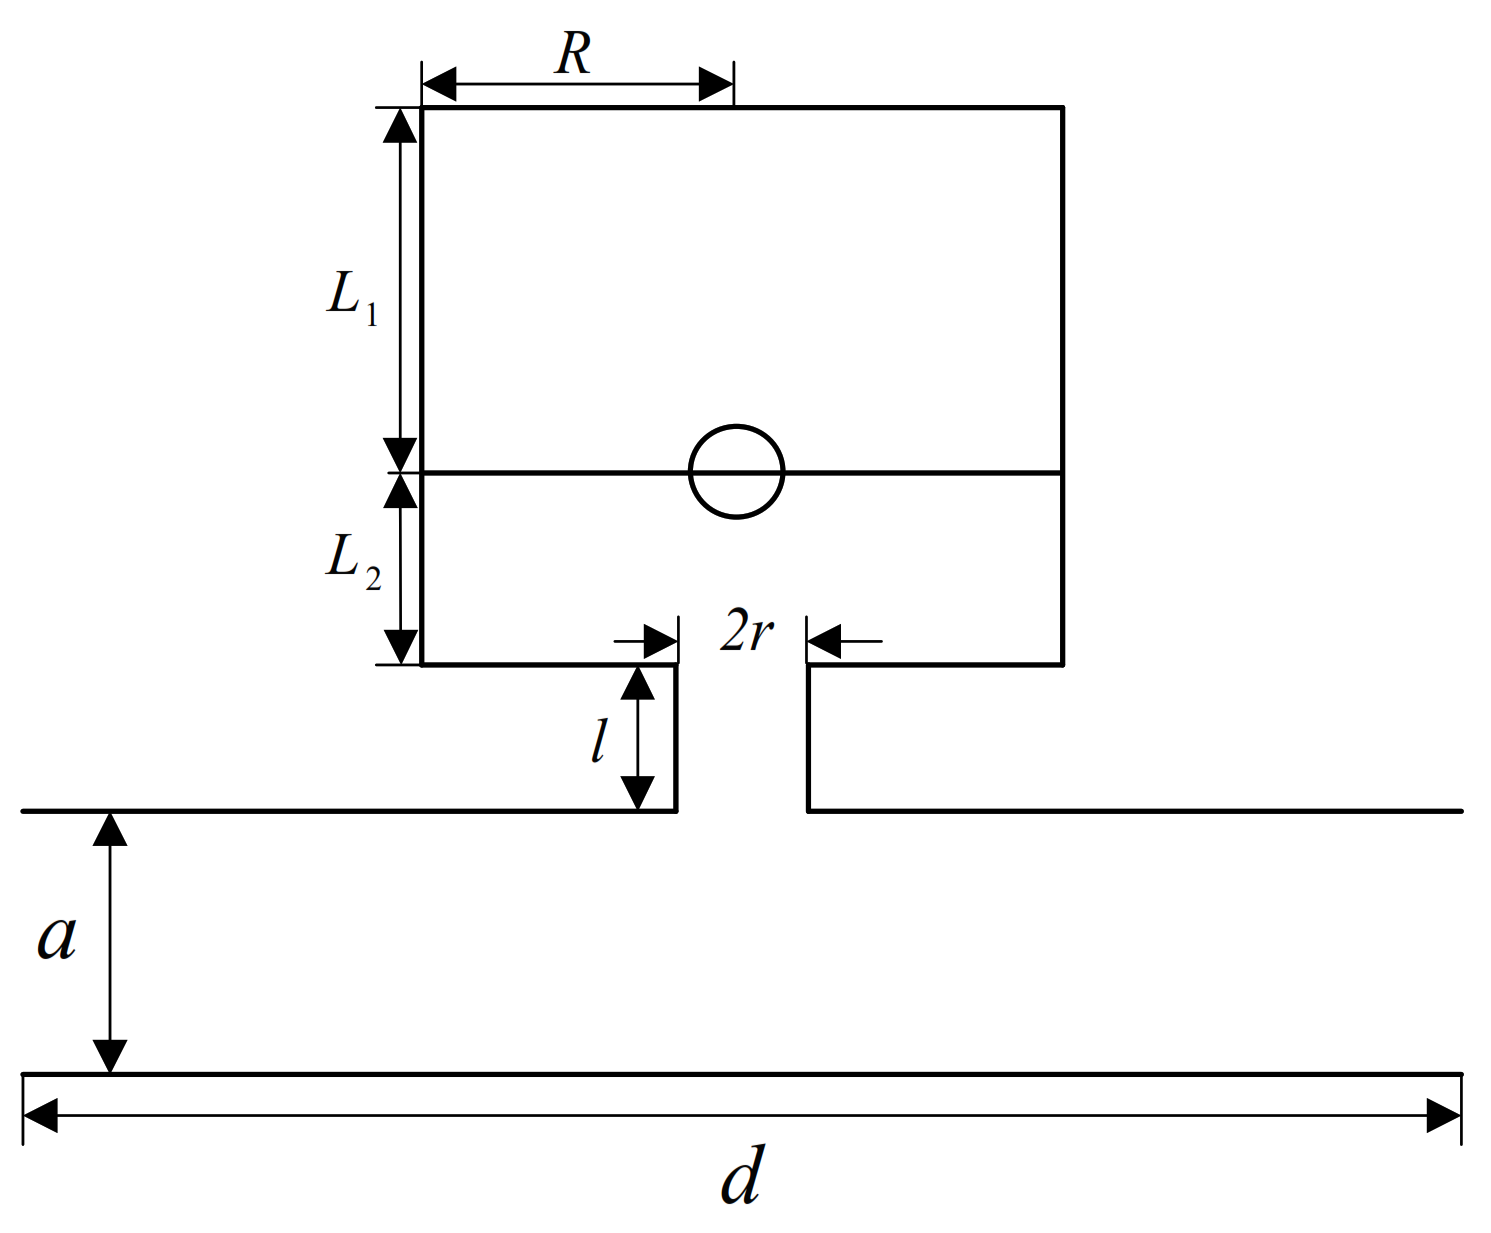
2.1. Cell of Acoustic Pipe Added Multiple Local Resonant Cavities

This work proposes an acoustic pipe with the periodical configuration of multiple local resonance cavities, and introduces the single cell of the pipe; see Figure 1. The multiple local resonant cavity is composed of a thin plate with a mass m inserted in the cylindrical Helmholtz cavity. The distance between thin plate with mass and the top is L 1 . The distance between thin plate with mass and the neck is L 2 . The radii of the thin plate and Helmholtz cavity are both R. The thickness, Young’s modulus, and Poisson’s ratio are E, μ and ρ , respectively. The radius and length of the Helmholtz cavity’s neck are r and l, separately. The section of the main duct is a square of length a. The length of a single cell is d.
The acoustic module and shell module in a commercial finite element software are used to establish model (see Figure 2).
After the geometric model is established, the attributes of air are assigned to the acoustic domain in the model. The pressure acoustics–frequency domain control equation is:
( 1 ρ c ( p t q d ) ) k e q 2 p t ρ c = Q m p t = p + p b k e q 2 = ( ω c c ) 2 c c = c , ρ c = ρ
where p is the sound pressure, p t is the total sound pressure, p b is the background sound pressure, ρ c / ρ is the density, q d is the dipole domain source, k e q is the wave number used in the equations, and Q m is the monopole domain source.
Since this model does not consider the elasticity of the pipe wall, the pipe wall can be set as the hard sound field boundary, and the hard sound field boundary satisfies:
n ( 1 ρ c ( p t q d ) ) = 0
where n represents the normal direction.
The left and right ends of the unit cell are set as the plane wave radiation conditions, and the equation is:
n ( 1 ρ c ( p t q d ) ) + i k e q ρ c p + i 2 k e q ρ c Δ | | p = Q i
When the incident pressure field is added to the left end, there are:
n ( 1 ρ c ( p t q d ) ) + i k e q ρ c p + i 2 k e q ρ c Δ | | p = Q i Q i = i k e q ρ c p i + i 2 k e q ρ c Δ | | p i + n 1 ρ c p i p i = p 0 e i ϕ e i k s ( x e k ) | e k | k s 2 = ( ω c ) 2
where, p 0 is pressure amplitude, e k is wave direction, and ϕ is phase.
Due to the small thickness of the plate, a plate with additional masses built with shell modules is adopted. The equation of the shell module in the frequency domain study is:
ρ ω 2 u = σ + F V e i ϕ + 6 ( M V × n ) z d e i M Ph ,          i k z = λ σ z = 0 , 1 z 1
where u is displacement of the shell, F V is the body force, M V is the body moment, σ is stress of the shell, ϕ is the load phase, and M Ph is moment load phase.
The flat plate is a linear elastic material, the thickness of the plate is set in the thickness and offset in the shell module, and the thickness is filled in d . A circle added the intermediate mass in the middle of the plate to form the additional mass which is attached the plate (see Figure 3).
The mass per unit area in the mass type is selected, and then the density per unit area ρ A is filled in. The additional mass satisfies the following equation:
F A = ρ A ( ω 2 u + a f )
where F A is the load (force per unit area) experienced by the structure and a f is coordinate system acceleration.
Both boundaries of the flat plate adopt fixed constraints to satisfy:
u = 0 a r = 0
where a r is the normal displacement of the shell.
The fluid–solid coupling of the plate with the mass and the cavity, that is, the pressure acoustics–frequency domain module and the shell module, are selected for the acoustic–structure boundary physical field coupling. The coupling equation for the exterior is as follows:
n ( 1 ρ c ( p t q d ) ) = n u tt F A = p t n
where u tt is the structural acceleration, n is the surface normal, and p t is the total acoustic pressure:
n ( 1 ρ c ( p t q d ) ) up = n u t t n ( 1 ρ c ( p t q d ) ) down = n u t t F A = p tdown n p tup n
The up and down subscripts refer to the two sides of the interior boundary.
The flat plate with mass is divided into a free quadrilateral mesh. The cavity and the neck are divided into the mesh by sweeping the plate with a three fixed elements. The upper boundary of the square pipe is divided into a free triangle mesh, and the maximum element size is 0.02 m. The remaining part of the square tube is divided into the mesh by the distribution of sweep method with ten fixed elements. The total number of the elements of the single cell is 4743.
The finite element mesh division diagram of the unit cell is shown in Figure 4. The finite element mesh of the shell in the unit cell is shown in Figure 5. A select frequency domain is studied in order to solve the model.
When calculating the band gap of the unit cell, after the geometric model is established, based on the above frequency domain calculation, periodic conditions are added to the pressure acoustic frequency domain module. The Floquet period is selected as the periodicity type [21]. The following equation is satisfied under periodic conditions:
p t , d s t = p t , s r c e i k F ( r d s t r s r c ) n d s t ( 1 ρ c ( p t q d ) ) d s t = n s r c ( 1 ρ c ( p t q d ) ) s r c e i k F ( r d s t r s r c )
The value of the Floquet period vector k is the value calculated from the wave vector π d along the x direction of the main pipe. The characteristic frequency study is increased, the parameterized scan is added to the study, and the wave vector is used to scan the first irreducible Brillouin zone [22] to obtain the energy band structure diagram.

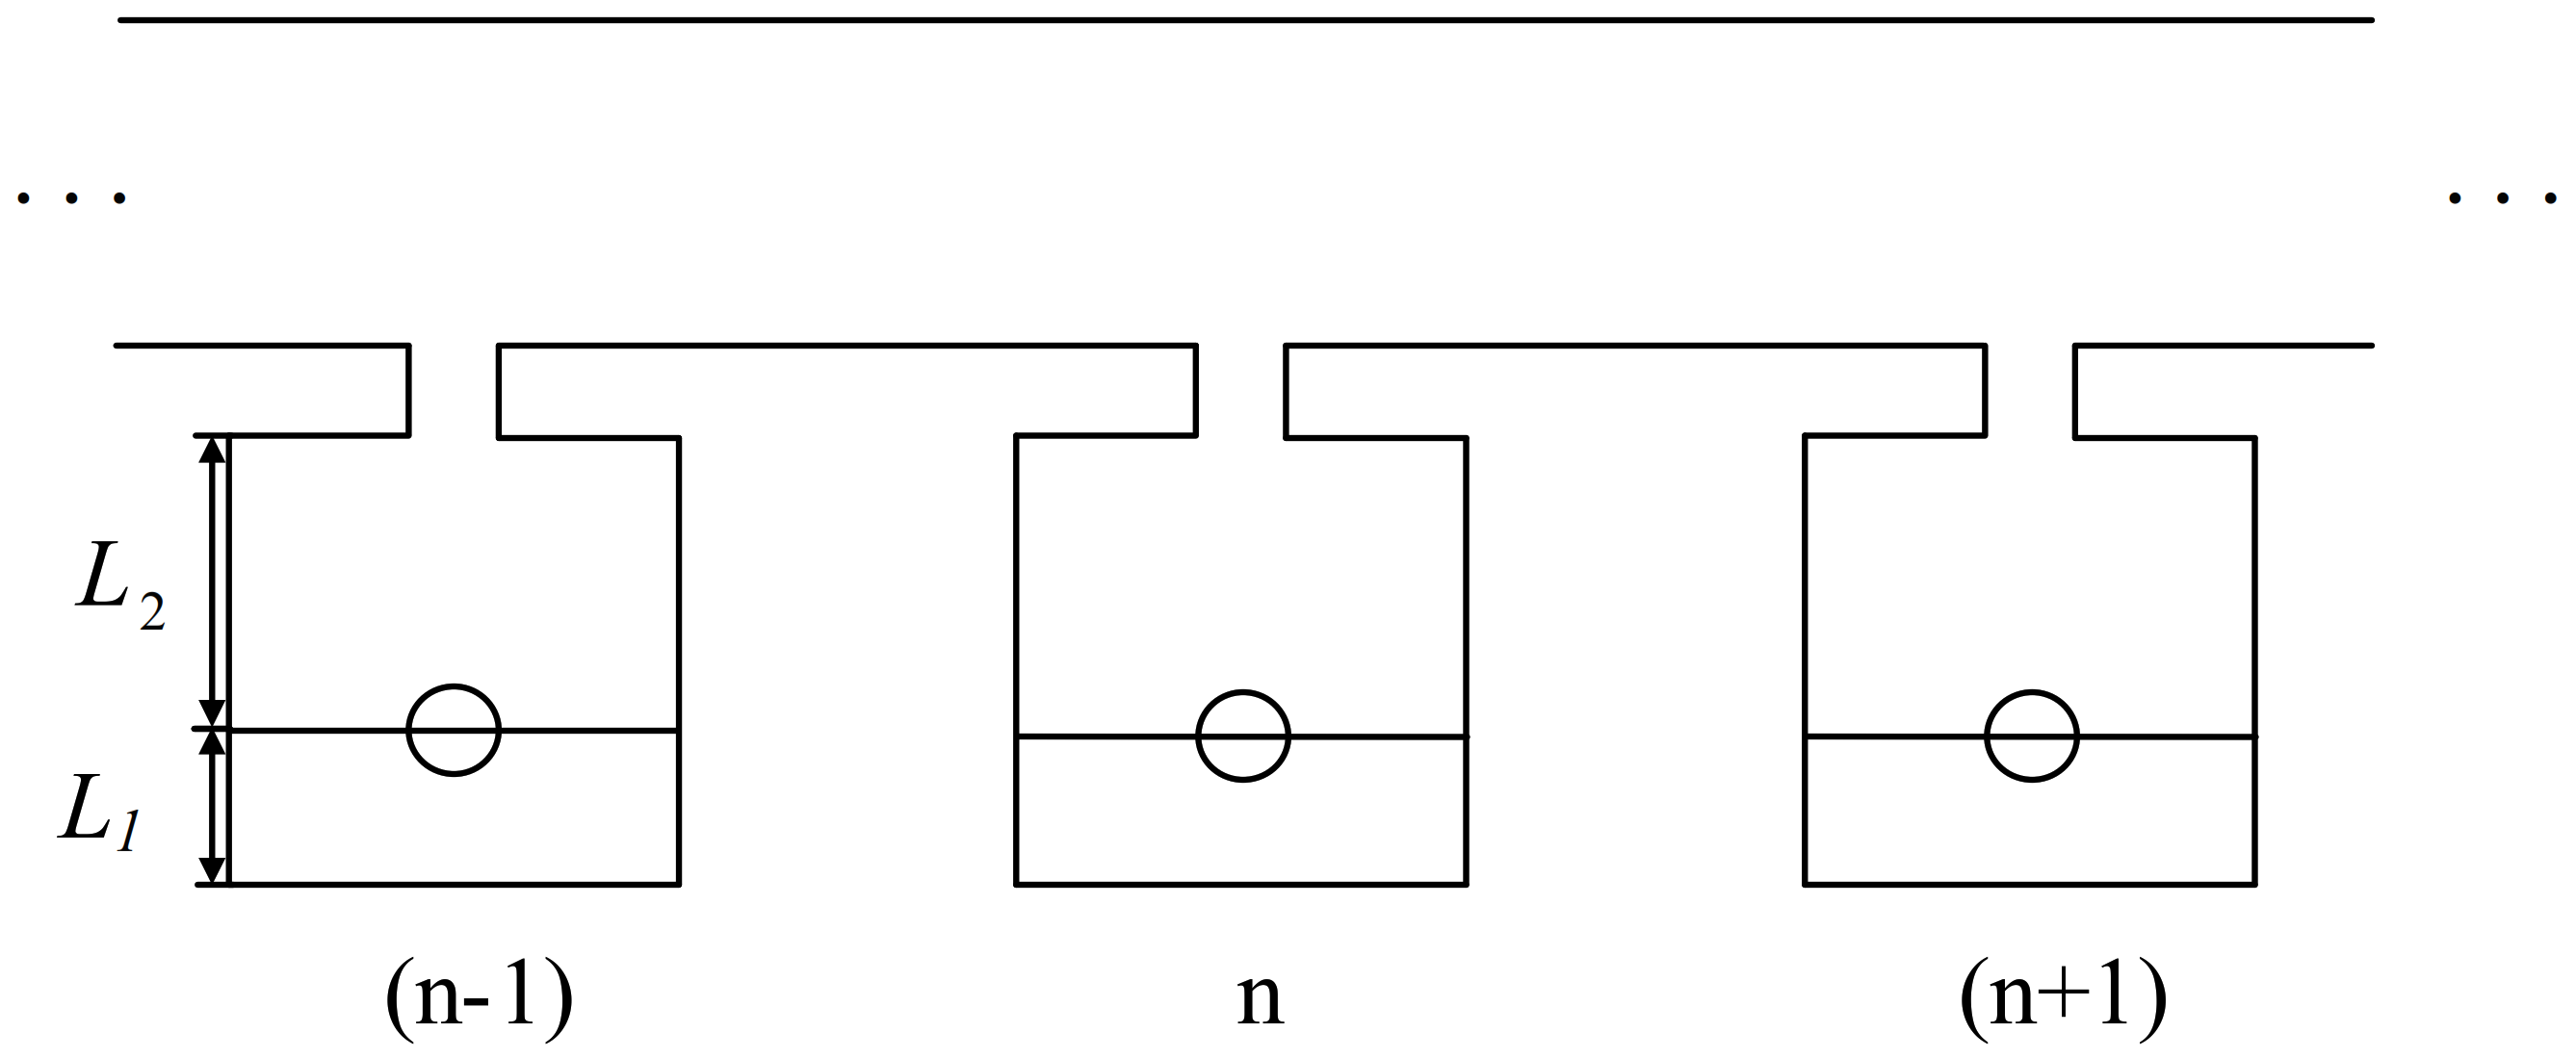
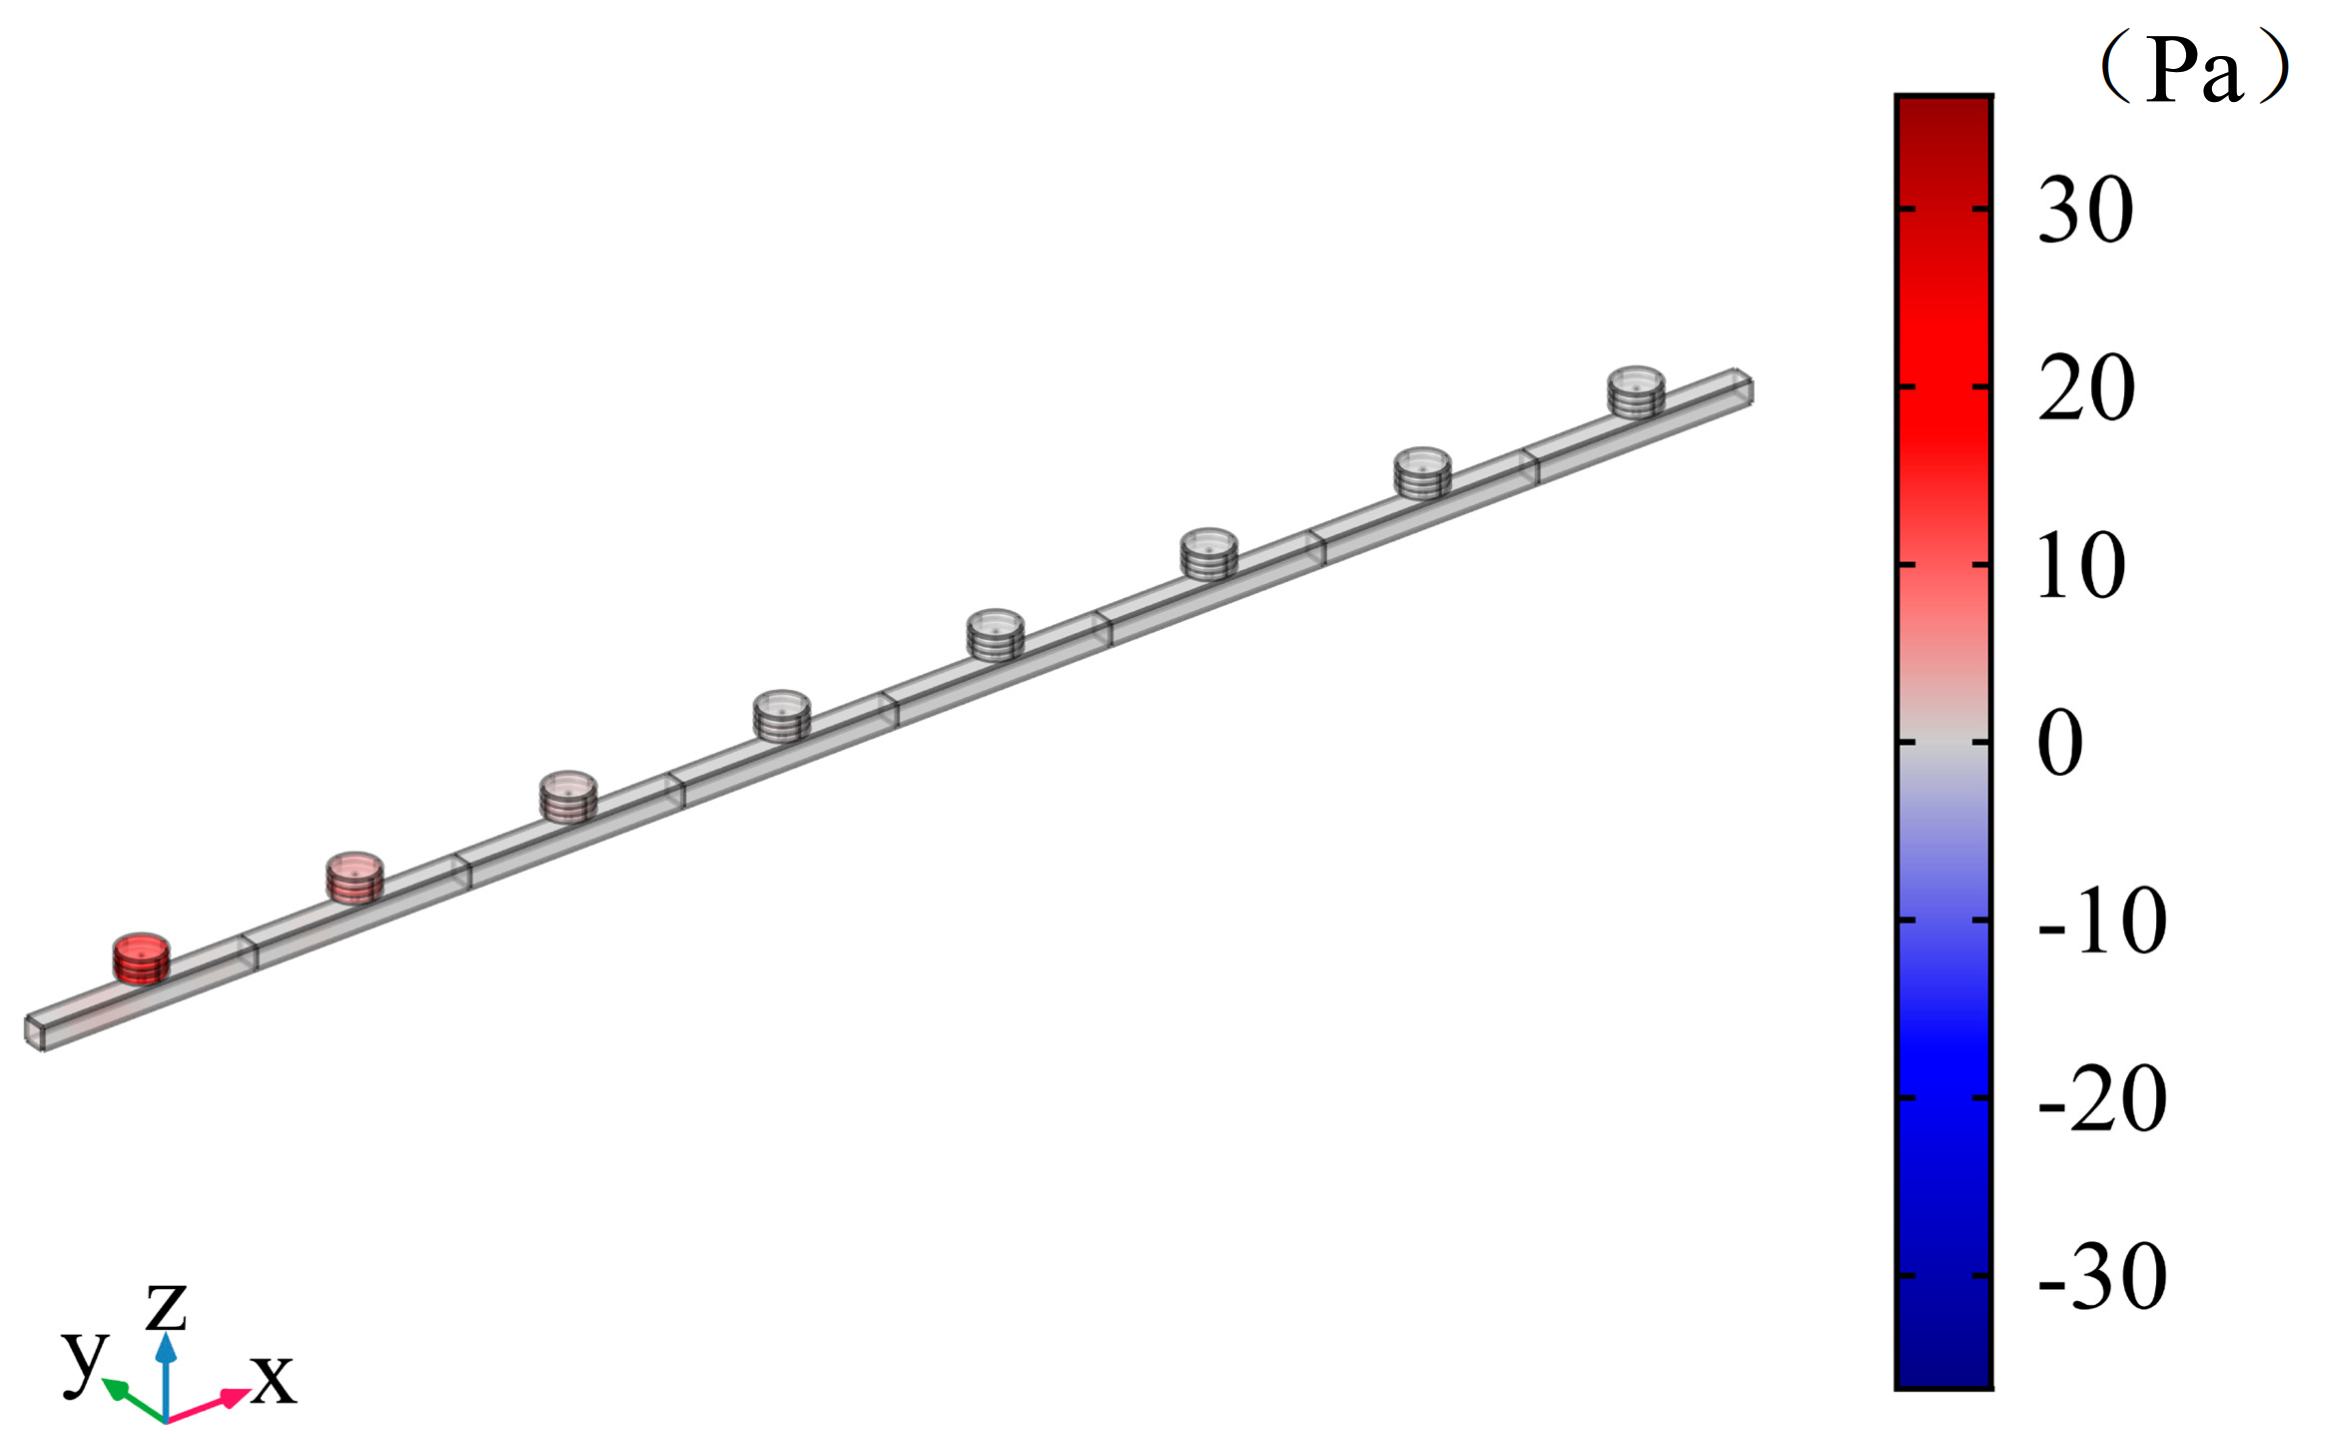
2.2. Acoustic Pipe with Periodic Multiple Local Resonant Cavities

Figure 6 shows a sketch of the proposed acoustic pipe. Multiple local resonant cavities are arranged at fixed intervals of 0.5 m along the square duct in the section area of 0.05   m × 0 . 05   m . This paper uses an acoustic pipe with eight local resonant cavities as an example for discussion. The finite element model is shown as Figure 7.
When calculating the transmission loss of a periodic pipeline, the sound intensity at the inlet and outlet of the pipeline should be extracted. The perfect matching layer (PML) is an artificially proposed loss layer in which waves attenuate and propagate without causing reflection. The perfect matching layer (PML) is set at the inlet and outlet of the periodic pipeline to reduce the reflection of sound waves at the interface. The effect of the perfect matching layer on the numerical simulation prevents the influence of reflected waves. The pipeline is a plane wave propagating in the positive X direction. The sound intensity can be obtained by extracting the sound pressure and particle velocity [23]:
I = p a 2 2 ρ 0 c 0 = p e 2 ρ 0 c 0 = 1 2 ρ 0 c 0 v a 2 = ρ 0 c 0 v e 2 = 1 2 p a v a = p e v e
where p a is sound pressure amplitude, ρ 0 is density, c 0 is sound speed, p e is effective sound pressure, v a is particle velocity amplitude, and v e is effective particle velocity.
According to the extracted sound intensity at the entrance and exit, the transmission coefficient of the sound intensity can be calculated as follows:
t I = I t I i
where I t is transmitted wave sound intensity and I i is the incident wave sound intensity.
The transmission loss is defined by the calculated sound intensity transmission coefficient as follows:
T L = 10 log 10 1 t I ( dB )

3. Transmission Loss of the Acoustic Duct with Periodic Multi-Local Resonant Cavity with Single Plate with Mass

3.1. Parameters for Simulation

The relevant parameters used in finite element simulation and their values are displayed in Table 1.

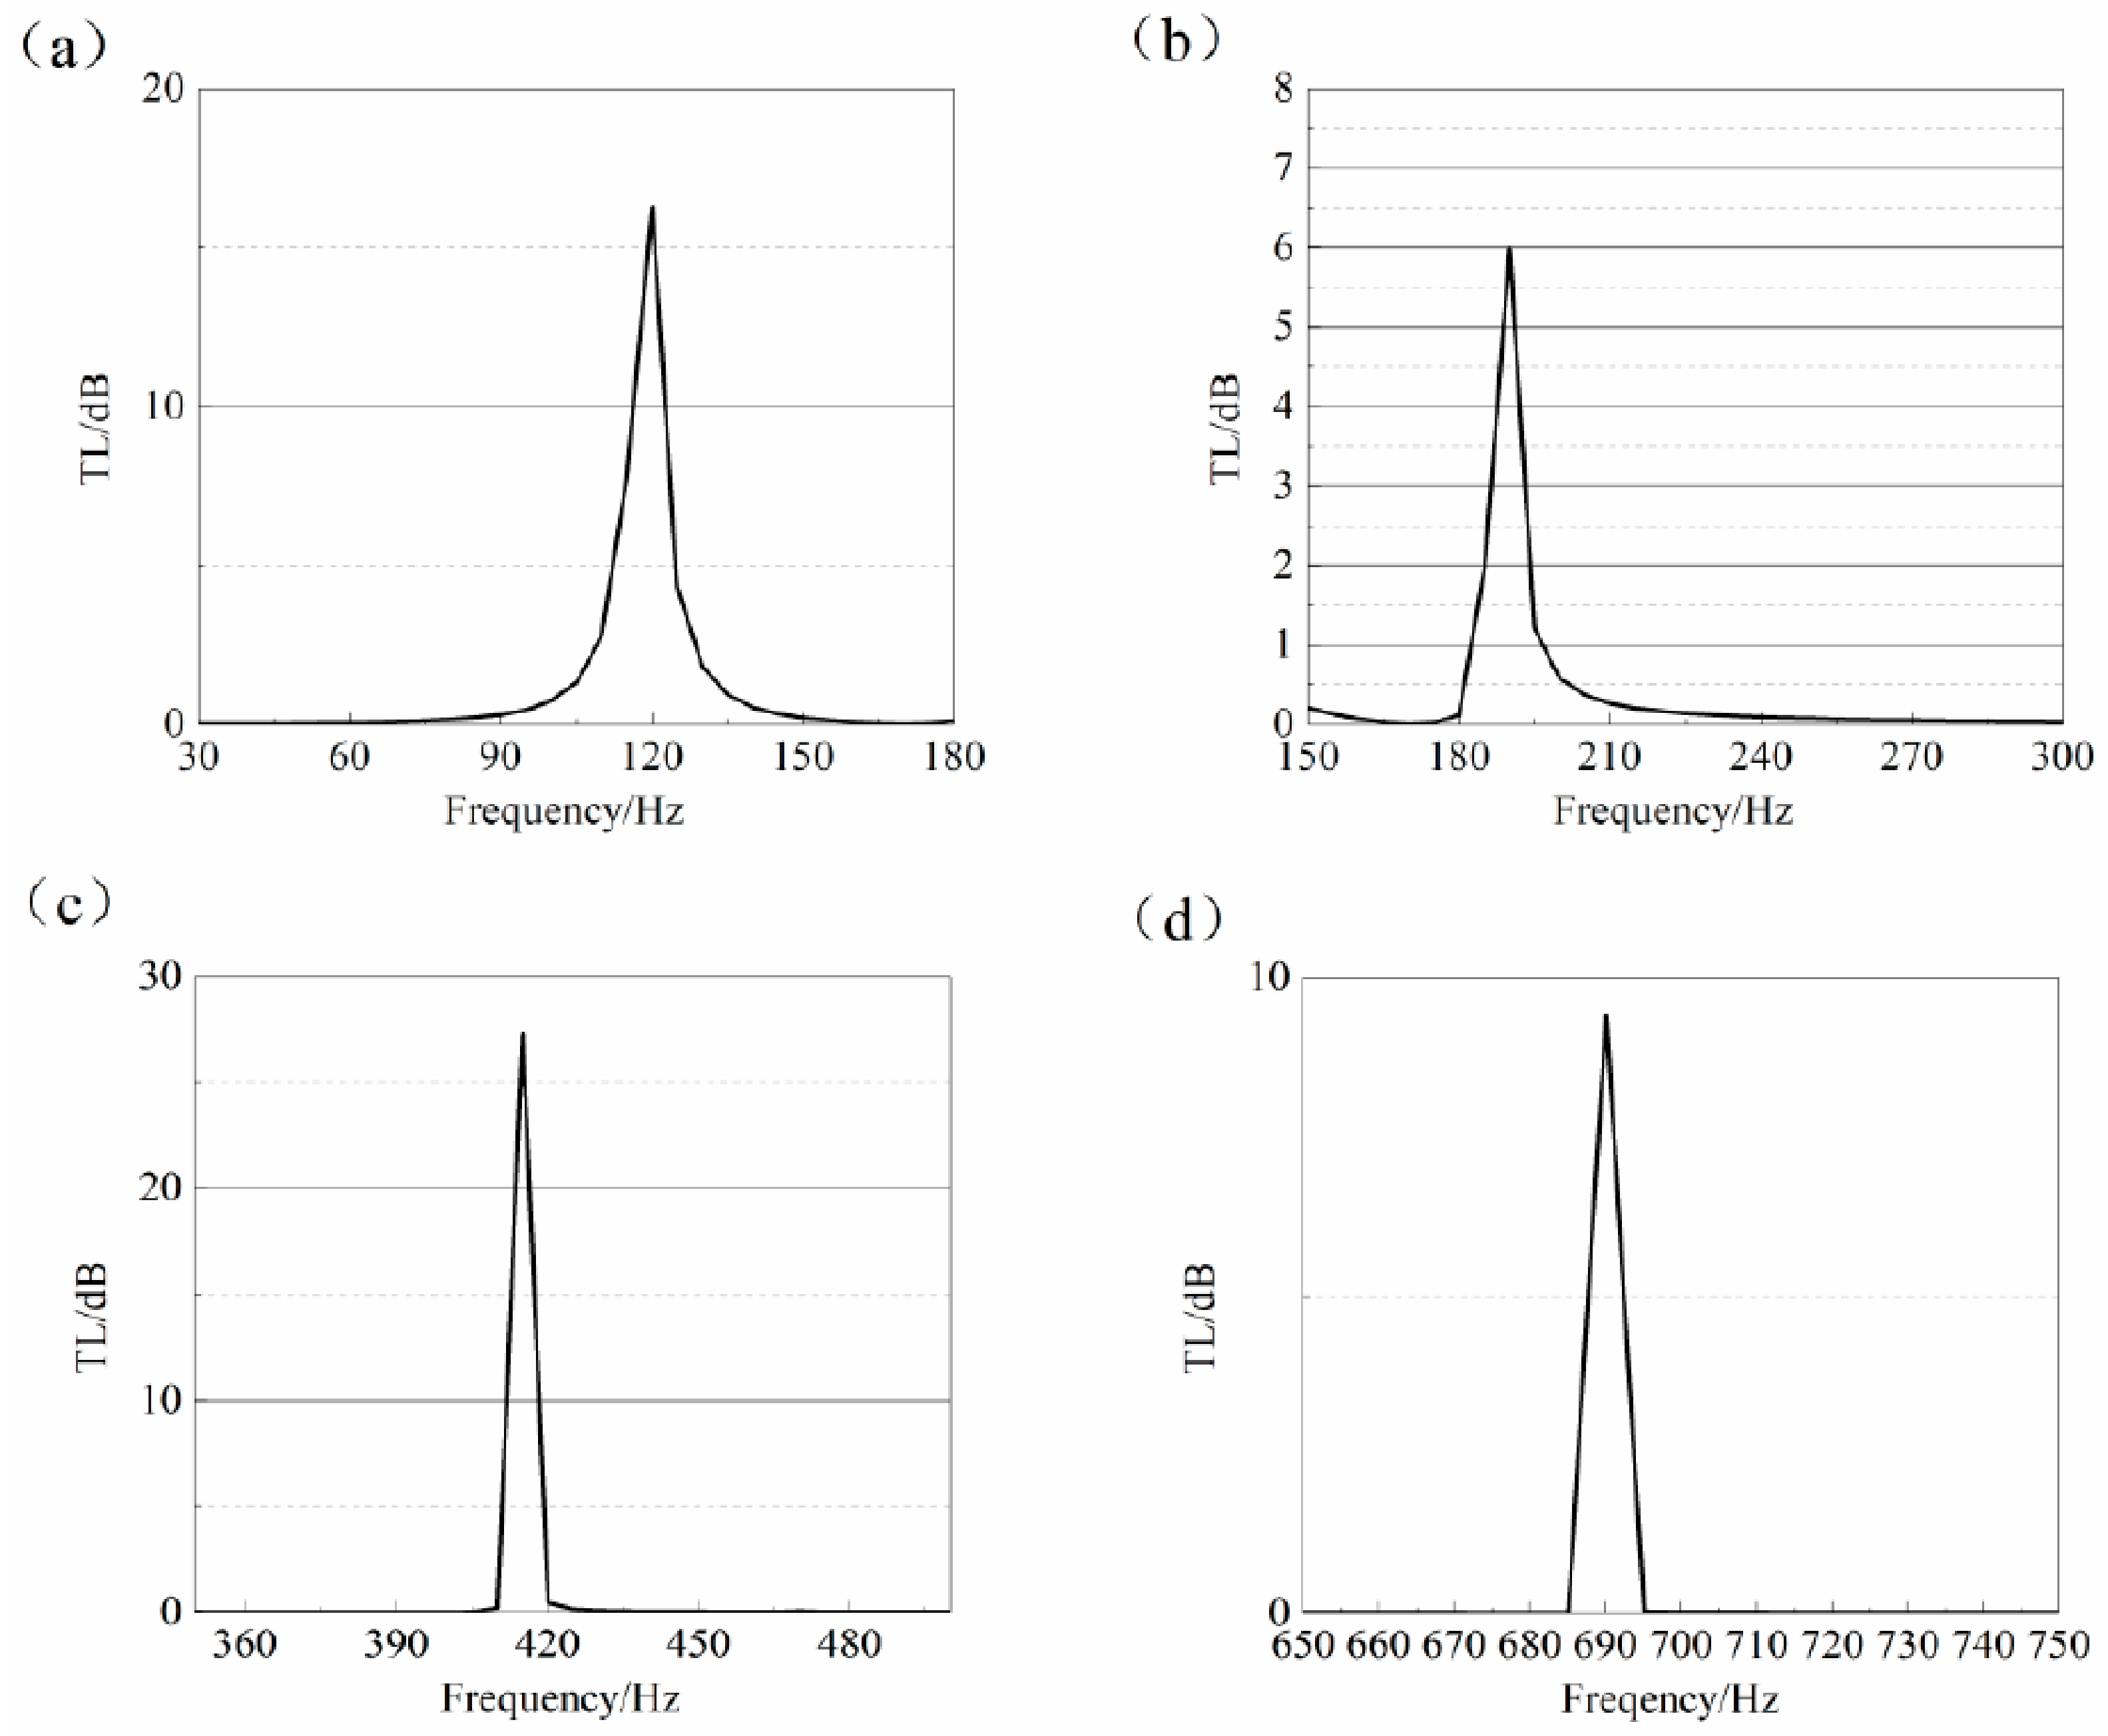
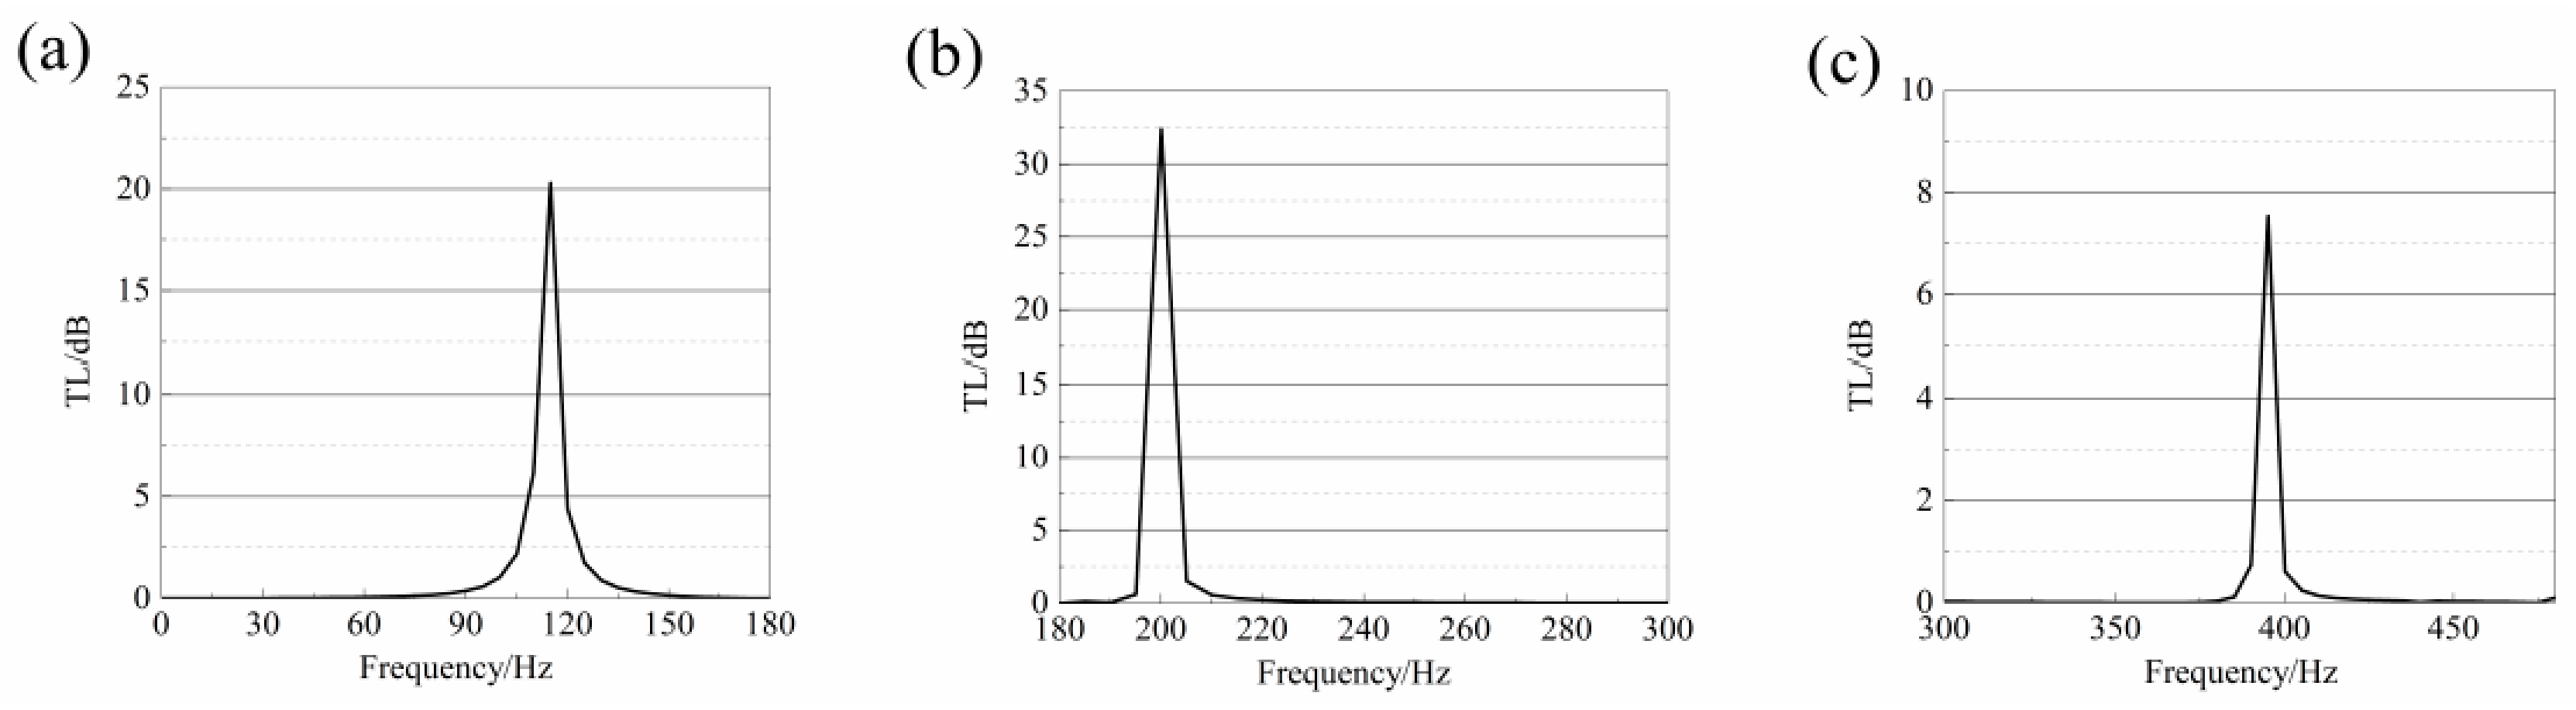
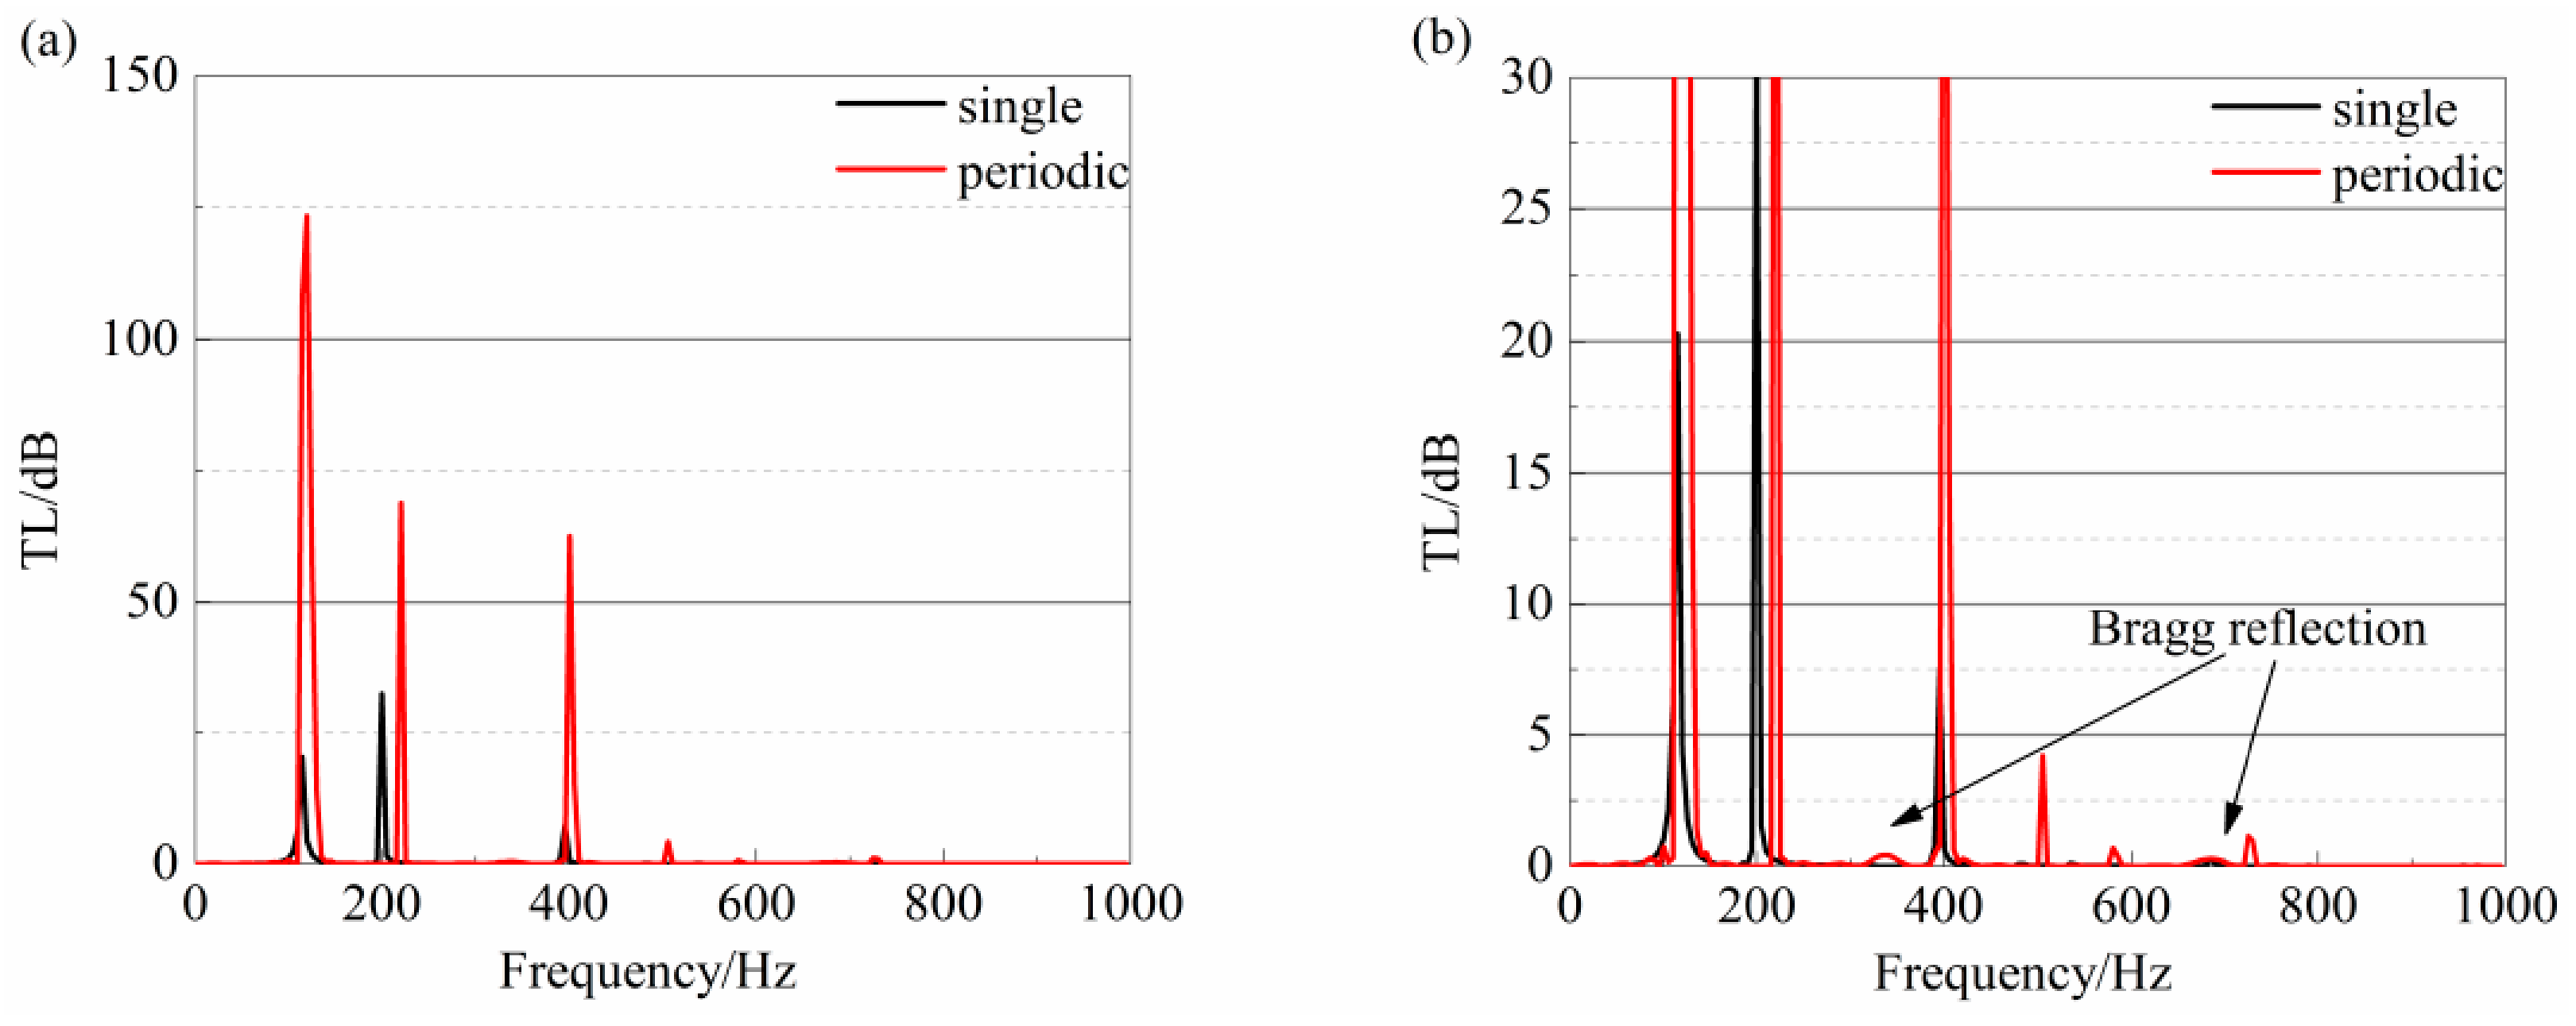
3.2. Transmission Loss of Multi-Local Resonant Cavity Acoustic Duct with Periodic Plate with Mass

The transmission loss curve of the proposed pipe system is shown as Figure 8a, the enlarged view of the curve in the frequency between 300 Hz and 800 Hz is shown in Figure 8b.
The transmission loss curve shows four peaks in the frequency between 0 and 1000 Hz, in which the first peak is analyzed. A thin plate with mass divided the cavity into two cavities. The lower cavity and the neck form a Helmholtz resonator with an elastic top which is 1 3 higher than the original one. When neglecting the wall friction, the upper and lower cavity are equivalent to two springs in series in the mass–spring system. According to the spring series relation, the total stiffness is:
1 K = 1 K u p p e r + 1 K l o w e r
If the plate inserted is rigid, the stiffness of the upper cavity is K u p p e r , so the total stiffness is K K l o w e r . However, the thin plate is assumed to be elastic in this study. Therefore, the stiffness of the upper cavity K u p p e r is not infinite. The reciprocal value of total stiffness 1 K increases and the total stiffness K decreases.
Moreover, regarding the material of plate as a rigid plate largely influences the Young’s modulus. The Young’s modulus of the top plate is smaller, but the elasticity is larger. Additionally, the stiffness K l o w e r is smaller but the reciprocal value of total stiffness 1 K increases. As a result, the total stiffness K decreases.
When neglecting the damping of the system, the resonant frequency can be expressed as:
f = 1 2 π K M
Through the analysis above, it is found that inserting an elastic plate with mass in a cylindrical Helmholtz cavity causes a total decrease in stiffness K and the resonant frequency f to move to the low frequency.
Moreover, by analyzing the electroacoustic analogy diagram of the proposed structure, the resonant circular frequency can be obtained. When the frequency of the input pressure matches the resonant frequency, a local resonance occurs and the control of noise of different frequencies can achieve.
From Figure 8, it can be concluded that the periodic pipeline system develops lower peaks around 343 Hz and 686 Hz, as well as peaks close to the peaks of the cell transmission loss curve. The two mechanisms of the band gap formation of the acoustic pipe with periodic additions are the resonance of single-cell and Bragg scattering [24]. The reason why the peaks of the cell are close to the resonant frequencies of multiple local resonant cavities is the resonant mechanism of multiple local resonant cavities. The other frequencies of the stopband caused by Bragg scattering can be derived by:
f m = m c 0 2 d ( m   is   an   integer )
For an interval of the pipeline system (length of cell) measuring 0.5 m, this interval can be substituted into (16) to obtain:
f m = 343 m ( Hz ) ( m   is   an   integer )
The frequencies calculated from the above equations match the simulation results.

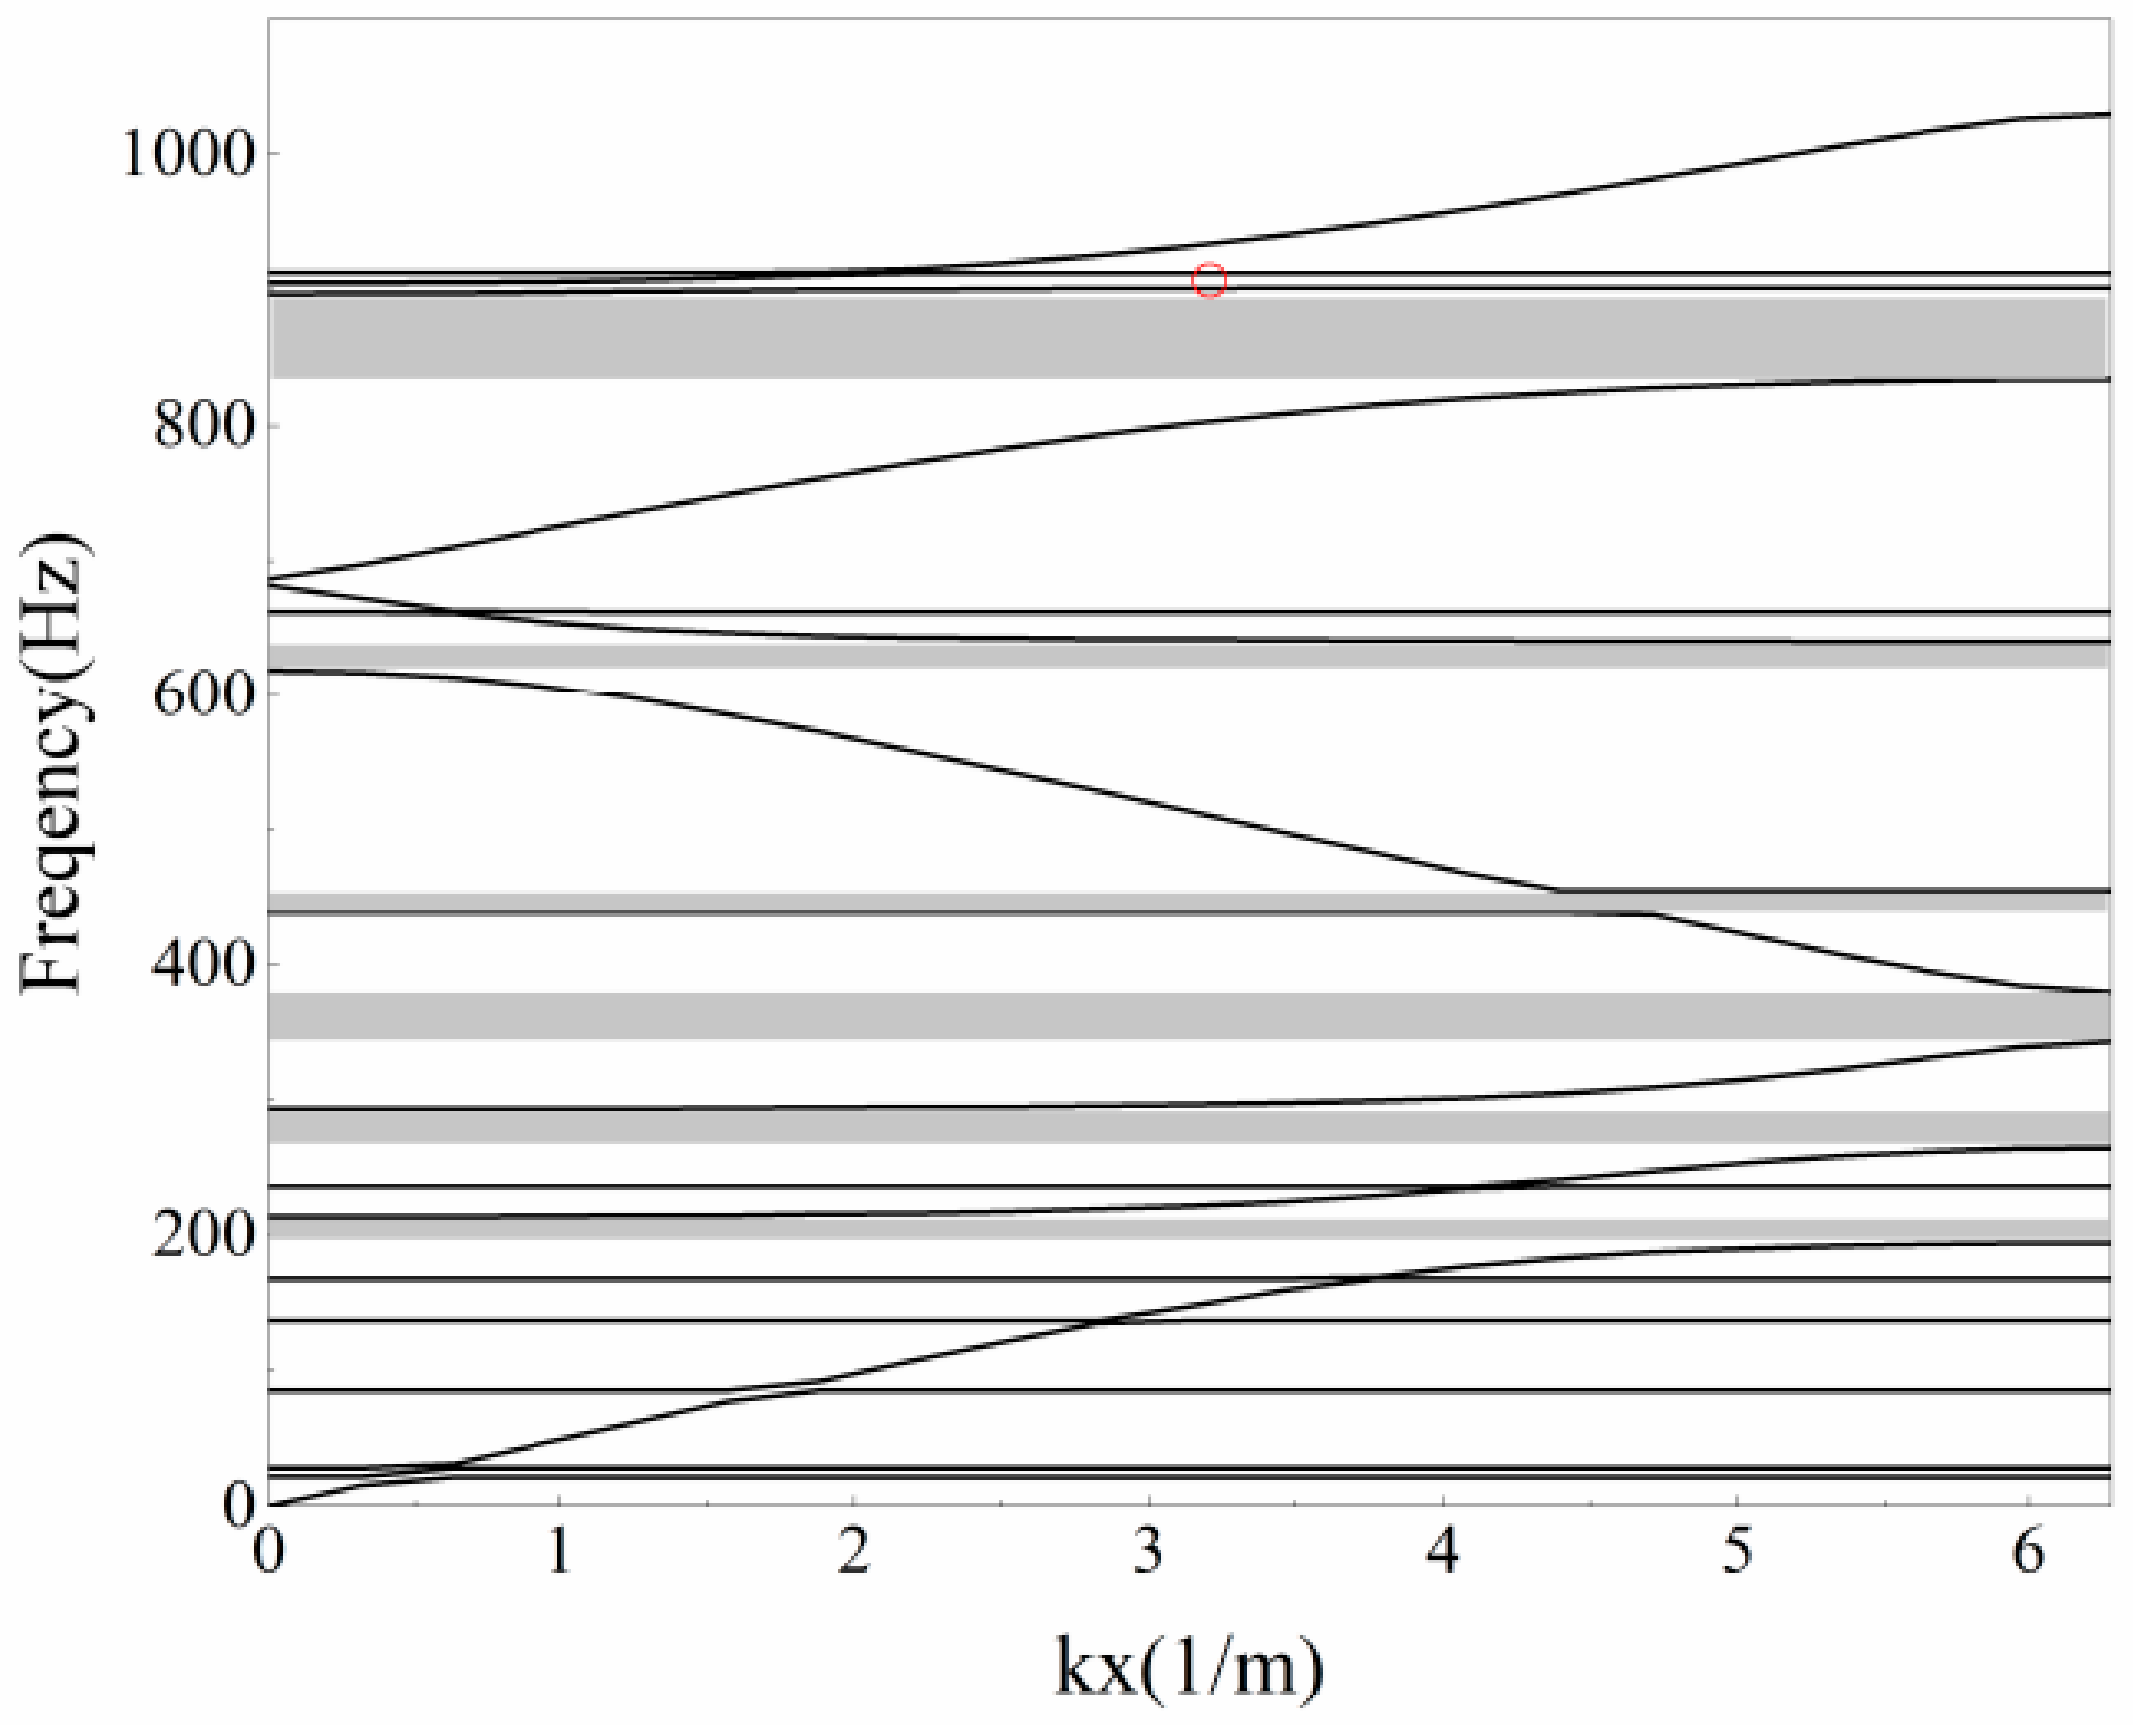
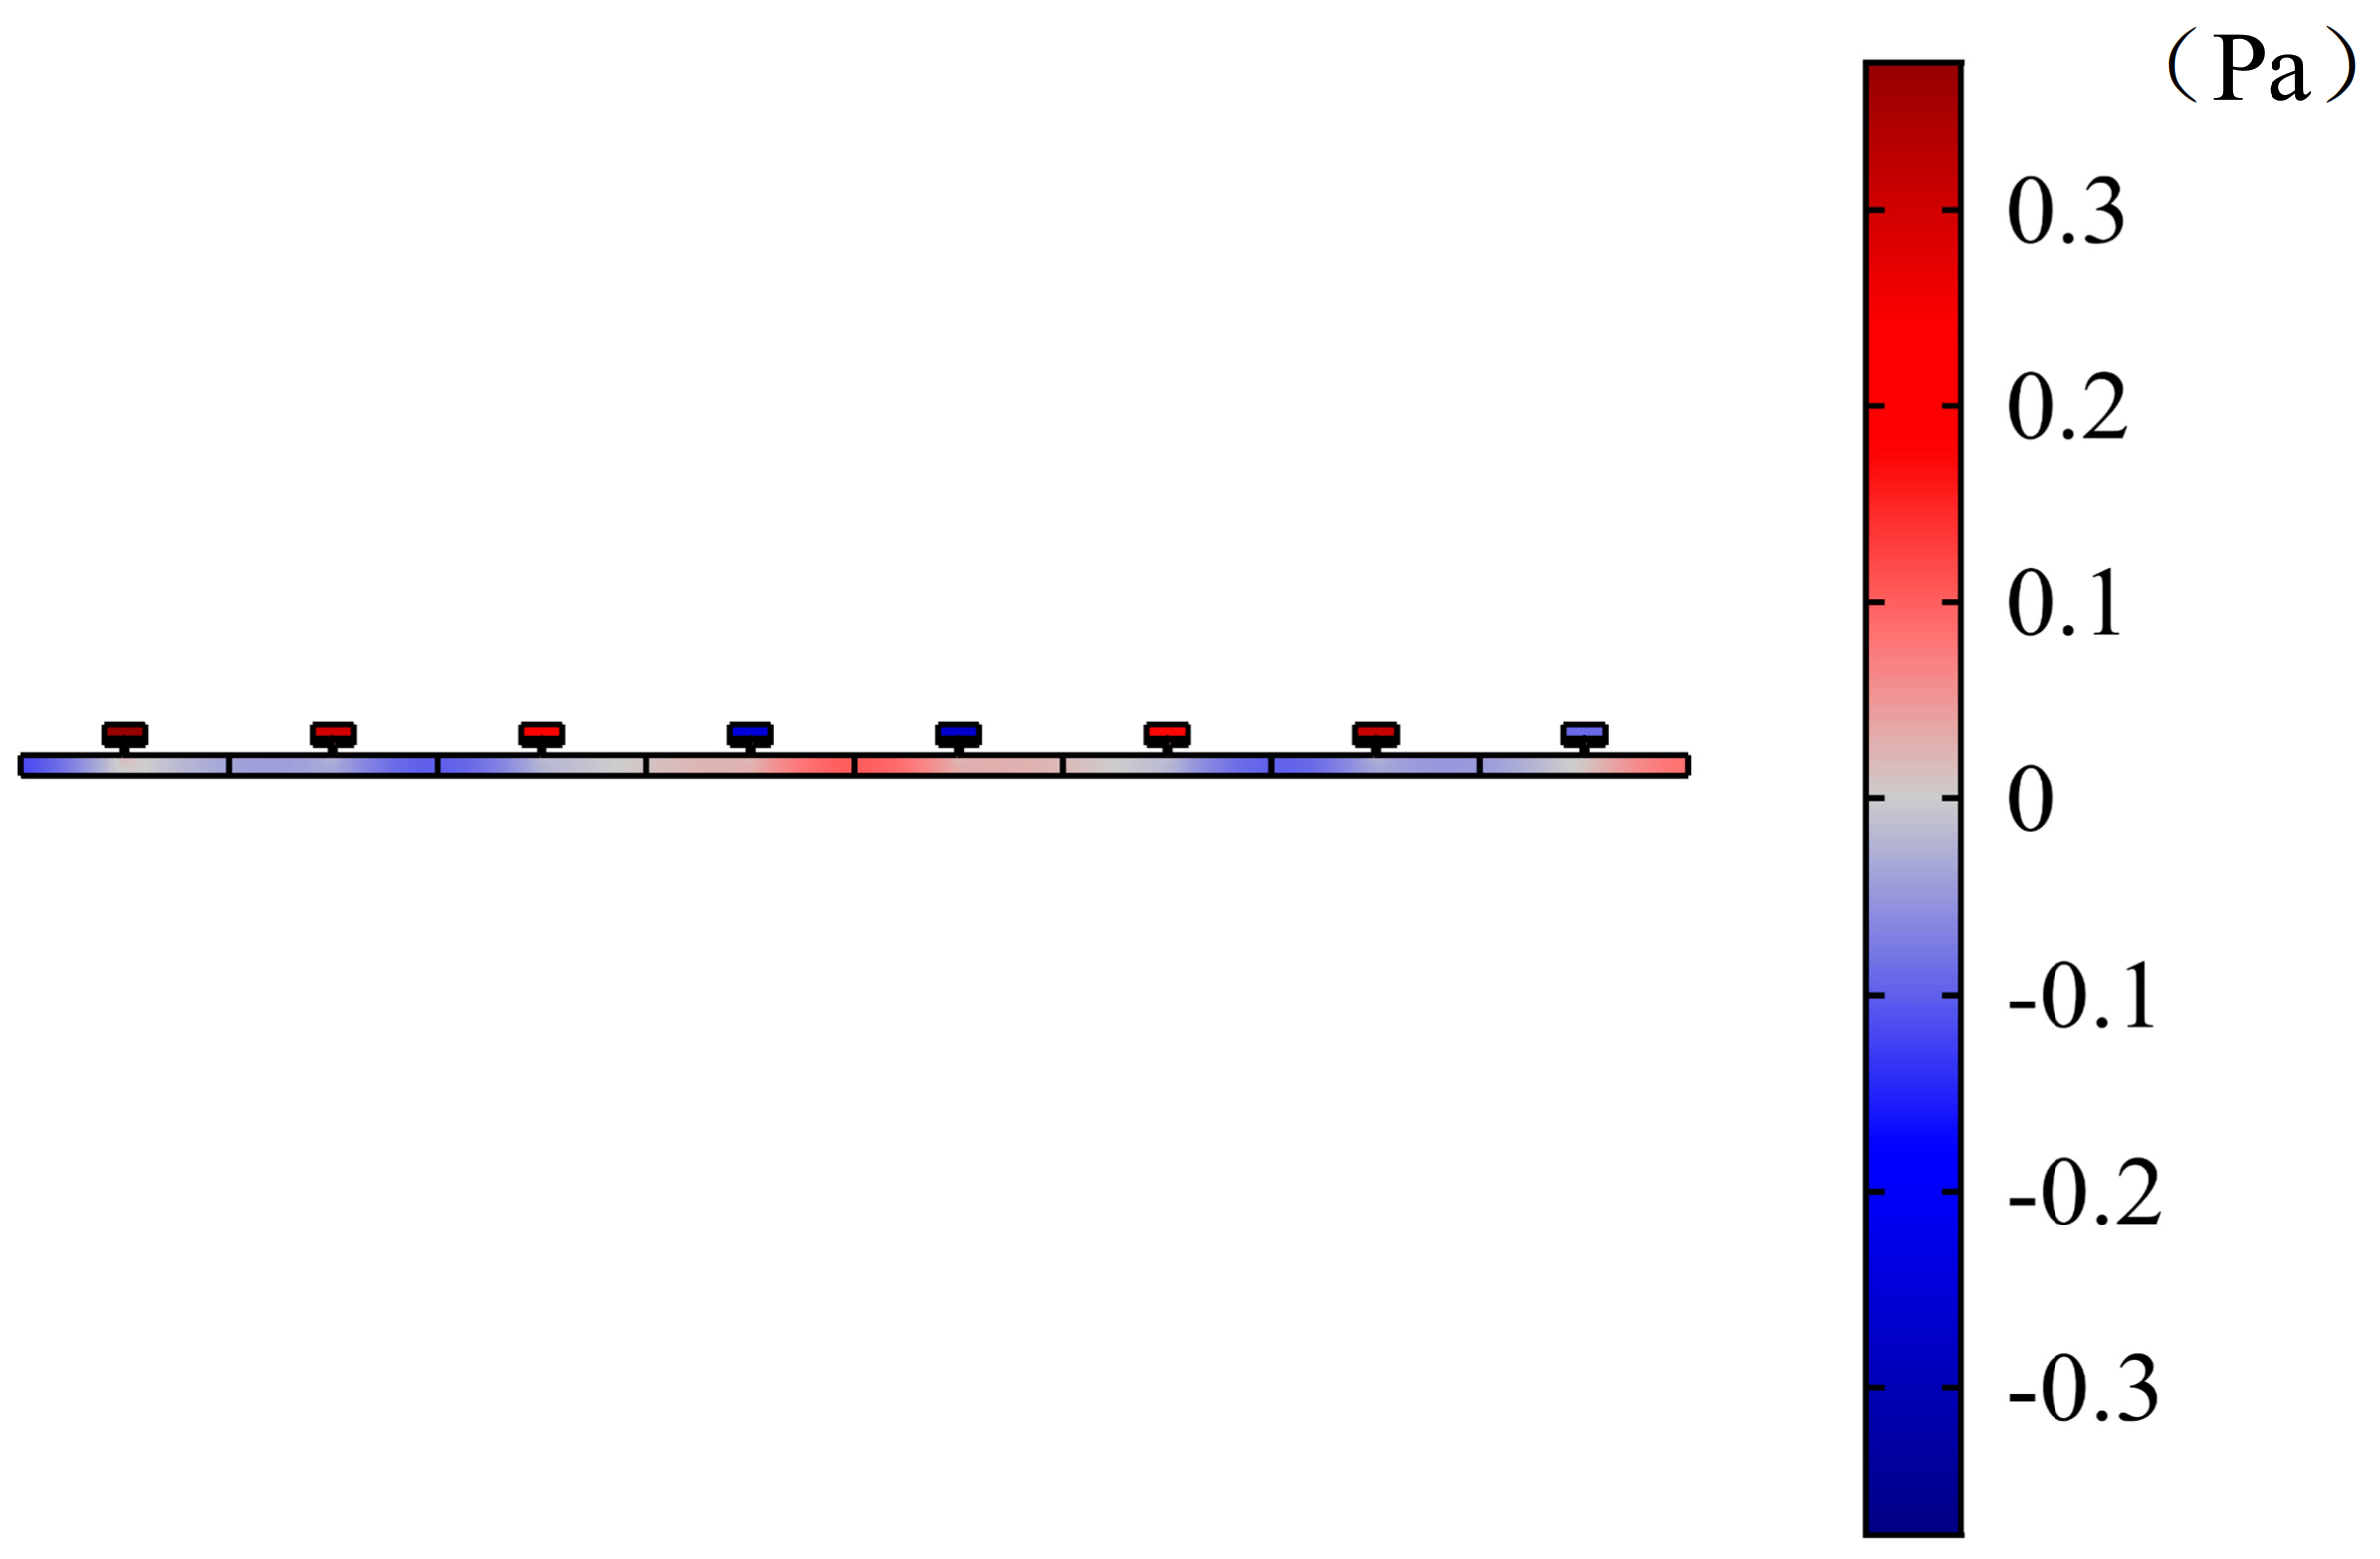
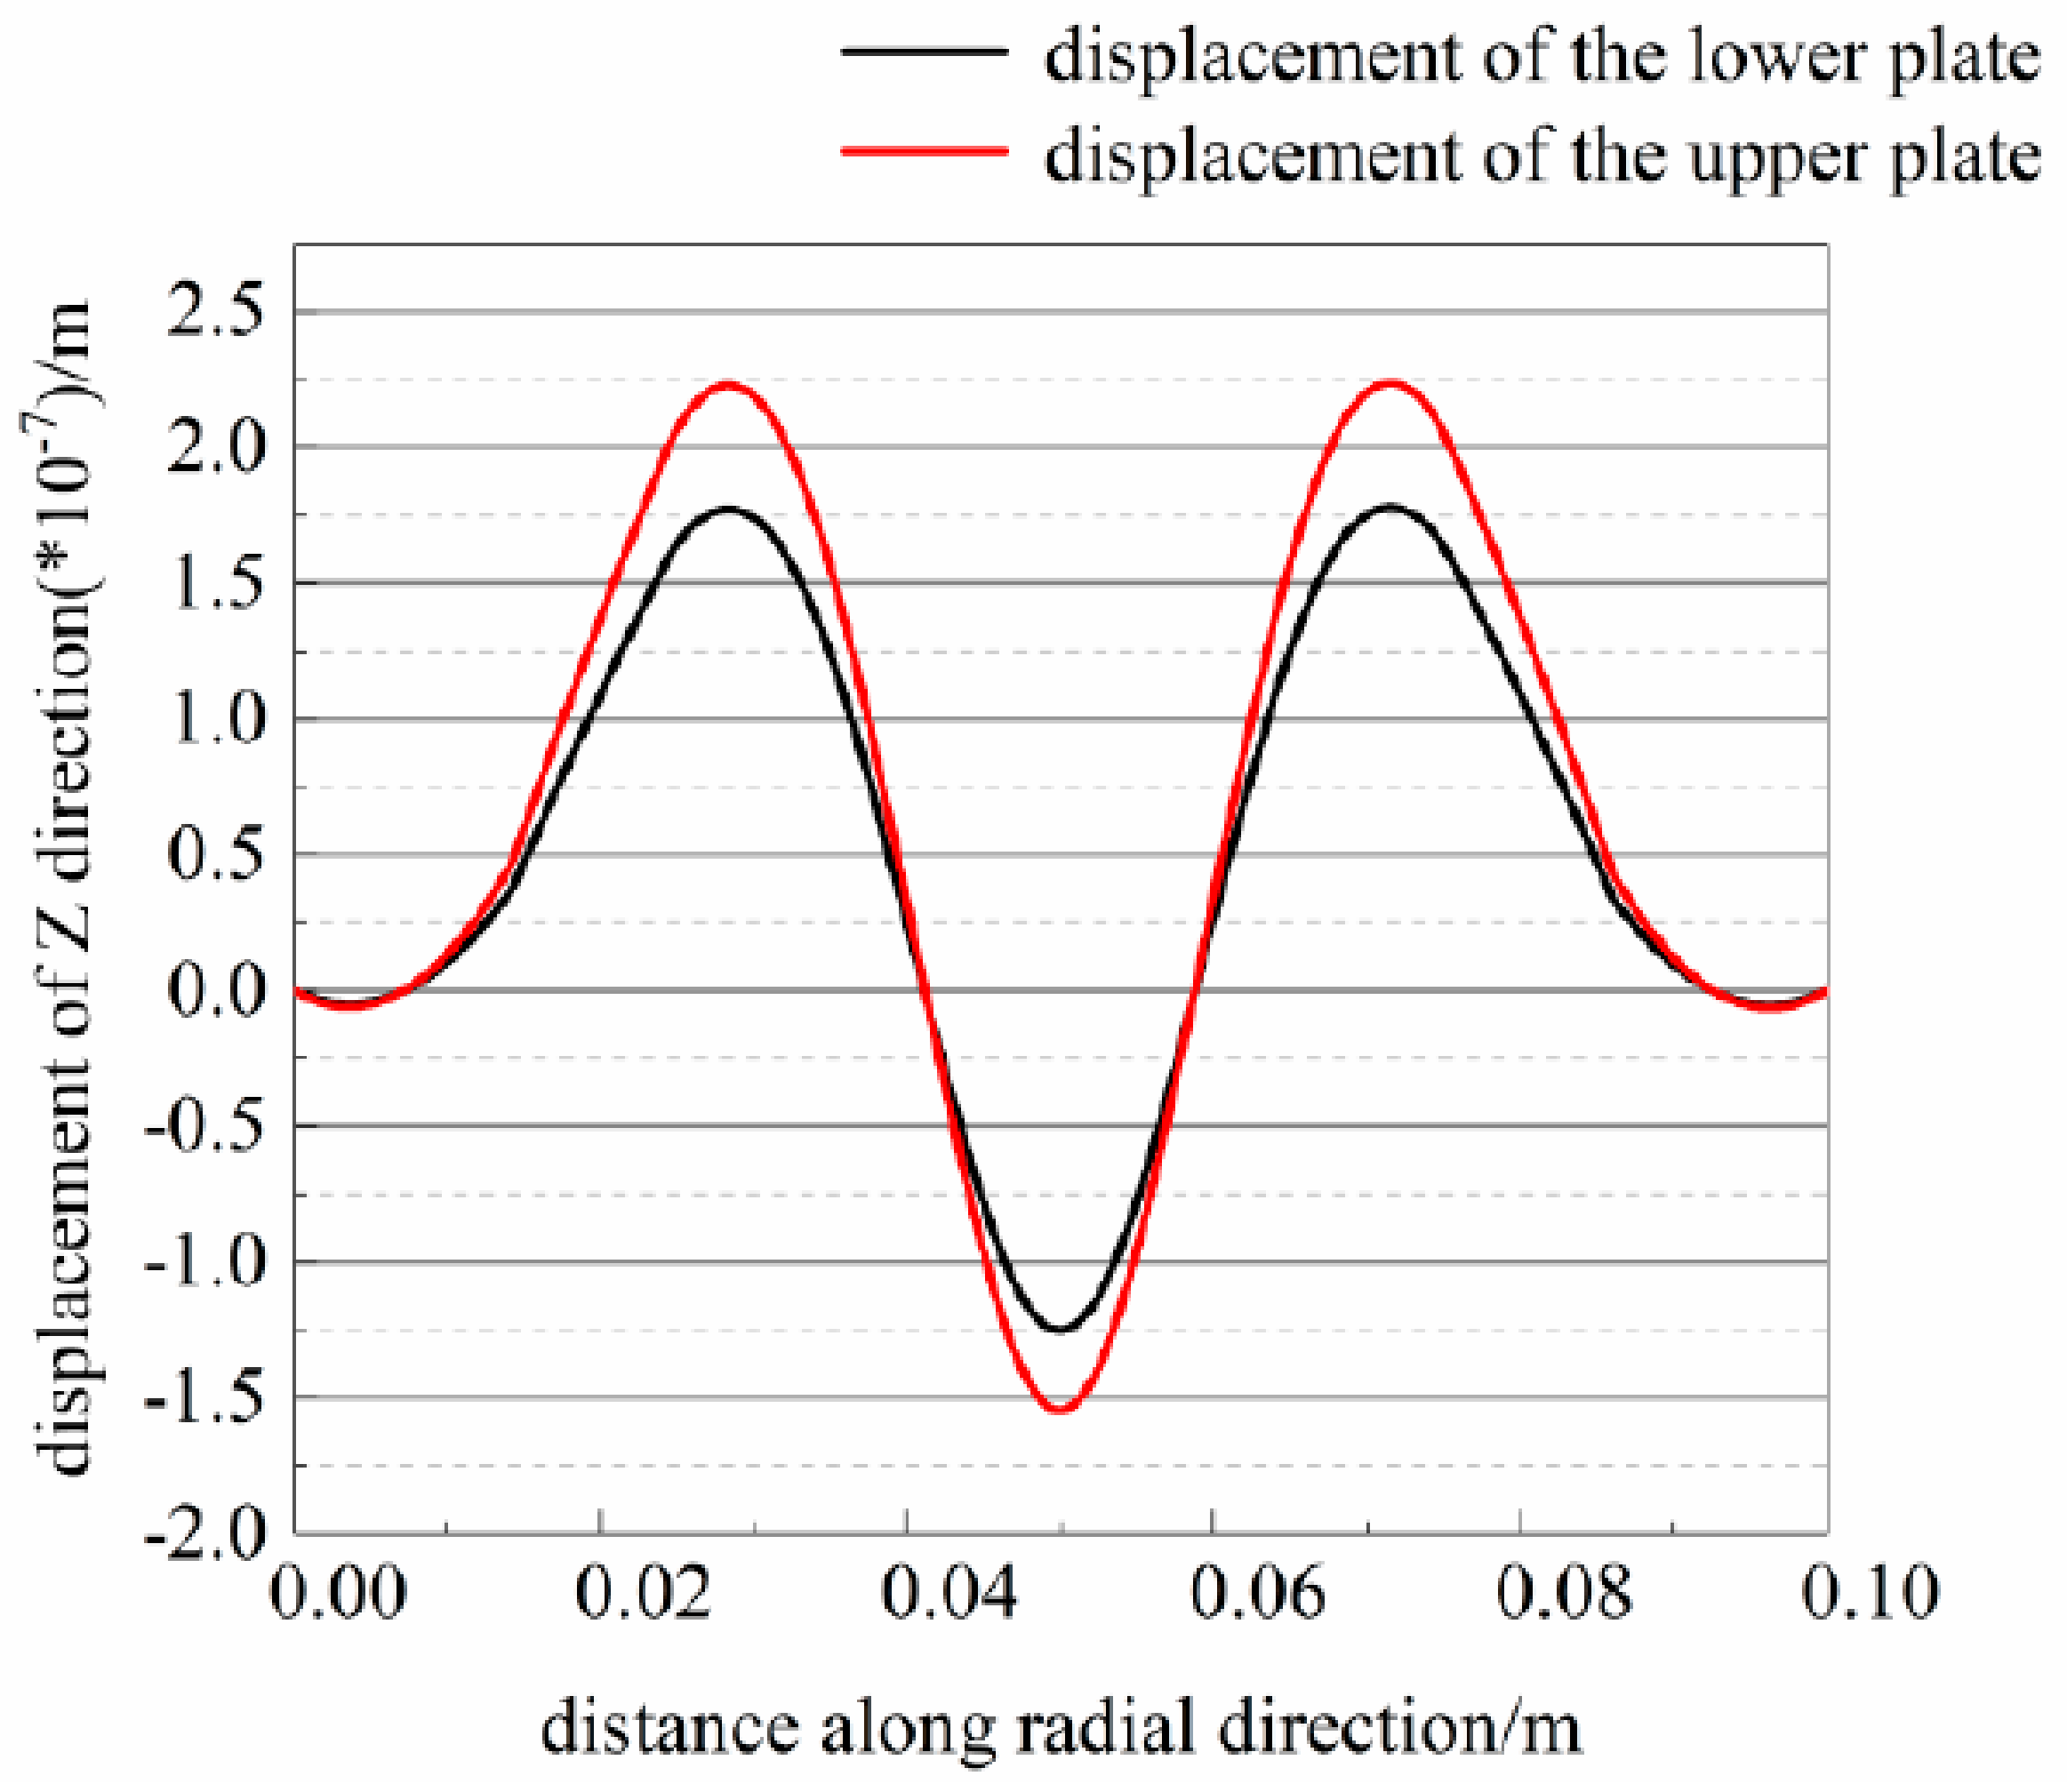
3.3. Band Structure Analysis of Multi-Local Resonant Cavity with Additional Plate and Mass

By selecting the two-dimensional resonant cavity cell with the same parameters (see Figure 9), the band structure can be calculated, as shown in Figure 10. The band gap in the energy band structure diagram is indicated by the gray area and the red circle. Its periodic pipeline transmission loss is shown in Figure 11.
The band structure diagram and the periodic, pipeline transmission loss diagram of the two-dimensional, heterogeneous Helmholtz resonator unit cell with the same parameters, were compared. It was found that seven obvious band gaps could be seen in the band structure diagram, all of which corresponded to the periodic pipeline. In the transmission loss graph, there are six transmission loss peaks caused by local resonance and one peak caused by Bragg scattering. There are two typical band gaps for analysis: observing the band gap diagram at the 288 Hz frequency corresponding to the end of the band, for which the unit cell presents a flat plate mode (see Figure 12 and Figure 13); and the response of the periodic pipe at this frequency, which is also shown on the flat plate (see Figure 14 and Figure 15). Each cell in the periodic pipe has a flat plate. The plate in the first cell deforms, has the largest response, and is similar to the mode.
According to the energy band structure diagram, the first energy band for analysis is chosen. The upper and lower limits of the first energy band are 194.45 Hz and 213.69 Hz, respectively. When the wave number is π d , the mode of the unit cell is observed at the frequency of 194.45 Hz. It is found that the mode of the unit cell at this time is mainly represented by a flat plate (see Figure 16 and Figure 17). The flat plate vibrates and stores energy in the pipe. The sound pressure in the unit cell is mainly concentrated in the upper cavity. When considering periodic pipelines, at 195 Hz, the sound pressure is concentrated in the cavity of each cell, and, in Figure 18 and Figure 19, the sound pressure in each upper cavity is presented in a darker color than that in the pipeline, which corresponds to the high sound pressure in the legend. Additionally, the sound pressure distribution of the first unit in the periodic pipe is very similar to the sound pressure distribution of a single cavity. The response of the total slab of the periodic pipe is observed. The first unit cell has the largest response, and the deformation is similar to the mode.
There is a band gap between 340 and 380 Hz (see Figure 10) caused by the Bragg band gap of the periodic arrangement of the multi-local Helmholtz resonator. Because of the periodic arrangement, the multi-local Helmholtz resonator strongly couples with the incident wave, reflected wave, and transmitted wave, and interferes with a specific frequency band, which affects the sound propagation at this frequency. From the above analysis, the center frequency of the Bragg band gap is determined by the speed of sound and the length of the pipe unit. According to the calculation, the center frequency is 343 Hz, which is located at the lower band edge of the band gap.

4. Transmission Loss of the Acoustic Duct with Periodic Multi-Local Resonant Cavity with Several Plates with Masses

Based on the acoustic duct with a periodic, local, resonant cavity with a single plate with mass, further studies on the acoustic duct are ongoing. The local resonant acoustic duct with two plates with masses or three plates with masses is designed.

4.1. Transmission Loss of Acoustic Duct with Periodic Multi-Local Resonant Cavity with Two Plates with Masses

4.1.1. Transmission Loss of Multi-Local Resonant Cavity with Two Plates with Masses

The multi-local Helmholtz resonant cavity is composed of two plates which have the same radius as the cavity, with a mass at 1 3 and 2 3 the height of the cavity, respectively (see Figure 20). The transmission loss of this multi-local, resonant cavity is displayed in Figure 21. The enlarged view of the four peaks of the transmission loss curve is shown in Figure 22.
The transmission loss of the multi-local Helmholtz resonant cavity with two plates with mass reaches 16.26 dB at 120 Hz (see Figure 22a), 5.98 dB at 190 Hz (see Figure 22b), 27.30 dB at 415 Hz (see Figure 22c), and 9.41 dB at 690 Hz (see Figure 22d).
Among the peaks, the explanation for the first two peaks is similar to the first two peaks of the Helmholtz resonant cavity with a single plate with mass. The two plates divided the cavity into three parts. When neglecting the wall friction, the cavities can be regarded as a spring–mass system and the system is three springs in series. According to the equation of the springs in series:
1 K t o t a l = i = 1 n 1 K i
When considering the plate inside as the rigid plate, the stiffnesses of the upper two cavities are K 2 , K 3 , then K total K 1 . This paper considers the plate as an elastic one, so the stiffness of the upper cavities K 2 , K 3 is a finite number. As a result, the total stiffness K t o t a l decreases.
Because of the elasticity of the plates inside, when the elasticity increases, the stiffness of the two cavities K 2 , K 3 decreases and the total stiffness K t o t a l decreases. Then, the resonant frequency shifts to the lower range.
The third peak of the transmission loss appears at 415 Hz and the vibration response of the plate is shown in Figure 23. The transverse displacement of the circular plate varies with the radial direction, as shown in Figure 24. The sound pressure distribution of the cavity is shown in Figure 25. It is found that two plates vibrate in the same direction. In this case, fluid in the upper cavity is compressed but fluid in the lower cavity is stretched. The fluid in the middle cavity is stretched because the displacement of the upper plate is larger than that of the lower plate. At the same time, the influence of the two plates is partly counteracted.
The upper and lower cavity and the two plates form the spring–mass system separately. The vibration process of the spring–mass system is the transformation of kinetic energy and potential energy. When the lower fluid is stretched, the equivalent spring is stretched. The energy of the lower plate and lower cavity mostly transforms into potential energy. When the top fluid is compressed, the equivalent spring is compressed. Additionally, the energy of the upper plate and top cavity mostly transforms into potential energy. The middle fluid behaves as a spring. In this process, the volume of the middle fluid changes minimally. This means the potential energy of the equivalent spring in the middle fluid is at the minimum while the kinetic energy is at the maximum. In this case, the kinetic energy and potential energy of the system reach their maximum.
Most of the energy in the duct is simultaneously saved in the cavity and plate with mass, so there is a lot of attenuation in the energy, which appears as a peak.
The fifth peak appears at 690 Hz. The vibration response of the plate is shown as Figure 26. The transverse displacement of the circular plate varies with the radial direction, as shown in Figure 27. The sound pressure distribution of the cavity is shown in Figure 28. It is found that two plates vibrate in the opposite direction but their vibration displacements are the same. Therefore, the fluid in the top and bottom cavities is compressed and the middle fluid is stretched. The cavity and the neck, or the plate with mass, form the spring–mass system and the fluid in the cavity is compressed/stretched means the shape change of the corresponding spring. The volume of the cavity changes represents the vibration of the spring–mass system. When the kinetic energy and potential energy both reach the maximum, the cavity stores the energy from the duct. The energy attenuation appears while it leaves the duct, and then forms a peak.

4.1.2. Transmission Loss of the Acoustic Duct with Periodic Multi-Local Resonant Cavity with Two Plates with Masses

Multiple local resonant cavities with two plates and masses are arranged at fixed intervals of 0.5 m along the square duct. This paper focuses on an acoustic pipe with eight local resonant cavities as an example for discussion. The transmission loss of the acoustic duct is shown in Figure 29a and the enlarged view is shown in Figure 29b. It can be concluded from the enlarged view (Figure 29b) that the transmission loss curve of the periodic duct peaks appear not only close to the peaks of the original cell but also at 505 Hz. The sound pressure distribution of the cavity at 505 Hz is shown in Figure 30. The plate response at 505 Hz is shown as Figure 31.
From Figure 30, the sound pressure of the first cell of the acoustic duct is much larger than the other cells, meaning that the responses of the two plates are much larger than those in the other cells (see Figure 31). This means the vibration of the two plates counts most in the form of the transmission loss peak. Moreover, the two plates vibrate in the opposite direction and the response is the largest at this frequency. Under the input sound wave, the fluid in the cavity is compressed/stretched due to the vibration of the plate with mass, and the energy in the duct is saved or released. The vibration of the multi-local resonant cavity and sound field have a mutual effect and resonance occurs, which leads to a peak in the transmission loss. The periodic duct also appears shorter in the wide-band absorption segment at 343 Hz and 686 Hz, which coincides with the mechanism of Bragg scattering.

4.2. Transmission Loss of Acoustic Duct with Periodic Multi-Local Resonant Cavity with Three Plates with Masses

4.2.1. Transmission Loss of Multi-Local Resonant Cavity with Three Plates with Masses

The multi-local Helmholtz resonant cavity is composed of two plates with the same radius as the cavity, with masses at 1 4 , 1 2 and 3 4 the height of the cavity, respectively (see Figure 32). The transmission loss of this multi-local resonant cavity between 0 Hz and 1000 Hz is displayed in Figure 33. The enlarged view of the three peaks of the transmission loss curve is shown in Figure 34.
Due to the coupling of the circular plate and the cavity, the sound transmission loss curve of the heterogeneous, multi-local resonant cavity has multiple peaks: the transmission loss peak corresponding to 115 Hz is 20.29 dB, the peak corresponding to 200 Hz is 32.40 dB, and the peak corresponding to 395 Hz is 7.54 dB (see Figure 34). However, due to the circular plate dividing the cavity into multiple cavities and the elasticity of the flat plate, the resonant frequency of the special-shaped, multi-local resonant cavity moves to the low frequency. Therefore, the frequency corresponding to the first peak is lower than the frequency corresponding to the peak of the traditional Helmholtz resonator.
The third peak of the acoustic transmission loss curve of the heterogeneous, multi-local resonant cavity with three plates and masses appears at 395 Hz. At this time, the vibration response of the plate in the resonant cavity is shown in Figure 35, and the transverse direction of the circular plate at this frequency is plotted. The change in displacement with radial direction is shown in Figure 36.
From Figure 35 and Figure 36, it can be observed that three plates vibrate in the same direction. The vibration displacement of the top plate is the largest and the displacement bottom plate is the smallest. Due to the difference in the vibration displacement of the three plates, their volumes change dramatically. The volumes of the upper two cavities are suppressed and the lower two volumes are stretched. The change in the four volumes leads to the changing shape of the springs. Energy is stored while the spring–mass system, formed by cavities, necks, and plates with mass, vibrates. The sound pressure in the square duct reduces after the multi-local resonant cavity and a peak appears in the transmission loss curve.

4.2.2. Transmission Loss of Acoustic Duct with Periodic Multi-Local Resonant Cavity with Three Plates with Masses

Multiple local resonant cavities with three plates and masses are arranged at fixed intervals of 0.5 m along the square duct. The paper uses an acoustic pipe with eight local resonant cavities as an example for discussion. The transmission loss of the acoustic duct is shown in Figure 37a and the enlarged view is shown in Figure 37b. It can be concluded from the enlarged view (Figure 37b) that the peaks of the transmission loss curve of the periodic duct appear not only close to the peaks of the original cell but also to the broad-band sound absorption segment caused by Bragg scattering. Additionally, the frequencies of the broad band satisfy Equation (14), which demonstrates that the proposed acoustic duct can make the natural frequency move to the lower range and perform more effective low-frequency sound absorption.

5. Conclusions

In this paper, a multi-local resonant symmetric cavity was established and applied to the acoustic duct. The influence of adding different numbers of plates with masses on the acoustic characteristics of the cavity was analyzed, and the band gap of the symmetric resonant cavity, with a single plate with a mass inserted, was verified.
Studies showed that when a plate with a mass was inserted into the cavity, the plate and its quantity had a great influence on the acoustic characteristics of the Helmholtz resonant cavity. The plate with a mass causes its resonance frequency to shift to lower frequencies. Among the proposed structures, the multi-local resonant cavity with two mass plates can produce a 27.30 dB acoustic transmission loss at 415 Hz; the multi-local resonant cavity with three mass plates can produce a 32.40 dB acoustic transmission loss at 200 Hz.
The periodic arrangement of the symmetrical resonant cavity with the interpolated mass plate has a shorter broadband sound absorption section that enhances its sound absorption effect. Notably, the maximum transmission loss of the multi-local resonator acoustic pipe, with a periodic, additional single plate and mass, is close to 350 dB, and the maximum transmission loss of the multi-local resonant acoustic pipe with a periodic, additional double plate and mass exceeds 500 dB.
This work focused on the low-frequency range. While the definition of low-frequency range is different in various engineering cases, the purpose of this work was to demonstrate the mechanism of the proposed acoustic pipe. Additionally, the specific frequency could be tuned according to practical engineering. The structure proposed provided a certain reference for the design of sound absorption ducts.

Author Contributions

J.L.: Methodology, Modeling, Writing—Draft; T.W.: Conception, Supervision, Revision; M.C.: Supervision, Revision. All authors have read and agreed to the published version of the manuscript.

Funding

This research was supported by the National Natural Science Foundation of China (Grant No. 52001131) and the National Natural Science Foundation of China (Grant No. 52071152).

Institutional Review Board Statement

The study did not involve humans or animals.

Informed Consent Statement

The study did not involve humans.

Data Availability Statement

The data used to support the findings of this study are available from the corresponding authors upon request.

Conflicts of Interest

The authors declare no conflict of interest.

References

  1. Wu, J.H.; Ma, F.Y.; Zhang, S.W.; Shen, L. Application of Acoustic Metamaterials in Low-frequency Vibration and Noise Reduction. J. Mech. Eng. 2016, 52, 68–78. (In Chinese) [Google Scholar] [CrossRef]
  2. Zhang, Z.F.; Yu, D.L.; Liu, J.W.; Wen, J.H. Properties of band gaps in phononic crystal pipe consisting of expansion chambers with extended inlet/outlet. Acta Phys. Sin. 2018, 67, 153–164. (In Chinese) [Google Scholar] [CrossRef]
  3. Chen, L.Q. The muffling principle and application of Helmholtz resonator. Phys. Bull. 1992, 4, 37–38. (In Chinese) [Google Scholar]
  4. Munjal, M.L. Acoustics of Ducts and Mufflers; Wiley: New York, NY, USA, 1987. [Google Scholar]
  5. Cai, C.; Mak, C.M. Noise attenuation capacity of a Helmholtz resonator. Adv. Eng. Softw. 2018, 116, 60–66. [Google Scholar] [CrossRef]
  6. Cai, C.; Mak, C.M. Hybrid noise control in a duct using a periodic dual Helmholtz resonator array. Appl. Acoust. 2018, 134, 119–124. [Google Scholar] [CrossRef]
  7. Langfeldt, F.; Hoppen, H.; Gleine, W. Resonance frequencies and sound absorption of Helmholtz resonators with multiple necks. Appl. Acoust. 2019, 145, 314–319. [Google Scholar] [CrossRef]
  8. Ge, M.X.; Li, G. Acoustic Characteristics of Double Neck Helmholtz Resonators. Noise Vib. Control 2020, 40, 231–234. (In Chinese) [Google Scholar]
  9. Zhang, X.X.; Liu, Y.R.; Li, L.J. Research on acoustic metamaterial based on Helmholtz resonant cavity array. Chin. J. Eng. Des. 2020, 27, 441–447. (In Chinese) [Google Scholar]
  10. Guan, D.; Zhao, D.; Ren, Z. Aeroacoustic Attenuation Performance of a Helmholtz Resonator with a Rigid Baffle Implemented in the Presence of a Grazing Flow. Int. J. Aerosp. Eng. 2020, 2020, 1916239. [Google Scholar] [CrossRef]
  11. Zhou, R.; Wu, W.G.; Wen, Y.F. An acoustic metamaterial based on Helmholtz resonator with thin membrane. Tech. Acoust. 2017, 36, 297–302. (In Chinese) [Google Scholar]
  12. Zhou, C.G.; Liu, B.L.; Li, X.D.; Tian, J. Effect of elastic cavity walls on acoustic characteristics of a water-filled Helmholtz resonator: Equivalent lumped parameter model for cylindrical cavity. Acta Acust. 2007, 32, 426–434. [Google Scholar]
  13. Cui, S.; Harne, R.L. Acoustic-Structure Interaction in an Adaptive Helmholtz Resonator by Compliance and Constraint. J. Vib. Acoust. 2020, 142, 1–39. [Google Scholar] [CrossRef]
  14. Liu, J.B.; Lv, H.F.; Wang, P.H.; Ji, Y.L. Research on the pipeline silencing characteristics of membrane-type acoustic metamaterial. Tech. Acoust. 2019, 38, 206–211. (In Chinese) [Google Scholar]
  15. Li, Y.F.; Shen, H.J.; Zhang, L.K.; Su, Y.S. Sound propagation characteristics of a metamaterials-type periodic pipe and its low-frequency broadband control. Acta Acust. 2017, 42, 334–340. (In Chinese) [Google Scholar]
  16. Zhang, X.G.; Lv, H.F.; Lv, C.M.; Zhang, W.H. Double local resonance effect acoustic metamaterial muffling performance. J. Aerosp. Power 2020, 35, 52–59. (In Chinese) [Google Scholar]
  17. Hu, G.; Tang, L.; Cui, X. On the modelling of membrane-coupled Helmholtz resonator and its application in acoustic metamaterial system. Mech. Syst. Signal Process. 2019, 132, 595–608. [Google Scholar] [CrossRef]
  18. Shen, H.J.; Yu, D.L.; Tang, Z.Y.; Su, Y.S.; Li, Y.F.; Liu, J.W. Characteristics of low-frequency noise elimination in a fluid-filled pipe of dark acoustic metamaterial type. Acta Phys. Sin. 2019, 68, 144301. (In Chinese) [Google Scholar] [CrossRef]
  19. Catapane, G.; Magliacano, D.; Petrone, G.; Casaburo, A.; Franco, F.; De Rosa, S. Transmission Loss Analyses on Different Angular Distributions of Periodic Inclusions in a Porous Layer. Aerotec. Missili Spaz. 2021. [Google Scholar] [CrossRef]
  20. Weisser, T.; Groby, J.-P.; Dazel, O.; Gaultier, F.; Deckers, E.; Futatsugi, S.; Monteiro, L. Acoustic behavior of a rigidly backed poroelastic layer with periodic resonant inclusions by a multiple scattering approach. J. Acoust. Soc. Am. 2016, 139, 617–629. [Google Scholar] [CrossRef] [PubMed] [Green Version]
  21. Assouar, M.B.; Sun, J.-H.; Lin, F.-S.; Hsu, J.-C. Hybrid phononic crystal plates for lowering and widening acoustic band gaps. Ultrasonics 2014, 54, 2159–2164. [Google Scholar] [CrossRef]
  22. Song, Y.; Feng, L.; Liu, Z.; Wen, J.; Yu, D. Suppression of the vibration and sound radiation of a sandwich plate via periodic design. Int. J. Mech. Sci. 2019, 150, 744–754. [Google Scholar] [CrossRef]
  23. Du, G.H.; Zhu, Z.M.; Gong, X.F. Fundamentals of Acoustics; Nanjing University Press: Nanjing, China, 2012. [Google Scholar]
  24. Sugimoto, N.; Horioka, T. Dispersion characteristics of sound waves in a tunnel with an array of Helmholtz resonators. Acoust. Soc. Am. J. 1995, 97, 1446–1459. [Google Scholar] [CrossRef]
Figure 1. Schematic diagram of a single cell of an acoustic duct with multiple local resonant cavities.
Symmetry 13 02233 g001
Figure 2. The model diagram of a single cell of an acoustic duct with multiple local resonant cavities.
Symmetry 13 02233 g002
Figure 3. The schematic diagram of additional mass in the middle of the plate.
Symmetry 13 02233 g003
Figure 4. The finite element meshing diagram of a single cell of an acoustic duct with multiple local resonant cavities.
Symmetry 13 02233 g004
Figure 5. Finite element mesh of the shell in the unit cell.
Symmetry 13 02233 g005
Figure 6. Schematic diagram of the acoustic duct with periodic multiple local resonant cavities.
Symmetry 13 02233 g006
Figure 7. Finite element model of the acoustic duct with periodic multiple local resonant cavities.
Symmetry 13 02233 g007
Figure 8. Transmission loss versus frequency. (a) The transmission loss of multiple local resonant cavity acoustic duct with additional single plate and mass; (b) The enlarged view of peak value of Figure 8a.
Symmetry 13 02233 g008
Figure 9. The model diagram of two-dimensional resonant cavity cell with the same parameters.
Symmetry 13 02233 g009
Figure 10. Band structure diagram of a two-dimensional multi-local Helmholtz resonator.
Symmetry 13 02233 g010
Figure 11. Acoustic transmission loss in periodic pipes of two-dimensional shaped Helmholtz resonator.
Symmetry 13 02233 g011
Figure 12. Mode of flat plate in single cavity at 288 Hz.
Symmetry 13 02233 g012
Figure 13. Mode of single cavity at 288 Hz.
Symmetry 13 02233 g013
Figure 14. Sound pressure of periodic pipe at 288 Hz.
Symmetry 13 02233 g014
Figure 15. Response of the plate in the periodic pipe at 288 Hz.
Symmetry 13 02233 g015
Figure 16. Mode of flat plate in single cavity at 195 Hz.
Symmetry 13 02233 g016
Figure 17. Mode of single cavity at 195 Hz.
Symmetry 13 02233 g017
Figure 18. Sound pressure of periodic pipe at 195 Hz.
Symmetry 13 02233 g018
Figure 19. Response of the plate in the periodic pipe at 195 Hz.
Symmetry 13 02233 g019
Figure 20. Single-cell structure of multiple local resonant cavities acoustic duct with two plates and masses.
Symmetry 13 02233 g020
Figure 21. Transmission loss of single cell of multiple local resonant cavities acoustic duct with two plates and masses.
Symmetry 13 02233 g021
Figure 22. Enlarged view of peak transmission loss of single cell of multiple local resonant cavities acoustic duct with two plates and masses. (a) Enlarged view of the peak at 120 Hz; (b) Enlarged view of the peak at 190 Hz; (c) Enlarged view of the peak at 415 Hz; (d) Enlarged view of the peak at 690 Hz.
Symmetry 13 02233 g022
Figure 23. The response of plates in a resonant cavity with two plates and masses at 415 Hz.
Symmetry 13 02233 g023
Figure 24. Lateral displacement diagram of plates in a resonant cavity with two plates and masses at 415 Hz.
Symmetry 13 02233 g024
Figure 25. Sound pressure distribution image of resonant cavity with two plates and masses at 415 Hz.
Symmetry 13 02233 g025
Figure 26. The response of the plates in a resonant cavity with two plates and masses at 690 Hz.
Symmetry 13 02233 g026
Figure 27. Lateral displacement diagram of plates in a resonant cavity with two plates and masses at 690 Hz.
Symmetry 13 02233 g027
Figure 28. Sound pressure distribution image of resonant cavity with two plates and masses at 690 Hz.
Symmetry 13 02233 g028
Figure 29. Enlarged view of peak value and transmission loss of multiple local resonant cavity acoustic duct with two additional two plates and masses. (a) The transmission loss of multiple local resonant cavity acoustic duct with two additional two plates and masses; (b) Enlarged view of peak value of Figure 29a.
Symmetry 13 02233 g029
Figure 30. The sound pressure distribution diagram of the acoustic duct with local, resonant cavities with two plates with masses at 505 Hz.
Symmetry 13 02233 g030
Figure 31. The plate response diagram of the acoustic duct with local, resonant cavities with two plates with masses at 505 Hz.
Symmetry 13 02233 g031
Figure 32. Single-cell structure of multiple local resonant cavities acoustic duct with three plates and masses.
Symmetry 13 02233 g032
Figure 33. Transmission loss of single cell of multiple local resonant cavities acoustic duct with three plates and masses.
Symmetry 13 02233 g033
Figure 34. Enlarged view of the peak transmission loss of single cell of multiple local resonant cavities acoustic duct with three plates and masses. (a) Enlarged view of the peak at 115 Hz. (b) Enlarged view of the peak at 200 Hz. (c) Enlarged view of the peak at 395 Hz.
Symmetry 13 02233 g034
Figure 35. The response of plates in a resonant cavity with three plates and masses at 395 Hz.
Symmetry 13 02233 g035
Figure 36. Lateral displacement diagram of plates in a resonant cavity with three plates and masses at 395 Hz.
Symmetry 13 02233 g036
Figure 37. Enlarged view of peak value and transmission loss of multiple local resonant cavities acoustic duct with three additional plates and masses. (a) The transmission loss of multiple local resonant cavities acoustic duct with three additional plates and masses; (b) Enlarged view of peak values of (a).
Symmetry 13 02233 g037
Table 1. Parameters of simulation model.
Parameters/UnitsDefinitionValue
ρ 0 / kg m - 3 density of air1.25
c 0 / m s - 1 sound speed in air343
d/mlength of cell0.5
a/mcross section length of duct 5 × 10 2
r /mthe neck radius 5 × 10 3
l /mlength of the neck 2.5 × 10 2
R /mcavity radius 5 × 10 2
L 1 /mheight of upper cavity 1.667 × 10 2
L 2 /mheight of lower cavity 3.333 × 10 2
ρ / kg m - 3 density of plate1000
h/mthickness of plate0.001
μPossion’s ratio of plate0.4
m/kgmass of mass block 5 × 10 4
Publisher’s Note: MDPI stays neutral with regard to jurisdictional claims in published maps and institutional affiliations.

