Abstract
The thermal restoration of chiral symmetry in QCD is known to proceed by an analytic crossover, which is widely expected to turn into a phase transition with a critical endpoint as the baryon density is increased. In the absence of a genuine solution to the sign problem of lattice QCD, simulations at zero and imaginary baryon chemical potential in a parameter space enlarged by a variable number of quark flavours and quark masses constitute a viable way to constrain the location of a possible non-analytic phase transition and its critical endpoint. In this article I review recent progress towards an understanding of the nature of the transition in the massless limit, and its critical temperature at zero density. Combined with increasingly detailed studies of the physical crossover region, current data bound a possible critical point to ≳ 3T.
1. Introduction
Many salient features of the spectrum of hadrons and their interactions observed in nature are determined by the near-chiral symmetry of the QCD Lagrangian and its spontaneous breaking by the QCD vacuum. The fact that nature breaks chiral symmetry also explicitly by non-vanishing quark masses can be taken into account in terms of chiral perturbation theory [1,2], due to the smallness of the u- and d-quark masses.
In a hot and/or dense medium, chiral symmetry is expected to be gradually restored once the temperature exceeds T ≳ 160 or the baryon chemical potential
. Associated with this change of the realised symmetry, one also expects a change of dynamics and its underlying degrees of freedom which, asymptotically, should become quarks and gluons. Similar to the vacuum properties of the theory, one also expects the properties of this thermal transition to be closely related to those of the theory in the massless limit.
The low energy scales of the transition region demand a non-perturbative first principles approach like lattice QCD. Unfortunately, a severe sign problem prohibits simulations by importance sampling for non-vanishing chemical potential, for introductions see [3,4,5]. Despite tremendous efforts over several decades, no genuine solution to this problem is available to date, and knowledge of the QCD phase diagram by direct calculation remains scarce. Nevertheless, during the last years there has been considerable progress in studying the properties of the thermal QCD transition in an enlarged parameter space, where the number of flavours and quark masses is varied away from their physical values. Besides giving theoretical insight into the interplay of symmetries and dynamics in controlled situations, such studies also provide constraints on the physical phase diagram, which are beginning to become phenomenologically relevant. In this article, I collect some recent results allowing to better understand and remove lattice artefacts, resulting in a consistent picture that also accommodates apparently conflicting statements based on earlier simulations. In particular, I will focus on developments suggesting a modified version of the Columbia plot and constraints on the location of a possible critical point.
2. Some Lattice Essentials
For readers less familiar with lattice QCD, it may be useful to recall a number of basic definitions and issues that are important for the interpretation of the following lattice results. For details, see the corresponding textbooks [3,6,7]. Conventionally one considers Euclidean space-time discretised by hypercubic lattices with points separated by a lattice spacing a. This represents a box with spatial length and Euclidean time extent , which corresponds to inverse temperature as in continuum thermal field theory, once (anti-)periodic boundary conditions for (fermionic) bosonic fields have been applied. When a quantum field theory is formulated on the lattice, its action (and all observables) differ from those in the continuum. As an example, consider Wilson’s pure gauge action
which is constructed from so-called plaquette variables . These are the fundamental squares of the lattice consisting of four gauge links , which are group elements of . For sufficiently small lattice spacing the plaquette can be expanded,
and the classical action (1) is seen to reproduce the continuum Yang-Mills action in the limit . However: for any finite lattice spacing a the action differs by terms of from the continuum action. Such terms disappearing in the continuum are called “irrelevant”, at finite lattice spacing they constitute lattice artefacts. An improvement of lattice actions in the sense of reducing such artefacts [8] can be achieved by adding irrelevant terms to the lattice action, which subtract those already present. Quite generally, lattice actions are then not unique but may differ by arbitrary irrelevant terms. All such differences between valid actions and observables must disappear in the continuum limit.
Approaching the continuum limit is a highly non-trivial affair, as one has to take while keeping other dimensionful quantities, like masses or temperature, fixed along a so-called line of constant physics in the lattice parameter space. The lattice spacing is tuned indirectly through the running gauge coupling evaluated at the cutoff scale, , so that by asymptotic freedom . This implies that the lattice gauge coupling . For thermodynamics, keeping temperature constant during the continuum approach implies in the continuum limit. Thus, while the precise value of the lattice spacing is determined by some form of scale setting, finer thermodynamics lattices imply larger , and lattice artefacts can be parametrised in units of temperature as powers of the dimensionless .
The most problematic lattice artefacts for QCD by far are those afflicting the fermion formulation. In particular, it is impossible to put chiral fermions on a lattice without artificial doubler degrees of freedom while maintaining locality [9]. It is clear that this implies severe caveats for any investigation of chiral symmetry breaking. In a nut shell, the current choices are:
- The Wilson formulation: By adding irrelevant mass terms , the doubler degrees of freedom become heavy and decouple in the continuum limit. However, for any finite lattice spacing chiral symmetry is broken completely by these terms.
- The staggered formulation: Spin and flavour degrees of freedom are distributed to different lattice sites, which can be done so as to reduce the number of doublers. The remaining ones are removed by taking an appropriate root of the fermion determinant, which can only be fully valid in the continuum. In this formulation the original chiral symmetry is reduced from .
- Formulations with a lattice version of full chiral symmetry exist in the form of domain wall or overlap fermions, and are expected to eventually supersede the previous formulations. However, they require complicated non-local constructions and currently are more expensive to simulate by over an order of magnitude.
Due to the enormous numerical cost of thermodynamical investigations for light fermions, most lattice results covered here are based on different versions of the staggered or Wilson discretisations. In order to avoid the damage these do to chiral symmetry and its spontaneous breaking, it is mandatory to first take the continuum limit to remove the lattice artefacts, and only then approach the chiral limit.
A general difficulty in investigating phase diagrams is the fact that non-analytic phase transitions only exist in infinite volume [10,11], while numerical simulations are obviously limited to finite boxes. A change of dynamics associated with a phase transition is signalled by a rapid change of the expectation values of suitable observables , accompanied by maximal fluctuations, i.e., peaks in their susceptibilities,
This allows to determine the location of a transition as a function of the bare parameters of the theory. In a finite box this is always an analytic crossover, and the behaviour on different volumes has to be compared to see whether a non-analytic phase transition builds up in the thermodynamic limit. The peak height will diverge at a second-order transition with , where is a combination of critical exponents appropriate for the observable and the universality class of the transition. For a first order transition the divergence is , whereas for a crossover the peak height will saturate at a finite value. More intricate (and reliable) finite size scaling studies are based on the first three generalised cumulants () of the fluctuation of an observable, ,
which besides the peak height also quantify the skewness and the tails of the statistical distribution of the observable, thus giving access to various critical exponents.
Finally, the infamous sign problem at finite baryon density appears because of a property of the fermion determinant, defined with complex chemical potential for baryon number (in continuum notation),
Thus, the fermion determinant is complex for real chemical potential, but stays real for purely imaginary chemical potential. For real chemical potential, all imaginary parts cancel out of the partition function exactly, but the real part is oscillatory and averages to the so-called average sign, evaluated by the partition function with ,
This is also the simplest reweighting factor multiplying any observable, when a ensemble is reweighted to . Its size is governed by the free energy difference of the systems with and without chemical potential, and is exponentially suppressed for large volumes. Hence all expectation values of observables are lost in the statistical errors sooner or later. It must be stressed that this is only a problem for numerical evaluations by importance sampling, other evaluations and the physics itself have no issue with chemical potential. For more details, see introductions like [3,4,5]. So far there is no genuine algorithmic cure for the sign problem, for an overview of earlier attempts see [12] and the proceedings of the annual lattice conferences for updates.
3. The Columbia Plot at Zero Baryon Density
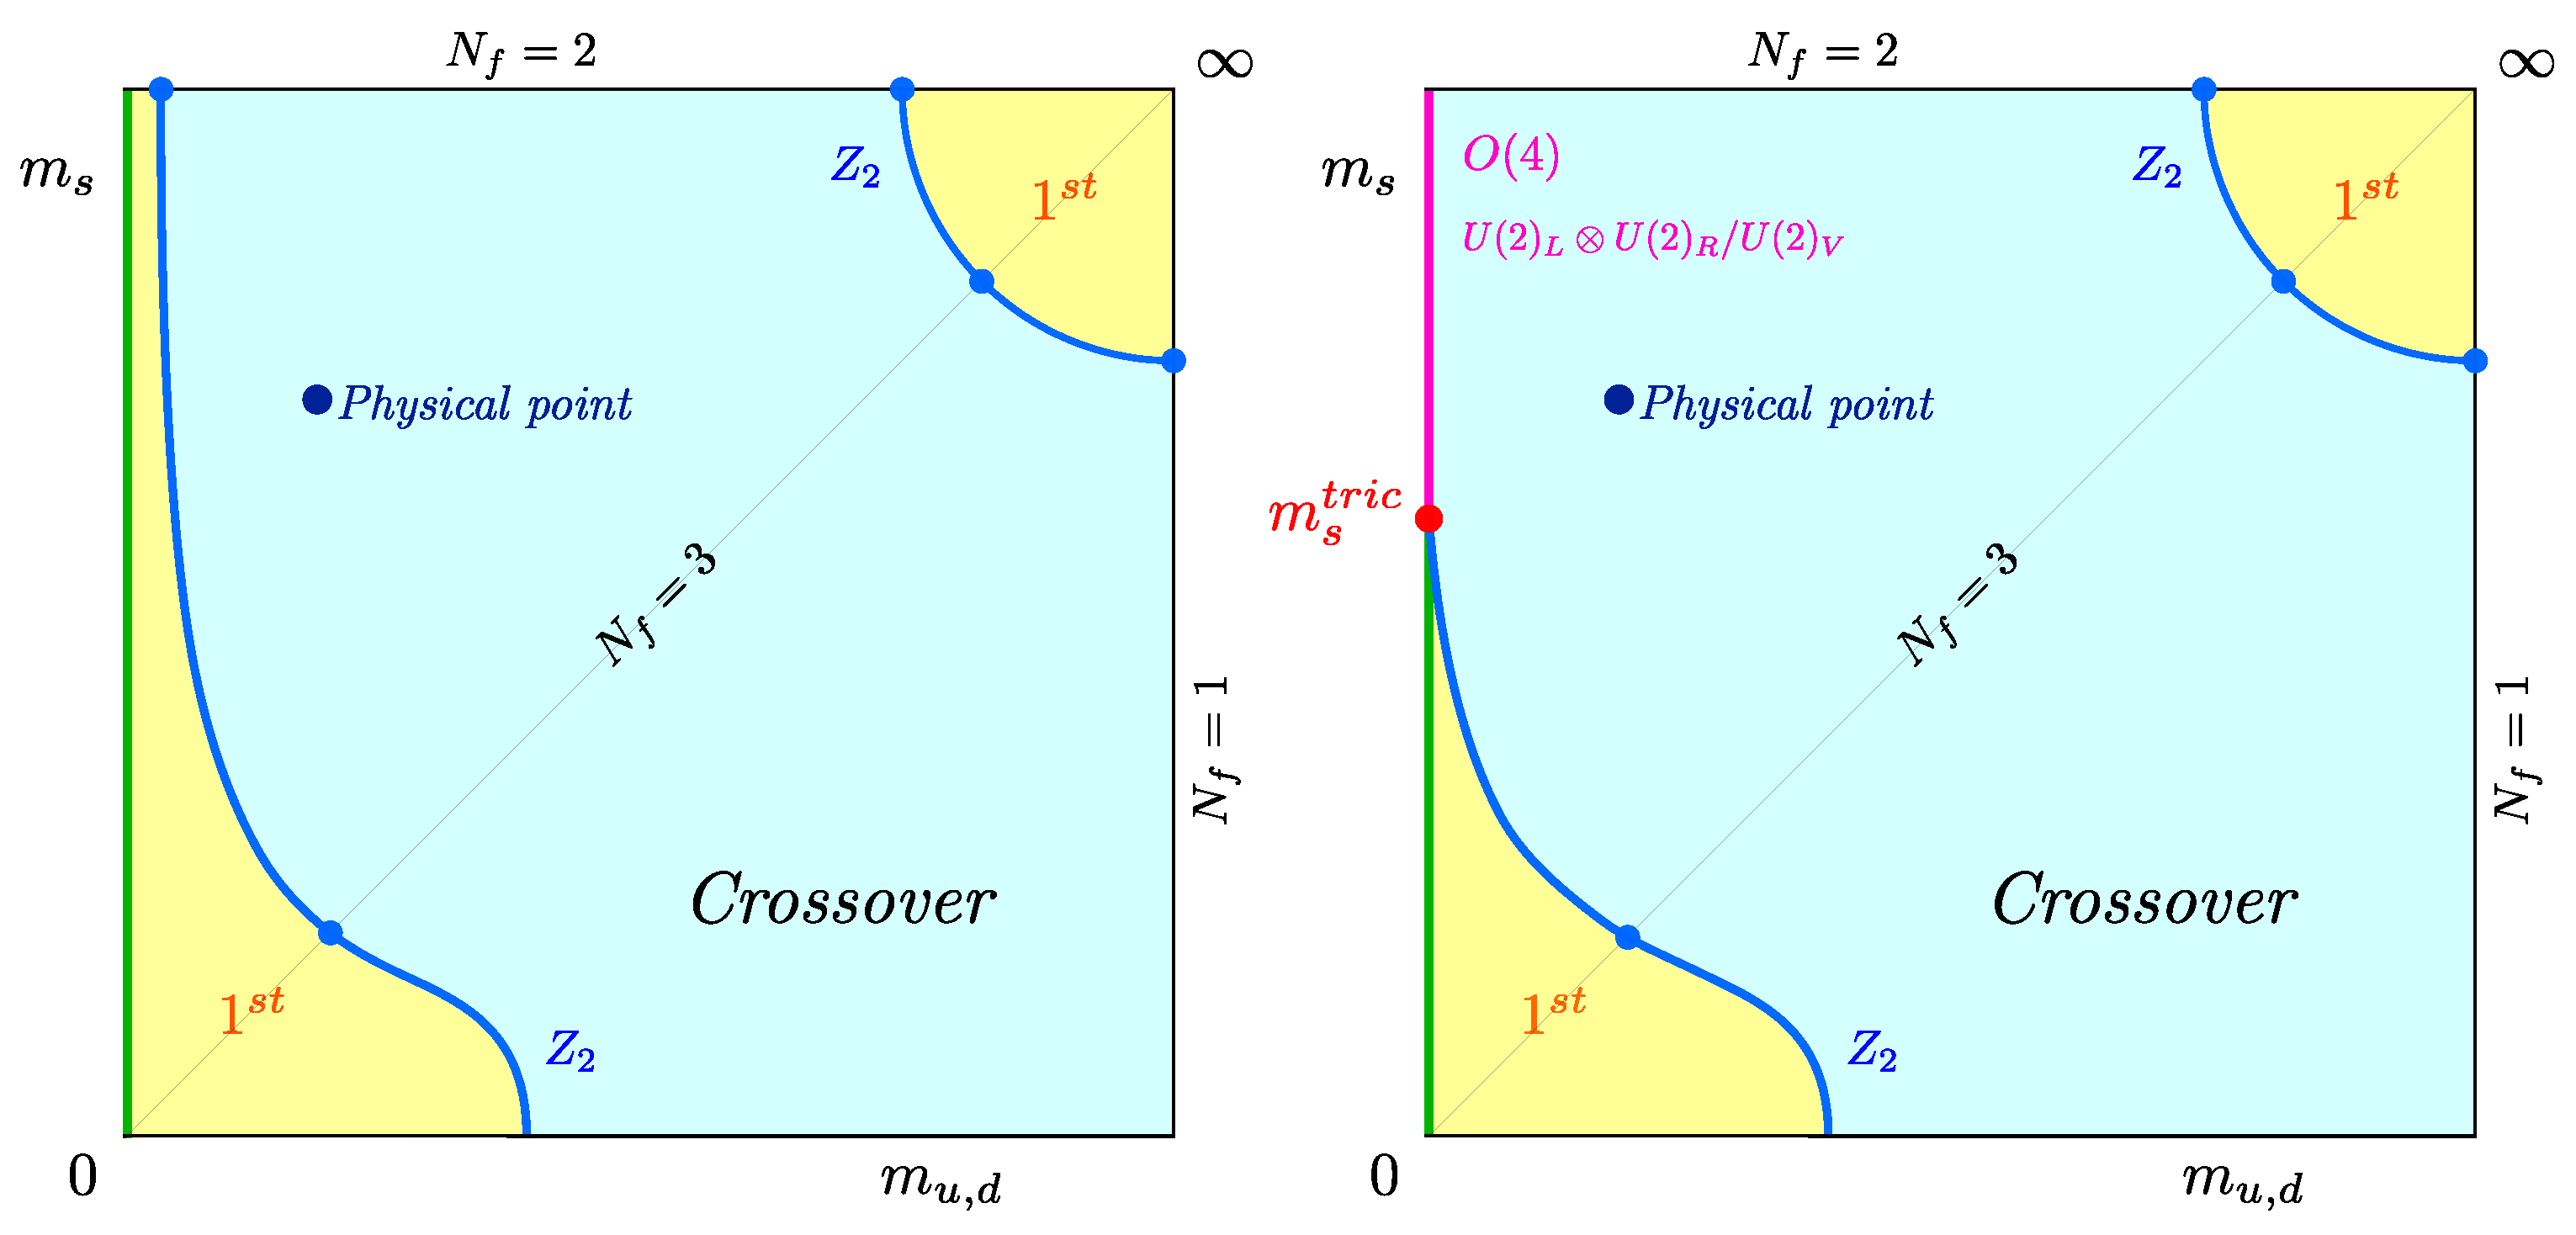
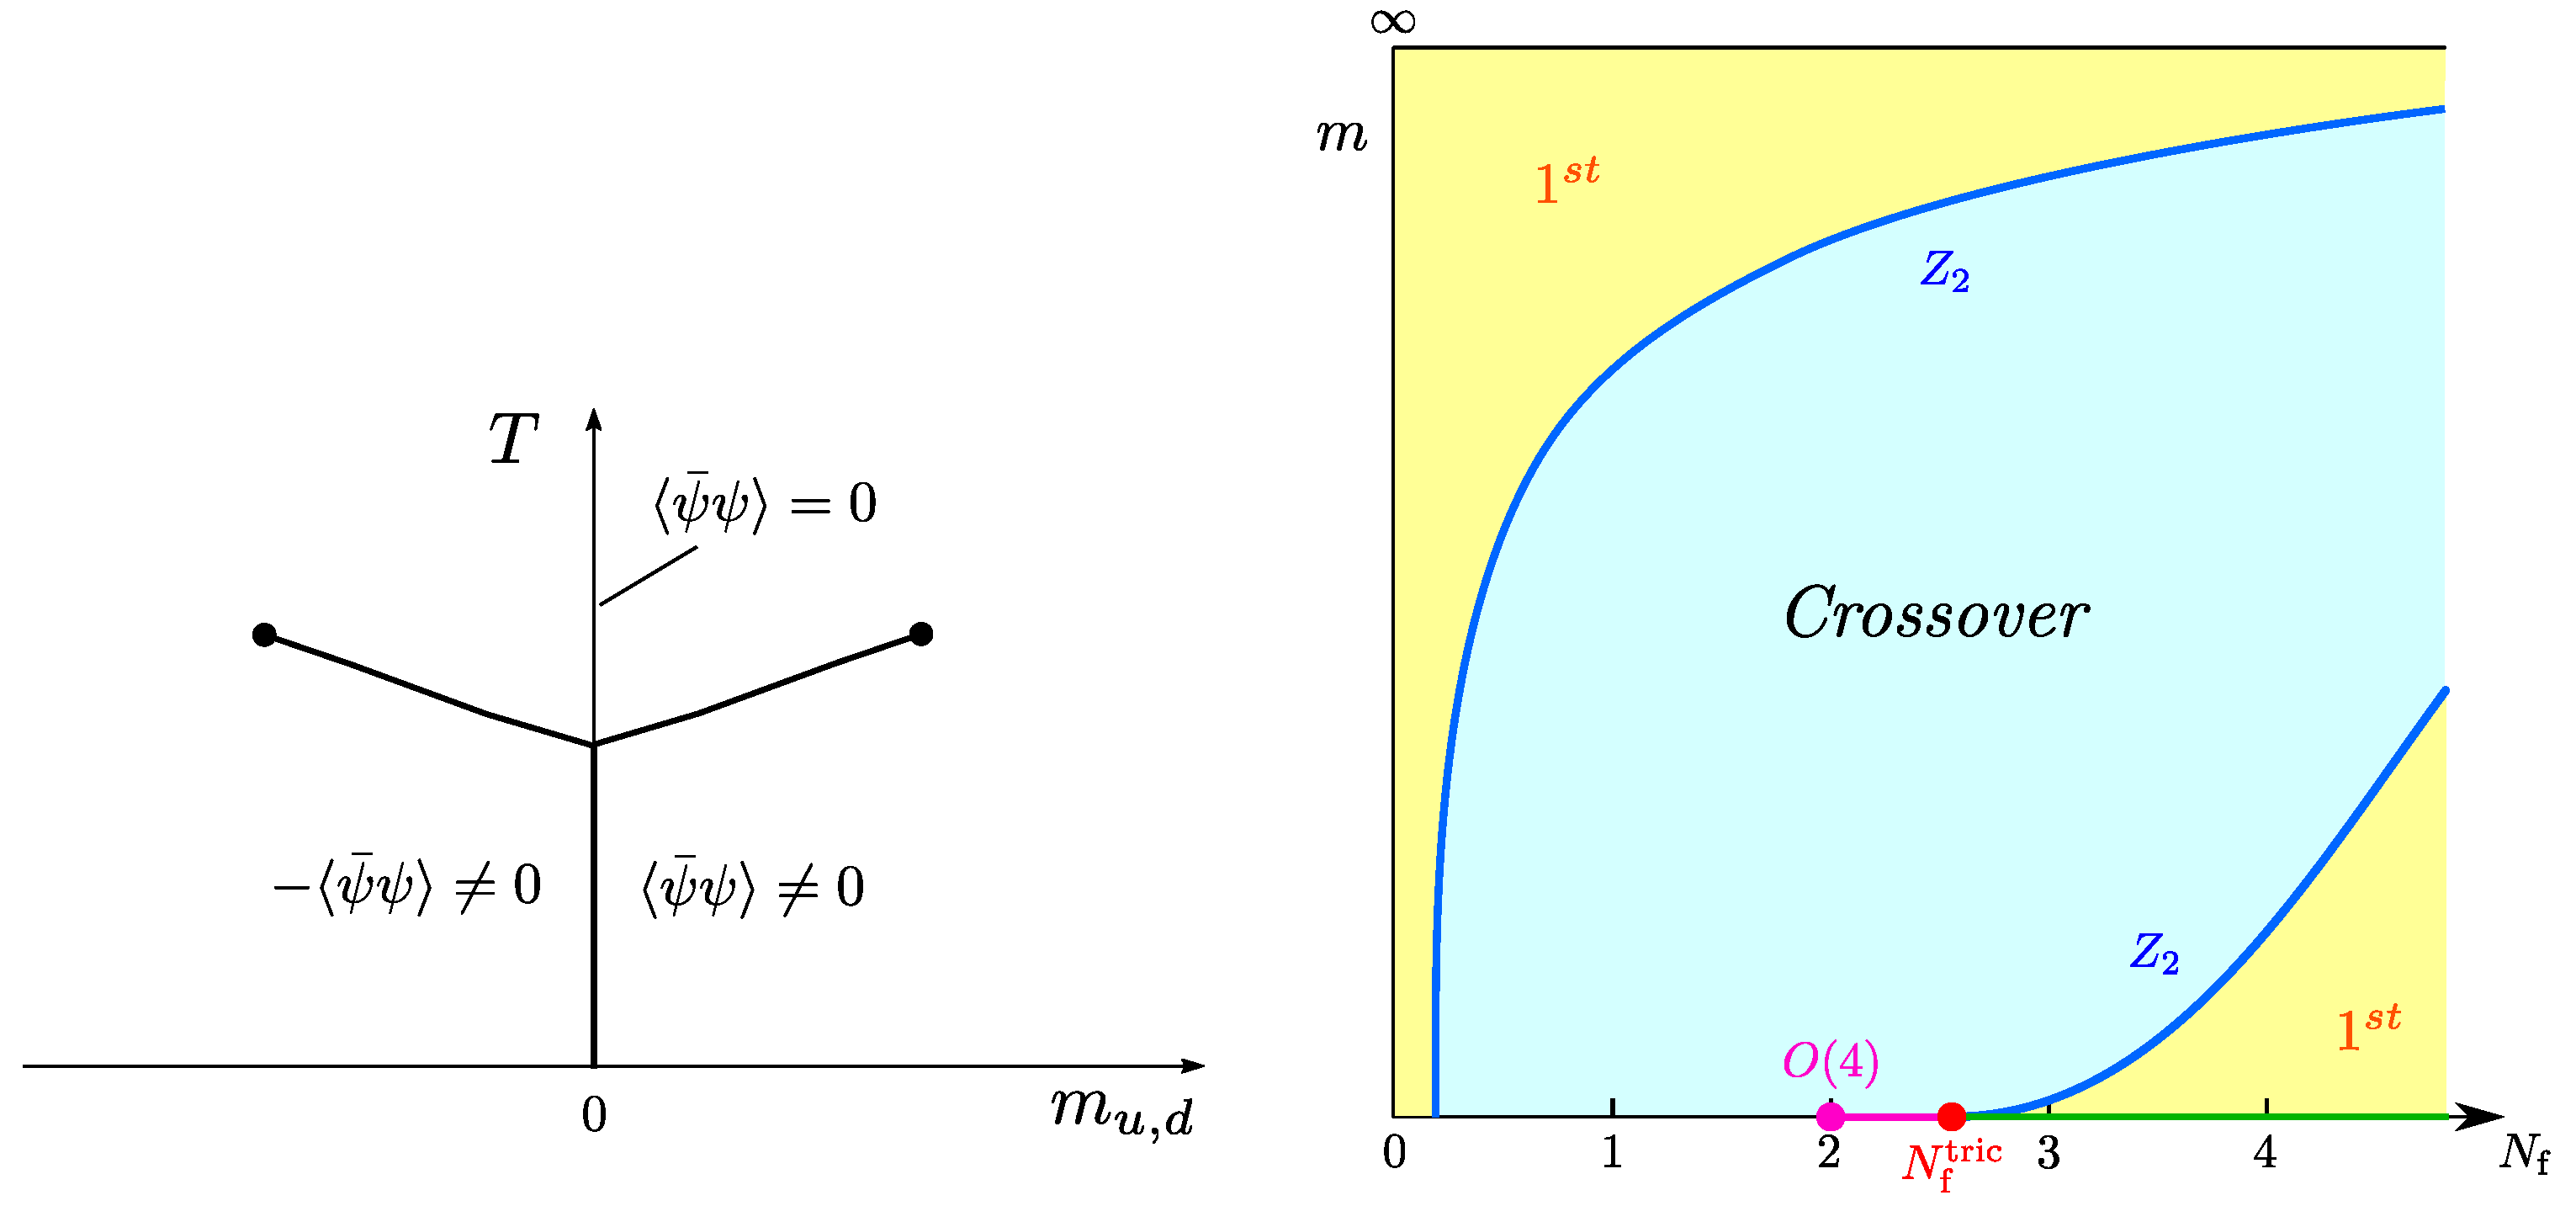
As a point of departure, consider the thermal QCD transition at zero baryon density, . The nature of this transition for physical quark masses has been known for some time to be an analytic crossover [13]. Away from the physical point, the order of the QCD thermal transition with quarks as a function of quark masses is usually specified in a so-called Columbia plot [14], for which two possible realisations, to be discussed below, are shown in Figure 1.
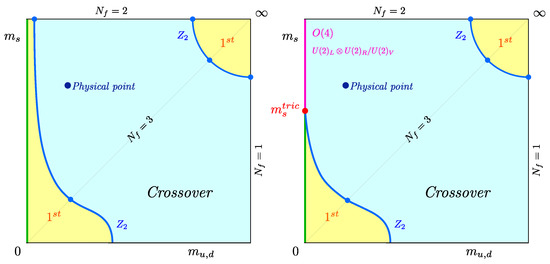
Figure 1.
Possible scenarios for the nature of the thermal QCD transition as a function of the quark masses, with a first-order (left) or a second-order (right) transition in the chiral limit of the light quarks. Every point of the plot represents a phase boundary, with an implicitly associated (pseudo-)critical temperature . (Here and in the following, “phase boundary” refers to a (pseudo-)critical combination of parameters irrespective of the nature of the transition, which can be first order, second order or crossover.)
3.1. The Deconfinement Transition
Even though it is far from the physical point or the chiral limit, the heavy mass corner is interesting in its own right and promises insights, which will also be useful for light quarks. In the quenched limit QCD reduces to Yang-Mills theory in the presence of static quarks, whose propagators are Polyakov loops which represent an order parameter for the global center symmetry related to confinement [15]. Its spontaneous breaking at some critical temperature proceeds by a first-order deconfinement phase transition [16], whose latent heat has recently also been computed [17]. In the presence of dynamical quarks, the center symmetry is explicitly broken by and the first-order phase transition weakens with diminishing quark masses, until it disappears along a second-order critical line in the 3d universality class. Contrary to the chiral limit, this entire region can be simulated directly and a complete non-perturbative understanding should be attainable in the near future. The location of the critical line is under investigation [18,19,20,21]. While continuum extrapolations are not yet available, the presently finest lattices predict the pseudo-scalar mass evaluated on the critical point for to be about GeV [20]. Together with the latent heat, these quantities should permit a detailed understanding of the confinement-deconfinement transition and its interplay with screening by dynamical quarks, which will be valuable for the physics interpretation of the crossover region at the physical point. Finally, these quantities can serve as benchmarks to test and tune truncations involved in functional renormalisation group or Dyson-Schwinger approaches [22], or effective lattice theories for the heavy quark region, which are employed to describe finite density physics [23,24].
3.2. The Chiral Transition at Zero Baryon Density
The situation is far more difficult in the opposite limit of massless quarks, because it cannot be simulated directly. For several decades expectations have been based on an analysis of three-dimensional sigma models, augmented by a ’t Hooft term for the anomaly, which represent Landau-Ginzburg-Wilson effective theories for the chiral condensate as the order parameter of the transition. The renormalisation group flow based on the epsilon expansion [25] predicts the chiral phase transition to be first-order for , whereas the case of is found to crucially depend on the fate of the anomalous symmetry: If the latter remains broken at , the chiral transition should be second order in the -universality class, whereas its effective restoration would enlarge the chiral symmetry and push the transition to first-order. For non-zero quark masses, chiral symmetry is explicitly broken. A first-order chiral phase transition then weakens to disappear at a second-order critical boundary, just like the deconfinement transition in the heavy mass regime, whereas a second-order transition disappears immediately. This results in the two scenarios for the Columbia plot depicted in Figure 1. The results of the epsilon expansion were essentially confirmed by numerical simulations of three-dimensional sigma models [26] and a perturbative expansion in fixed dimensions [27]. A later high-order perturbative analysis for the case with an effectively restored at the transition temperature finds a possibility for second-order transitions also in this case, but with a symmetry breaking pattern signalling a different universality class [28]. Finally, a recent functional renormalisation group analysis applied to restoration in QCD, which is in good agreement with lattice susceptibilities at finite quark masses [29], favours the scenario in the chiral limit [30].
A large number of lattice simulations has been devoted to disentangle which of these situations is realised in QCD. When the Columbia plot is considered on the lattice with different lattice spacings, its parameter space is enlarged by an additional axis. The chiral critical line then traces out a chiral critical surface whose shape is discretisation-dependent, while for all valid discretisations it must of course emerge from the same critical line in the continuum limit. The following subsections collect the current evidence on the location of the chiral boundary line in the Columbia plot.
3.3. and
Early simulations (without sophisticated finite size scaling analyses) on coarse lattices were fully consistent with the expected scenarios shown in Figure 1: A first-order region could be clearly seen for , whereas the smallest available masses were consistent with a continuous transition or crossover for , both for unimproved staggered [14] and unimproved Wilson [31] fermions. More recently and using finite size scaling of cumulants, a narrow first-order region was also identified for , again for unimproved staggered [32,33] and unimproved Wilson [34] fermions on . However, the location of the -boundary varies widely between these, indicating large cutoff effects.
Recent investigations using the Highly Improved Staggered Quark (HISQ) action start at the physical point and then gradually reduce the light quark mass value, until they correspond to MeV, on lattices [35,36]. No sign of a first-order transition is detected. Thus either a -critical point bounding a very narrow first-order region is approached, or a second-order transition in the chiral limit. The analysis employs a renormalisation group invariant combination of chiral condensates as order parameter representing the magnetisation-like variable, and the light quark masses in units of the strange quark mass as symmetry breaking field,
Near a critical point the magnetic observables are dominated by universal scaling functions
with a scaling variable expressed in terms of the reduced temperature and external field, , which contain the unknown critical temperature in the chiral limit, , and two non-universal parameters .
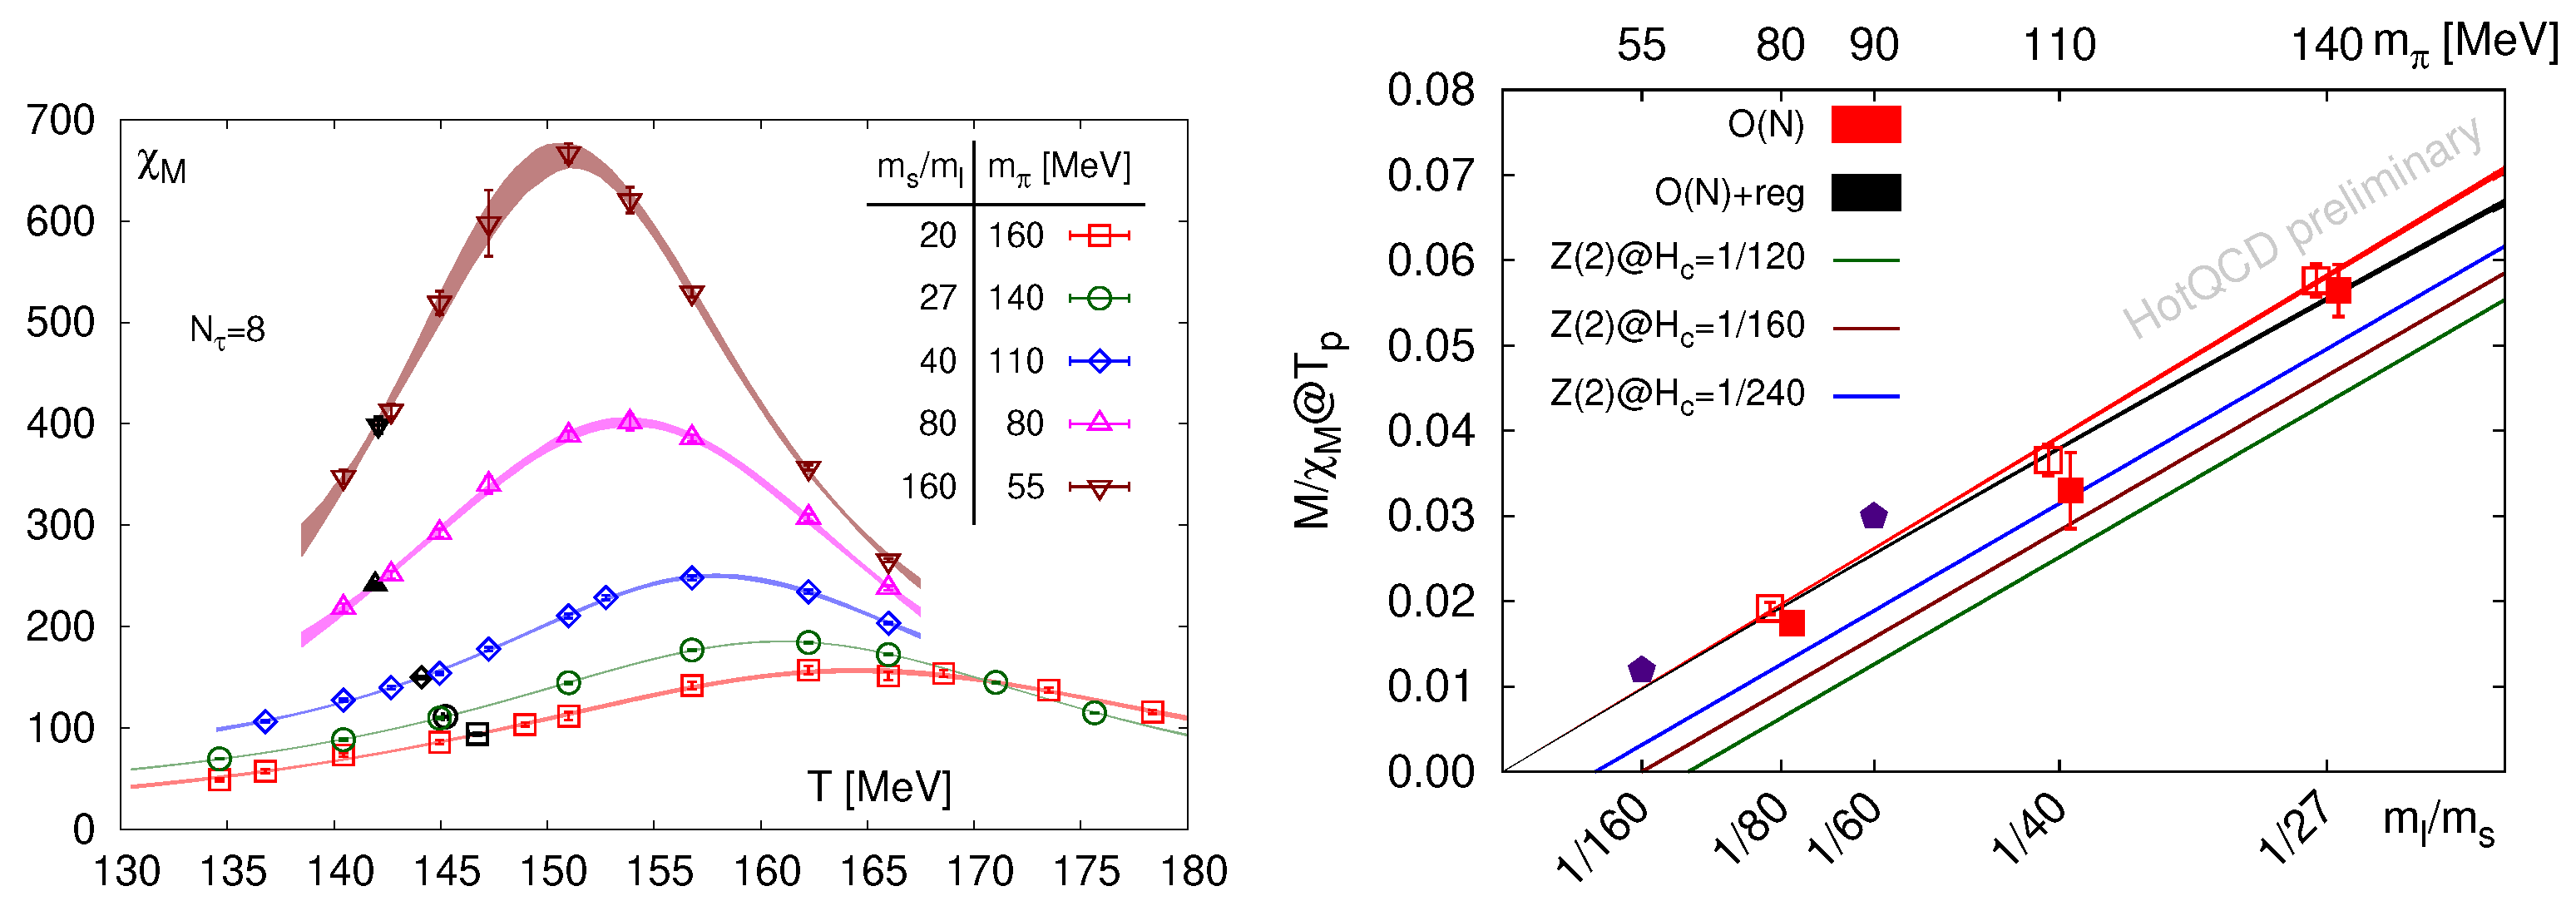
Figure 2 (left) shows the chiral susceptibility as a function of temperature for a series of decreasing light quark masses on . A considerable reduction of the pseudo-critical temperature, defined by the peak location of the susceptibility, is apparent as the light quark mass is reduced. Moreover, the peak height is growing as expected when approaching a true phase transition. To test for the universality class of the approached transition, the ratio is shown in Figure 2 (right), which near a critical point is dominated by universal scaling functions. While it is difficult to distinguish between and , it is apparent that any finite critical quark mass bounding a first-order region has to be excessively small to be consistent with the observed behaviour.
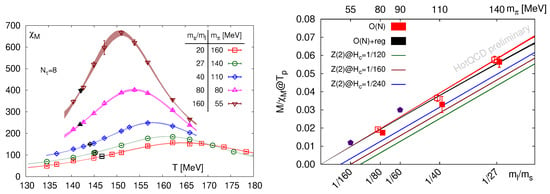
Figure 2.
(Left): Chiral susceptibility at the physical strange quark mass for a range of decreasing light quark masses on lattices with HISQ action, from [35]. (Right): Magnetic equation of state at the pseudo-critical temperature approaching the chiral limit. Lines represent fits to - ( second-order scenario) or -scaling with a finite critical quark mass (first-order scenario), from [36].
There is a similar scaling expression for the approach of the pseudo-critical crossover temperature to the critical temperature in the chiral limit,
In [35] the variation between the possible sets of critical exponents is observed to be very small, so that an extrapolation makes sense even without knowledge of the true universality class. Moreover, the extrapolations were checked to be stable under an exchange of the order of the continuum and chiral extrapolations, leading to the critical temperature as a first result for the chiral phase transition in the massless limit.
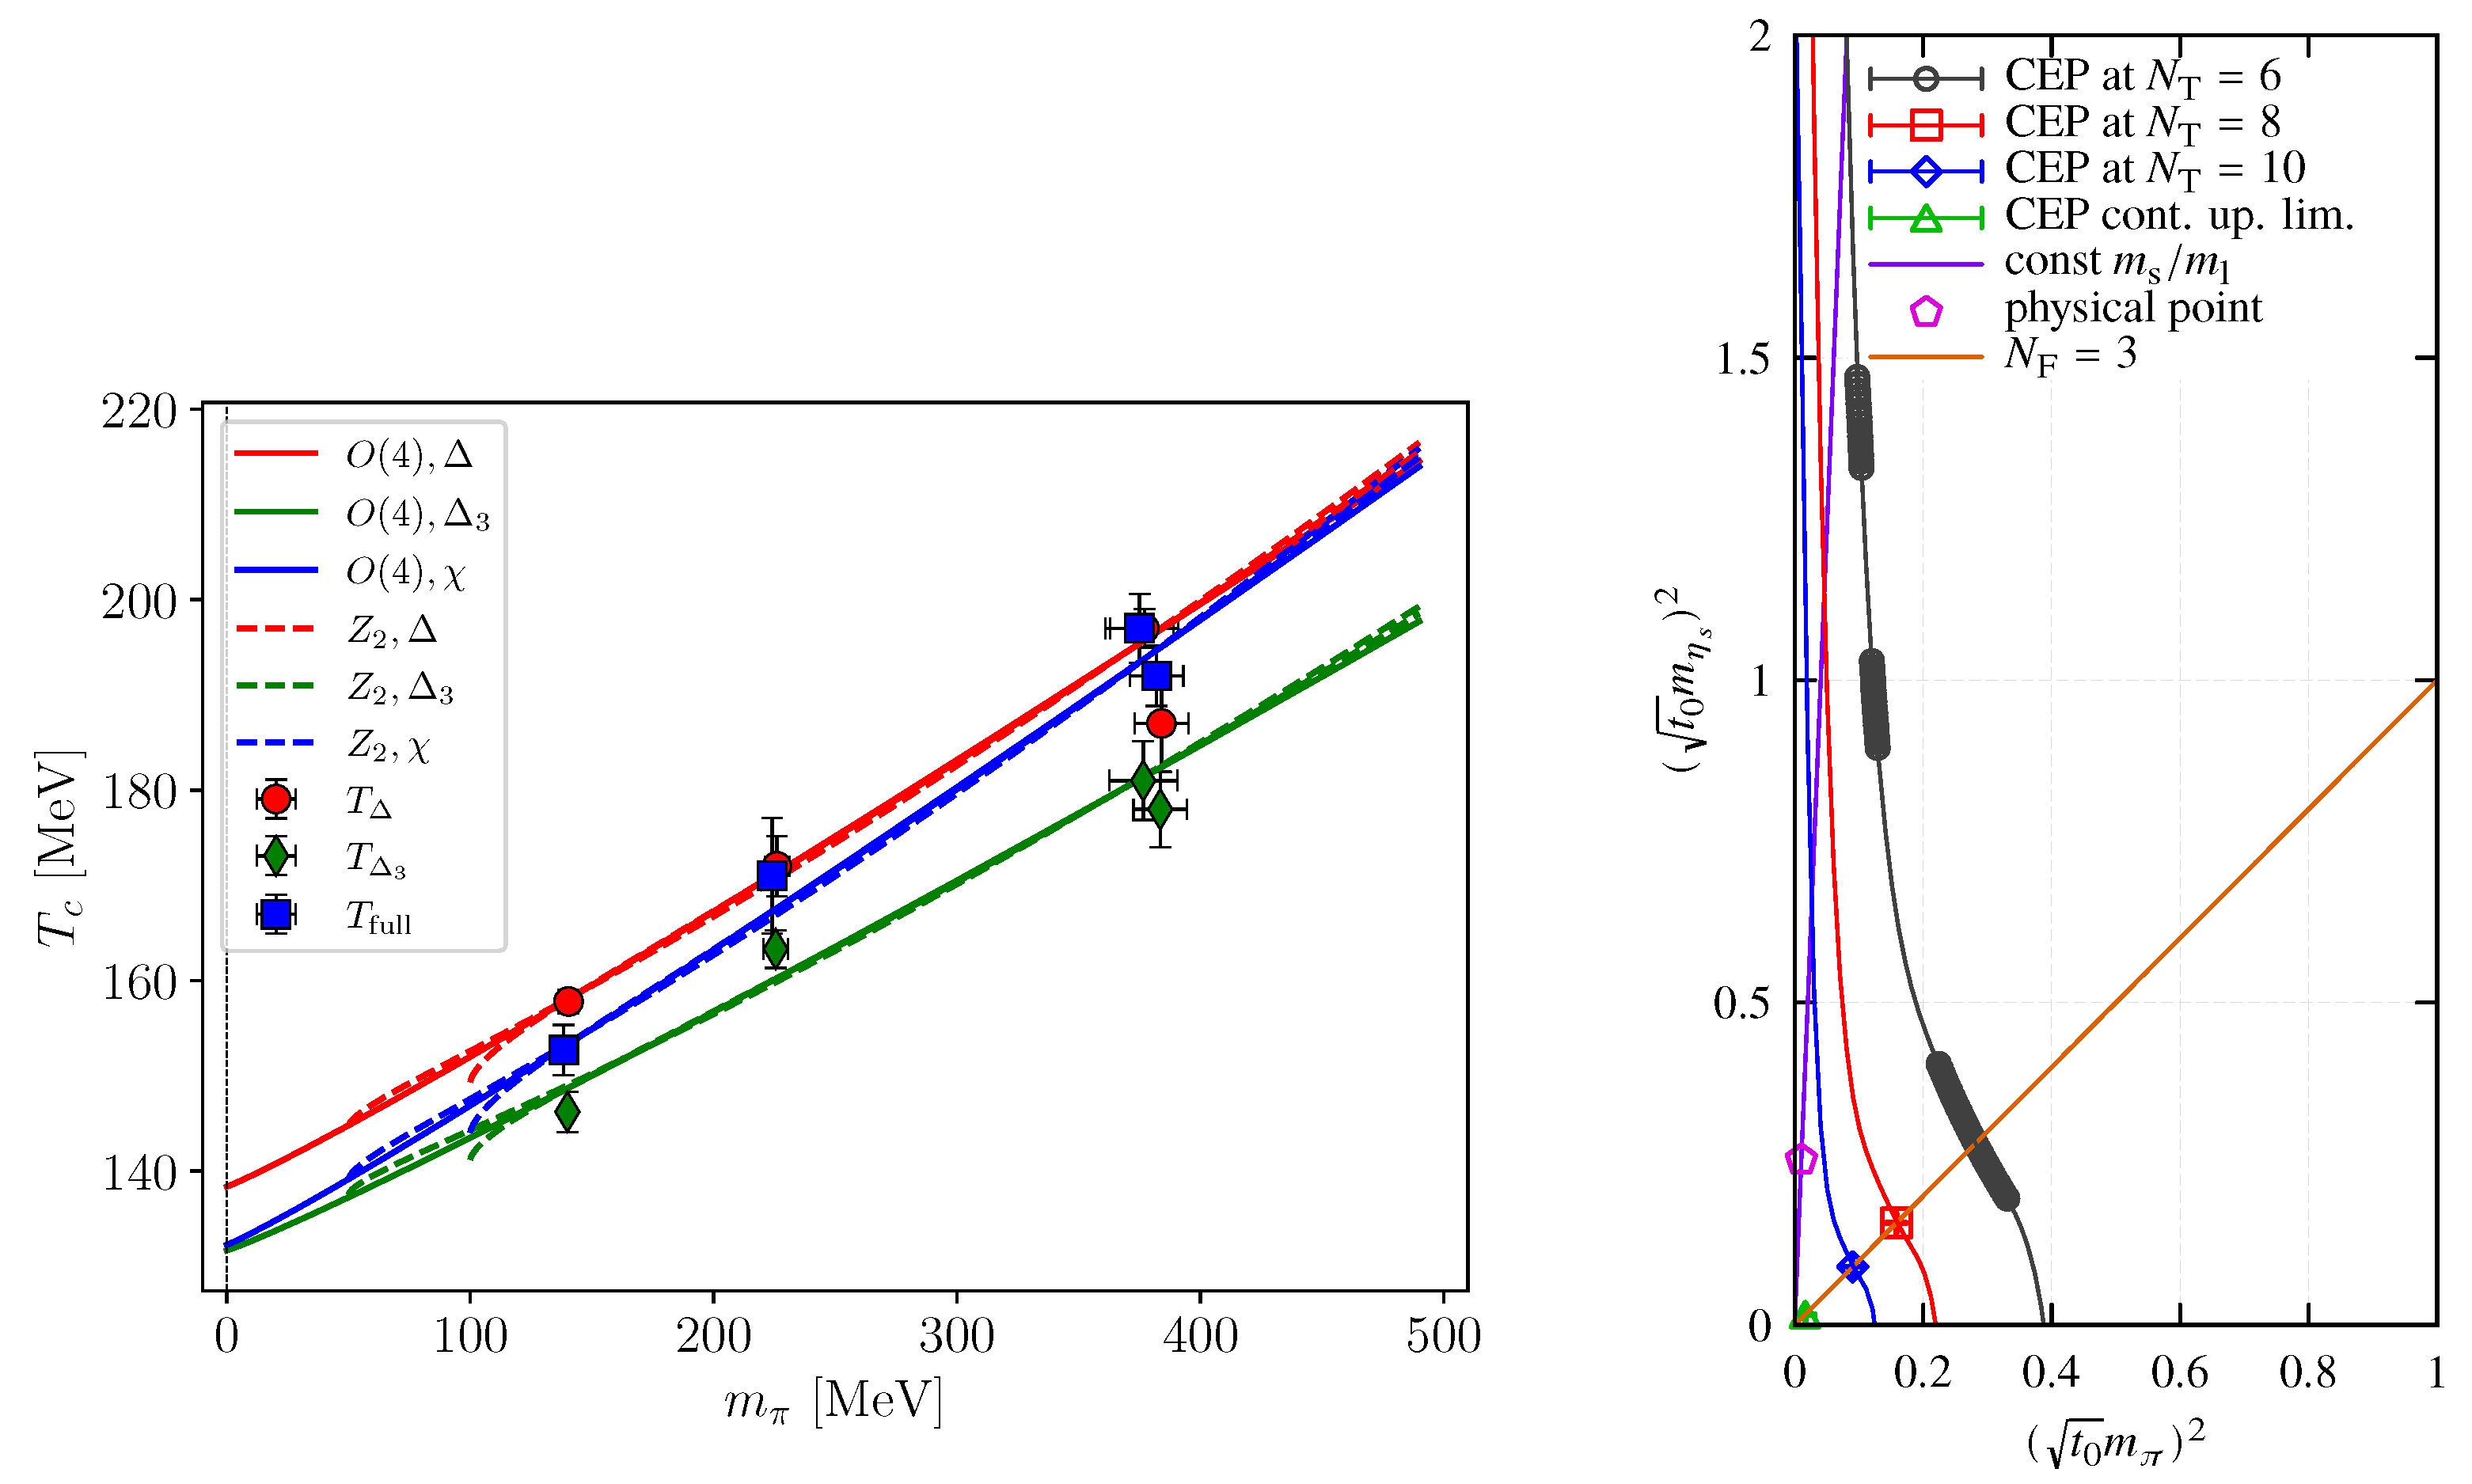
Simulations with Wilson fermions do not yet reach such small quark masses, but are fully consistent with this picture down to the physical pion mass. In particular, extrapolations of the pseudo-critical temperature to the chiral limit have also been attempted by an investigation using -improved twisted mass Wilson fermions, with strange and charm quark masses close to their physical values [37]. In these simulations lattice spacings are held fixed in a range , and temperature is varied by . The pseudo-critical temperature is defined in three different ways: By the maximum of the chiral susceptibility as above, and as the inflection point of polynomial fits to the chiral condensate () and a subtracted version without additive renormalisation . The resulting temperatures as a function of pseudo-scalar (pion) mass are shown in Figure 3 (left), together with extrapolations to the chiral limit, employing either exponents or -exponents and a critical pseudo-scalar mass up to MeV. Again, it is not possible to distinguish between these scenarios. As in the previous case, the extrapolated critical temperature in the chiral limit is therefore robust under changes of the critical exponents and quoted as
in remarkable agreement with the staggered result.
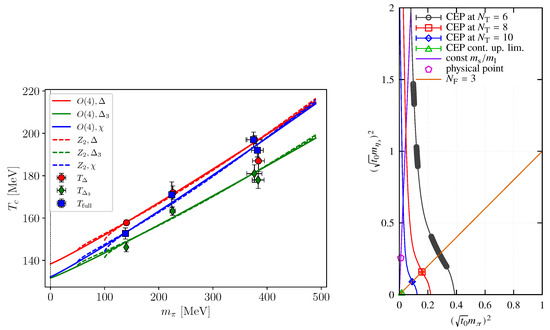
Figure 3.
(Left): Pseudo-critical temperature of the crossover defined by the chiral susceptibility , the inflection point of the chiral condensate or an additively renormalised chiral condensate , for twisted mass Wilson fermions close to the continuum. Lines represent chiral extrapolations according to the second-order or finite critical -mass scenario. From [37]. (Right): Columbia plot expressed in -masses in units of the Wilson flow parameter . Critical points have been determined using an -improved Wilson action. The first-order region includes the physical point on coarse lattices, but shrinks drastically as is increased. From [38].
Figure 3 (right) shows an investigation of sections of the chiral critical line using clover-improved Wilson fermions [38]. Starting point are the data for to be discussed separately below, and on further points at larger strange quark masses have been added. The critical line is then fitted assuming a tricritical strange quark mass as explained in Section 3.5 plus polynomial corrections. Note that this discretisation features a much wider first-order region, which even contains the physical point on the coarser lattices. This must be a lattice artefact, and the first-order region rapidly shrinks as is increased.
Several conclusions can be drawn from these results. Firstly, the width of a potential first-order region as in Figure 1 (left) is bounded to a small fraction of the physical light quark (or pion) masses. Second, the numerical proximity of the critical exponent combinations for the 3D and universality classes appears to allow for a robust extrapolation of the chiral transition temperature to the massless limit with remarkably small uncertainties. Conversely this statement implies, however, that it is impossible to firmly identify the universality class in this way, which would require exponentially accurate data. This problem might be avoided by looking at the scaling of energy-like variables, which are governed by the critical exponent that changes sign between the and the universality classes. It was shown that the Polyakov loop behaves as an energy-like observable, but unfortunately a firm distinction between universality classes would require a further substantial reduction of the light quark mass [39]. Finally, note that the value of is MeV lower than the pseudo-critical temperature at the physical point. This constrains the possible location of a chiral critical point at finite baryon density, as will be discussed in Section 5.1.
3.4. and
The theory, represented by the diagonal of the Columbia plot, Figure 1, is particularly interesting because a sufficiently large first-order transition and its associated -critical endpoint are accessible by direct simulations, rather than by extrapolation. However, the situation has become more complicated since the early results, as shown by the compilation of critical pseudo-scalar masses obtained by different actions and lattice spacings in Table 1. The largest value in the table differs by almost an order of magnitude from the lowest bound! Unless any of the employed lattice actions is fundamentally flawed, all of them must eventually converge to the same continuum limit, which is not in sight yet. However, the general trend is for the critical mass to shrink when either a lattice with fixed action is made finer (larger ), or when improved actions are employed. This points to enormous cutoff effects, which quite generally appear to increase the first-order region, i.e., make the transition stronger. Another observation is for the first-order region to be considerably larger in the case of Wilson fermions, which is consistent with stronger cutoff effects due to the complete violation of chiral symmetry.

Table 1.
Summary of previous studies (continued from [40,41]) of the chiral critical point at .
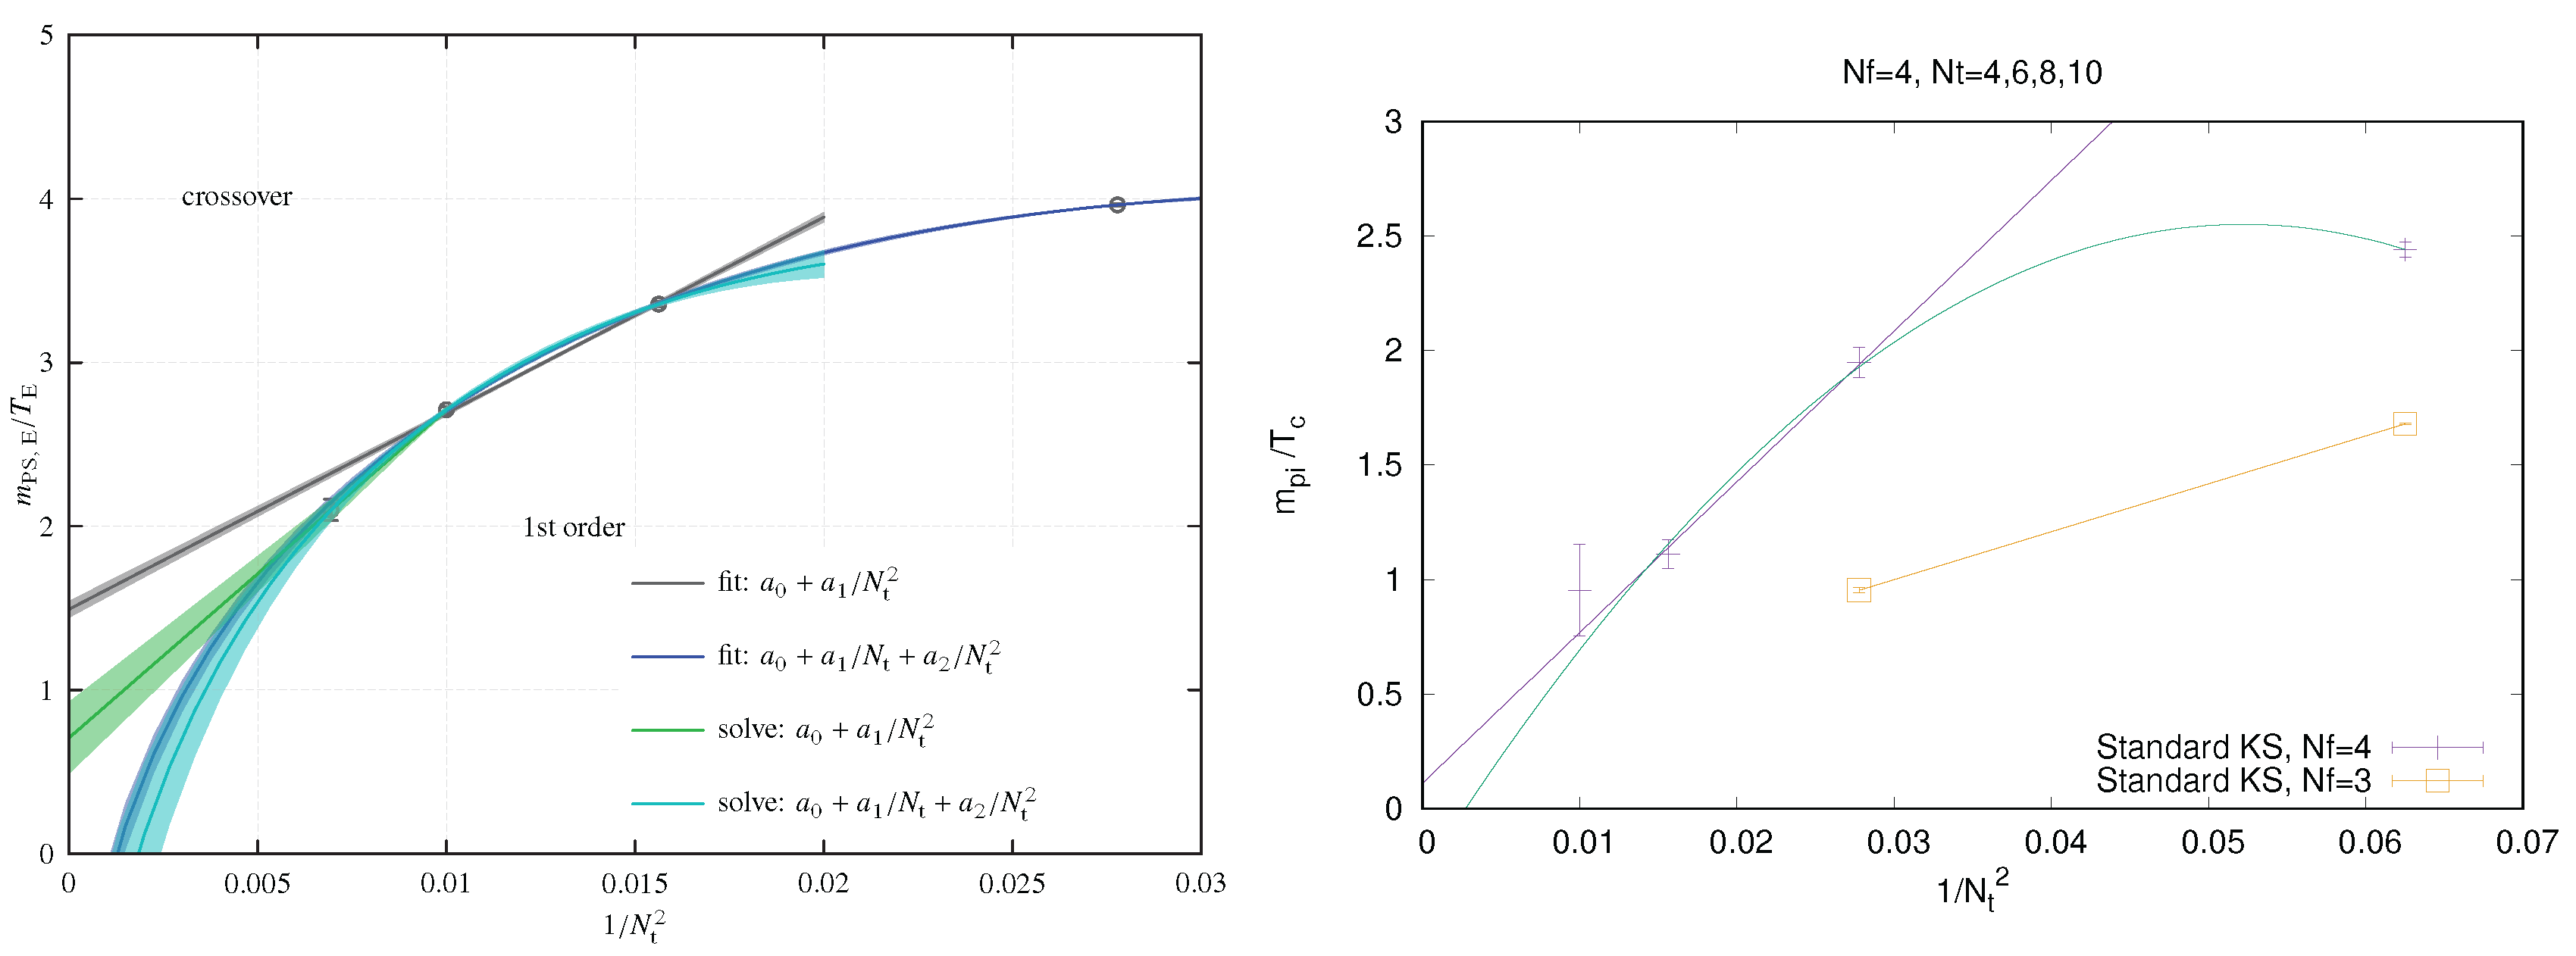
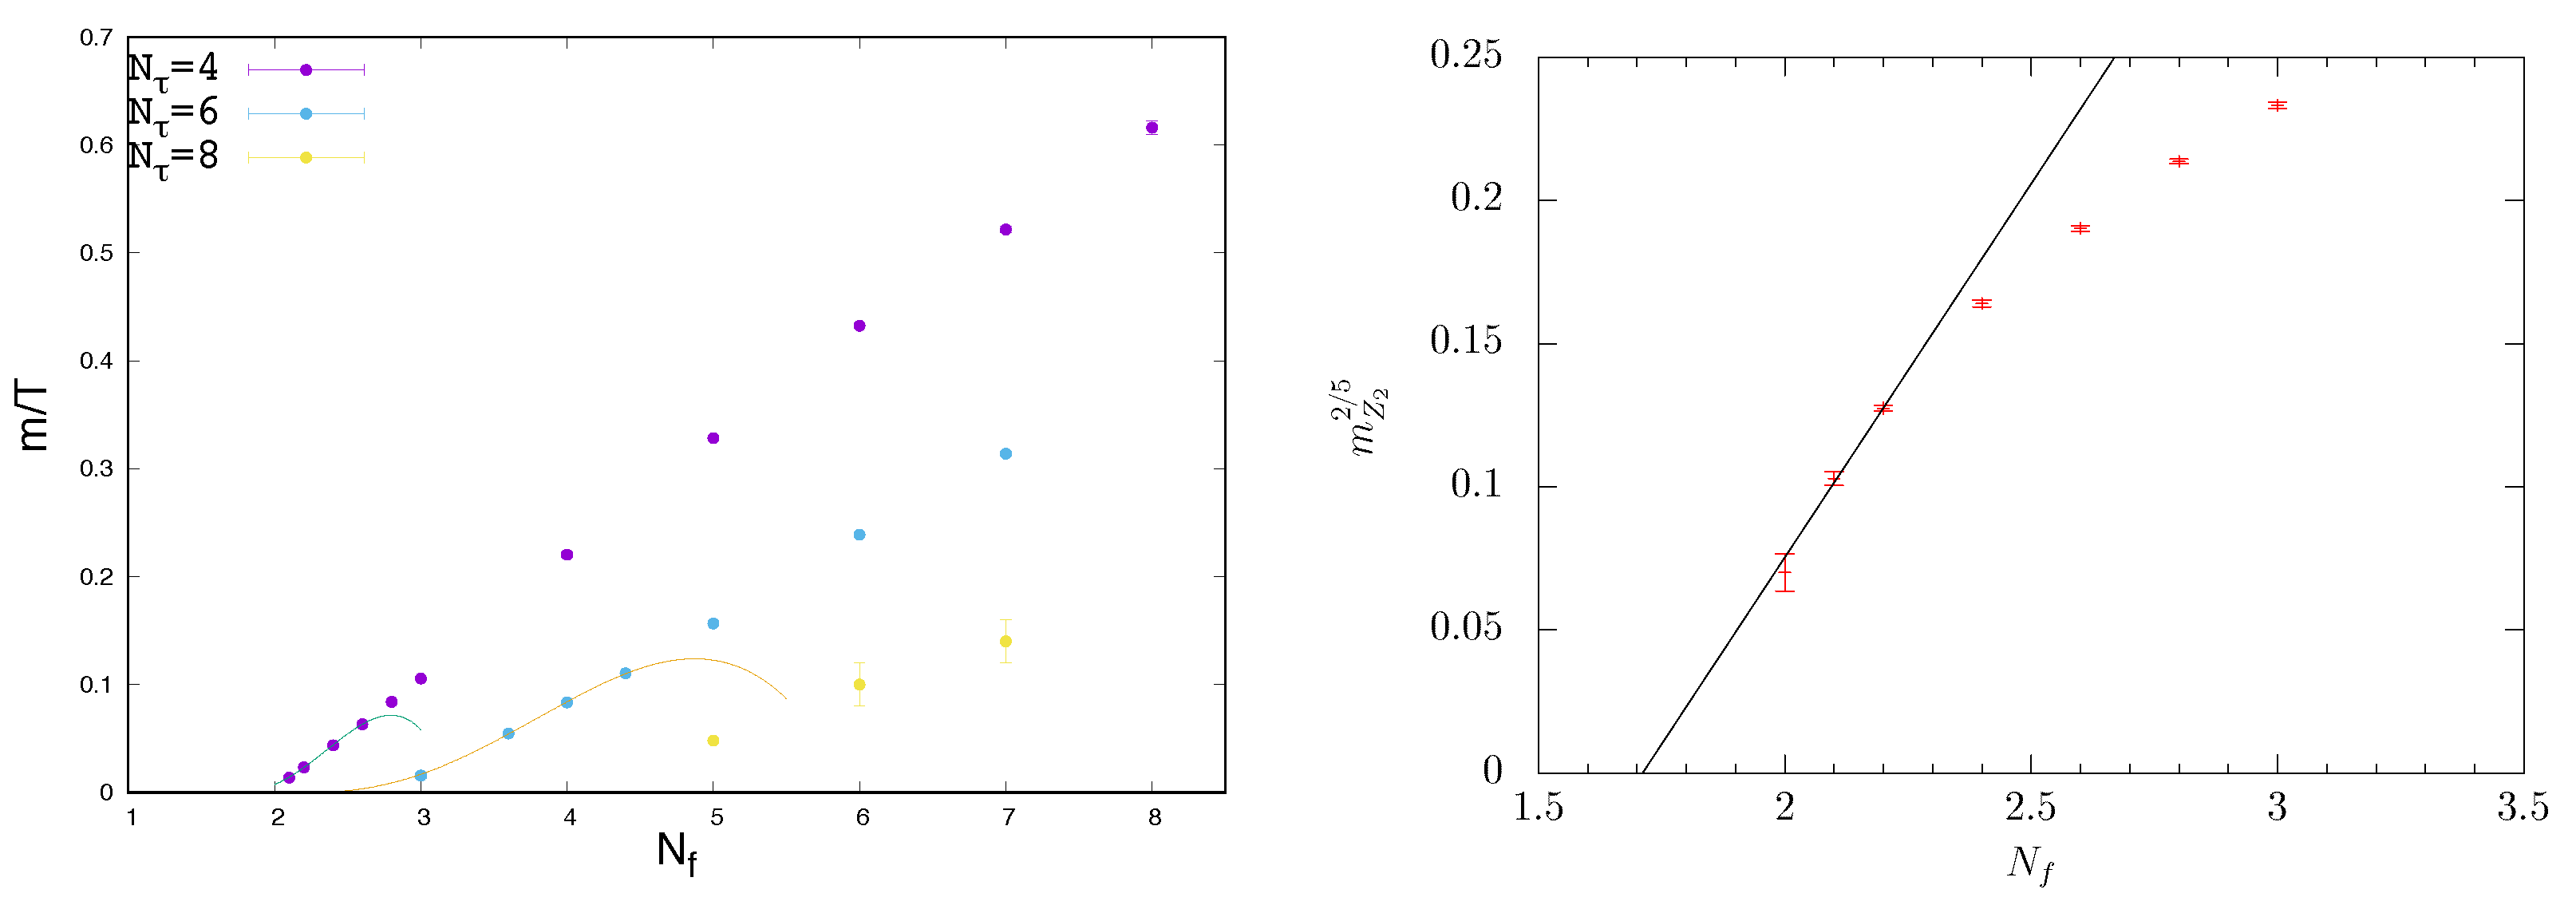
As an example, consider Figure 4 (left), where the critical pseudo-scalar mass is shown from a comprehensive long term study with -improved Wilson fermions for different lattice spacings. The critical meson mass shrinks by nearly a factor of two when the lattice is changed between and . Its continuum value depends strongly on the extrapolation function and could even be zero. The same effect is observed for unimproved staggered fermions [48], as shown in Figure 4 (right). One expects the transition in this case to be more strongly first-order than for , since the spontaneously breaking symmetry is larger. This is borne out both for Wilson [49] and staggered fermions. Note that for staggered fermions no rooting is applied, which therefore cannot cause any unphysical behaviour. Moreover, the effect of reducing the lattice spacing is similar for staggered fermions, i.e., with and without rooting.
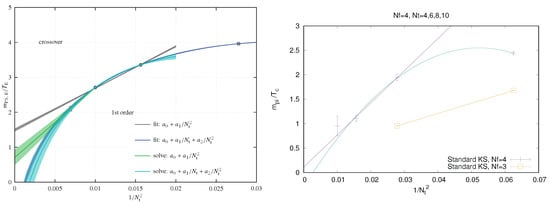
Figure 4.
Critical pseudo-scalar mass in units of temperature as a function of . (Left): -improved Wilson fermions with different continuum extrapolations, from [47]. (Right): unimproved staggered fermions, from [48].
We can then conclude that Wilson and staggered discretisations show the same qualitative behaviour, with a monotonic decrease of the critical pseudo-scalar mass as the continuum is approached by increasing . Quantitative contradictions between different actions are only avoided, if the final answer is below the lowest available value . In summary, since finer lattices and improved actions have become available, the situation for is quite similarly ambiguous to the previously discussed and .
3.5. Three-State Coexistence and Tricritical Scaling
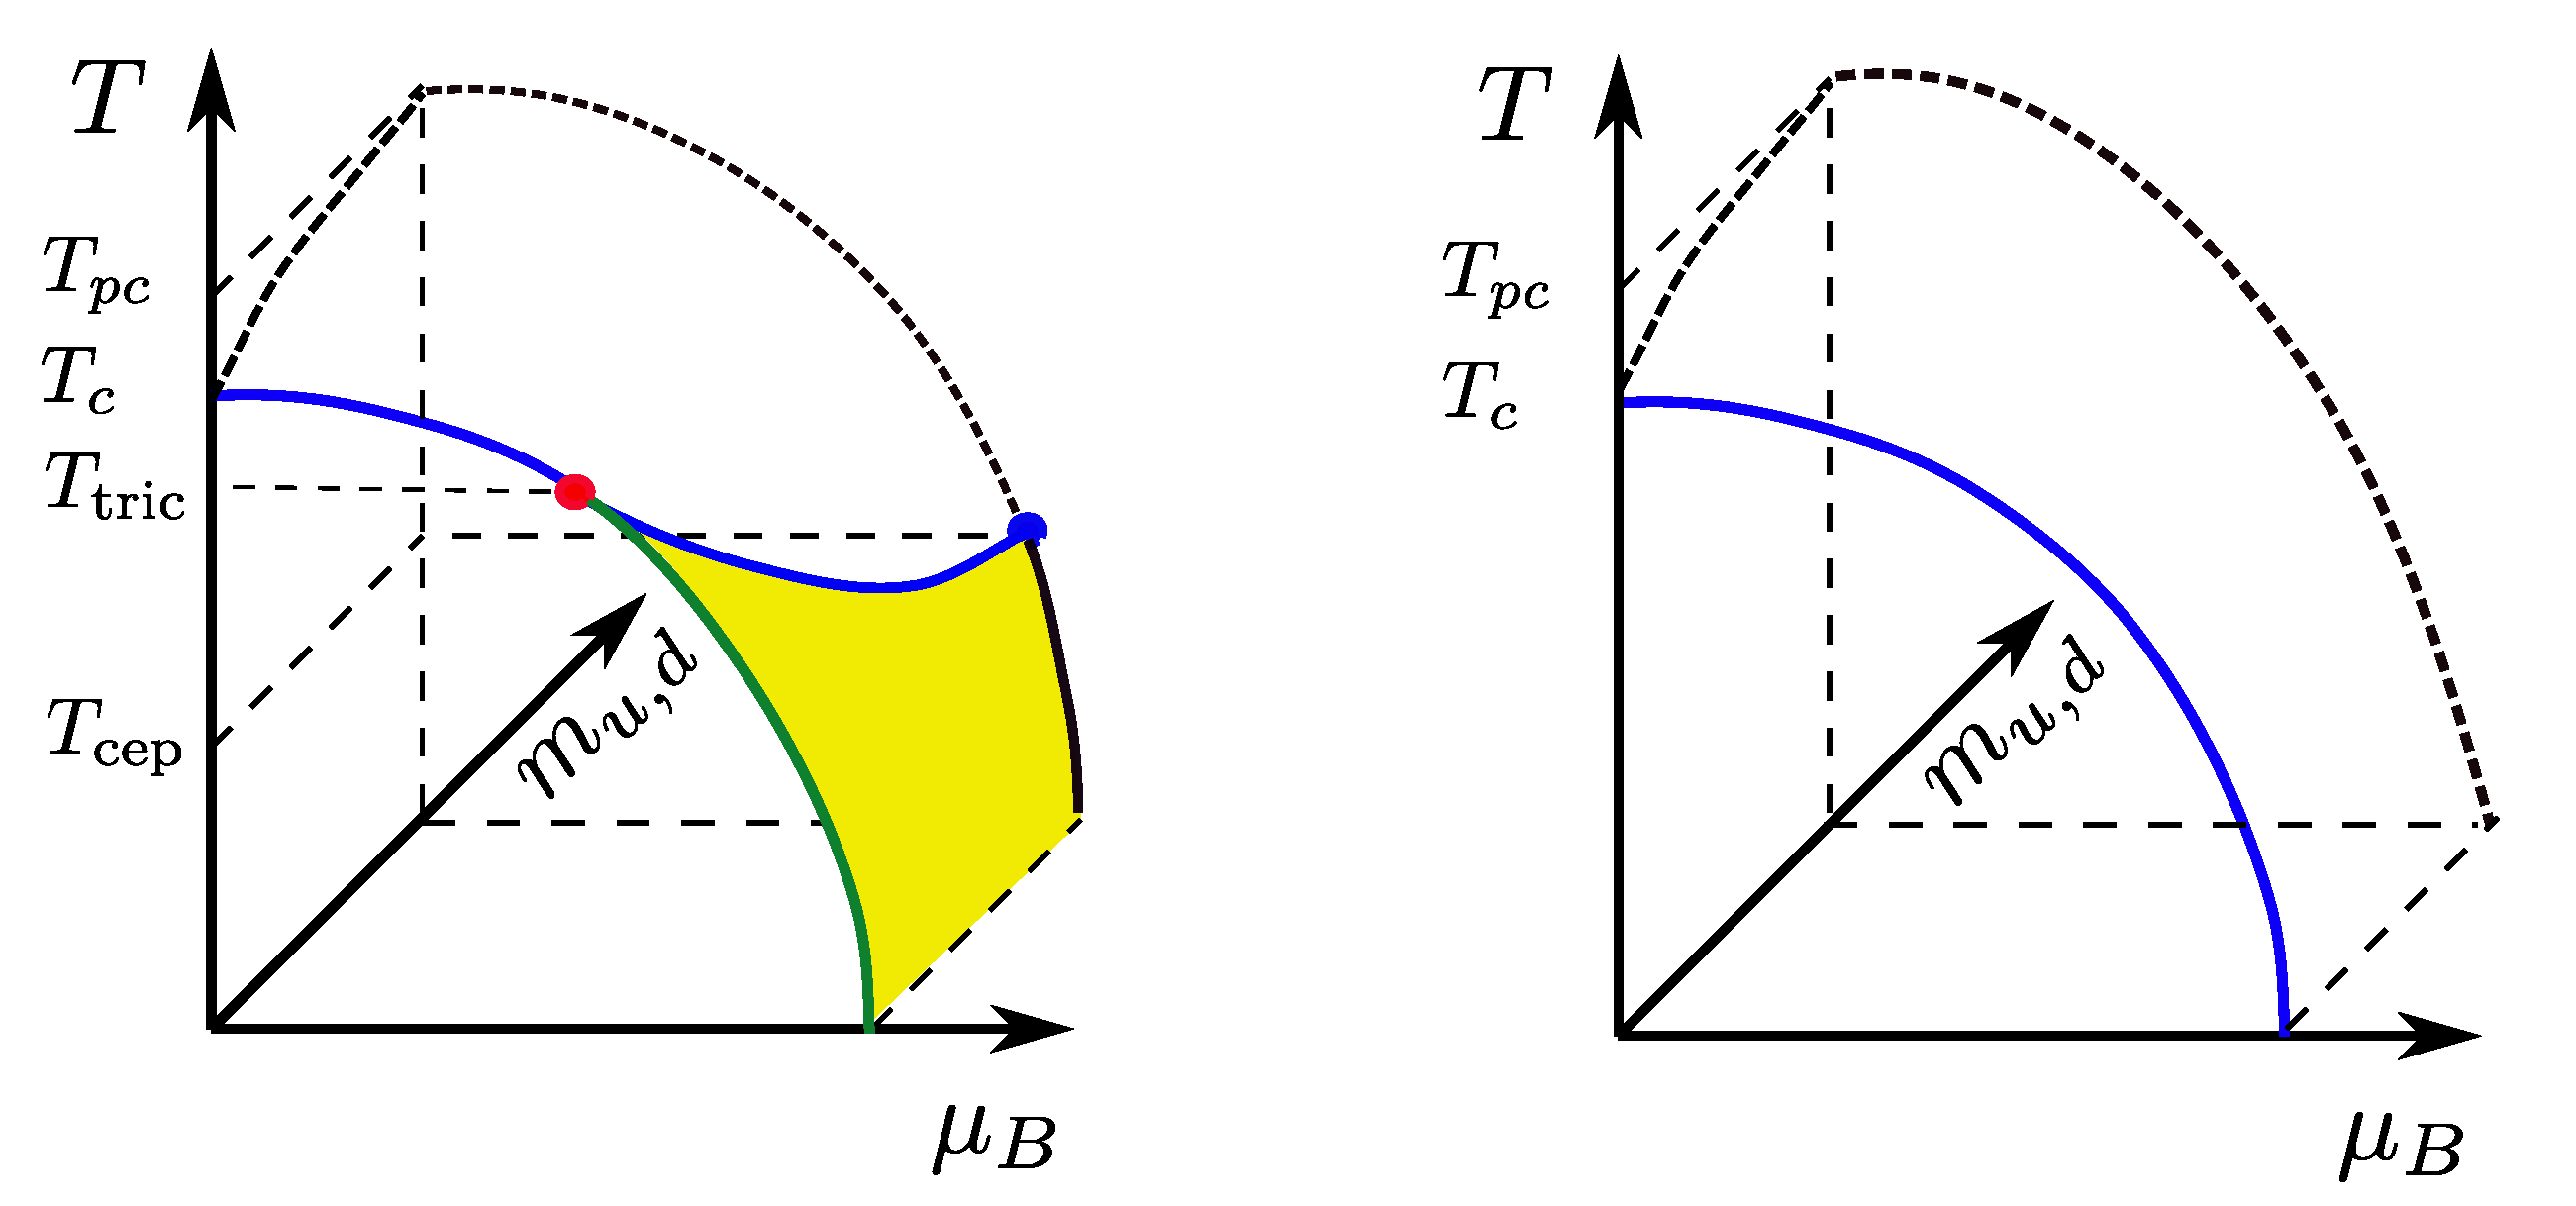
The uncertainty about the size of a potential first-order region can be removed by a different analysis, which leads to a consistent picture covering the results of all discretisations reported here. Starting point is the observation that a change of the chiral phase transition in the massless limit from first order to second order, brought about by variation of a continuous parameter, necessarily proceeds by a tricritical point [50]. To see this, assume the scenario in Figure 1 (right), and consider the corresponding phase diagram for a fixed , Figure 5 (left). For non-vanishing quark masses, the first-order transition weakens to disappear in a critical endpoint, and the phase diagram is symmetric under a chiral rotation . Hence, in the massless limit the critical temperature marks a triple point of three-state coexistence: Two states with broken chiral symmetry, , and one with chiral symmetry restored, . When is increased, these points trace out a triple line (corresponding to the green line in Figure 1) along which the latent heat of the first-order transition decreases, until it vanishes in a tricritical point. At the same time, the two wings of finite mass first-order transitions shrink, so that the tricritical point marks the confluence of two critical endpoints.
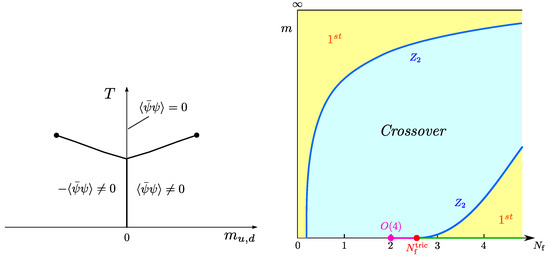
Figure 5.
(Left): Phase diagram with a first-order chiral phase transition. For the T-axis corresponds to a coexistence line of , and represents a triple point. (Right): Columbia plot for mass-degenerate quarks. Again every point represents a phase boundary and has an implicitly associated .
This opens an additional path of investigation. Quite generally, tricritical points come with their own set of critical exponents, which take mean field values since their upper critical dimension is three. For a general introduction to the theory of tricritical scaling, see [51]. In particular, the functional form of the critical wing lines entering the tricritical point as a function of the symmetry breaking field, which is the bare light quark mass in our case, is governed by a critical exponent,
This allows for an extraction of the location of a tricritical point with fixed, known exponents, which is much easier than having to determine the exponents themselves. Knowing the location of the tricritical point then fixes the order of the transition on both sides of it, albeit without information about the universality class. Attempts in this direction were made in [38,52], but they are not yet conclusive because the lattices are coarse, whereas very high precision data very close to the chiral limit would be required on sufficiently fine lattices in order to unambiguously distinguish tricritical scaling from an ordinary polynomial. However, this problem can be circumvented by a change of variables in the bare parameter space of the theory.
3.6. The Chiral Phase Transition as a Function of and
In [33] it was suggested to consider a different version of the Columbia plot with degenerate quarks only, in which the variable strange quark mass is traded for a variable analytically continued to non-integer values. Starting with integer , after Grassmann integration the QCD partition function reads
which can now be formally viewed as a statistical system of gauge field variables depending on a continuous parameter . In the lattice formulation with rooted staggered fermions, whose determinant is raised to the power in order to describe mass-degenerate quarks, this is implemented straightforwardly. The Columbia plot Figure 1 (right) then translates to the version shown in Figure 5 (right), where the tricritical strange quark mass is replaced by a tricritical number of flavours, , and the -axis to the right of it corresponds to the new triple line. The crucial advantage in this modified parameter space is that, since there is no chiral transition for , a tricritical point is guaranteed to exist as soon as there is a first-order region for any . At finite lattice spacing there is an additional parameter, and the -critical boundary traces out a chiral critical surface which terminates in a tricritical line in the chiral limit of the lattice theory. Since there is ample evidence for first-order transitions at coarse lattice spacings, the task is now reduced to track their boundaries in the lattice bare parameter space and determine the location of the tricritical line in the lattice chiral limit.
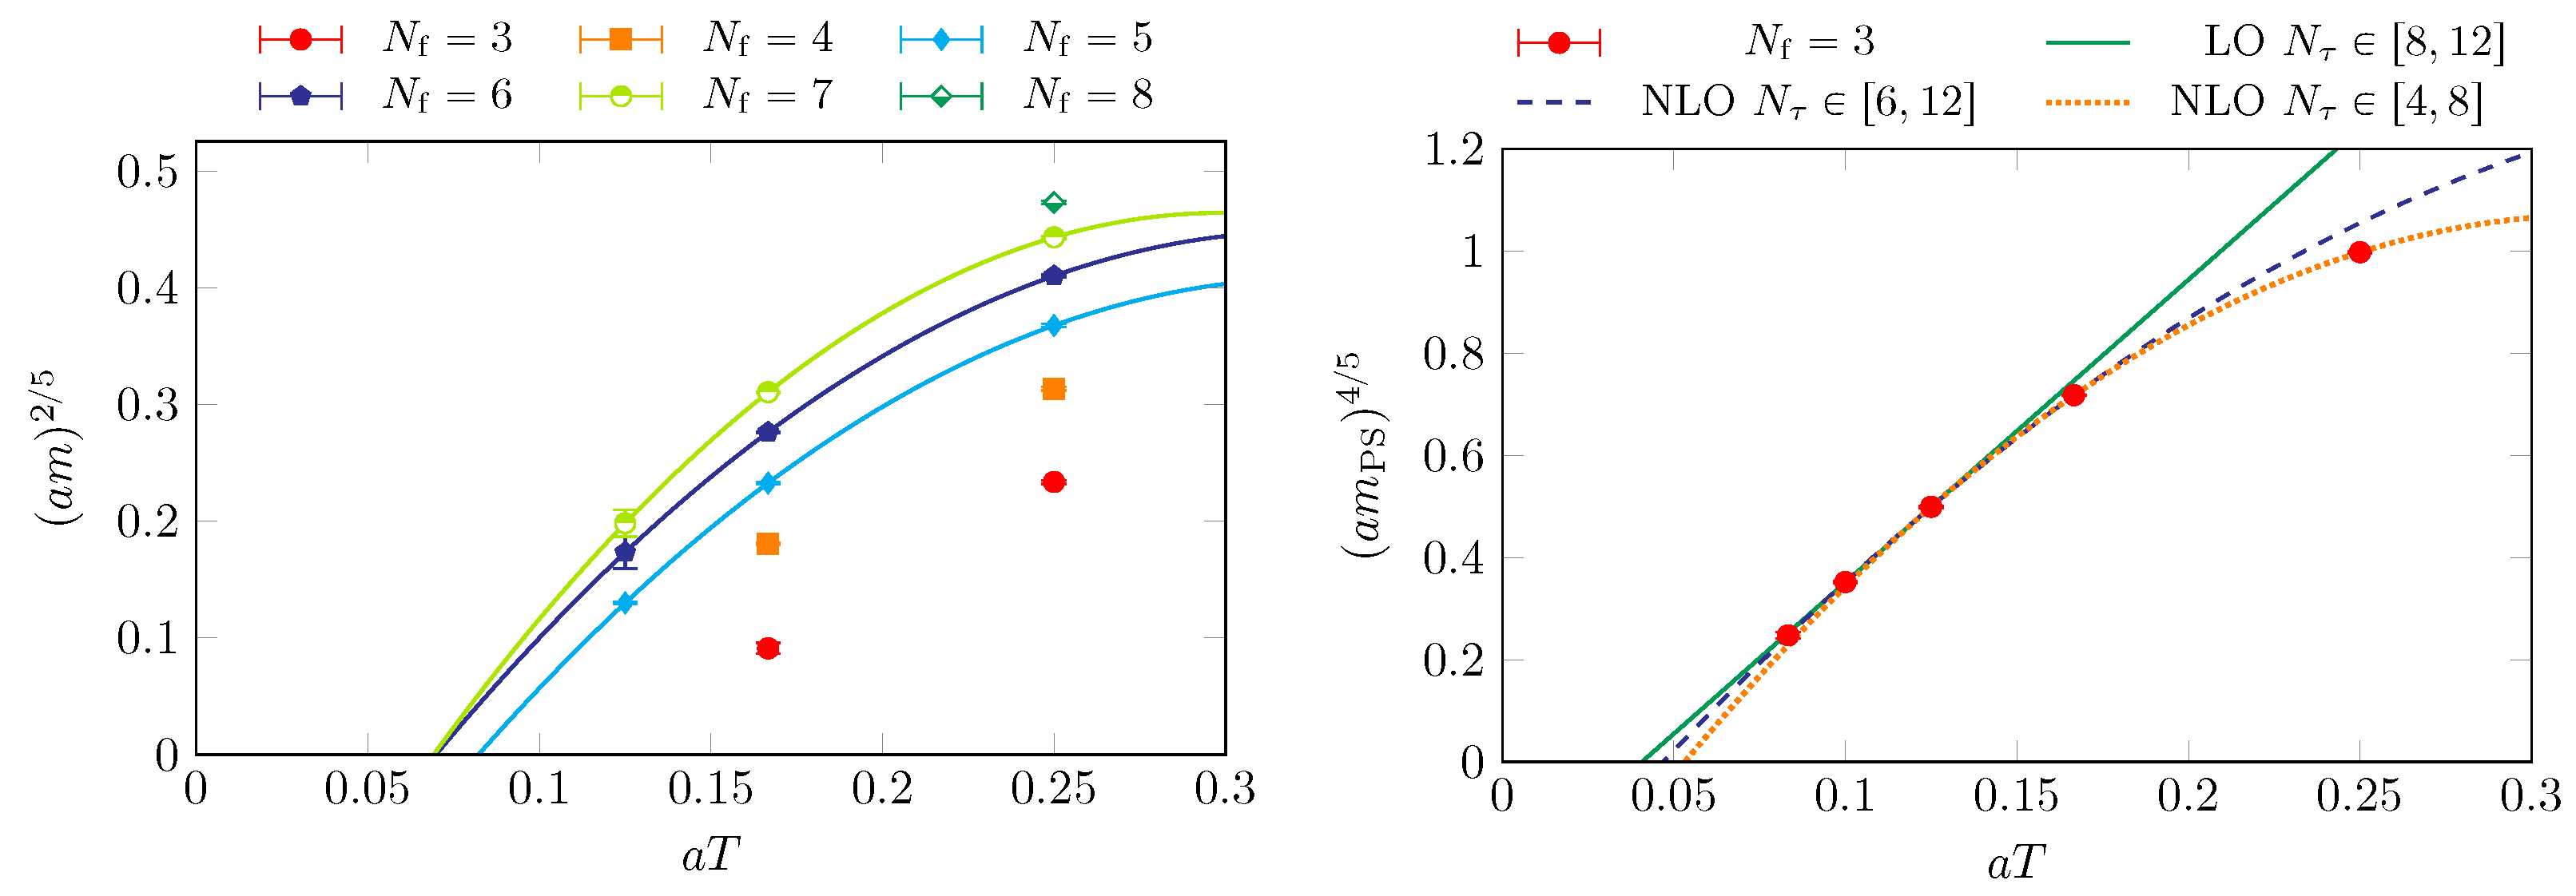
Numerical results obtained with unimproved staggered fermions for a wide range of flavours and [33,53] are shown in Figure 6. The left plot represents the lattice version of the Columbia plot Figure 5 (right). One observes a summary of the previous discussion, namely a first-order transition getting stronger with and with increasing lattice spacing. The cutoff effects are growing with , for the critical bare quark mass is reduced by a stunning factor of five when the lattice spacing is reduced ( is increased) by a factor of two! No continuum critical mass is discernible yet for any . On the other hand, the intercepts of the critical lines at constitute the sought-after tricritical line . Tricritical scaling can be appreciated in the rescaled Figure 6 (right), where the data approach a leading order scaling relation [33]. This allows for an extrapolation
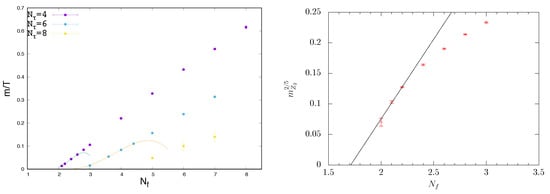
Figure 6.
The chiral critical surface for unimproved staggered fermions, projected onto the plane [53] (left) and onto the plane for [33] (right). Every point of the plane represents a phase boundary with an implicitly tuned . Regions above the -lines represent crossover, those below first-order transitions. Fits on the left show next-to-leading order tricritical scaling, on the right leading-order tricritical scaling.
The scaling relation has been inverted here, because in simulations is fixed whereas the critical quark mass is computed with statistical errors. Note also that the data point in Figure 6 (right) has been obtained by a tricritical extrapolation in imaginary chemical potential at fixed [32]. This is an independent confirmation of the bare quark mass as a tricritical scaling field near its chiral limit. Scaling fits in the left figure take into account the next-to-leading order terms to predict and . While no extrapolation for is available yet, the critical line further flattens and appears to shift to the right, implying a line . One concludes that, for unimproved staggered fermions, the massless theory shows a first-order transition on , but a second-order transition on all finer lattices and in the continuum. The question now is what happens to the theories.
This can be seen in a different variable pairing in Figure 7 (left), where the same critical bare quark masses are rescaled by the tricritical exponent, and plotted as a function of for different fixed -values. Only a slight curvature is exhibited by those -lines with three data points, which thus are compatible with next-to-leading order scaling and a tricritical point at some finite , obtained by the corresponding extrapolations.
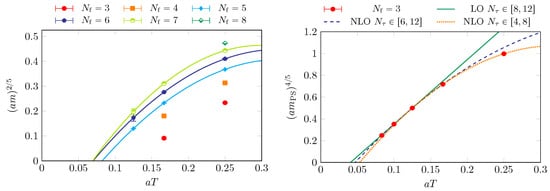
Figure 7.
The chiral critical surface projected onto the plane for unimproved staggered fermions [53] (left) and for -improved Wilson fermions [47] (right), with tricritical scaling fits to both. From [53].
3.7. Tricritical Scaling for Wilson Fermions
What about Wilson fermions, which exhibit the widest first-order region among the discretisation schemes discussed here? In this case the conceptual situation is more difficult, because chiral symmetry is broken completely so that the bare quark mass and chiral condensate receive additive renormalisation as well as the ordinary multiplicative one. Moreover, the bare parameter phase diagram is expected to show lattice artefacts such as parity broken phases [54,55] or first-order bulk transitions [56,57,58], whose location depends on the details of the lattice action and . This may considerably complicate the bare parameter phase diagram while, of course, all actions should eventually agree in the continuum limit.
Here we consider an RG-improved Wilson gauge and non-perturbatively O(a)-improved Wilson fermion action, for which the Aoki phase is limited to the strong coupling regime and no other unphysical phases have been observed [59], and which was used for the sequence of simulations [45,46,47] displayed in Figure 4 (left). These data have recently been reanalysed in order to test for tricritical scaling [53], in analogy to the staggered case above. To this end, one can exploit that in chiral perturbation theory
which also holds for Wilson fermions provided that an additively renormalised quark mass is used. The data from Figure 4 are replotted in Figure 7 (right), with the vertical axis rescaled to be proportional to the renormalised quark mass as scaling variable. Perfect triritical scaling is observed, with extrapolations that are robust under variation between leading and next-to-leading order, as well as when using only the coarsest lattices .
3.8. Conclusions for the Continuum Limit
Knowing the structure of the bare parameter lattice phase diagram, its implications for continuum physics can be stated. The continuum limit is represented by the origin of the plane, which can be approached along different lines of constant physics, representing theories with different values for, e.g., the vacuum pseudo-scalar mass. For any with a finite , the parameter region of first-order transitions is not continuously connected to the continuum limit, and thus represents a mere cutoff effect. In other words, for all , simulations will only show crossover behaviour for any vacuum pion mass, such that the transition in the continuum chiral limit is approached from the crossover, and corresponds to an isolated second-order point. By contrast, a first-order transition in the chiral continuum limit implies a finite in physical units, which would require the -critical line to terminate in the origin of the plot. Moreover, there would be no tricritical point and no associated tricritical scaling, so that should have an ordinary Taylor expansion about zero with the usual cutoff corrections etc. In [53] it was found that polynomial next-to-leading order fits are unable to accommodate the data for unimproved staggered fermions. For the -improved Wilson fermions such fits are possible but have worse than the tricritical fits. We must then conclude that the staggered action predicts all massless theories with to have second-order transitions in the continuum limit, and that the Wilson clover-action agrees with this for . Note that this conclusion is perfectly consistent with the absence of any first-order region in all simulations with improved staggered actions so far.
In summary:
- Qualitatively, the discretisation effects on the chiral phase transition are the same for unimproved staggered fermions and either unimproved or -improved Wilson fermions, making the transition stronger compared to the continuum.
- In both discretisations, the boundaries of the first-order transitions at finite lattice spacings exhibit tricritical scaling and extrapolate to a finite . This implies that the first-order region is not connected to the continuum limit. Thus, when the continuum limit is taken before the chiral limit, as is necessary to avoid lattice artefacts, both predict a second-order transition.
- Quantitatively, the cutoff effects are larger for Wilson fermions, resulting in a larger than in the case of staggered fermions. This might be explained by the fact that the respective discretisations break chiral symmetry fully or only partially.
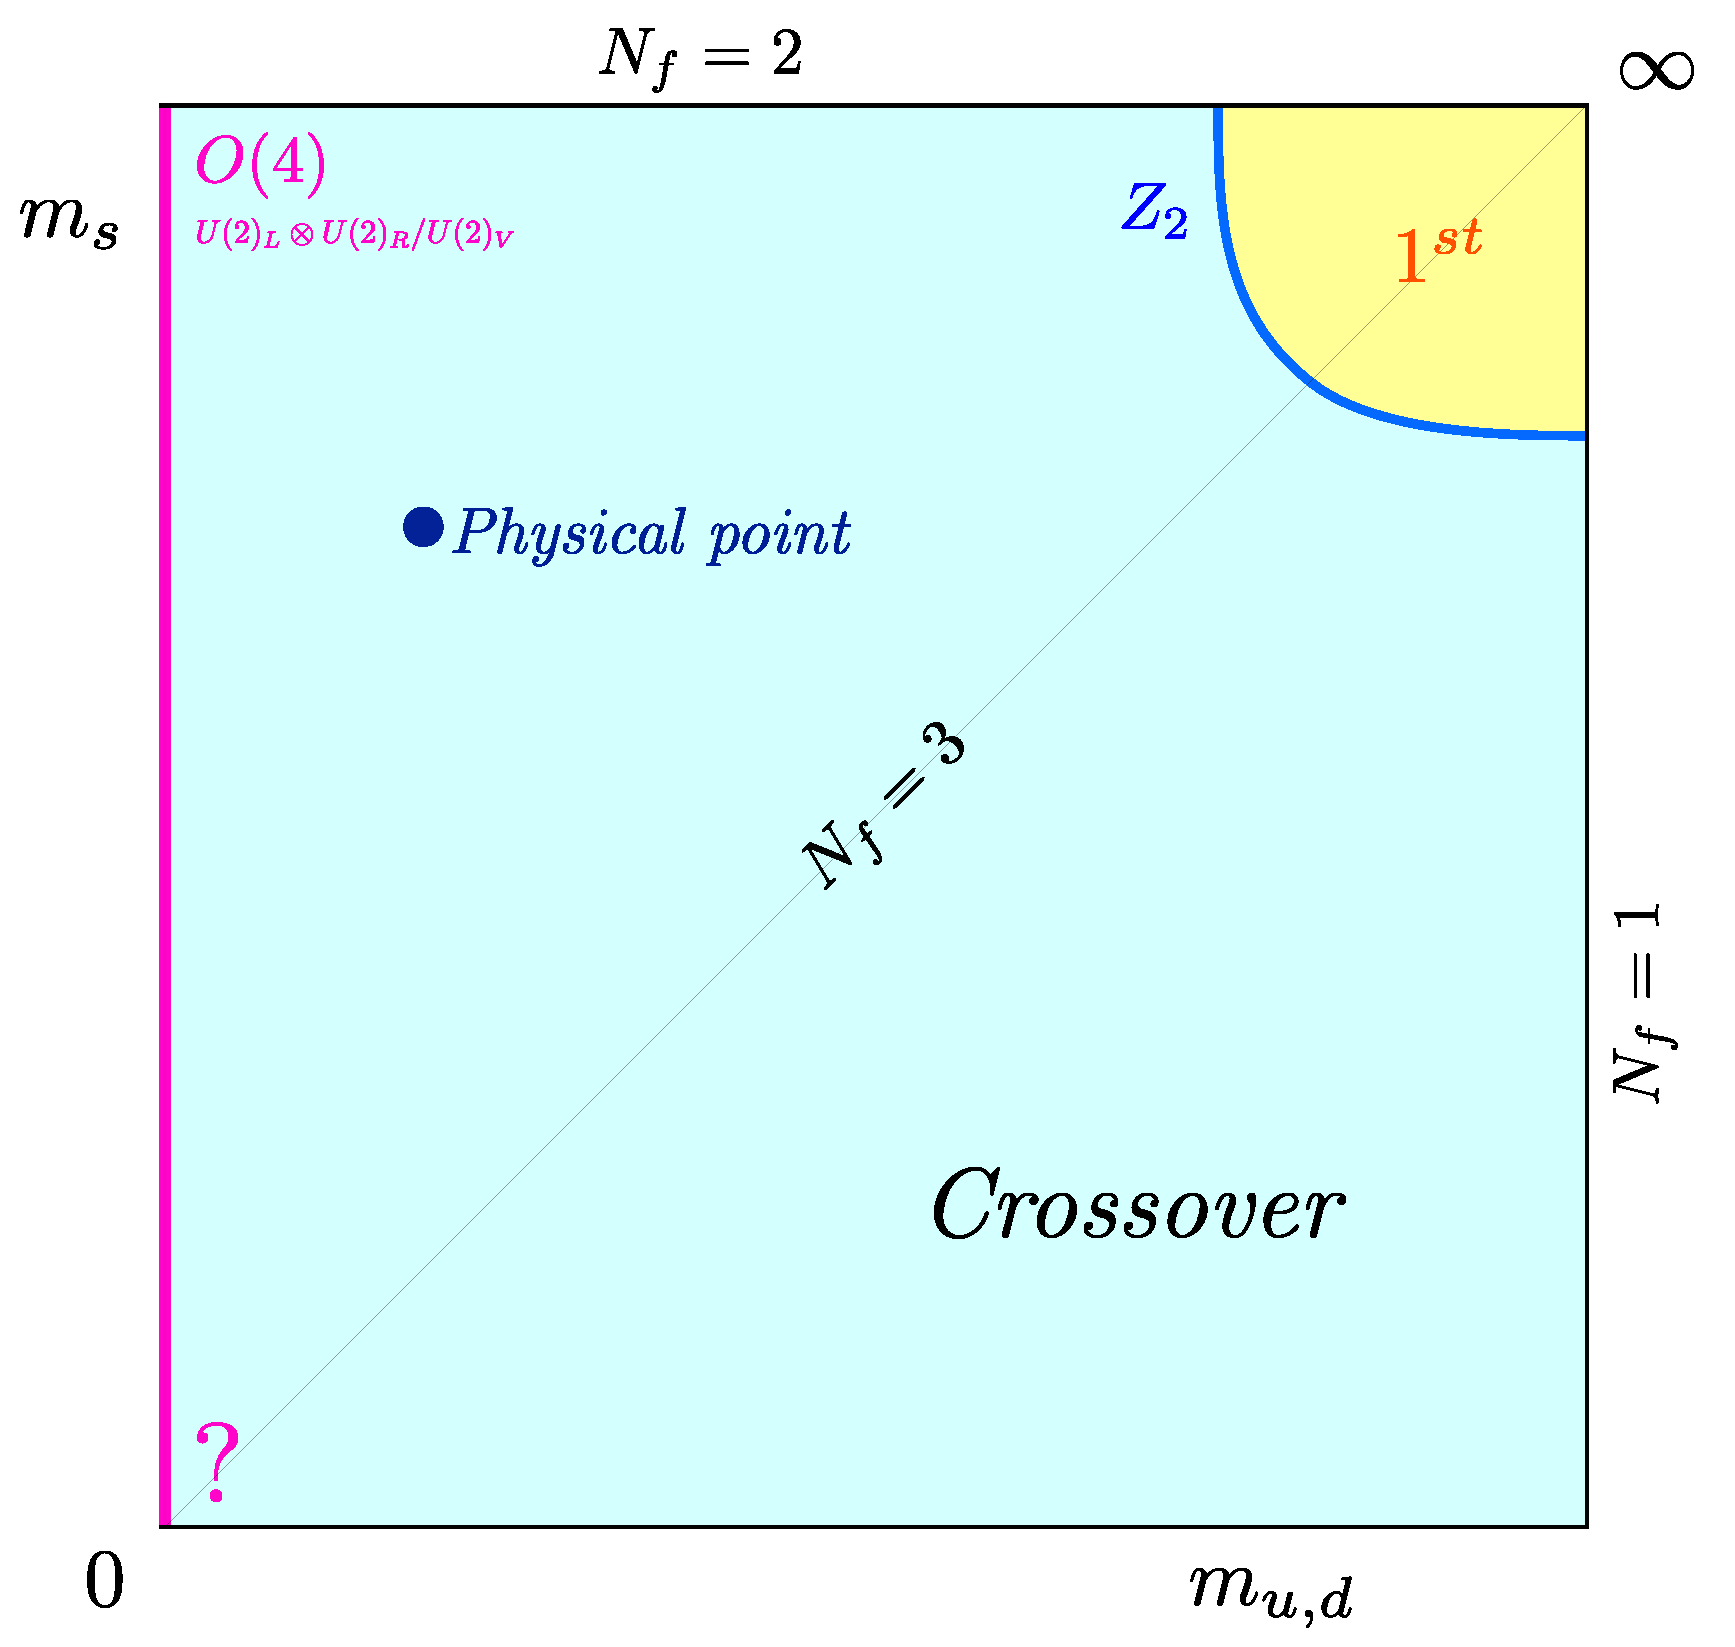
If these conclusions withstand the test of further investigations, they require a modification of the Columbia plot, as shown in Figure 8, with a second-order transition all along the limit, independent of the strange quark mass. Note that the universality class of these second-order transitions remains open. Since the chiral symmetry is different for the boundary cases, one might expect critical exponents to smoothly cross from one set of values to the other along the second-order line.
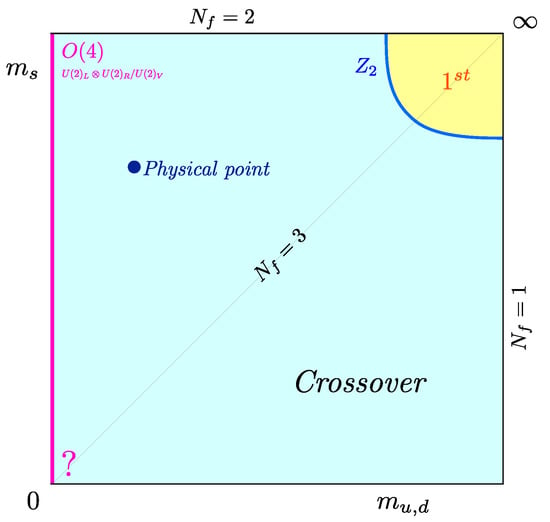
Figure 8.
The Columbia plot in the continuum, as suggested by the tricritical scaling analyses of unimproved staggered and -improved Wilson fermions. From [53].
Numerical simulations are no mathematical proof, and the reported results are in contradiction with the predictions from [25,27]. Given the presently available data, what would it take to avoid this conclusion and render the chiral phase transition for first order? This would require future data points for (or ) on larger to extrapolate to zero as a polynomial in , i.e., without tricritical scaling, independent of the discretisation scheme. The tricritical scaling observed for the presently available would then have to be “accidental”. On the other hand, the question arises whether the three-dimensional sigma models investigated in [25,27] represent the most general case compatible with QCD. It is well-known that -theories do not permit tricritical points, which requires -terms. In three dimensions, theories are renorrmalisable and moreover show stable infrared fixed points in non-perturbative studies [60,61], which could reconcile effective theories with the current lattice results. It should be possible to resolve these questions in the near future and finally settle the fate of the thermal QCD phase transition with massless quarks.
4. The Columbia Plot with Chemical Potential
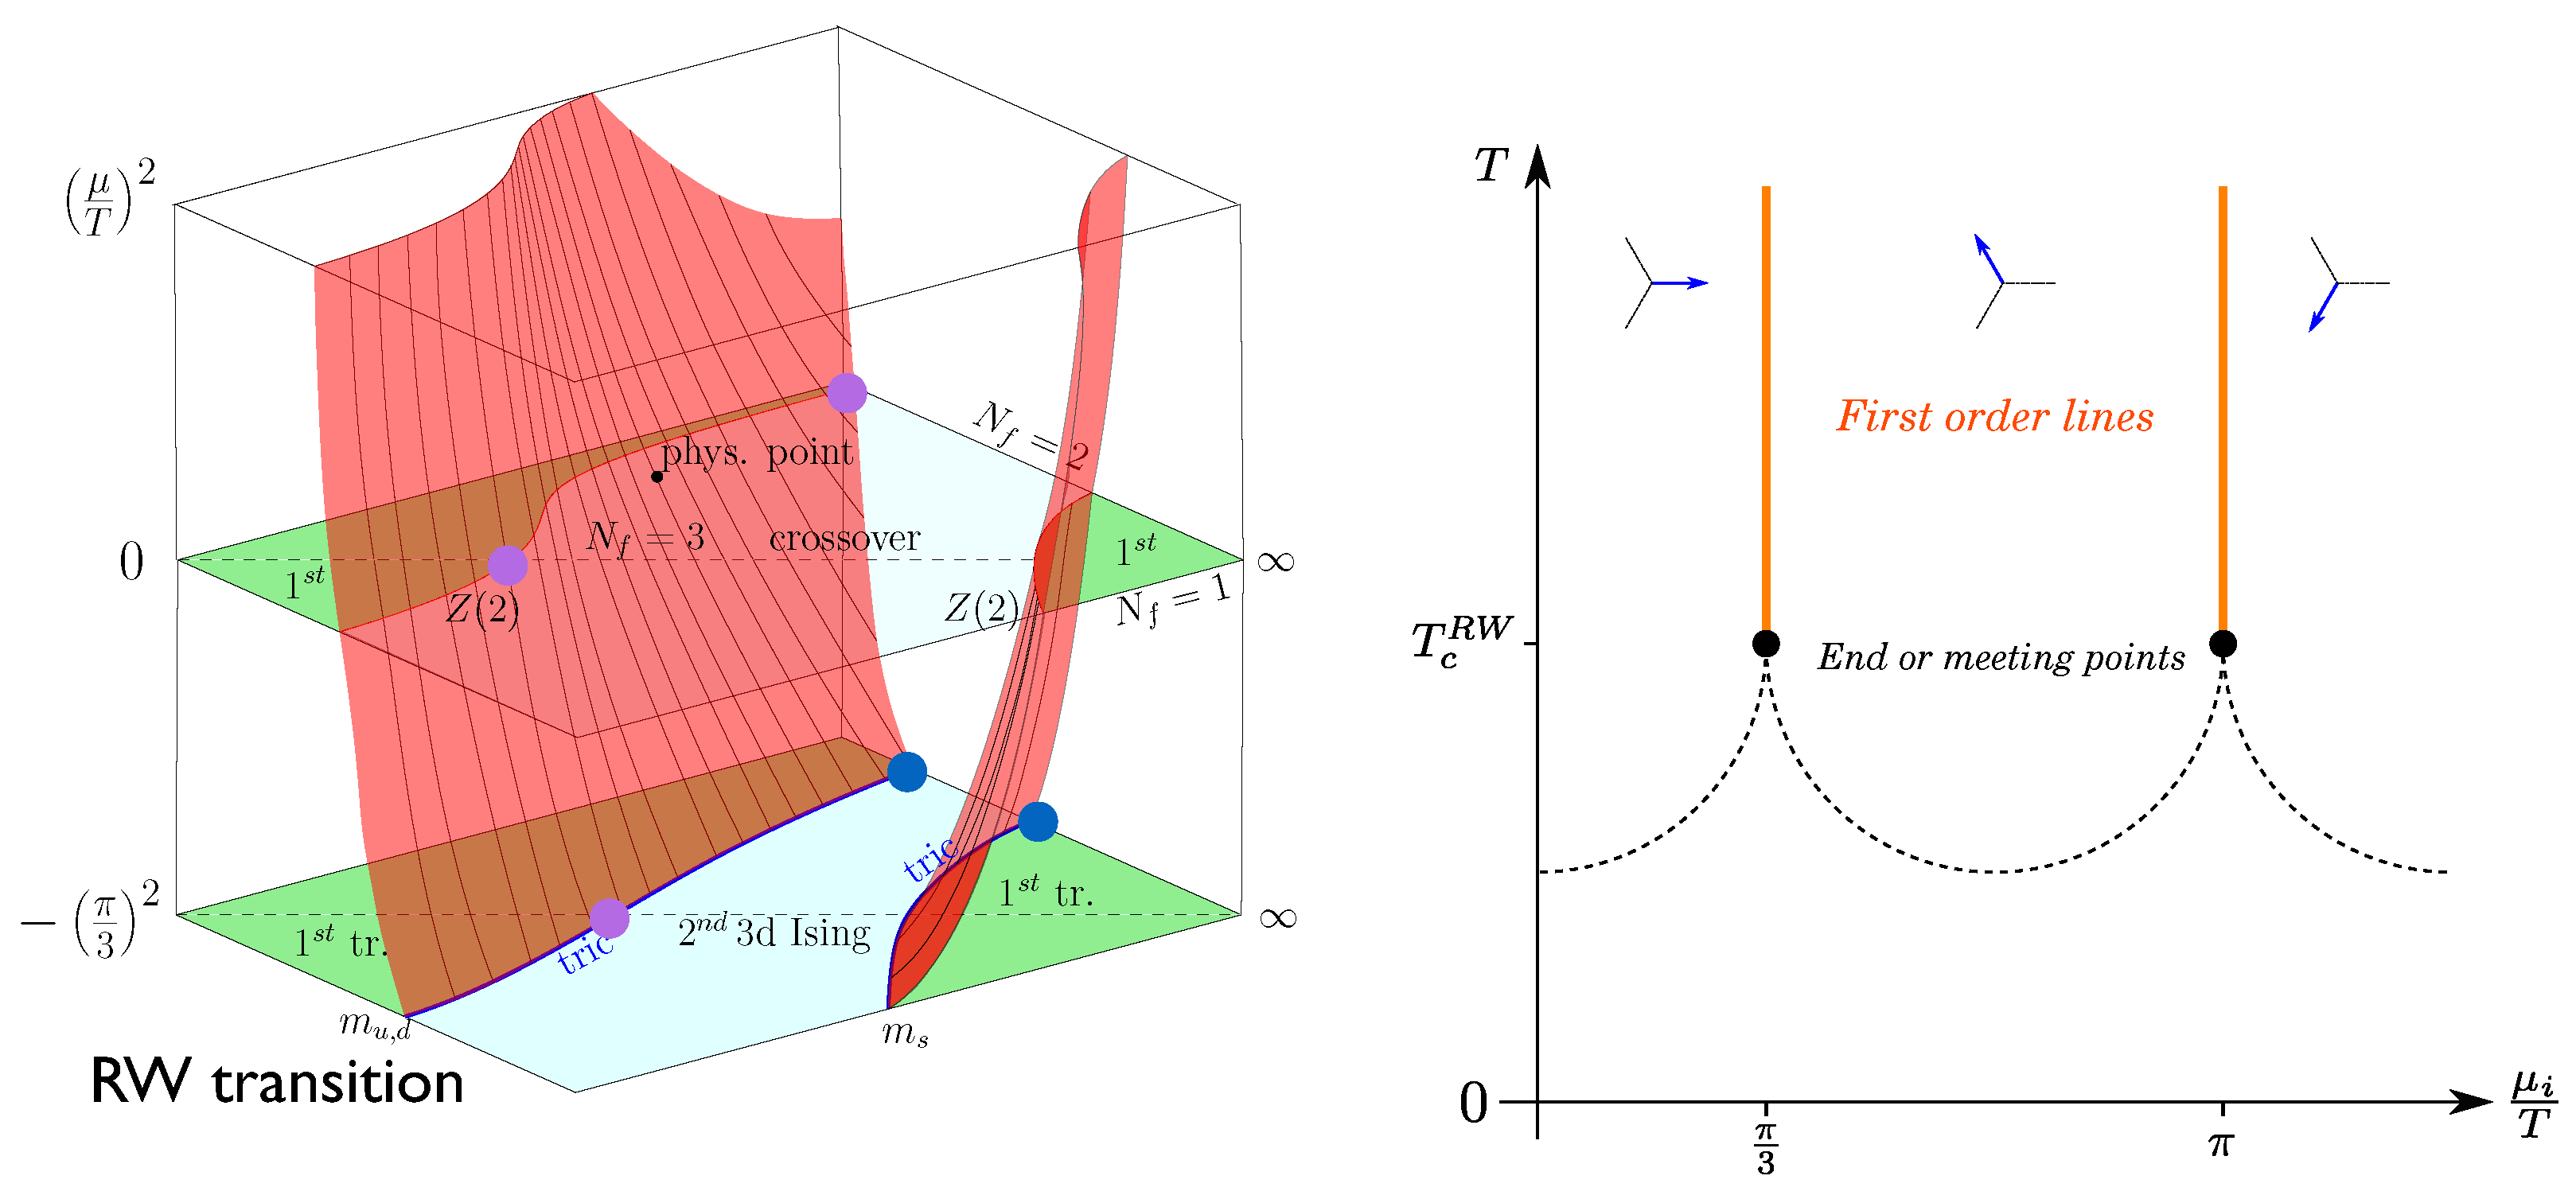
Once a chemical potential for quark (or for baryon) number is switched on, the Columbia plot in the continuum (or at fixed lattice spacing viz. ) gets extended into a third dimension. In this case the -critical boundary lines sweep out critical surfaces, as sketched schematically in Figure 9 (left). Labelling the third axis by , both real and imaginary chemical potential can be discussed. Imaginary chemical potential, with , is unphysical, but it does not induce a sign problem and thus can be simulated without difficulty [62]. This can be exploited to extract various properties of the phase diagram at sufficiently small real by analytic continuation [63,64]. Two exact symmetries are important here. Because of -invariance, the QCD partition function is an even function of the chemical potential . Furthermore, for arbitrary fermion masses it is periodic in imaginary chemical potential because of the global Roberge-Weiss (or center) symmetry [65],
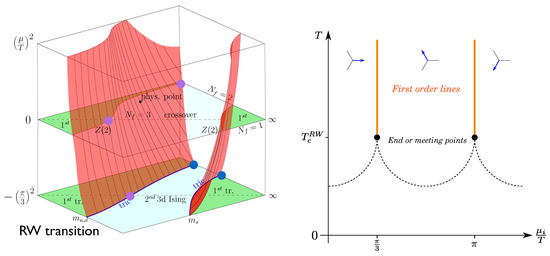
Figure 9.
(Left): Columbia plot with chemical potential as observed on coarse lattices. The bottom plane corresponds to the first center-transition. (Right): The QCD phase diagram at imaginary chemical potential. Vertical lines mark first-order transitions between different center sectors, the dotted lines are the analytic continuation of the thermal transitions at real , whose nature depends on the quark masses.
Thus, as imaginary chemical potential is increased, the partition function periodically cycles through the center sectors, which are distinguishable by the phase of the Polyakov loop, whereas the thermodynamic functions are invariant under a shift between sectors. The boundaries of these sectors, located at with , are marked by first-order transitions for high temperatures and crossover for low temperatures, see Figure 9 (right). Varying T at fixed imaginary chemical potential, the analytic continuation of the QCD thermal transition is crossed, whose order depends on and the quark masses, as discussed in the previous sections. For a first-order chiral or deconfinement transition, the transition lines meet up in a triple point, which marks a three-phase coexistence between two phases of the Polyakov loop and their average. For a thermal crossover the Roberge-Weiss transition ends in a critical endpoint with 3D Ising universality. The boundary between these cases, corresponding to specific quark mass values, is marked by a tricritical point. In the Columbia plot for the first Roberge-Weiss plane at , these trace out tricritical lines, in which the deconfinement critical surface ends in the Roberge-Weiss plane [66]. These structures have been established explicitly for unimproved staggered [66,67] as well as unimproved Wilson [68] fermions and generalise to any discretisation respecting the center symmetry.
4.1. The Deconfinement Transition
Once again it is instructive to also consider the more easily accessible heavy mass corner, and to study how the deconfinement transition changes in the presence of a baryon chemical potential. Moreover, for heavy quarks one can expand the fermion determinant in inverse quark mass and, after an additional resummed strong coupling expansion, an effective lattice theory can be constructed that reproduces the -boundary on lattices at ., but in addition can be solved at finite chemical potential, both imaginary and real [23]. The tricritical line in the Roberge-Weiss plane dictates the deconfinement critical surface to emanate from it by tricritical scaling,
where now the deviation of the chemical potential from the Roberge-Weiss plane is the center symmetry breaking scaling field. This scaling behaviour is confirmed numerically and, even at leading order, found to extend far into the range of real chemical potentials. The region of first-order deconfinement transitions is thus found to continuously shrink with real chemical potential [23,66]. This observation implies that the chiral and deconfinement transition regions remain separated for all chemical potentials, i.e., the respective critical surfaces do not join. The chiral critical surface must then form a closed volume with the boundaries of the quark mass and chemical potential parameter space, since one cannot get from a first-order transition to a crossover without passing through a critical point.
4.2. The Chiral Transition
For unimproved Wilson and staggered discretisations on , the 3D Columbia plot looks as in Figure 9 (left), with the region of chiral phase transitions getting wider in the imaginary direction. Expanding the -critical light mass for small chemical potential for any fixed ,
one may conclude that and by analytic continuation the first order region shrinks in the real- direction. As an independent check on these calculations at imaginary chemical potential, the curvature of the chiral critical surface can be computed directly at . For staggered fermions one finds both at and at , and the next coefficient is negative as well [40,52,69]. Thus the chiral transition strengthens with imaginary and weakens with real chemical potential. This is opposite to a scenario with a chiral critical point close to the temperature axis, which would require the chiral transition at the physical point to strengthen with real . The only investigation finding a positive curvature so far is for -improved Wilson fermions [70]. However, we have seen in the previous sections the enormous cutoff effects on the location of the chiral critical surface at , and the question is how these vary with for a given discretisation. The fact that for the critical surface moves to the chiral limit makes it practically impossible to compute its curvature on fine lattices.
Investigations in the Roberge-Weiss plane on finer lattices reveal the same trend as seen at , namely the chiral tricritical line moving towards smaller quark masses, both for unimproved staggered [71] and Wilson [72] quarks, Figure 10 (left). For stout-smeared staggered [73] and HISQ [74] actions on , even the larger first-order region in the Roberge-Weiss plane cannot be detected when starting from the physical point and reducing the pion masses down to MeV, as Figure 10 (right) shows by demonstrating second-order scaling for the Roberge-Weiss endpoint.

Figure 10.
(Left): Tricritical pseudo-scalar mass values delimiting the first-order chiral region in the RW-plane [71]. (Right): Finite size scaling with 3d exponents for stout-smeared staggered fermions with MeV and on in the RW-plane [73].
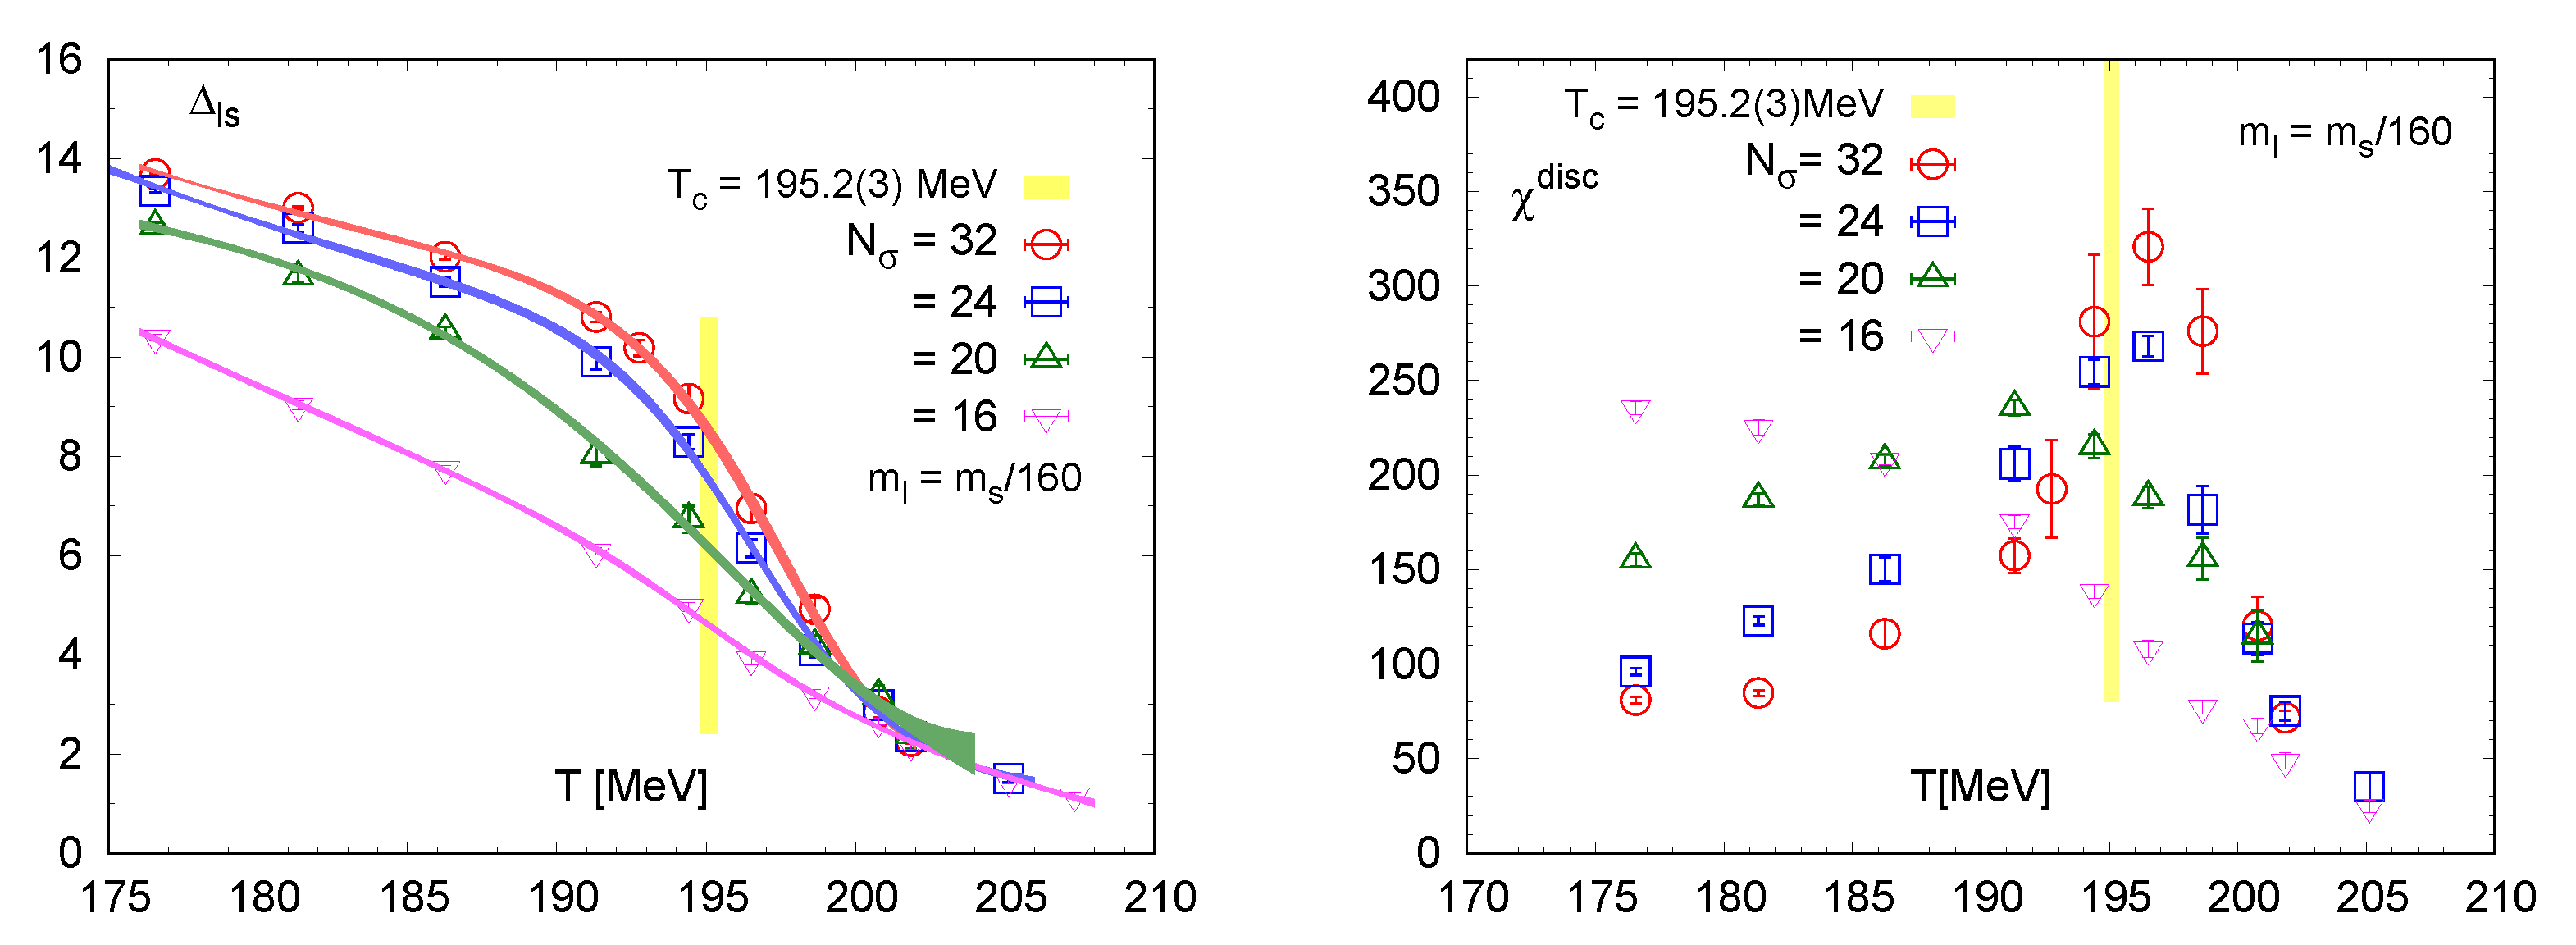
Note that the order parameter for the center sectors is the imaginary part of the Polyakov loop, even in the light quark regime. It is then interesting to study the interplay between the center and chiral dynamics in the Roberge Weiss plane, since they are independent symmetries. In particular, in the chiral limit there must be a true phase transition for any chemical potential, since the latter does not break chiral symmetry. Figure 11 shows the renormalisation group invariant chiral condensate from Equation (7) and the disconnected part of the corresponding susceptibility as functions of temperature, as observed with HISQ fermions on [74]. Indeed, as the quark mass decreases a chiral transition is building up, just as at , and it is particularly interesting where the transition happens. The location of the emerging peak in the susceptibility is, at the current accuracy, consistent with the yellow bar in the figure marking the critical temperature of the Roberge-Weiss endpoint, so that the transition lines in the chiral limit would indeed be connected as in Figure 9 (left). Note that there is no a priori reason for this, since we have independent center and chiral symmetries, with a universality of the Roberge-Weiss endpoint and a larger, -like universality along the chiral transition line. If these lines really do meet in the chiral limit, their junction should be multicritical.
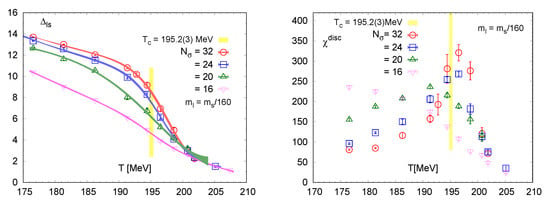
Figure 11.
(Left): Chiral condensate as defined in Equation (7) in the RW plane from HISQ fermions on . (Right): Disconnected chiral susceptibility at fixed quark mass ratio for various lattice sizes. Yellow bands show the location of the RW endpoint transition temperature, extracted from the peak location of . From [74].
In summary, from the and imaginary chemical potential results together we conclude that the entire chiral critical surface is shifting drastically towards the chiral limit as the lattice spacing is decreased, and it is an open question whether any first-order transition remains in the continuum limit at any . At the same time, this implies that the crossover at the physical point for ≲ 1, which is where an analytic continuation of Equation (18) holds (see Section 5.1), is very soft and does not display any singular behaviour due to the chiral transition.
5. QCD at the Physical Point
Having discussed the order of the thermal QCD transition in a generalised parameter space, the aim is to see how this constrains the physical quark mass configuration. The qualitative relation between the phase diagram in the chiral limit of the light quarks and their physical values has been worked out some time ago by mean field methods [75,76], as shown in Figure 12. In the chiral limit, there must be a non-analytic phase transition for any value of the baryon chemical potential, since the latter respects chiral symmetry. We have seen that lattice results are indeed converging towards a second-order transition at . By contrast, the first-order nature of the chiral transition at is based on expectations from NJL, Gross-Neveu and sigma models in mostly mean field investigations, with no firm QCD predictions available yet. If this assumption holds, there must be a tricritical point marking the change between first-order and second-order behaviour, which might even have an influence on physical QCD if the light quark masses happen to be in the scaling window of the tricritical point [77]. At finite quark masses chiral symmetry is broken explicitly, the second-order line turns into crossover and the first-order transition weakens to disappear in a -critical line, which emanates from the tricritical point by tricritical scaling [76],
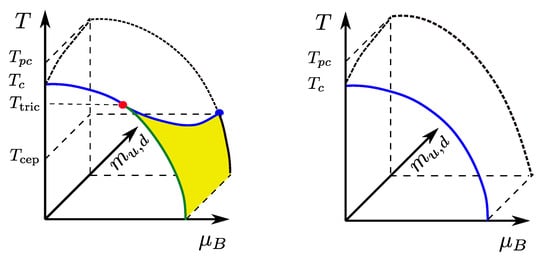
Figure 12.
(Left): Relation of the tentative QCD phase diagram with physical light quark masses (back plane) to the chiral limit (front plane) according to [75,76]. (Right): If the entire chiral transition line in the massless limit is of second order, the transition at the physical point is crossover everywhere.
This implies an ordering of the critical temperatures to be exploited below,
For completeness, we need to also discuss an alternative scenario, where the chiral phase transition in the massless limit is second order all the way to . At least from a lattice perspective, this is not excluded so far, but crucially depends on whether there is any non-trivial -dependence in the continuum limit. Moreover, a recent investigation of the chiral nucleon-meson and chiral quark-meson models finds the phase transition for at to turn second order, once fluctuations are included [78]. In such a scenario there is no tricritical point and no first-order transition anywhere. Instead, non-vanishing quark masses remove the entire second-order line and the chiral transition would be analytic crossover exclusively for physical quark masses.
5.1. The Crossover at Small Baryon Densities
There are several methods that have been used so far to extract information about the phase structure at the physical point for small baryon density. All of them introduce some approximation which can be controlled as long as ≲ 1: (i) Reweighting [79], (ii) Taylor expansion in [80] and (iii) analytic continuation fromimaginary chemical potential [63,64]. When the QCD pressure is expressed as a series in baryon chemical potential,
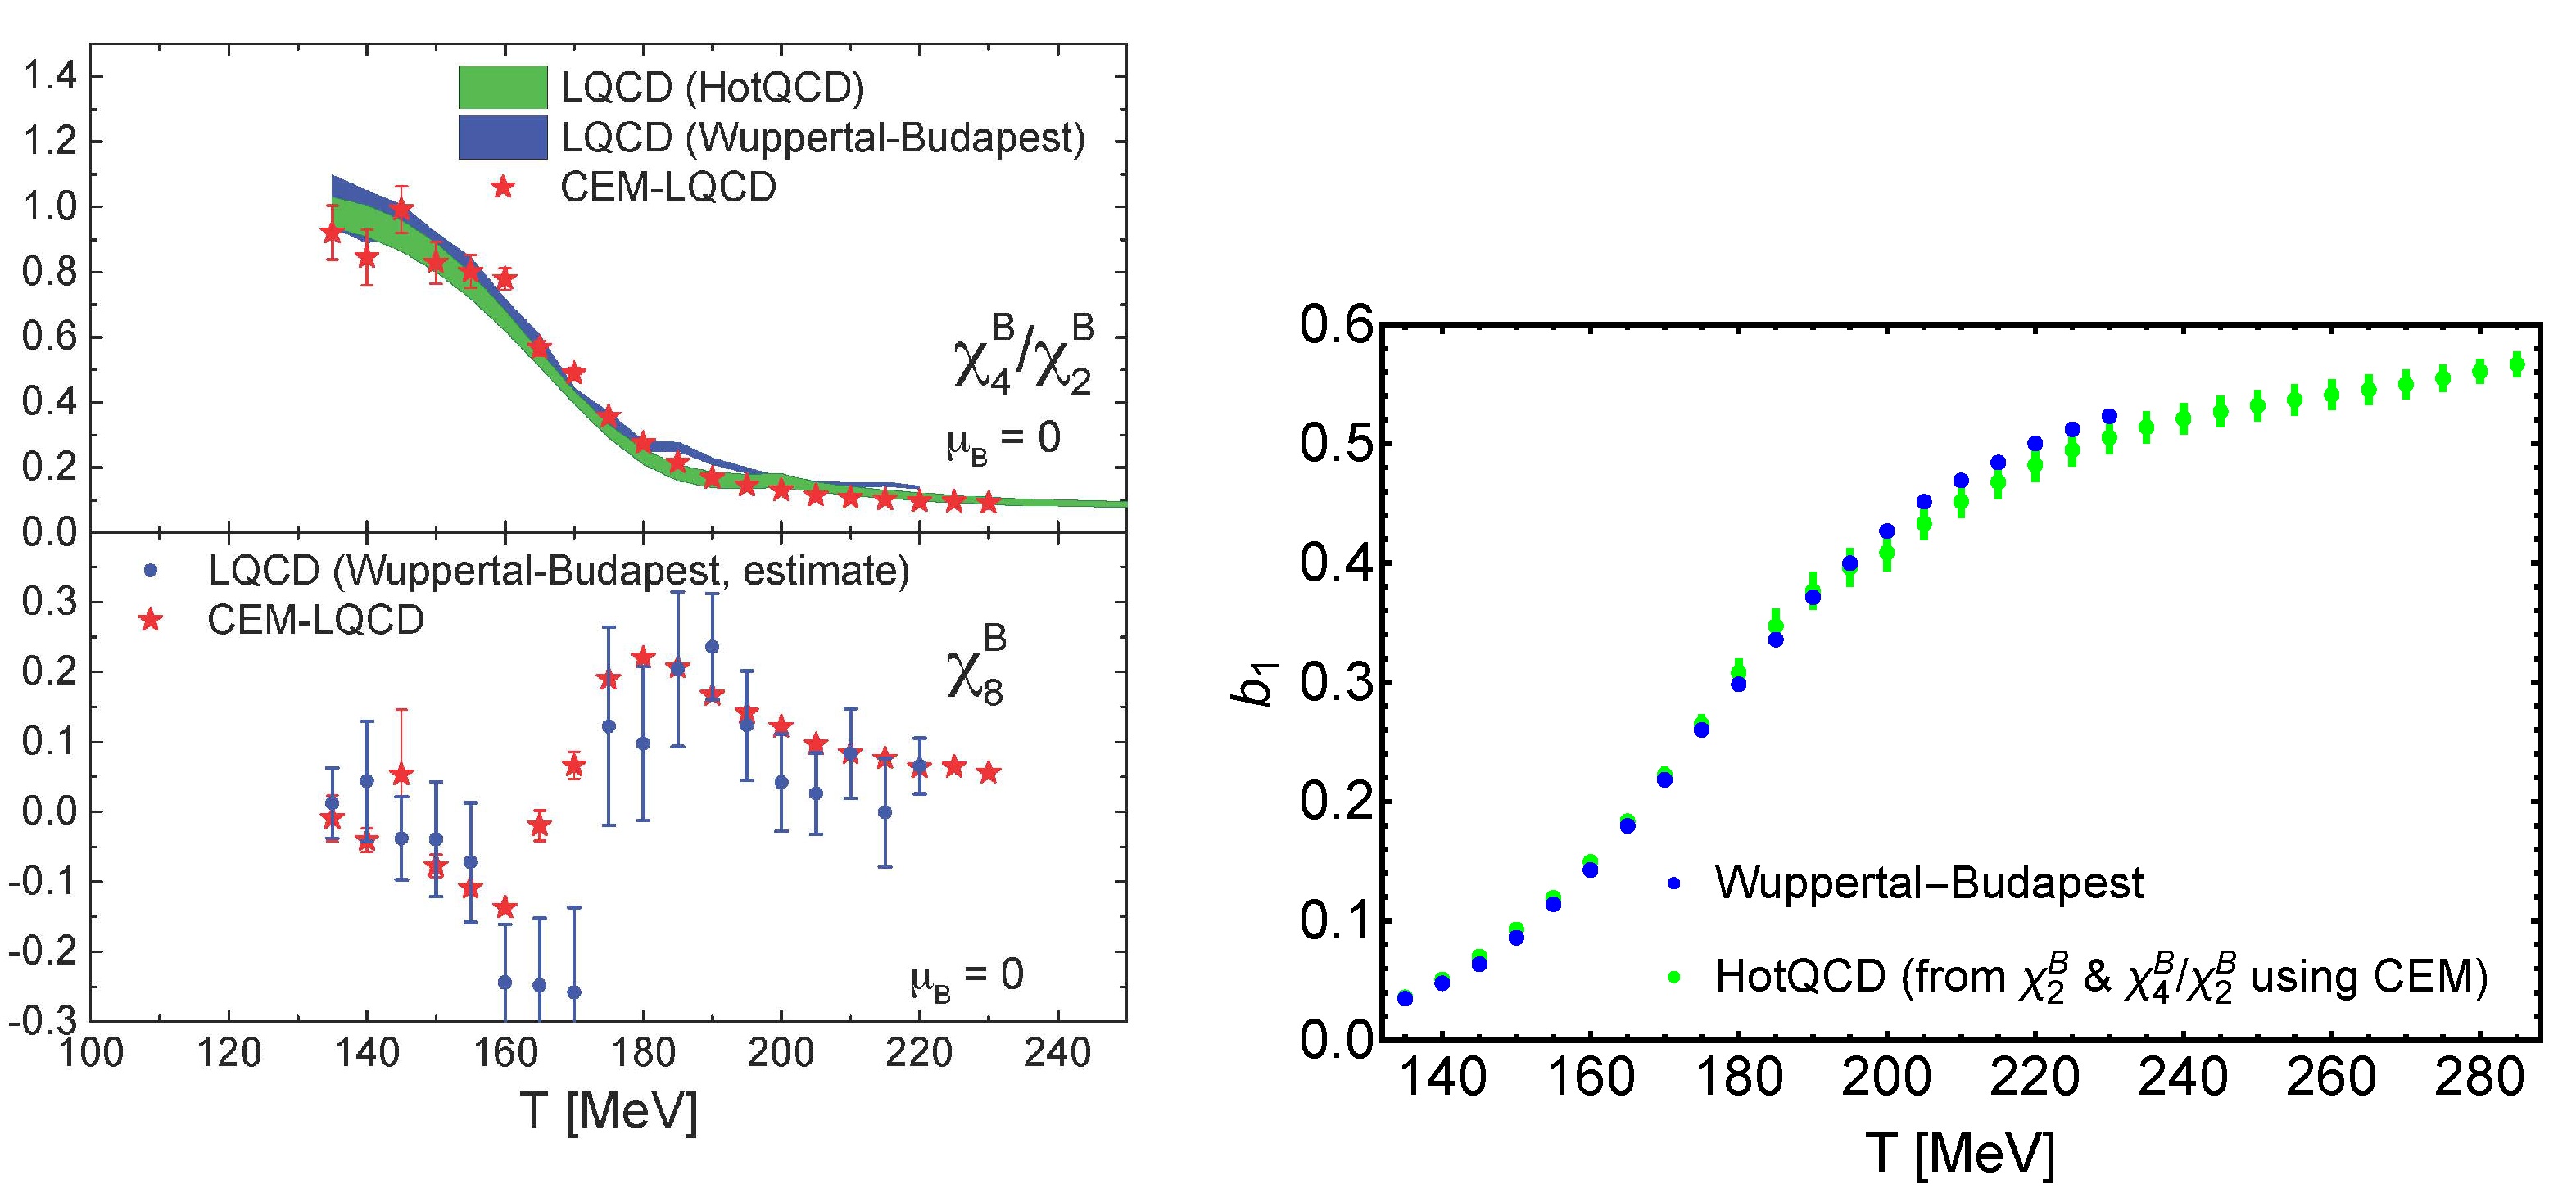
the Taylor coefficients are the baryon number fluctuations evaluated at zero density, which can also be computed by fitting to untruncated results at imaginary . This permits full control of the systematics between (ii) and (iii). These coefficients are presently known up to on lattices, Figure 13 (left), and in principle also observable experimentally. For a review of the equation of state relating to heavy ion phenomenology, see [81,82]. Note also, that this low density regime appears to be accessible by complex Langevin simulations without recourse to series expansions, albeit not yet for physical quark masses [83]. This offers an additional cross check between different methods.
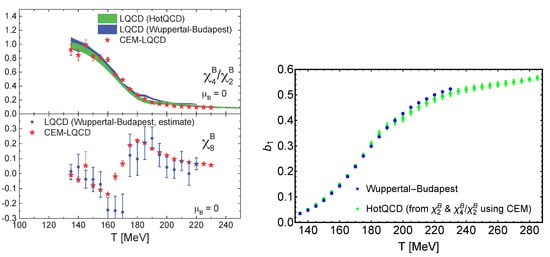
Figure 13.
(Left): Baryon number fluctuations from the lattice in comparison with the CEM model. (Right): computed directly from Equation (25) by the WB collaboration, and reverse engineered using CEM from HotQCD baryon number fluctuations. From [84].
An important quantity is the pseudo-critical temperature marking the “phase boundary” between the chirally broken and restored regimes. Since the chiral transition at the physical point corresponds to an analytic crossover with a non-zero order parameter everywhere, there are no truly distinct “phases” and no unambiguous definition of a transition temperature exists. In general, definitions based on different observables will give different pseudo-critical temperatures, even in the thermodynamic limit, contrary to the unique locations of singularities for true phase transitions. While this is an issue when comparing with an experimental situation, for theoretical investigations it is convenient to stick to the observables representing the true order parameter in the appropriate limit, i.e., the susceptibility of an appropriately normalised chiral condensate in this case. Following as an implicitly defined function from the partition function, the pseudo-critical temperature can be similarly expressed as a power series in chemical potential,
with MeV [85]. Continuum extrapolated results for the leading coefficient are collected in Table 2, the sub-leading coefficient is compatible with zero at the current accuracy. This is a remarkable result telling us that up to ≲ 3T the dependence of thermodynamic quantities on chemical potential is rather weak and can be accurately described by a truncated leading-order Taylor series in chemical potential.

Table 2.
Summary of continuum-extrapolated values for in Equation (22).
We now have the necessary information to obtain a conservative bound on the location of a possible critical point, which according to Figure 12 sits on the pseudo-critical line of a strengthening crossover. Using the central value from Equation (10) for the chiral critical temperature and imposing the model-independent ordering MeV, the chemical potential of a critical point must satisfy
5.2. The Search for a Critical Point
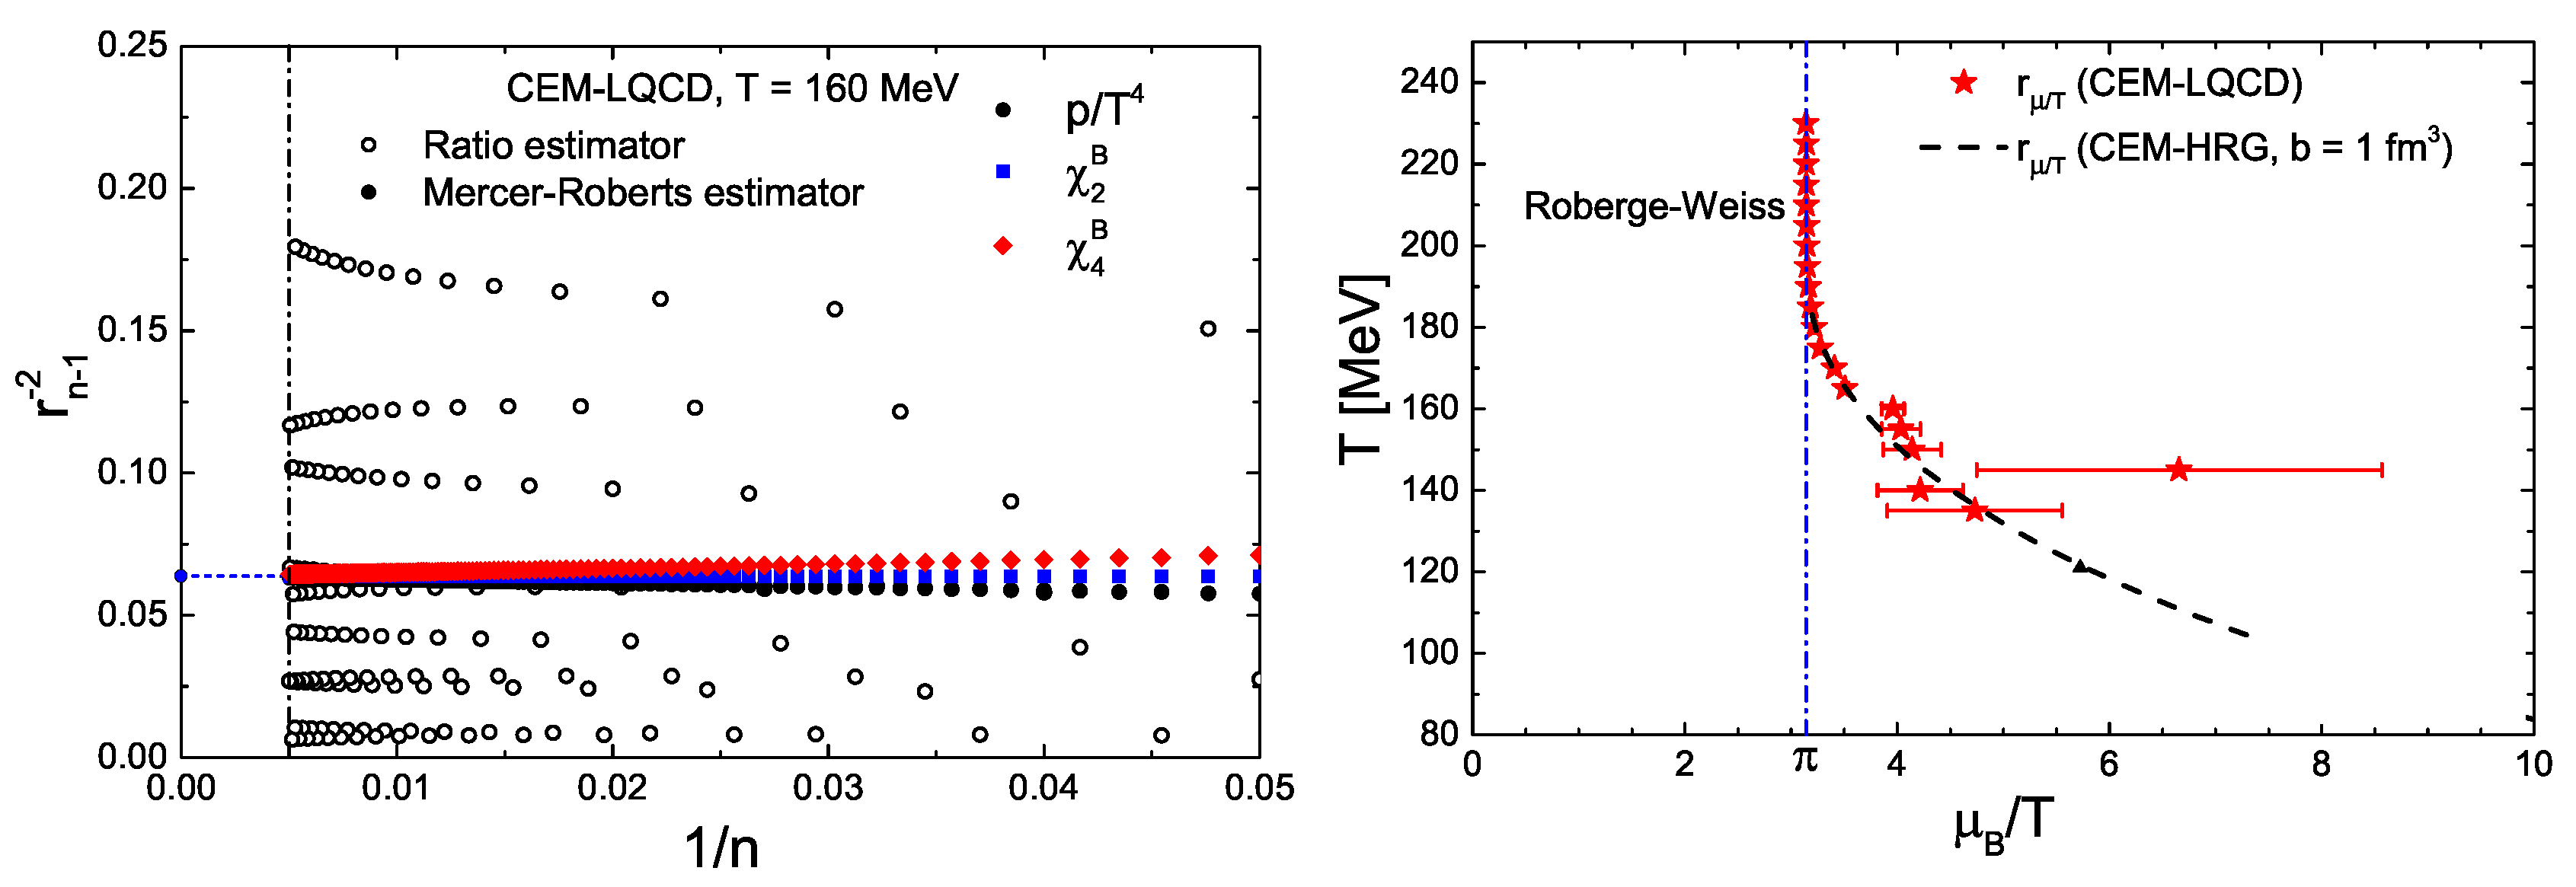
For any power series of a function with a given domain of analyticity in its complex argument, the radius of convergence gives the distance between the expansion point and the nearest singularity. This implies that the location of a non-analytic QCD phase transition constitutes an upper bound on the radius of convergence of the series Equation (21), or that of any other thermodynamic function. Turning this around one may search for a critical point: If a finite radius of convergence can be extracted from the pressure series for real parameter values, it should signal a phase transition. The simplest estimator is the ratio test of consecutive coefficients, whose extrapolation yields the radius of convergence,
In practice, however, only the first few coefficients are available and an extrapolation is not feasible. For a compilation of available results, see [89]. Moreover, the ratio estimator is inappropriate for series with irregular signs and complex singularities, where it fails to converge.
This can be illustrated by modelling the lattice data in a spirit similar to the hadron resonance gas descriptions, such that higher coefficients become available and different scenarios can be tested for compatibility with the data. As an example, consider the fugacity expansion of baryon number density. At imaginary chemical potential, this is a Fourier series whose coefficients can be computed on the lattice without sign problem,
In [90] a cluster expansion model (CEM) was proposed, which takes the first two coefficients as input from a lattice calculation [91], and expresses all higher coefficients in terms of these,
The are T-independent and fixed to reproduce the Stefan-Boltzmann limit. This recursion implies that only two-body interactions are included, and corresponds to a truncated virial expansion which is valid for sufficiently dilute systems. The model now predicts all coefficients and allows for an all-order closed expression,
All existing lattice data in the crossover regime are reproduced with excellent accuracy, as the examples in Figure 13 (left) show. Moreover, Figure 13 (right) compares the coefficient computed directly from its defining equation, Equation (26), with a calculation from a combination of , by inverting the CEM. Note that all orders of the fugacity expansion enter this calculation. The remarkable quantitative agreement is only possible, if both lattice calculations (using different actions) give equivalent results and all coefficients of the CEM are sufficiently close to the true QCD values.
With all coefficients of the fugacity expansion available, one can study the radius of convergence of CEM, Figure 14. The ratio estimator fails to converge, because of the irregular signs of higher order coefficients (it works for equal or alternating signs). On the other hand, the Mercer-Roberts estimator,
converges and extrapolates to a unique radius of convergence, even for coefficients pertaining to different observables, as must be the case for a true singularity. A number of improved estimators with faster convergence properties has been proposed in [92].
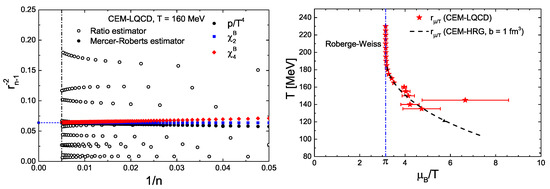
Figure 14.
(Left): Comparison of estimators for the radius of convergence in CEM. (Right): The resulting radius of convergence as a function of T predicts the RW-transition at imaginary . From [90].
The red points in Figure 14 (right) show the resulting radius of convergence of the CEM for different temperatures. At high temperatures a singularity is predicted at a distance and , which is quantitatively compatible with the first-order Roberge-Weiss transition in the imaginary direction. At lower temperatures there is no Roberge-Weiss transition and the radius of convergence quickly grows. This is an intriguing result, given that no information from imaginary chemical potential has been used as input. It shows that the general approach to detect a non-analytic phase transition is viable, provided that a good estimator for the radius of convergence is used and that sufficiently many coefficients are available (more than 100 in this case!). The correct identification of the Roberge-Weiss transition by the radius of convergence conversely implies that the CEM of lattice QCD does not have another phase transition closer to the origin, i.e., a possible critical endpoint in the real direction must satisfy
This is fully consistent with Equation (23) but derived by completely different methods.
Of course, modelling higher coefficients in terms of lower ones is not unique. The simplest alternative is a description of the baryon number fluctuations up to by a polynomial model, equally without singularity [93]. Another one is provided by a rational function model, which can account for singularities and can be applied both to QCD or to a chiral model with a phase transition [94]. Equations of state compatible with lattice data and including an Ising critical point in predefined locations have also been constructed [95]. While the properties of models are not those of QCD, these analyses altogether do show that there is no sign of criticality in the real direction from the presently available, continuum extrapolated lattice data at zero or imaginary chemical potential, but at best in their higher order completions. It will thus be interesting to test higher order coefficients without modelling by Padé approximants or conformal maps as demonstrated in a Gross-Neveu model [96], or by resummation schemes in [97].
Having to go term by term in an expansion can be avoided, if the radius of convergence is instead determined by the Lee-Yang zero [10,11] closest to the origin. Using reweighting to real chemical potential, this was the strategy employed in the first lattice prediction of a critical point on lattices using unimproved rooted staggered fermions [98]. However, it is now understood that the closest Lee-Yang zero was caused by a spectral gap between the unrooted taste quartets of the zeros, after Taylor expanding the reweighting factor, rather than by a phase transition [99]. This is related to the general problem of staggered taste quartets splitting up when they cross a branch cut of a rooted determinant [100]. It has then been proposed to redefine the rooted staggered determinant by a geometric matching procedure averaging over the quartets, after which it can be represented as an ordinary polynomial [99]. A further development [101] concerns the reweighting procedure, which usually is based on sampling with the phase quenched determinant and reweighting in the phase factor. This has a well-known overlap problem between the sampled and reweighted ensembles. To get rid of this, one may neglect the imaginary part of the determinant in the partition function altogether, which is allowed since it will average to zero. One can then sample with the real part of the fermion determinant and reweight in the sign only, which has no overlap problem. Of course, the sign problem remains and one is still faced with a challenging signal to noise ratio.
Application of these new methods using the stout-smeared action on coarse lattices appears to signal a Lee-Yang zero at [101], which however is is still far from the continuum. Simulation results on for the renormalised chiral condensate,
are shown in Figure 15, both for real and imaginary chemical potential [102]. In the left plot, there is no steepening or narrowing of the chiral crossover yet as the real chemical potential is increased. In the right plot the chemical potential is varied for fixed temperature MeV. One observes full compatibility of the reweighted real simulations with the analytic continuation from imaginary simulations, but with smaller errors. In this case, also, there is no sign of a non-analyticity, which is again consistent with the results from other methods.

Figure 15.
Renormalised chiral condensate from simulations with stout-smeared staggered fermions at imaginary (blue) and real (black) chemical potential. (Left): Temperature scan at various chemical potentials. (Right): scan at at MeV. Coloured bands result from analytic continuation of imaginary chemical potential data. From [102].
6. Conclusions
Even though the sign problem of lattice QCD remains unsolved, there has been considerable progress over the last few years towards phenomenologically relevant constraints on the QCD phase diagram. This is due to a number of complementary paths of investigation, each of them refining their methods and having finer lattices as well as different lattice actions at their disposal.
In the Columbia plot at , the region of first-order deconfinement transitions in the heavy mass corner can be directly simulated, and its -critical boundary for , while not yet continuum extrapolated, is expected to settle in a region around GeV. The region of first-order chiral phase transitions seen in various lattice discretisations has been observed to shrink continuously with decreasing lattice spacing. There is numerical evidence for several that their -critical boundary extrapolates to the chiral limit at finite lattice spacing, exhibiting tricritical scaling. Such first-order regions are not connected to the continuum and represent lattice artefacts. If this is confirmed by further studies, the Columbia plot will look like in Figure 8.
In another recent development, the critical temperature for the chiral transition in the massless limit has been determined to be in the range MeV, which is significantly lower than the pseudo-critical temperature at the physical point. According to the expected relationship between the massless limit and the physical quark masses, this bounds a possible critical endpoint at finite baryon density to be at ≳ 3T. An estimate of the radius of convergence, based on a cluster expansion model consistent with all available zero density baryon number fluctuations for physical QCD, is fully consistent with this. Novel techniques to extract the leading Lee-Yang zero of the partition function, either with improved reweighting methods or by refined series analyses, should be able to provide additional, independent estimates of the proximity of a phase transition to the physical point in the near future.
Funding
Parts of the work reported here were funded by the Deutsche Forschungsgemeinschaft (German Research Foundation), grant number 315477589-TRR 211 (Strong-interaction matter under extreme conditions).
Conflicts of Interest
The author declares no conflict of interest.
References
- Gasser, J.; Leutwyler, H. Chiral Perturbation Theory to One Loop. Ann. Phys. 1984, 158, 142. [Google Scholar] [CrossRef]
- Leutwyler, H. Principles of chiral perturbation theory. arXiv 1994, arXiv:hep-ph/9406283. [Google Scholar]
- Gattringer, C.; Lang, C.B. Quantum Chromodynamics on the Lattice; Springer: Berlin/Heidelberg, Germany, 2010; Volume 788. [Google Scholar] [CrossRef]
- Philipsen, O. Lattice QCD at non-zero temperature and baryon density. In Les Houches Summer School: Session 93: Modern Perspectives in Lattice QCD: Quantum Field Theory and High Performance Computing; Oxford Univesity Press: Oxford, UK, 2010; pp. 273–330. [Google Scholar]
- Aarts, G. Introductory lectures on lattice QCD at nonzero baryon number. J. Phys. Conf. Ser. 2016, 706, 022004. [Google Scholar] [CrossRef]
- Montvay, I.; Munster, G. Quantum Fields on a Lattice; Cambridge Monographs on Mathematical Physics; Cambridge University Press: Cambridge, UK, 1997. [Google Scholar] [CrossRef]
- DeGrand, T.; Detar, C.E. Lattice Methods for Quantum Chromodynamics; World Scientific: Singapore, 2006. [Google Scholar]
- Symanzik, K. Continuum Limit and Improved Action in Lattice Theories. 1. Principles and phi**4 Theory. Nucl. Phys. B 1983, 226, 187–204. [Google Scholar] [CrossRef]
- Nielsen, H.B.; Ninomiya, M. No Go Theorem for Regularizing Chiral Fermions. Phys. Lett. B 1981, 105, 219–223. [Google Scholar] [CrossRef]
- Yang, C.N.; Lee, T.D. Statistical theory of equations of state and phase transitions. 1. Theory of condensation. Phys. Rev. 1952, 87, 404–409. [Google Scholar] [CrossRef]
- Lee, T.D.; Yang, C.N. Statistical theory of equations of state and phase transitions. 2. Lattice gas and Ising model. Phys. Rev. 1952, 87, 410–419. [Google Scholar] [CrossRef]
- de Forcrand, P. Simulating QCD at finite density. PoS 2009, LAT2009, 010. [Google Scholar] [CrossRef]
- Aoki, Y.; Endrodi, G.; Fodor, Z.; Katz, S.D.; Szabo, K.K. The Order of the quantum chromodynamics transition predicted by the standard model of particle physics. Nature 2006, 443, 675–678. [Google Scholar] [CrossRef]
- Brown, F.R.; Butler, F.P.; Chen, H.; Christ, N.H.; Dong, Z.H.; Schaffer, W.; Unger, L.I.; Vaccarino, A. On the existence of a phase transition for QCD with three light quarks. Phys. Rev. Lett. 1990, 65, 2491–2494. [Google Scholar] [CrossRef]
- McLerran, L.D.; Svetitsky, B. Quark Liberation at High Temperature: A Monte Carlo Study of SU(2) Gauge Theory. Phys. Rev. D 1981, 24, 450. [Google Scholar] [CrossRef]
- Boyd, G.; Engels, J.; Karsch, F.; Laermann, E.; Legeland, C.; Lutgemeier, M.; Petersson, B. Thermodynamics of SU(3) lattice gauge theory. Nucl. Phys. B 1996, 469, 419–444. [Google Scholar] [CrossRef]
- Shirogane, M.; Ejiri, S.; Iwami, R.; Kanaya, K.; Kitazawa, M. Latent heat at the first order phase transition point of SU(3) gauge theory. Phys. Rev. D 2016, 94, 014506. [Google Scholar] [CrossRef]
- Saito, H.; Ejiri, S.; Aoki, S.; Hatsuda, T.; Kanaya, K.; Maezawa, Y.; Ohno, H.; Umeda, T. Phase structure of finite temperature QCD in the heavy quark region. Phys. Rev. D 2011, 84, 054502. [Google Scholar] [CrossRef]
- Ejiri, S.; Itagaki, S.; Iwami, R.; Kanaya, K.; Kitazawa, M.; Kiyohara, A.; Shirogane, M.; Umeda, T. End point of the first-order phase transition of QCD in the heavy quark region by reweighting from quenched QCD. Phys. Rev. D 2020, 101, 054505. [Google Scholar] [CrossRef]
- Cuteri, F.; Philipsen, O.; Schön, A.; Sciarra, A. Deconfinement critical point of lattice QCD with Nf=2 Wilson fermions. Phys. Rev. D 2021, 103, 014513. [Google Scholar] [CrossRef]
- Kiyohara, A.; Kitazawa, M.; Ejiri, S.; Kanaya, K. Finite-size scaling around the critical point in the heavy quark region of QCD. arXiv 2021, arXiv:2108.00118. [Google Scholar]
- Fischer, C.S.; Luecker, J.; Pawlowski, J.M. Phase structure of QCD for heavy quarks. Phys. Rev. D 2015, 91, 014024. [Google Scholar] [CrossRef]
- Fromm, M.; Langelage, J.; Lottini, S.; Philipsen, O. The QCD deconfinement transition for heavy quarks and all baryon chemical potentials. J. High Energy Phys. 2012, 2012, 42. [Google Scholar] [CrossRef]
- Fromm, M.; Langelage, J.; Lottini, S.; Neuman, M.; Philipsen, O. Onset Transition to Cold Nuclear Matter from Lattice QCD with Heavy Quarks. Phys. Rev. Lett. 2013, 110, 122001. [Google Scholar] [CrossRef]
- Pisarski, R.D.; Wilczek, F. Remarks on the Chiral Phase Transition in Chromodynamics. Phys. Rev. 1984, D29, 338–341. [Google Scholar] [CrossRef]
- Gausterer, H.; Sanielevici, S. Can the Chiral Transition in QCD Be Described by a Linear σ Model in Three-dimensions? Phys. Lett. B 1988, 209, 533–537. [Google Scholar] [CrossRef]
- Butti, A.; Pelissetto, A.; Vicari, E. On the nature of the finite temperature transition in QCD. J. High Energy Phys. 2003, 2003, 029. [Google Scholar] [CrossRef]
- Pelissetto, A.; Vicari, E. Relevance of the axial anomaly at the finite-temperature chiral transition in QCD. Phys. Rev. D 2013, 88, 105018. [Google Scholar] [CrossRef]
- Braun, J.; Fu, W.j.; Pawlowski, J.M.; Rennecke, F.; Rosenblüh, D.; Yin, S. Chiral susceptibility in (2+1)-flavor QCD. Phys. Rev. D 2020, 102, 056010. [Google Scholar] [CrossRef]
- Braun, J.; Leonhardt, M.; Pawlowski, J.M.; Rosenblüh, D. Chiral and effective U(1)A symmetry restoration in QCD. arXiv 2020, arXiv:2012.06231. [Google Scholar]
- Iwasaki, Y.; Kanaya, K.; Kaya, S.; Sakai, S.; Yoshie, T. Finite temperature transitions in lattice QCD with Wilson quarks: Chiral transitions and the influence of the strange quark. Phys. Rev. D 1996, 54, 7010–7031. [Google Scholar] [CrossRef] [PubMed]
- Bonati, C.; de Forcrand, P.; D’Elia, M.; Philipsen, O.; Sanfilippo, F. Chiral phase transition in two-flavor QCD from an imaginary chemical potential. Phys. Rev. 2014, D90, 074030. [Google Scholar] [CrossRef]
- Cuteri, F.; Philipsen, O.; Sciarra, A. QCD chiral phase transition from noninteger numbers of flavors. Phys. Rev. D 2018, 97, 114511. [Google Scholar] [CrossRef]
- Philipsen, O.; Pinke, C. The Nf=2 QCD chiral phase transition with Wilson fermions at zero and imaginary chemical potential. Phys. Rev. 2016, D93, 114507. [Google Scholar] [CrossRef]
- Ding, H.-T.; Hegde, P.; Kaczmarek, O.; Karsch, F.; Lahiri, A.; Li, S.-T.; Mukherjee, S.; Ohno, H.; Petreczky, P.; Schmidt, C.; et al. Chiral Phase Transition Temperature in (2+1)-Flavor QCD. Phys. Rev. Lett. 2019, 123, 062002. [Google Scholar] [CrossRef] [PubMed]
- Kaczmarek, O.; Karsch, F.; Lahiri, A.; Schmidt, C. Universal scaling properties of QCD close to the chiral limit. arXiv 2020, arXiv:2010.15593. [Google Scholar]
- Kotov, A.Y.; Lombardo, M.P.; Trunin, A. QCD transition at the physical point, and its scaling window from twisted mass Wilson fermions. arXiv 2021, arXiv:2105.09842. [Google Scholar]
- Nakamura, Y.; Kuramashi, Y.; Ohno, H.; Takeda, S. Critical endpoint in the continuum limit and critical endline at NT=6 of the finite temperature phase transition of QCD with clover fermions. PoS 2019, LATTICE2019, 053. [Google Scholar] [CrossRef]
- Clarke, D.A.; Kaczmarek, O.; Karsch, F.; Lahiri, A.; Sarkar, M. Sensitivity of the Polyakov loop and related observables to chiral symmetry restoration. Phys. Rev. D 2021, 103, L011501. [Google Scholar] [CrossRef]
- de Forcrand, P.; Kim, S.; Philipsen, O. A QCD chiral critical point at small chemical potential: Is it there or not? PoS 2007, LAT2007, 178. [Google Scholar]
- Varnhorst, L. The Nf=3 critical endpoint with smeared staggered quarks. PoS 2015, LATTICE2014, 193. [Google Scholar] [CrossRef]
- Karsch, F.; Laermann, E.; Schmidt, C. The Chiral critical point in three-flavor QCD. Phys. Lett. 2001, B520, 41–49. [Google Scholar] [CrossRef]
- Karsch, F.; Allton, C.R.; Ejiri, S.; Hands, S.J.; Kaczmarek, O.; Laermann, E.; Schmidt, C. Where is the chiral critical point in three flavor QCD? Nucl. Phys. B Proc. Suppl. 2004, 129, 614–616. [Google Scholar] [CrossRef]
- Bazavov, A.; Ding, H.T.; Hegde, P.; Karsch, F.; Laermann, E.; Mukherjee, S.; Petreczky, P.; Schmidt, C. Chiral phase structure of three flavor QCD at vanishing baryon number density. Phys. Rev. D 2017, 95, 074505. [Google Scholar] [CrossRef]
- Jin, X.Y.; Kuramashi, Y.; Nakamura, Y.; Takeda, S.; Ukawa, A. Critical endpoint of the finite temperature phase transition for three flavor QCD. Phys. Rev. D 2015, 91, 014508. [Google Scholar] [CrossRef]
- Jin, X.Y.; Kuramashi, Y.; Nakamura, Y.; Takeda, S.; Ukawa, A. Critical point phase transition for finite temperature 3-flavor QCD with non-perturbatively O(a) improved Wilson fermions at Nt = 10. Phys. Rev. 2017, D96, 034523. [Google Scholar] [CrossRef]
- Kuramashi, Y.; Nakamura, Y.; Ohno, H.; Takeda, S. Nature of the phase transition for finite temperature Nf = 3 QCD with nonperturbatively O(a) improved Wilson fermions at Nt = 12. Phys. Rev. D 2020, 101, 054509. [Google Scholar] [CrossRef]
- de Forcrand, P.; D’Elia, M. Continuum limit and universality of the Columbia plot. PoS 2017, LATTICE2016, 081. [Google Scholar]
- Ohno, H.; Kuramashi, Y.; Nakamura, Y.; Takeda, S. Continuum extrapolation of the critical endpoint in 4-flavor QCD with Wilson-Clover fermions. PoS 2018, LATTICE2018, 174. [Google Scholar] [CrossRef][Green Version]
- Rajagopal, K. The Chiral phase transition in QCD: Critical phenomena and long wavelength pion oscillations. World Sci. 1995. [Google Scholar] [CrossRef]
- Lawrie, I.; Sarbach, S. Theory of tricritical points. In Phase Transitions and Critical Phenomena; Domb, C., Lebowitz, J., Eds.; Academic Press: Cambridge, MA, USA, 1984; Volume 9, p. 1. [Google Scholar]
- de Forcrand, P.; Philipsen, O. The Chiral critical line of N(f) = 2+1 QCD at zero and non-zero baryon density. J. High Energy Phys. 2007, 0701, 077. [Google Scholar] [CrossRef]
- Cuteri, F.; Philipsen, O.; Sciarra, A. On the order of the QCD chiral phase transition for different numbers of quark flavours. arXiv 2021, arXiv:2107.12739. [Google Scholar]
- Aoki, S. New Phase Structure for Lattice QCD with Wilson Fermions. Phys. Rev. D 1984, 30, 2653. [Google Scholar] [CrossRef]
- Aoki, S. A Solution to the U(1) Problem on a Lattice. Phys. Rev. Lett. 1986, 57, 3136. [Google Scholar] [CrossRef]
- Sharpe, S.R.; Singleton, R.L., Jr. Spontaneous flavor and parity breaking with Wilson fermions. Phys. Rev. D 1998, 58, 074501. [Google Scholar] [CrossRef]
- Farchioni, F.; Frezzotti, R.; Jansen, K.; Montvay, I.; Rossi, G.C.; Scholz, E.; Shindler, A.; Ukita, N.; Urbach, C.; Wetzorke, I. Twisted mass quarks and the phase structure of lattice QCD. Eur. Phys. J. C 2005, 39, 421–433. [Google Scholar] [CrossRef][Green Version]
- Burger, F.; Ilgenfritz, E.M.; Kirchner, M.; Lombardo, M.P.; Müller-Preussker, M.; Philipsen, O.; Urbach, C.; Zeidlewicz, L. Thermal QCD transition with two flavors of twisted mass fermions. Phys. Rev. 2013, D87, 074508. [Google Scholar] [CrossRef]
- Khan, A.A.; Aoki, S.; Burkhalter, R.; Ejiri, S.; Fukugita, M.; Hashimoto, S.; Ishizuka, N.; Iwasaki, Y.; Kanaya, K.; Kaneko, T.; et al. Phase structure and critical temperature of two flavor QCD with renormalization group improved gauge action and clover improved Wilson quark action. Phys. Rev. D 2000, 63, 034502. [Google Scholar] [CrossRef]
- Tetradis, N.; Litim, D.F. Analytical solutions of exact renormalization group equations. Nucl. Phys. B 1996, 464, 492–511. [Google Scholar] [CrossRef]
- Del Debbio, L.; Keegan, L. RG flows in 3D scalar field theory. PoS 2011, LATTICE2011, 061. [Google Scholar] [CrossRef]
- Alford, M.G.; Kapustin, A.; Wilczek, F. Imaginary chemical potential and finite fermion density on the lattice. Phys. Rev. D 1999, 59, 054502. [Google Scholar] [CrossRef]
- de Forcrand, P.; Philipsen, O. The QCD phase diagram for small densities from imaginary chemical potential. Nucl. Phys. B 2002, 642, 290–306. [Google Scholar] [CrossRef]
- D’Elia, M.; Lombardo, M.P. Finite density QCD via imaginary chemical potential. Phys. Rev. D 2003, 67, 014505. [Google Scholar] [CrossRef]
- Roberge, A.; Weiss, N. Gauge Theories With Imaginary Chemical Potential and the Phases of QCD. Nucl. Phys. B 1986, 275, 734–745. [Google Scholar] [CrossRef]
- de Forcrand, P.; Philipsen, O. Constraining the QCD phase diagram by tricritical lines at imaginary chemical potential. Phys. Rev. Lett. 2010, 105, 152001. [Google Scholar] [CrossRef]
- Bonati, C.; Cossu, G.; D’Elia, M.; Sanfilippo, F. The Roberge-Weiss endpoint in Nf = 2 QCD. Phys. Rev. D 2011, 83, 054505. [Google Scholar] [CrossRef]
- Philipsen, O.; Pinke, C. Nature of the Roberge-Weiss transition in Nf = 2 QCD with Wilson fermions. Phys. Rev. D 2014, 89, 094504. [Google Scholar] [CrossRef]
- de Forcrand, P.; Philipsen, O. The Chiral critical point of N(f) = 3 QCD at finite density to the order (mu/T)**4. J. High Energy Phys. 2008, 11, 012. [Google Scholar] [CrossRef]
- Jin, X.Y.; Kuramashi, Y.; Nakamura, Y.; Takeda, S.; Ukawa, A. Curvature of the critical line on the plane of quark chemical potential and pseudoscalar meson mass for three-flavor QCD. Phys. Rev. 2015, D92, 114511. [Google Scholar] [CrossRef]
- Philipsen, O.; Sciarra, A. Finite Size and Cut-Off Effects on the Roberge-Weiss Transition in Nf = 2 QCD with Staggered Fermions. Phys. Rev. D 2020, 101, 014502. [Google Scholar] [CrossRef]
- Czaban, C.; Cuteri, F.; Philipsen, O.; Pinke, C.; Sciarra, A. Roberge-Weiss transition in Nf = 2 QCD with Wilson fermions and Nτ = 6. Phys. Rev. 2016, D93, 054507. [Google Scholar] [CrossRef]
- Bonati, C.; Calore, E.; D’Elia, M.; Mesiti, M.; Negro, F.; Sanfilippo, F.; Schifano, S.F.; Silvi, G.; Tripiccione, R. Roberge-Weiss endpoint and chiral symmetry restoration in Nf = 2 + 1 QCD. Phys. Rev. D 2019, 99, 014502. [Google Scholar] [CrossRef]
- Goswami, J.; Karsch, F.; Lahiri, A.; Neumann, M.; Schmidt, C. Critical end points in (2+1)-flavor QCD with imaginary chemical potential. PoS 2019, CORFU2018, 162. [Google Scholar] [CrossRef]
- Halasz, A.M.; Jackson, A.D.; Shrock, R.E.; Stephanov, M.A.; Verbaarschot, J.J.M. On the phase diagram of QCD. Phys. Rev. D 1998, 58, 096007. [Google Scholar] [CrossRef]
- Hatta, Y.; Ikeda, T. Universality, the QCD critical/tricritical point and the quark number susceptibility. Phys. Rev. D 2003, 67, 014028. [Google Scholar] [CrossRef]
- Stephanov, M.A.; Rajagopal, K.; Shuryak, E.V. Signatures of the tricritical point in QCD. Phys. Rev. Lett. 1998, 81, 4816–4819. [Google Scholar] [CrossRef]
- Brandes, L.; Kaiser, N.; Weise, W. Fluctuations and phases in baryonic matter. Eur. Phys. J. A 2021, 57, 243. [Google Scholar] [CrossRef]
- Fodor, Z.; Katz, S.D. A New method to study lattice QCD at finite temperature and chemical potential. Phys. Lett. B 2002, 534, 87–92. [Google Scholar] [CrossRef]
- Allton, C.R.; Ejiri, S.; Hands, S.J.; Kaczmarek, O.; Karsch, F.; Laermann, E.; Schmidt, C.; Scorzato, L. The QCD thermal phase transition in the presence of a small chemical potential. Phys. Rev. D 2002, 66, 074507. [Google Scholar] [CrossRef]
- Karsch, F.; Bazavov, A.; Ding, H.T.; Hegde, P.; Kaczmarek, O.; Laermann, E.; Mukherjee, S.; Ohno, H.; Petreczky, P.; Schmidt, S.; et al. Conserved Charge Fluctuations from Lattice QCD and the Beam Energy Scan. Nucl. Phys. A 2016, 956, 352–355. [Google Scholar] [CrossRef]
- Ratti, C. QCD at non-zero density and phenomenology. PoS 2019, LATTICE2018, 004. [Google Scholar] [CrossRef]
- Attanasio, F.; Jäger, B.; Ziegler, F.P.G. Complex Langevin simulations and the QCD phase diagram: Recent developments. Eur. Phys. J. A 2020, 56, 251. [Google Scholar] [CrossRef]
- Vovchenko, V.; Steinheimer, J.; Philipsen, O.; Pasztor, A.; Fodor, Z.; Katz, S.D.; Stoecker, H. Lattice-based QCD equation of state at finite baryon density: Cluster Expansion Model. Nucl. Phys. A 2019, 982, 859–862. [Google Scholar] [CrossRef]
- Bazavov, A.; Ding, H.T.; Hegde, P.; Kaczmarek, O.; Karsch, F.; Karthik, N.; Laermann, E.; Lahiri, A.; Larsen, R.; Li, S.-T.; et al. Chiral crossover in QCD at zero and non-zero chemical potentials. Phys. Lett. B 2019, 795, 15–21. [Google Scholar] [CrossRef]
- Bellwied, R.; Borsanyi, S.; Fodor, Z.; Günther, J.; Katz, S.D.; Ratti, C.; Szabo, K.K. The QCD phase diagram from analytic continuation. Phys. Lett. B 2015, 751, 559–564. [Google Scholar] [CrossRef]
- Bonati, C.; D’Elia, M.; Negro, F.; Sanfilippo, F.; Zambello, K. The curvature of the chiral pseudocritical line from LQCD: Analytic continuation and Taylor expansion compared. Nucl. Phys. A 2019, 982, 198–200. [Google Scholar] [CrossRef]
- Bonati, C.; D’Elia, M.; Negro, F.; Sanfilippo, F.; Zambello, K. Curvature of the pseudocritical line in QCD: Taylor expansion matches analytic continuation. Phys. Rev. D 2018, 98, 054510. [Google Scholar] [CrossRef]
- Bazavov, A.; Ding, H.T.; Hegde, P.; Kaczmarek, O.; Karsch, F.; Laermann, E.; Maezawa, Y.; Mukherjee, S.; Ohno, H.; Petreczky, P.; et al. The QCD Equation of State to O(μB6) from Lattice QCD. Phys. Rev. D 2017, 95, 054504. [Google Scholar] [CrossRef]
- Vovchenko, V.; Steinheimer, J.; Philipsen, O.; Stoecker, H. Cluster Expansion Model for QCD Baryon Number Fluctuations: No Phase Transition at μB/T < π. Phys. Rev. D 2018, 97, 114030. [Google Scholar] [CrossRef]
- Vovchenko, V.; Pasztor, A.; Fodor, Z.; Katz, S.D.; Stoecker, H. Repulsive baryonic interactions and lattice QCD observables at imaginary chemical potential. Phys. Lett. B 2017, 775, 71–78. [Google Scholar] [CrossRef]
- Giordano, M.; Pásztor, A. Reliable estimation of the radius of convergence in finite density QCD. Phys. Rev. D 2019, 99, 114510. [Google Scholar] [CrossRef]
- Fodor, Z.; Giordano, M.; Günther, J.N.; Kapás, K.; Katz, S.D.; Pásztor, A.; Portillo, I.; Ratti, C.; Sexty, D.; Szabó, K.K. Trying to constrain the location of the QCD critical endpoint with lattice simulations. Nucl. Phys. A 2019, 982, 843–846. [Google Scholar] [CrossRef]
- Almási, G.A.; Friman, B.; Morita, K.; Redlich, K. Fourier coefficients of the net baryon number density and their scaling properties near a phase transition. Phys. Lett. B 2019, 793, 19–25. [Google Scholar] [CrossRef]
- Parotto, P.; Bluhm, M.; Mroczek, D.; Nahrgang, M.; Noronha-Hostler, J.; Rajagopal, K.; Ratti, C.; Schäfer, T.; Stephanov, M. QCD equation of state matched to lattice data and exhibiting a critical point singularity. Phys. Rev. C 2020, 101, 034901. [Google Scholar] [CrossRef]
- Basar, G. Universality, Lee-Yang singularities and series expansions. arXiv 2021, arXiv:2105.08080. [Google Scholar]
- Mondal, S.; Mukherjee, S.; Hegde, P. Lattice QCD Equation of State for Nonvanishing Chemical Potential by Resumming Taylor Expansion. arXiv 2021, arXiv:2106.03165. [Google Scholar]
- Fodor, Z.; Katz, S.D. Lattice determination of the critical point of QCD at finite T and mu. J. High Energy Phys. 2002, 03, 014. [Google Scholar] [CrossRef]
- Giordano, M.; Kapas, K.; Katz, S.D.; Nogradi, D.; Pasztor, A. Radius of convergence in lattice QCD at finite μB with rooted staggered fermions. Phys. Rev. D 2020, 101, 074511. [Google Scholar] [CrossRef]
- Golterman, M.; Shamir, Y.; Svetitsky, B. Breakdown of staggered fermions at nonzero chemical potential. Phys. Rev. D 2006, 74, 071501. [Google Scholar] [CrossRef]
- Giordano, M.; Kapas, K.; Katz, S.D.; Nogradi, D.; Pasztor, A. New approach to lattice QCD at finite density; results for the critical end point on coarse lattices. J. High Energy Phys. 2020, 05, 088. [Google Scholar] [CrossRef]
- Borsanyi, S.; Fodor, Z.; Giordano, M.; Katz, S.D.; Nogradi, D.; Pasztor, A.; Wong, C.H. Lattice simulations of the QCD chiral transition at real baryon density. arXiv 2021, arXiv:2108.09213. [Google Scholar]
Publisher’s Note: MDPI stays neutral with regard to jurisdictional claims in published maps and institutional affiliations. |
© 2021 by the author. Licensee MDPI, Basel, Switzerland. This article is an open access article distributed under the terms and conditions of the Creative Commons Attribution (CC BY) license (https://creativecommons.org/licenses/by/4.0/).

