Article

Unmasking People’s Opinions behind Mask-Wearing during COVID-19 Pandemic—A Twitter Stance Analysis

1
Department of Economic Informatics and Cybernetics, Bucharest University of Economic Studies, 010552 Bucharest, Romania
2
Faculty of Medicine and Pharmacy, University of Oradea, 410073 Oradea, Romania
3
ELLIADD Laboratory, University of Bourgogne Franche-Comté, 25200 Montbéliard, France
*
Author to whom correspondence should be addressed.
Symmetry 2021, 13(11), 1995; https://doi.org/10.3390/sym13111995
Submission received: 22 September 2021 / Revised: 14 October 2021 / Accepted: 19 October 2021 / Published: 21 October 2021
(This article belongs to the Special Issue 30 Years of Econophysics: Symmetry in Physics and Economics)

Abstract

:
Wearing a mask by the general public has been a controversial issue from the beginning of the COVID-19 pandemic as the public authorities have had mixed messages, either advising people not to wear masks if uninfected, to wear as a protective measure, to wear them only when inside a building/room with insufficient air flow or to wear them in all the public places. To date, the governments have had different policies regarding mask-wearing by the general public depending on the COVID-19 pandemic evolution. In this context, the paper analyzes the general public’s opinion regarding mask-wearing for the one-year period starting from 9 January 2020, when the first tweet regarding mask-wearing in the COVID-19 context has been posted. Classical machine learning and deep learning algorithms have been considered in analyzing the 8,795,633 tweets extracted. A random sample of 29,613 tweets has been extracted and annotated. The tweets containing news and information related to mask-wearing have been included in the neutral category, while the ones containing people’s opinions (for or against) have been marked using a symmetrical approach into in favor and against categories. Based on the analysis, it has been determined that most of the mask tweets are in the area of in favor or neutral, while a smaller percentage of tweets and retweets are in the against category. The evolution of the opinions expressed through tweets can be further monitored for extracting the public perspective on mask-wearing in times of COVID-19.

1. Introduction

The coronavirus pandemic has affected the world economy and has changed people’s everyday routines. A series of economic sectors have suffered due to changes in business, reduction in consumers’ demand, people travelling restrictions, regional or national lockdowns, while some industries, e.g., the aviation industry, have faced the worst crisis in their history [1,2].
Since the coronavirus outbreak, a series of measures have been taken by the governments and local authorities to limit the spread of the novel coronavirus, such as, but not limited to: school/workplace/public transport closing, public events cancelation, restrictions on gatherings, personal protecting equipment use, mask-wearing, international movement/international travel restrictions, increased testing policy, contact tracing, investment in healthcare/vaccines and public information campaigns [3].
Nowadays, the use of a mask is part of the prevention and control measures for COVID-19, along with other measures, which can limit the transmission of the novel coronavirus such as hand hygiene, physical distance and other infection prevention and control measures stated by the World Health Organization [4]. While the mask usage by the general public is postulated to decrease the COVID-19 infection by blocking the spread of the respiratory droplets [5], the mask-wearing come with a series of potential harms and risks such as mask contamination during manipulation due to contaminated hands, potential development of face skin lesions and facial discomfort when used long periods of time, difficulty wearing in humid environments, headaches, self-contamination if the mask is not changed when soiled, wet, damaged or worn for a prolonged period of time [4].
The early adoption of masks for the general public has been controversial: at the beginning of the pandemic, the World Health Organization initially advised against mask-wearing for the general public, and it was not until 5 June 2020, when the organization revisited this policy and changed the recommendation [5]. In the U.S., the first signals received in February 2020 from the U.S. Centers for Disease Control and Prevention stated that only the people with COVID-19 and the persons taking care of them should wear a mask [6]. U.S. Surgeon General Jerome M. Adams posted a message on Twitter on 29 February 2020, stating that “Seriously people—STOP BUYING MASKS! They are NOT effective in preventing general public from catching # Coronavirus, but if healthcare providers can’t get them to care for sick patients, it puts them and our communities at risk!” [6]. The recommendation’s main focus has been on not using masks by the general public, even though this intervention was made due to the limited supply of masks (a discussion about the mask crisis during COVID-19 is conducted in [7]). Later on, between 30 March and 3 April 2020, these recommendations were revised by the White House and the U.S. Centers for Disease Control and Prevention [6].
Due to the complex dynamics of mask-wearing across countries and territories, the actual act of wearing a mask has been seen by some people as being more than a medical necessity, being conditioned by personal believes and personal choices. Additional, when deciding to wear a mask, some of the people have considered even other aspects, discussed in the scientific literature, related to physiological and psychological impact [8,9], the perceived judgement of others [10], cultural reason [11], environment, as well as social and economic impact [12].
As in many other aspects of our lives, social media has become one of the channels in which individuals from all over the world have met and exposed ideas related to personal life choices or have criticized/supported the policies taken by the governments [13,14,15]. Even in the case of mask-wearing, social media have offered the possibility to people located in different parts of the world, some of them in partial or total isolation, to virtually meet and exchange opinions related to mask-wearing in the context of COVID-19. Twitter was one of the social media platforms in which people have expressed their opinions over various issues related to the COVID-19 situation [16]. Compared to other studies from the field discussing the mask-wearing in the context of the COVID-19 pandemic, which mostly relies on questionnaires applied to different areas and territories, with a limited number of respondents, the present study aims to expand the research related to public opinions concerning mask-wearing by considering the opinions of a larger number of individuals.
In this context, the present paper aims to analyze the general public opinion related to mask-wearing during COVID-19 by considering the tweets published in the one-year period starting from the first tweet posted regarding mask-wearing in the COVID-19 context (9 January 2020–8 January 2021). A number of 8,795,633 tweets written in English have been collected for the selected period, and stance detection using machine learning algorithms has been performed both on the entire and on the cleaned dataset.
Besides collecting the COVID-19 mask dataset, annotating a subset and performing the stance detection, a series of analyses are conducted in order to connect the major events reported in the considered one-year period with the evolution of the number of tweets and the stance (in favor, against and neutral). The chosen approach can be easily integrated into a monitoring system, which will allow the interested organizations to better observe how people’s opinions changed over time regarding mask-wearing. Knowing the evolution of the opinions related to mask-wearing, different policies can be created, and various public awareness and public information campaigns can be created to support the mask adoption among the large public.
The remainder of the paper is organized as follows. Section 2 provides a brief literature review structured in two parts: mask-related works in the COVID-19 context and Twitter analysis on COVID-19 data. Section 3 describes the methodology used in the paper, while Section 4 presents the COVID-19 mask dataset collection, the annotation process and the performance of the considered classification algorithms. Section 5 presents the mask opinion dynamics in the considered period, while Section 6 connects the evolution of tweets to the major events reported in the news. The limitations of the study and discussions are provided in Section 7, while Section 8 is dedicated to conclusions and further developments.
Supplementary Material accompanies the paper, consisting of collected and annotated COVID-19 mask-related datasets, along with the unigrams, bigrams and trigrams extracted for the considered period.

2. Literature Review

This section presents a summary of the research papers published in the field, with a focus on mask-related works in the COVID-19 context and Twitter analysis on COVID-19 data.

2.1. Mask Related Works in COVID-19 Context

In the early stages of the pandemic, 18–19 March 2020, Sun et al. [17] conducted a study on the WeChat platform in China, regarding the people’s willingness to wear a face mask. Based on the answers received from the 5761 participants of the study, the authors showed that a high percentage of people wore masks while using the public means of transport (99.6%) or when shopping (99.4%). The authors mentioned that the Chinese public is highly likely to wear a mask during the COVID-19 pandemic [17].
Goldberg et al. [18] discussed the importance of government recommendations in terms of mask-wearing. The authors underlined the fact that it has been observed a 12% increase in mask-wearing and 7% in mask-buying after 3 April 2020, when the U.S. Centers for Disease Control and Prevention recommended wearing a mask as a prevention measure for the spread of COVID-19 [18]. The study has been conducted on a nationally represented sample, consisting of 3933 respondents. Besides the government, interactions with friends and family can increase the odds of wearing a mask by 5% to 16%, as reported by Hao et al. [19]. The study was conducted on American respondents from ten states collected in three different periods of time: 20–26 April, 4–10 May and 30 May–8 June 2020 [19].
On 20–22 April 2020, Rieger [10] conducted a study based on a survey addressed to German respondents that analyzed attitudes towards wearing masks in the context of COVID-19. The analysis of the responses showed that 50%–80% of the respondents would probably wear a mask if they had one in most of the scenarios. Based on the demographic factors considered, the author stated that most of them were not significant, apart from a university degree, which has been associated with a higher likelihood of wearing a mask [10]. Various factors have been pointed out as determinants for wearing a mask, and their intensity was determined to vary between age groups. Nearly all participants agree that they will wear a mask if this was required by the authorities but mentioned that not all of them would comply with wearing it on the street [10].
Greater belief in science predicted greater belief in the effectiveness of face masks reducing the transmission of COVID-19, according to Stosic et al. [20]. The authors recommend that the researchers should engage in more open science practices and science education as these practices are presumed to influence the public’s belief in science and in the effectiveness of face masks for reducing the COVID-19 transmission [20].
Leffler et al. [5] studied masks, among other factors, as a source of variation between countries in per-capita mortality from COVID-19. The authors considered data extracted for 200 countries until 9 May 2020. Based on the statistical analysis, the authors stated that in the countries not using the masks until 60 days from the start of the outbreak, the per-capita mortality raised dramatically, while in the countries that have started using the masks up to 15 days of the onset, the mortality rate has been extremely low [5]. Masks have been significantly associated with low mortality rates. The per-capita mortality increase per week in the countries making no recommendations regarding mask-wearing was approximately 55.7%, higher than the 8.1% recorded for the countries in which the mask-wearing recommendation was emitted by the government [5].
Van Dyke et al. [21] showed that after implementing the mask mandates in 24 Kansas counties, a reverse in the increasing trend of the COVID-19 incidence was observed. The authors explicitly stated that the use of the masks in public spaces reduces the spread of COVID-19, while Krishnamachari et al. [22] have shown that faster implementation of mask mandates was consistently shown to be protective.
Another study focusing on U.S., Brazil and Italy stated that COVID-19 could have been avoided in Italy and Brazil if a percentage between 85.87% and 91.76% of the population wore masks from the beginning of the outbreak [23].
Raymond [24] underlined that there is strong evidence to support community use of face masks in order to mitigate the spread of COVID-19. The author pointed out that there are studies expressing concerns about the negative effects of wearing masks but that most of them were derived from a misunderstanding of the message sent by the authorities for preserving the limited number of masks for the frontline health care providers [24].
The medical benefits and the effectiveness of wearing masks for mitigating the COVID-19 pandemic have been presented in various studies, such as [25,26].
Besides the medical benefits brought by the face masks, the mask-wearing consequences for social functioning are little discussed in the opinion of Grundmann et al. [8]. The authors have underlined the role played by the mask in reducing the emotion-recognition accuracy and perceived closeness [8] and advise the policymakers to consider alternatives for face masks use in various contexts. Various inconveniences in mask-wearing have been pointed out by Raymond [24] related to comfort, rashes on contact areas, minor inhaling difficulty and the fact that face masks can fog glasses.
In a recent study, Boccardo [27] showed that while most people do not report a change in the ocular symptoms while wearing a facemask, a significant percentage of the persons having dry eye symptoms manifested exacerbated symptoms due to mask-wearing, a situation that can affect up to 18% of the general population. Silkiss et al. [28] reported an increased incidence of chalazion in the San Francisco area between June–August 2020, when compared to the same interval in 2016–2019.
Vahedian-Azimi et al. [11] underline the fact that in some societies, there are objections related to mask use, such as the high price of masks and physical issues (e.g., heat intolerance, shortness of breath). Additionally, the authors mention that cultural context plays an important role and, even though wearing a facial mask is not an issue in China, in the Western countries (e.g., Canada), the masks invite stigma. This situation might appear due to the fact that until recently, wearing a mask was a sign that the person was sick, which would attract rejection from the people around and, therefore, negative ideas about masks [11]. In this context, the authors recommend using appropriate health protocols for imposing mask-wearing policies. The controversy regarding mask use in the U.S. is underlined by Scheid et al. [9], even though the authors state that wearing a mask appears to have only minor physiological drawbacks. The authors discuss the psychological aspects related to mask-wearing, namely autonomy, relatedness and competence, as elements that are not satisfied in the mixed messages, misinformation and lack of medical knowledge people are facing when informing about the COVID-19 pandemic and mask-wearing [9].
Other studies in the area of wearing/not wearing masks have focused on but have not been limited to: Chinese students in the U.S. and their experiences regarding receiving contradictory messages from host and home countries [6], analysis of the air inspired by competitive adolescence athletes through a mask [29], the effects of face masks on children’s respiratory parameters [30], mask-wearing in the context of high school graduation [31].
Some other studies, especially the ones in the area of environmental protection, have focused on the challenges induced by the extensive use of face masks during COVID-19 [12,32], the threat of face mask waste to the marine environment [33] or to the environment as a whole [34], the use of environmentally friendly non-medical masks [35], decontamination of face masks by dry heat pasteurization [36], disinfection and sterilization for reuse [37].
Comprehensive reviews of the studies regarding mask-wearing in the COVID-19 pandemic context have been conducted by [24,38,39,40].

2.2. Twitter Analysis on COVID-19 Data
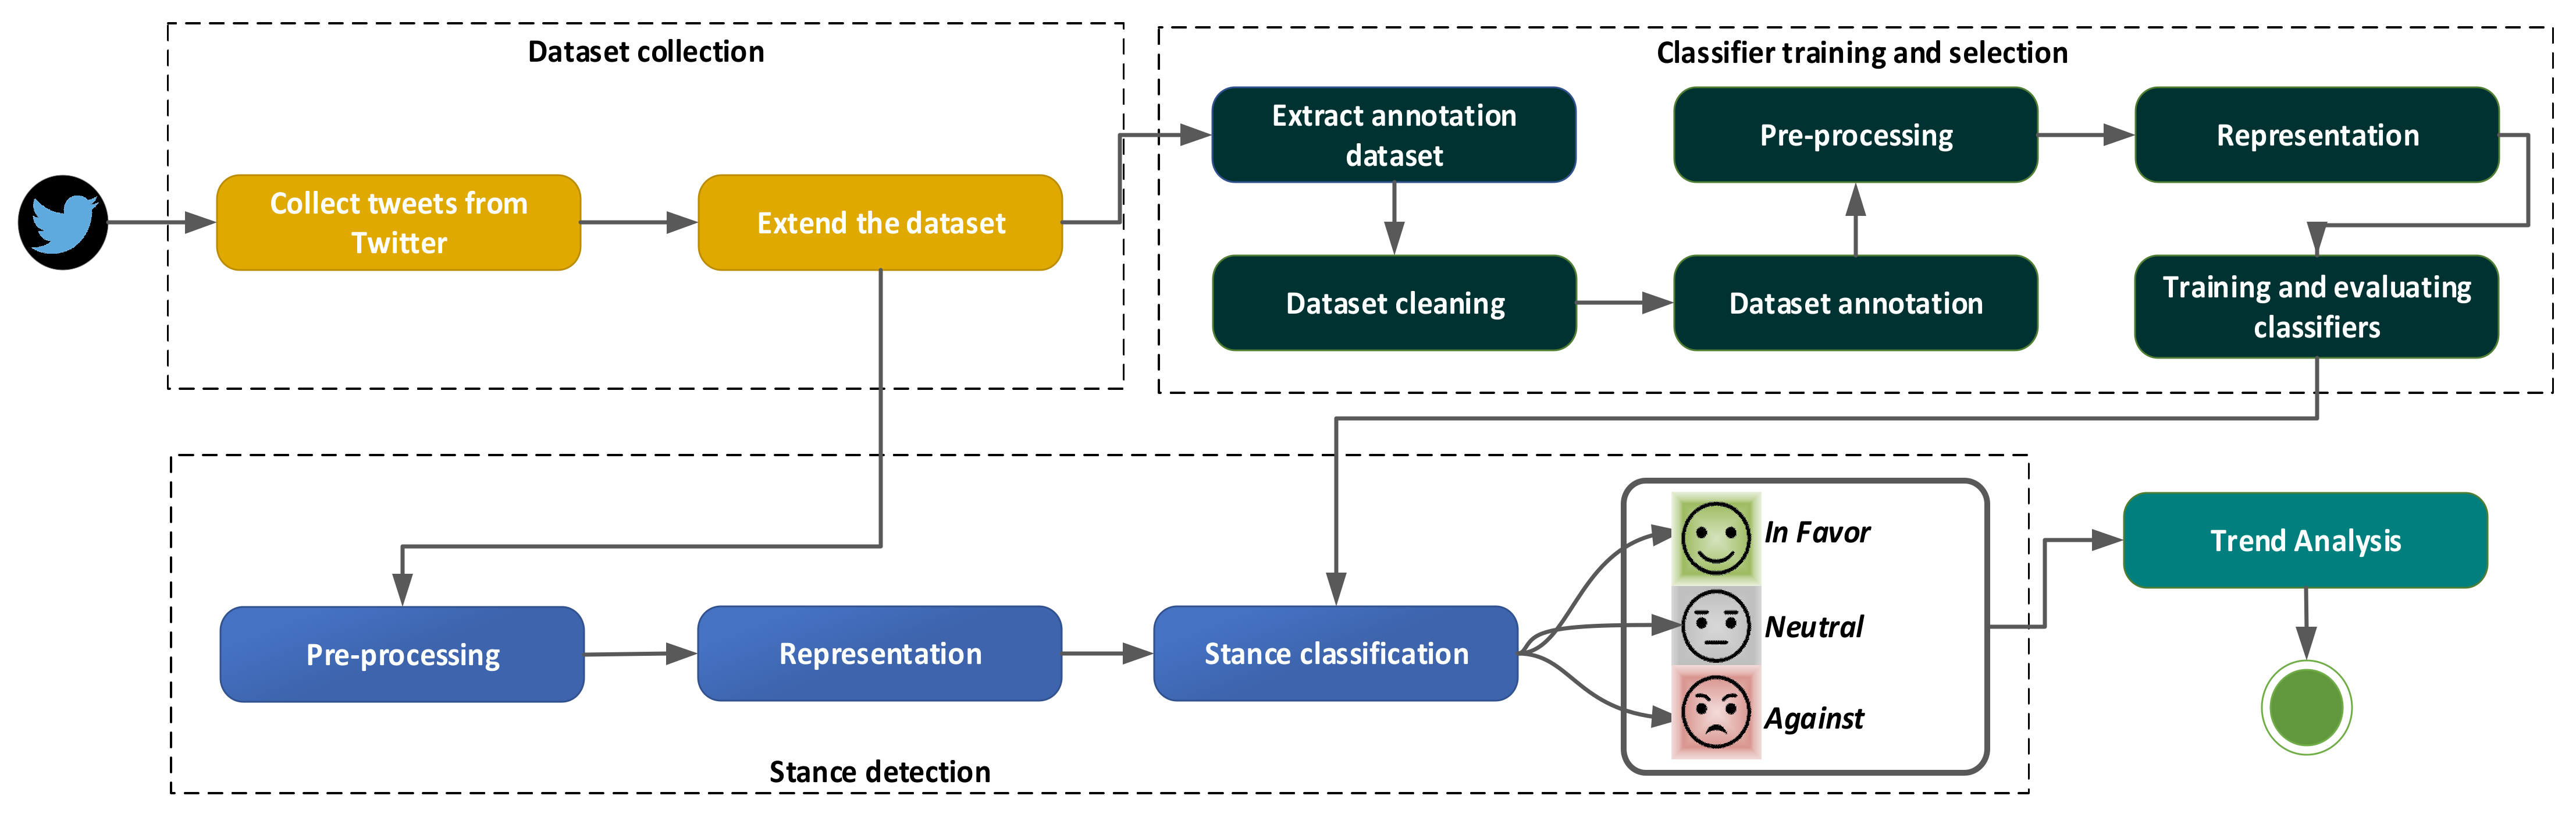
Twitter has been one of the main platforms for extracting and analyzing data related to people’s opinions or feelings regarding different measures that have been taken since the coronavirus outbreak. According to Haman [41], since March 2020, the COVID-19 pandemic has been the dominant topic on Twitter.
As a result, the scientific literature has analyzed people’s opinions or emotions in relation to the COVID-19 pandemic in general or to various subjects of interest, as discussed in the following.
Different emotions experienced by people on Twitter during COVID-19 have been analyzed by a series of researchers. Koh and Liew [42] have focused on the loneliness feeling expressed in tweets from 1 May 2020 to 1 July 2020. Three main triggers to loneliness have been considered: community impact, social distance and mental health. The authors concluded that all the triggers support the multidimensional construct of loneliness and that social media can be useful in keeping track of people’s mental health evolution [42]. Psychological fear and anxiety caused by COVID-19 have been analyzed by Singh et al. [43]. The authors showed that people are tremendously living with psychological fear and anxiety all around the world.
Sentiment analysis based on different detected topics has been performed by Garcia and Berton [44] on tweets written in English and Portuguese. The authors have concluded that in almost all the considered topics, the most prevalent sentiment was marked by negative emotions [44]. Abd-Alrazaq et al. [45] have analyzed the main themes of discussion generated by COVID-19 and have identified 12 categories, grouped into: origin and sources of the virus, impact on people, countries and economies and possible means for mitigation. The dominant sentiment was a positive one, recorded for 10 of the 12 categories [45].
Social distance, one of the measures implemented by some states for lowering the contagion curve, has been analyzed from the perspective of Twitter users by Kwon et al. [46]. The authors have used a number of 259,529 tweets collected between 23 January 2020 and 24 March 2020, to observe the users’ opinions related to social distance measures implementation, adaptation, purpose, social disruption, negative and positive emotions [46]. Overall, as expected, the prevalence of negative emotions has been higher than the one of positive emotions. For the last period of the analysis (March 2020), it has been observed an increase in the proportion of tweets referring to social distance measures implementation [46].
The use of drugs for fighting COVID-19 based on Twitter extracted data has been analyzed in the scientific literature. Mutlu et al. [47] have provided a set containing 14,374 tweets extracted from 11,552 unique users on Twitter in connection with the efficacy of hydroxychloroquine as a treatment for COVID-19. In the provided dataset, 47.59% of tweets were in favor, 32.59% of tweets were against, while 19.81 tweets were neutral [47].
The users’ dynamics of the opinions regarding the COVID-19 vaccination in the month following the first vaccine announcement has been analyzed by Cotfas et al. [14]. The authors have considered 2,349,659 messages on Twitter regarding the COVID-19 vaccination and have concluded that most of the tweets have had a neutral stance, followed by in favor and against stances [14]. Increases in the number of in favor tweets were noticed in the days characterized by major events related to vaccinations, while the major spike in the against tweets occurred on the day in which the UK has authorized the Pfizer BioNTech COVID-19 vaccine. The COVID-19 vaccine hesitancy has been analyzed by Thelwall et al. (2021). The authors have considered a sample of 446 vaccine-hesitant tweets. The results have shown that the main hesitancy reasons are related to conspiracy theories, vaccine development speed and vaccine safety [48].
State leaders have been found to use Twitter for offering information to the general public. In a recent paper by Haman [41], 143 state leaders’ tweets were analyzed, and the author determined that 64.8% of them had tweeted about COVID-19. Furthermore, the author noted a significant increase in the number of followers the state leaders have in this pandemic period [41]. Wang et al. [49] addressed the risk and crisis communication of government agencies and stakeholders in the early stages of the pandemic. The authors stated the importance of the involved agencies in managing the crises while identifying gaps in the critical messages sent on Twitter in the early stages of the pandemic [49]. A similar analysis is conducted by Rao et al. [50] but from a different perspective. The authors divided the officials’ tweets into two categories—reassurance and alarming—and concluded that a downplay in the number of alarming messages from the government can be observed as the pandemic evolves, with these messages being replaced step-by-step with assuring messages [50].
Other studies on COVID-19 Twitter data have focused on, but have not been limited to: the emotions of the ride-hailing service’s users [51], socioeconomic factors underlining the sentiments regarding COVID-19 reopening [52], COVID-19 impact on passengers and airlines [53], self-reported COVID-19 symptoms on Twitter [54], human mobility dynamics [55], extracting COVID-19 events, misinformation [56,57], automatic detection of misleading information [58] and mapping Twitter conspiracy theories [59].

3. Methodology

The steps needed to be considered in order to perform the tweets trend analysis are presented in Figure 1 and further discussed in the following.

3.1. Dataset Collection Step

The tweets search has been performed using the keywords listed in Table 1 [60], and the resulting language-specific dataset (in English) has been collected using Twitter API. As it has been assumed that the persons speaking about the inconveniences of mask-wearing or about the possible side-effects generated by mask-wearing would not wear a mask, no additional keywords have been used—other than the ones presented in Table 1. This assumption has been supported by the fact that none of the tweets in the annotated dataset that contained ideas about the presence of side effects when wearing a mask stated that the person would still use a mask for protection against COVID-19.
Additionally, the set has been supplemented by adding the tweets extracted by Banda et al. [60], selected based on the same set of keywords.
The period considered for the study is 9 January 2020–8 January 2021, equal to one year starting from the day in which the first tweet related to mask-wearing in the context of COVID-19 was published.

3.2. Classifiers Training and Selection Step

To increase the quality of the annotated dataset, before the annotation process, the retweets and duplicated tweets have been removed, as suggested by [61,62]. From the remaining set, referred to in the following as cleaned dataset (in opposition to the entire dataset, which incorporates even the retweets, referred to as entire dataset), a sub-set of tweets has been extracted in a random manner. Due to the high number of tweets extracted in the one-year period considered in the analysis, the sub-set needed in the annotation process represents approximatively 1.75% from the cleaned dataset.
The annotation process has been performed by three persons, who have marked the corresponding category for each tweet in an individual file. Three categories have been considered:
  • in favor—all the tweets expressing positive messages regarding the use of masks during the COVID-19 pandemic with the purpose of protecting the wearer of the mask or the persons in his/her vicinity;
  • neutral—all the tweets referring to news related to mask-wearing, changes in the mask-wearing policies in different parts of the world or indoor/outdoor; information related to the efficiency of different types of masks; announcements related to mask-selling offers; and all the tweets that do not express a clear opinion related to mask-wearing;
  • against—all the tweets presenting a negative message regarding mask-wearing, including the refusal of wearing such a mask under all/any circumstances.
The tweets in the neutral category have been marked with “0”, while the ones in the in favor and against categories have been marked in a symmetrical manner with “1” and “−1”, respectively.
The disagreements encountered in the tweet annotation process have been reported between the in favor and neutral or against and neutral categories only. No disagreement has been encountered between in favor and against categories. In the case of disagreement, the class to which the tweet has been assigned to has been decided by the option expressed by most of the annotators [14].
A balanced set has been extracted from the annotated set and undergone a pre-processing step in which all the links, email addresses and user mentions have been normalized, while the emoticons have been replaced with their associated words. Additionally, some corrections have been made to the spelling errors and elongated words; all the letters have been transformed in lowercases; the hashtags have been unpacked. In order to perform this pre-processing step, the ekphrasis library and the Natural Language Toolkit (NLTK) library have been used along with the “re” python module [63,64].
Knowing that some of the classification algorithms rely on the word frequency, the Term Frequency-nverse Document Frequency (TF-IDF) has been used for reducing the weight of the most frequent words, which, in general, contain little to no information [15].
A series of classification algorithms, such as Naive Bayes (MNB) [65,66], Random Forest (RF) [67,68], Support Vector Machine (SVM) [69,70], Bidirectional Encoder Representations from Transformers (BERT) [71] and Robustly Optimized BERT Pretraining Approach (RoBERTa) [72], have been considered and their performance has been evaluated through the use of four of the most-well known indicators, namely Accuracy, Precision, Recall and F-score, on the purpose of selecting the best classifier for the mask dataset. The formulas for the four indicators are presented in the following:
A c c u r a c y = T P + T N T P + T N + F P + F N
P r e c i s i o n = T P T P + F P
R e c a l l = T P T P + F N
F s c o r e = 2   ·   P r e c i s i o n   ·   R e c a l l P r e c i s i o n + R e c a l l
where: TP is the number of real positive tweets classified as positive; TN is the number of negative tweets correctly classified as negative; FP represents the number of real negative tweets classified incorrectly classified as positives; and FN is the number of real positive tweets incorrectly classified as negative.
Based on the values obtained for each of the four indicators, the best-performing algorithm has been selected keeping in mind that higher values are preferred.

3.3. Stance Detection Step

A new pre-processing step has been performed on the remaining set of tweets (the set of tweets that do not contain the annotated set).
The best classification algorithm selected in the previous step has been used for stance detection. The stance detection has been performed on both the cleaned dataset and the entire dataset.
As a result of the stance detection step, the considered tweets have been divided into the above-mentioned categories: in favor, neutral and against (as presented in Section 4) and their evolution is further analyzed in Section 5.

4. COVID-19 Mask Stance Dataset

A total of 8,795,633 tweets have been extracted for the one-year period starting from 9 January 2020–8 January 2021 and have been included in the entire dataset. After performing the discarding of the duplicated tweets and retweets, a cleaned dataset containing 1,692,437 tweets has been obtained.
As the information extracted from both datasets is useful in better shaping the evolution of the users’ opinion regarding the use of marks in times of COVID-19, the analysis performed in Section 5 is made in parallel on the two datasets.
The number of extracted tweets in each month of the above-mentioned period is presented in Table 2. It should be noted that as the first tweet regarding the use of masks as a protection measure against the was posted on 9 January 2020, in the following, we will divide the considered period into 12 equal months (noted with Mi, where i is the index of the month), each month is starting in the 9th day of the calendar’s month, and it is ending on the 8th day of the next calendar’s month.
The evolution of the number of tweets in each of the 12 months considered is depicted in Figure 2.
From Figure 2, it can be observed that there are months in which both the tweets and retweets number were considerably higher than in the other months of the considered period (e.g., M6, M7 and M9), with several activity peaks. The month with the highest number of tweets was M11, with more than 300,000 tweets, while the month with the highest number of retweets and tweets was M7, with more than 1,400,000. As expected, the month with the smallest number of tweets and retweets was the one marking the start of the coronavirus pandemic.
Regarding the first tweets, it can be mentioned that they were posted on 9 January 2020—please see Table 3. Considering the information in these tweets, it can be observed that they are informative tweets discussing the occurrence of a new type of coronavirus, similar to the one that caused the SARS epidemic. In this context, the tweets mentioned the authorities’ recommendations of not wearing a mask as a precaution measure and the fact that panic has conducted to the increase in mask purchases, with a visible effect in their price increase.
As for the first retweets, it has been observed that it has taken up to 5 days from the initial tweet until the first retweet has been posted (Table 4). As for the second and third retweets, they are both referring to a tweet that mentioned that the upcoming flu season might be unpleasant and advises the readers to start wearing a mask.
As mentioned in the methodology section, from the entire dataset, a random sample of 29,613 tweets (representing approximately 1.75% of the cleaned dataset) was extracted and annotated by three persons. Some examples of tweets in each of the three categories are presented in Table 5, while the distribution of the tweets into the three considered categories (in favor, neutral, against) is given in Table 6. In the annotation process, the neutral tweets have been marked with “0”, while the in favor and against tweets have been marked with “1” and “−1” in order to preserve the symmetry of these states compared to neutral.
It can be observed that most of the tweets in the annotated dataset belong to the in favor category, followed by the neutral and against categories.
A balanced dataset is then extracted from the annotated dataset, containing 9426 tweets equally distributed among the three categories.
For determining the best classifier for the mask dataset, five classifiers have been considered, and their performance has been evaluated using four indicators (please see Section 3). The considered classical machine learning algorithms are Multinomial Naive Bayes (MNB) [66], Random Forest (RF) [67] and Support Vector Machine (SVM) [69], while the selected deep learning algorithms are Bidirectional Encoder Representations from Transformers (BERT) [71] and Robustly Optimized BERT Pretraining Approach (RoBERTa) [72]. The implementation of the classical machine learning algorithms has been performed using the scikit-learn (https://scikit-learn.org, accessed on 13 January 2021) [73] library, while the implementation of the deep learning classifiers is based on using the Keras (https://keras.io, accessed on 13 January 2021) library, as a high-level API for TensorFlow (https://tensorflow.org, accessed on 13 January 2021).
Multinomial Naive Bayes (MNB) is a variation of the Naive Bayes classifier that utilizes a multinomial distribution for the features, such as the frequencies of n-grams in a text [74]. Different n-gram combinations have been considered when converting the text to a matrix of token counts, including unigrams, bigrams and trigrams, as highlighted in Table 7. The token counts matrix has been transformed into both normalized TF and TF-IDF representations, while both l1 and l2 norms have been analyzed for the resulting vectors. Vectors obtained in the case of the l1 norm have the sum of the elements square equal to 1, while in the case of the l2 norm, the sum of the absolute values of the elements is 1. The performance of the classifier has been evaluated both while keeping all the features and when limiting the maximum number of features to 1500, 2000 and 3000, respectively. Given the fact that stop words can sometimes affect the performance of the classifiers, we have also analyzed the results of removing the common English stop words, using the list included in the Natural Language Toolkit Library (https://nltk.org/, accessed on 13 January 2021) (NLTK) [64], as well as removing only corpus-specific stop words using as document thresholds 0.5, 0.75 and 1.
Random Forest (RF) is an ensemble classifier combining the results of multiple decision trees trained in parallel. The performance of the model has been analyzed while varying the parameters for the classification pipeline in the same way as in the case of MNB.
Support Vector Machine (SVM) is a supervised classification approach that tries to identify hyperplanes that best separate the data. Besides varying the parameters mentioned in the case of the MNB classifier, we have also considered varying the regularization penalty, while the analyzed values for the alpha parameter have been 0.0001, 0.00001 and 0.000001.
Bidirectional Encoder Representations from Transformers (BERT) is a pre-trained language model based on transformers. While pre-trained versions of BERT exist in a variety of configurations, we have chosen the BERTBASE model since using the more computationally expensive BERTLarge model has been shown to provide improvements in the accuracy of no more than 5%. We have evaluated both the version of the model that considers the casing of the letters (C7) and the one that ignores it (C8). In order to identify the best values for the model hyperparameters (learning rate, batch size and number of epochs), the approach recommended by Delvin et al. [71] has been followed. Thus, the analyzed learning rates have been 2 × 10 5 , 3 × 10 5 and 5 × 10 5 while the considered batch sizes have been 16 and 32. The model performance has been evaluated after training the model during 2, 3 and 4 epochs.
Robustly Optimized BERT Pretraining Approach (RoBERTa) (C9) is a transformer-based model that uses an improved pretraining procedure, when compared to BERT, achieving state-of-the-art results in several Natural Language Processing (NLP) tasks. As recommended by Liu et al. [72], the considered values for the hyperparameters stayed the same as in the case of the BERT model, except for the learning rates, for which the considered values were 10 5 , 2 × 10 5 and 3 × 10 5 .
The best values for the parameters associated with each classifier have been determined using a grid search approach. Afterwards, a 10-fold cross-validation evaluation has been performed, during which the dataset has been randomly divided into 10 folds [75]. The model is then trained on 9 folds, while the remaining fold is used for validation. The procedure is repeated 10 times, and the results from the folds are then averaged. The obtained results for the above-mentioned classifiers are presented in Table 8, where the accuracy of the best-performing classifier in each category has been marked using bold.
From Table 8, it can be observed that the best-performing MNB classifier is C1, with an accuracy of 75.44%, which is higher than the best RF classifier (C4, with an accuracy of 75.16%). Higher accuracy percentages are obtained by the best SVM classifier (C6, with an accuracy of 78.79%) and by the best BERT classifier (C8, with an accuracy of 82.60%). For all the classical machine learning classifiers (C1–C6), it can be observed that the best results have been achieved when the maximum number of features has not been limited. Overall, the best classifier is RoBERTa (C9), with an accuracy of 85.38%. Considering the other performance indicators, it can be observed that RoBERTa outperforms all the other classifiers in terms of Recall and F-1 scores in each category and in terms of Precision in the in favor and against tweets (being only outperformed in Precision on the neutral category by the MNB classifiers). As a result, RoBERTa will be used for stance detection in the following section.

5. COVID-19 Mask Stance Detection

The results of the mask stance detection performed through the use of RoBERTa [72] are discussed in this section on each of the two considered datasets (cleaned and entire). We decided to present the results on both the datasets as we believe, similarly to D’Andrea et al. [61], that the retweeting action is a sign of support for the information provided in the original tweet, showing that the person retweeting a tweet shares the same point of view with the content of the message.

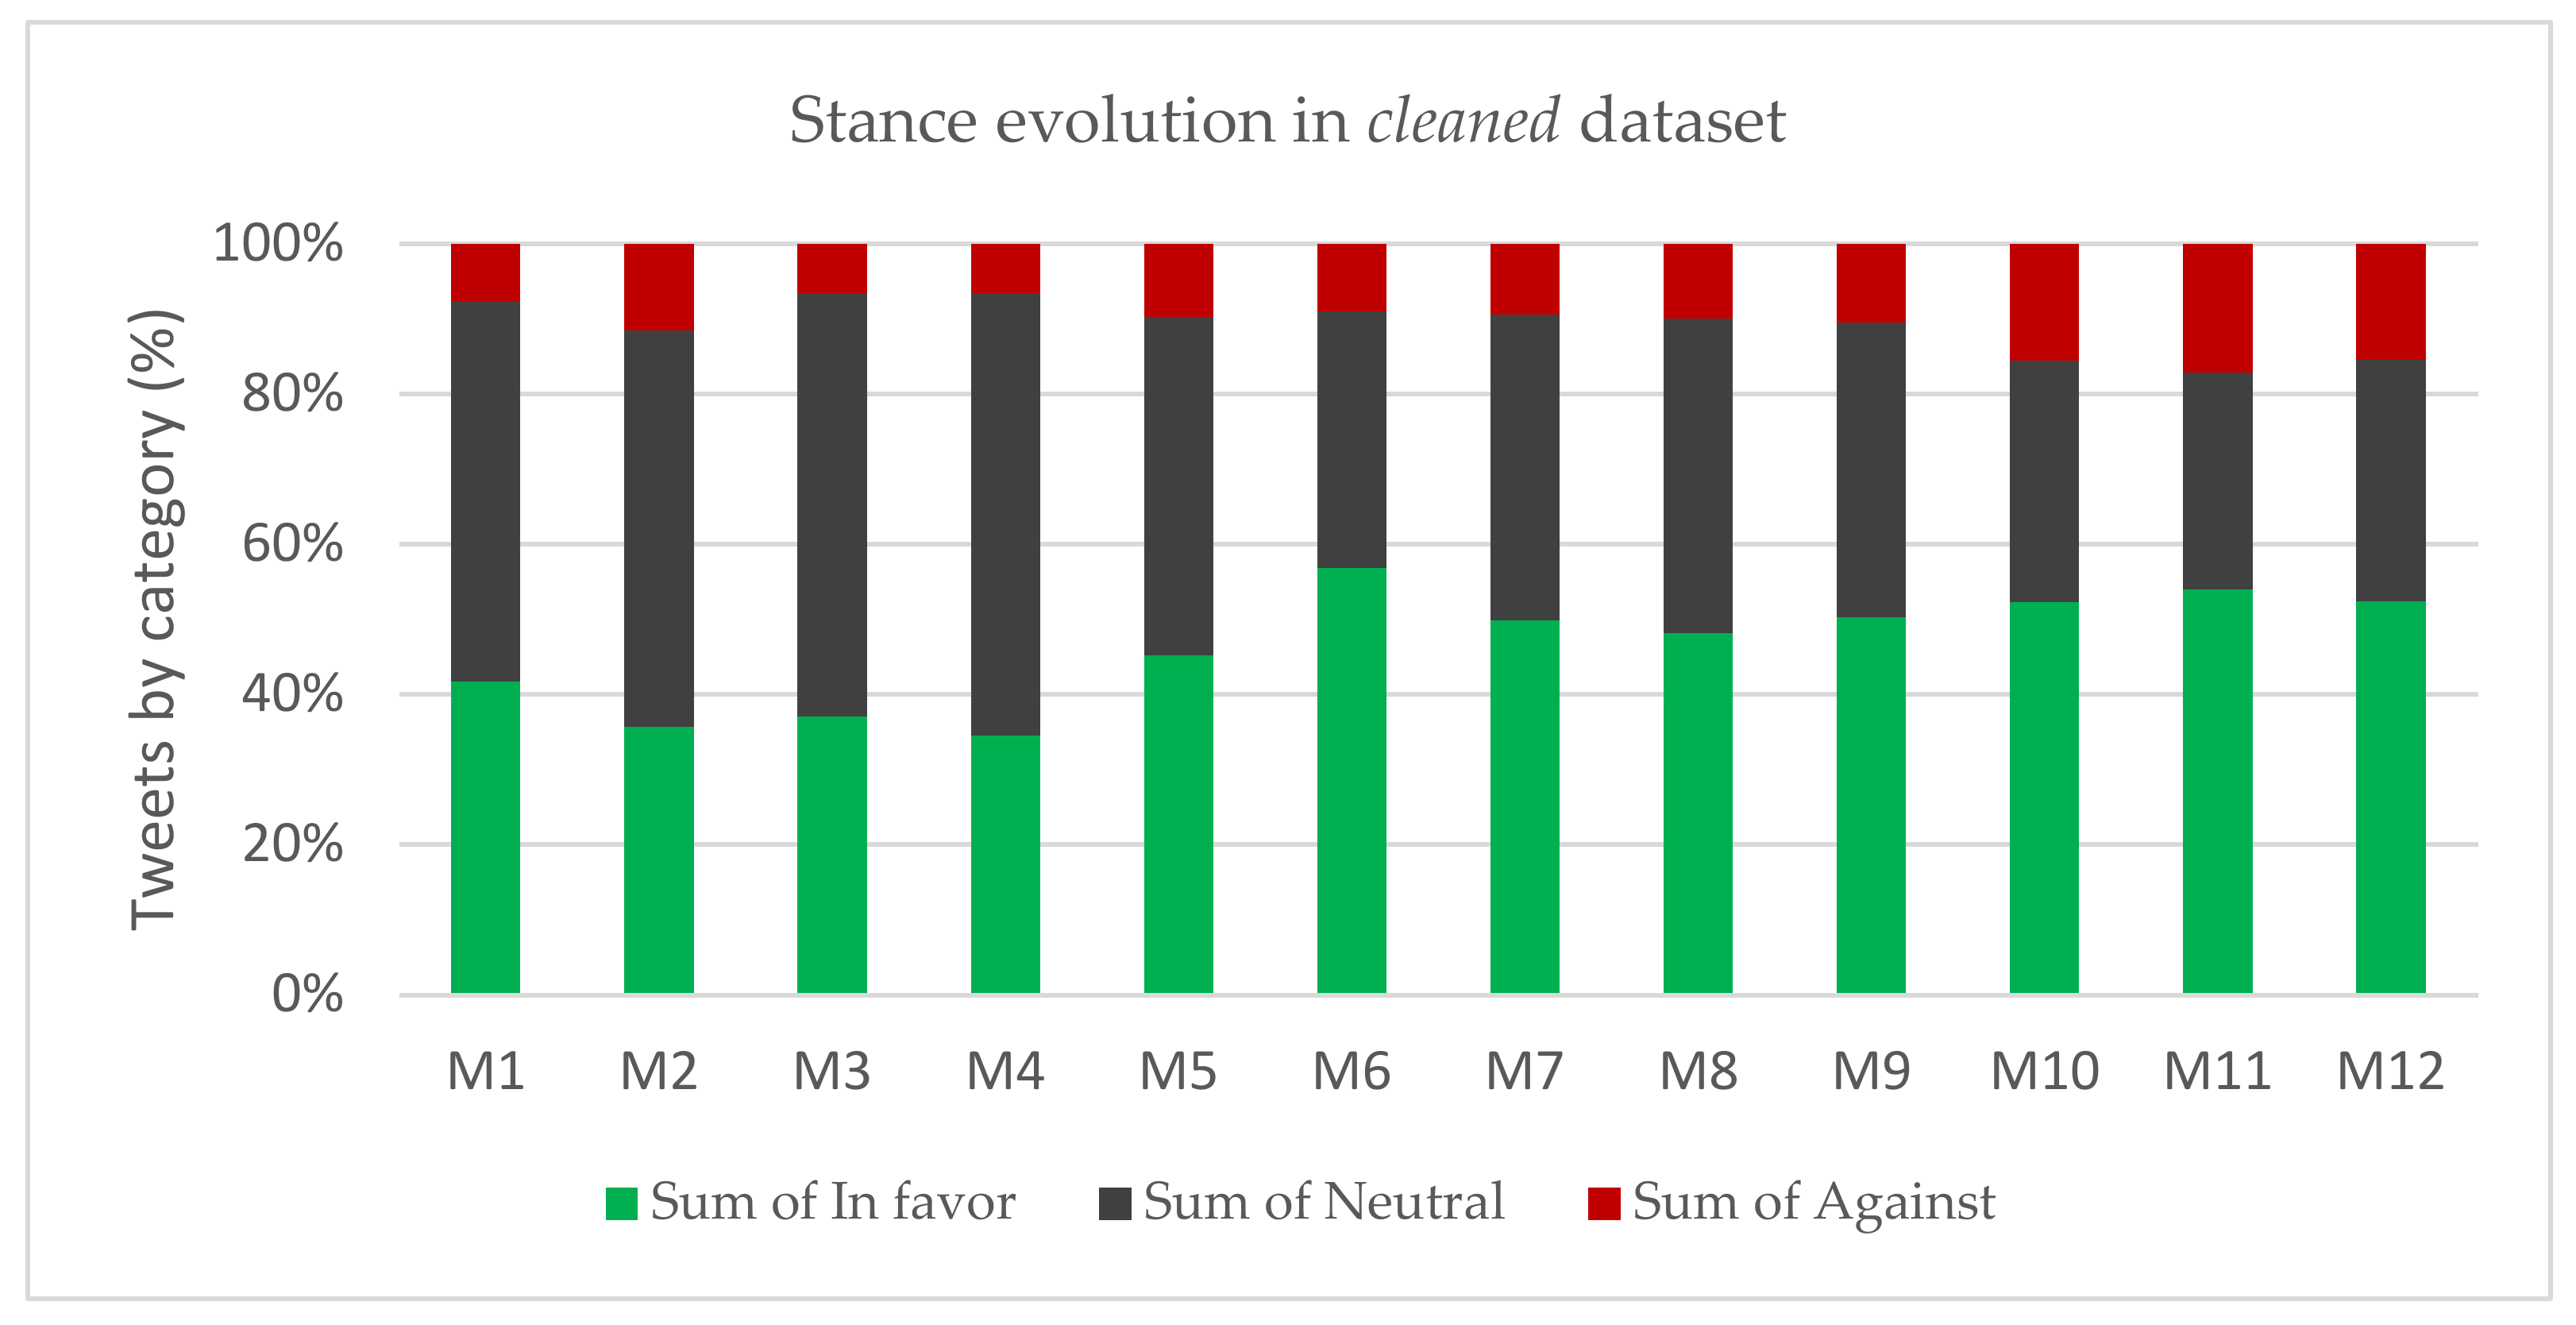
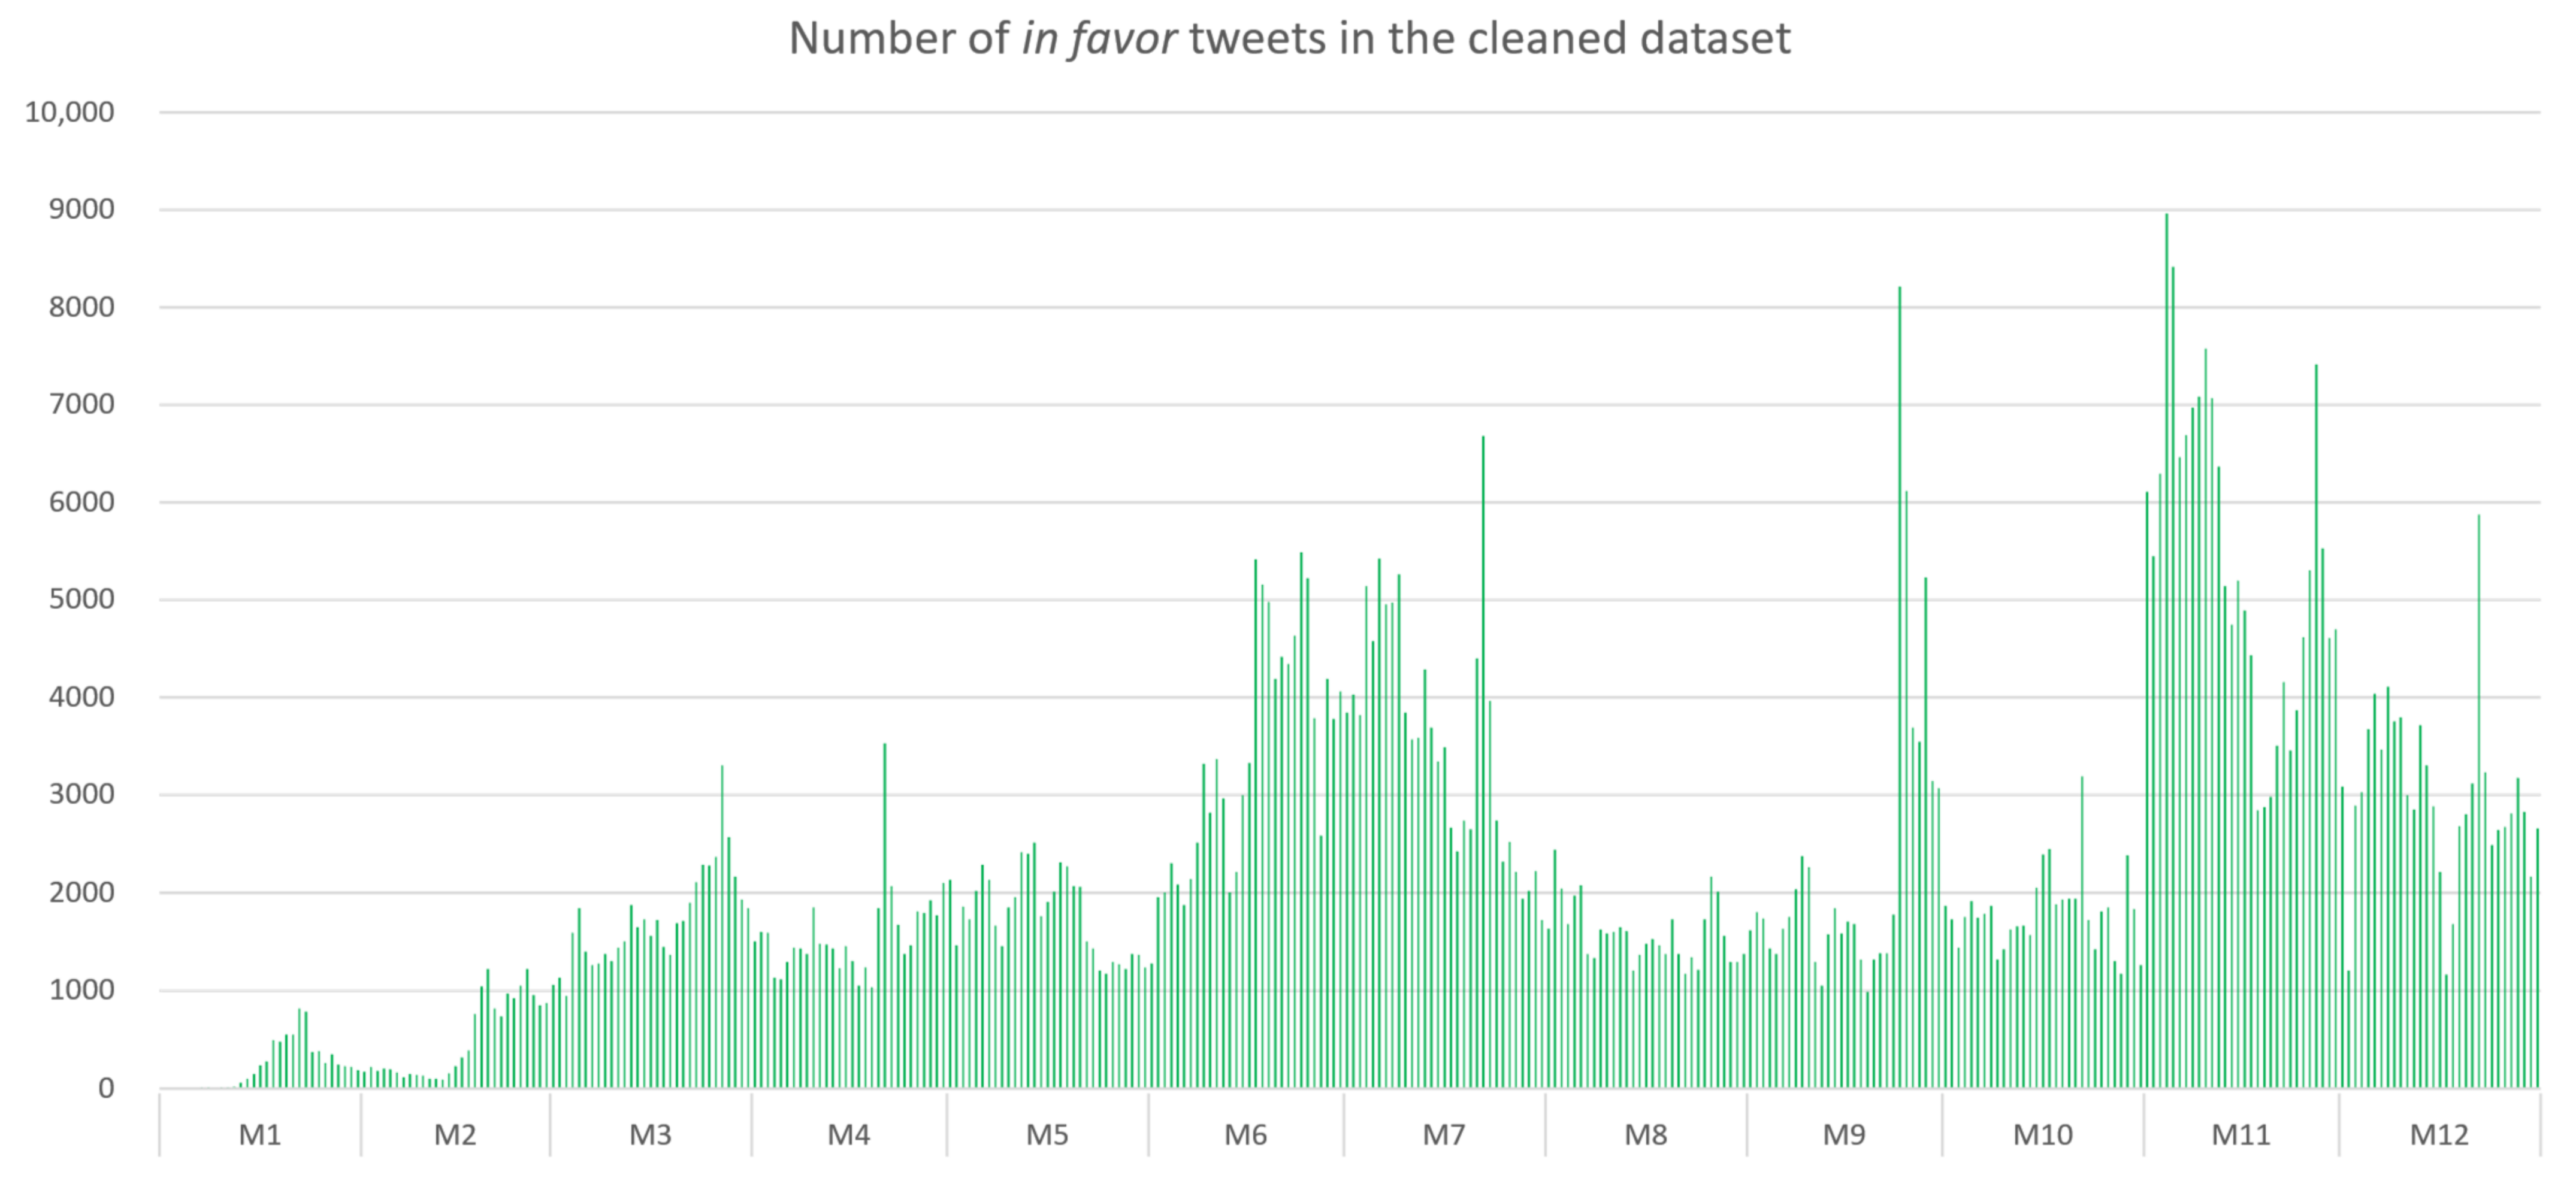
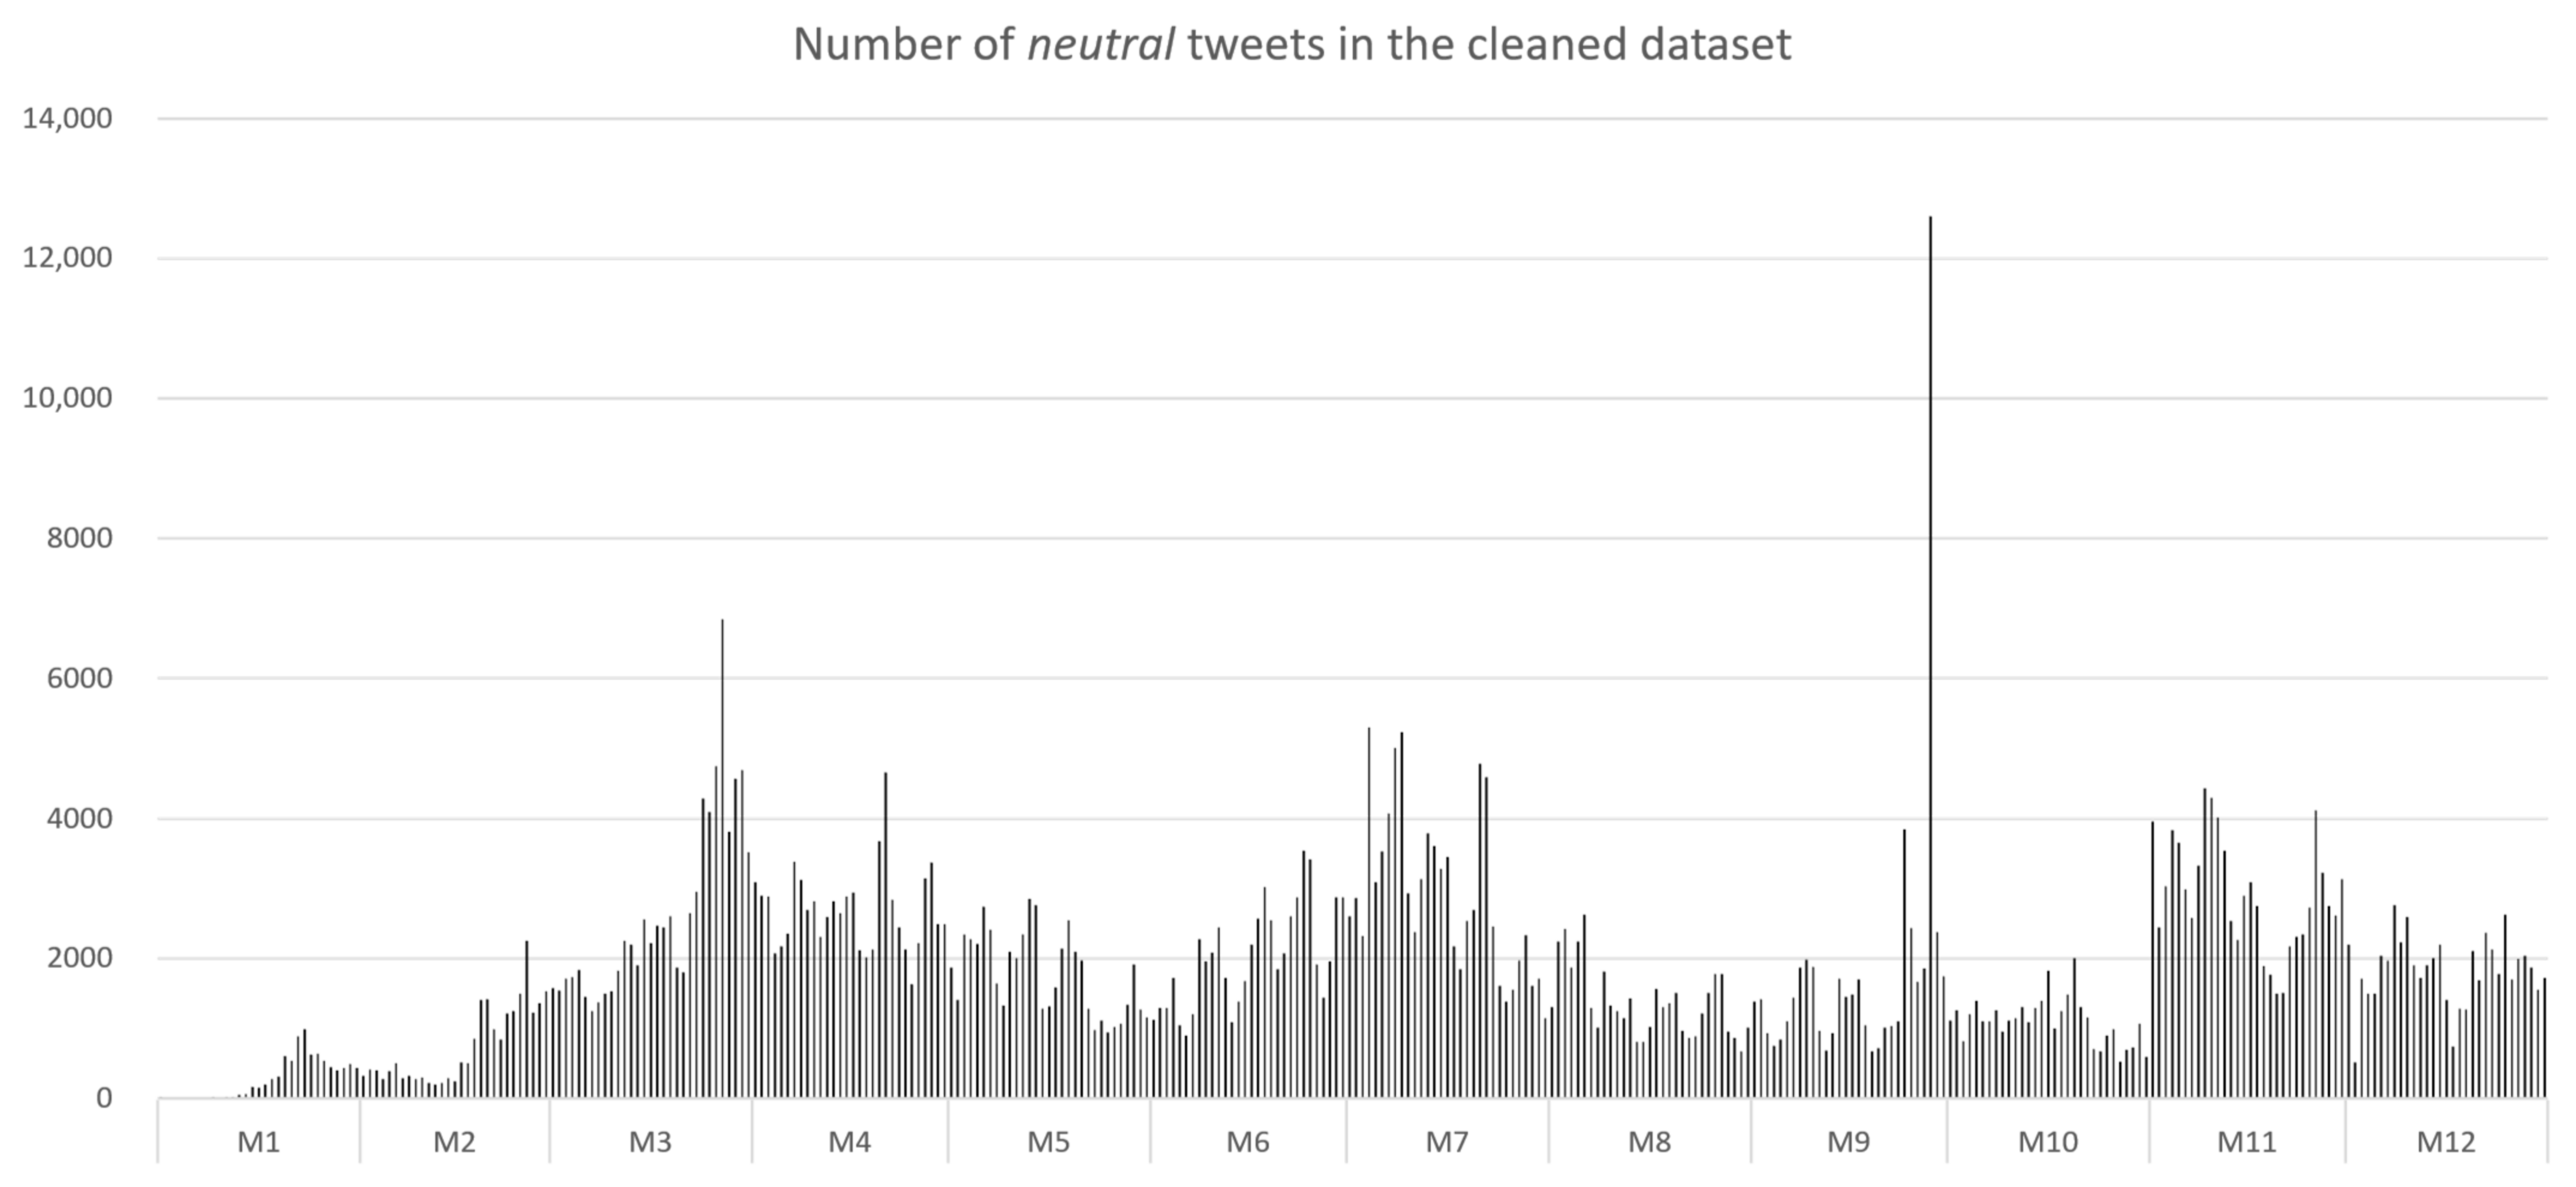
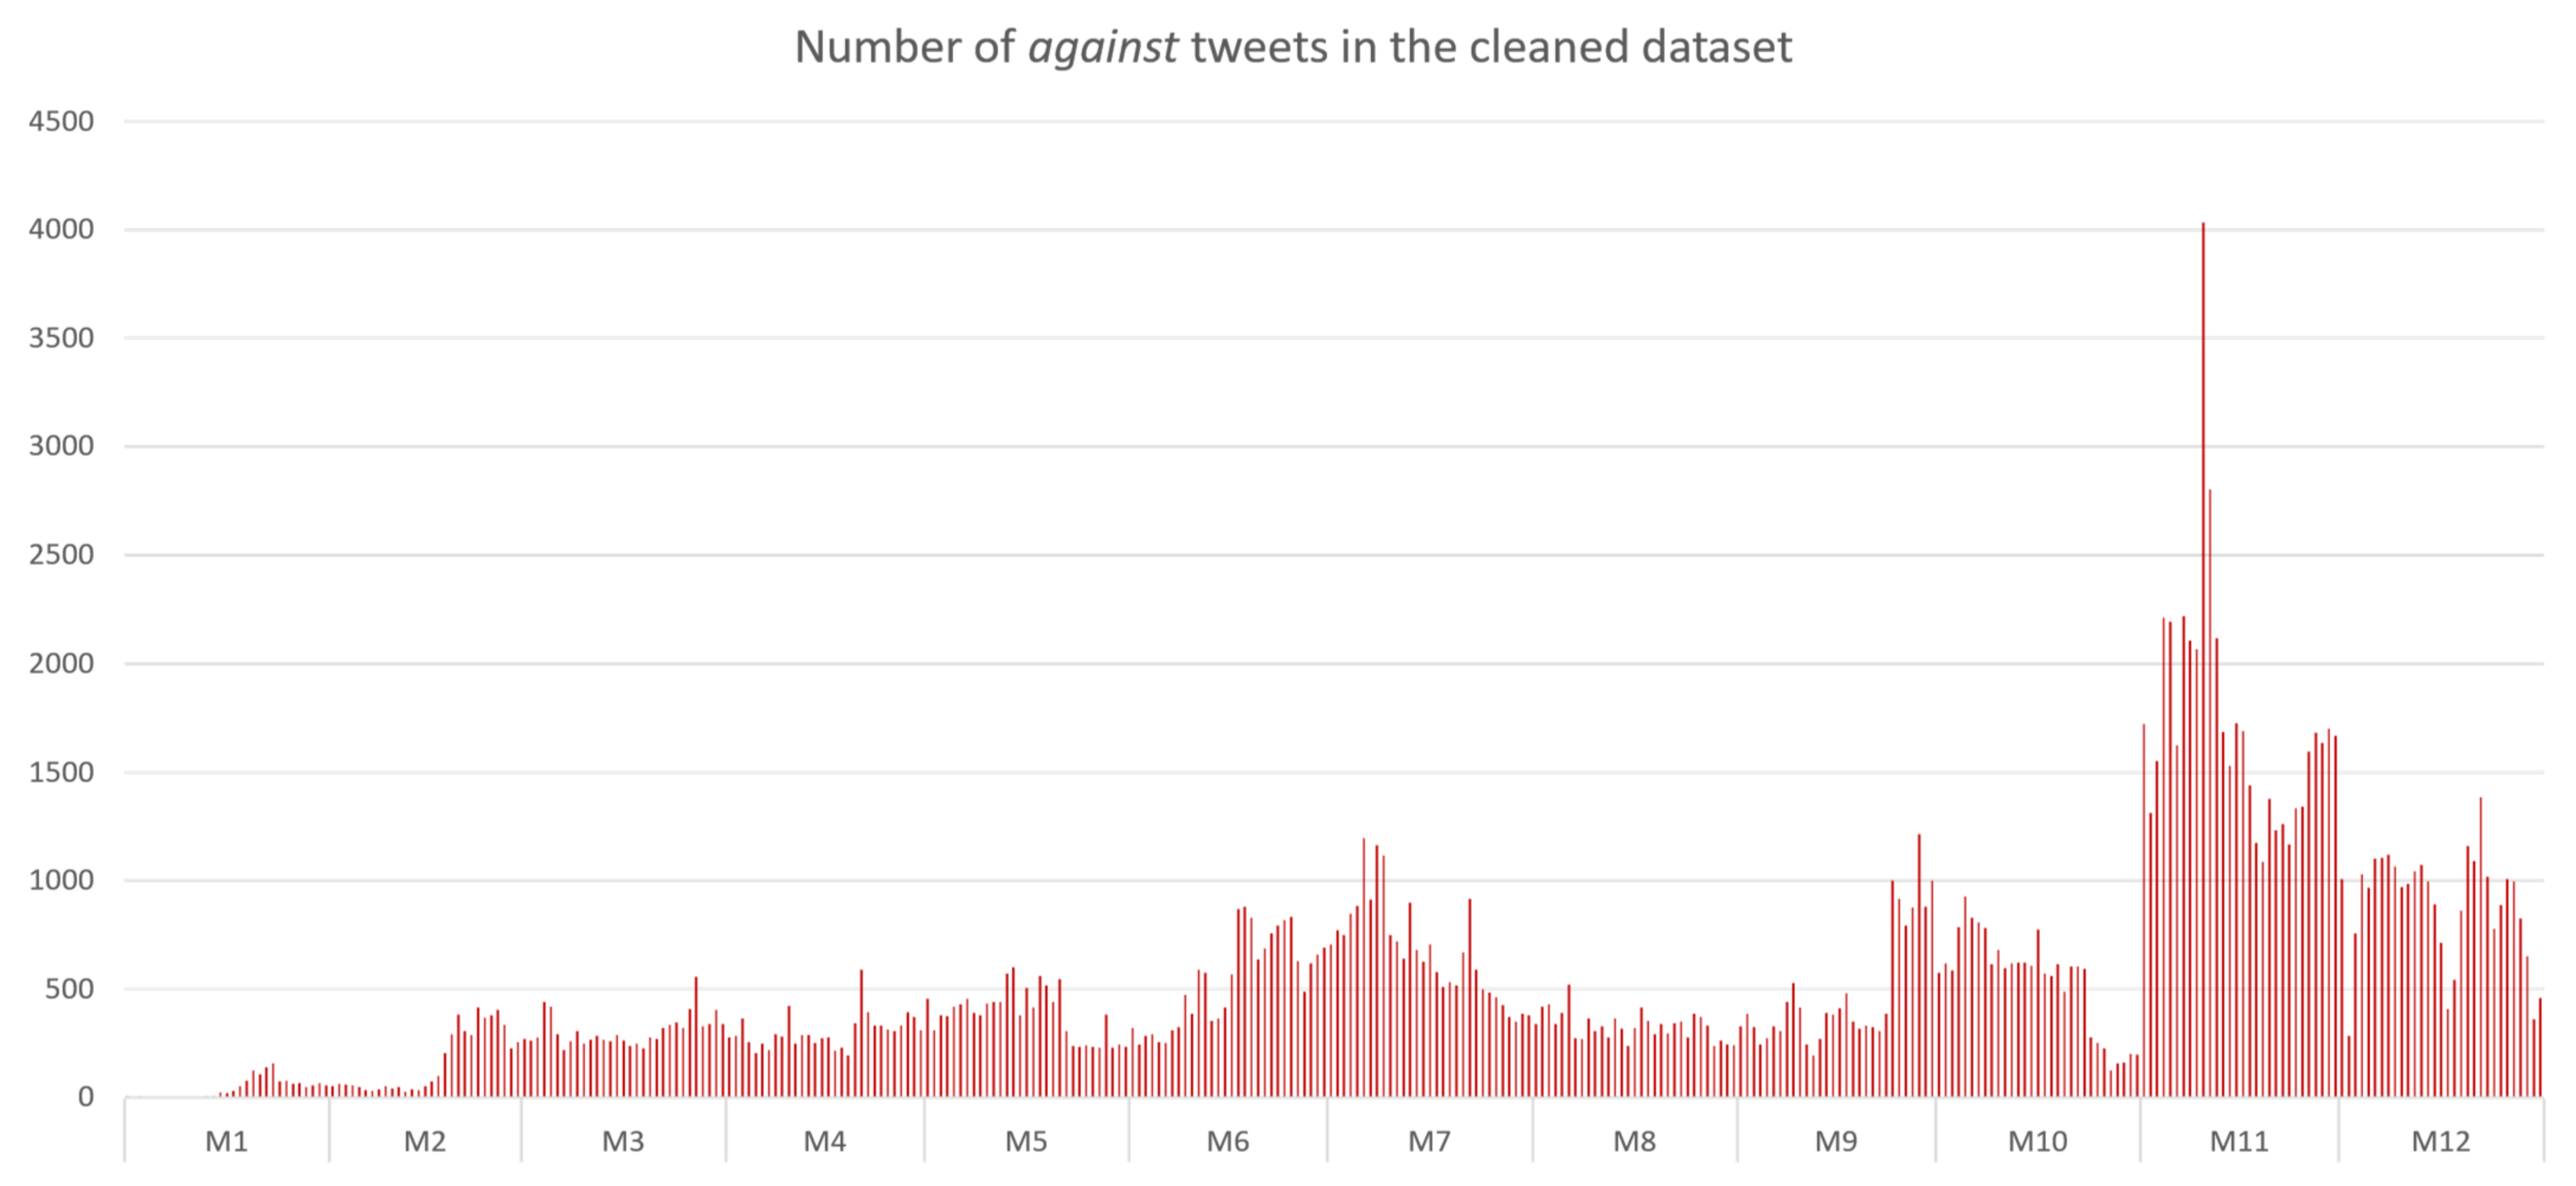
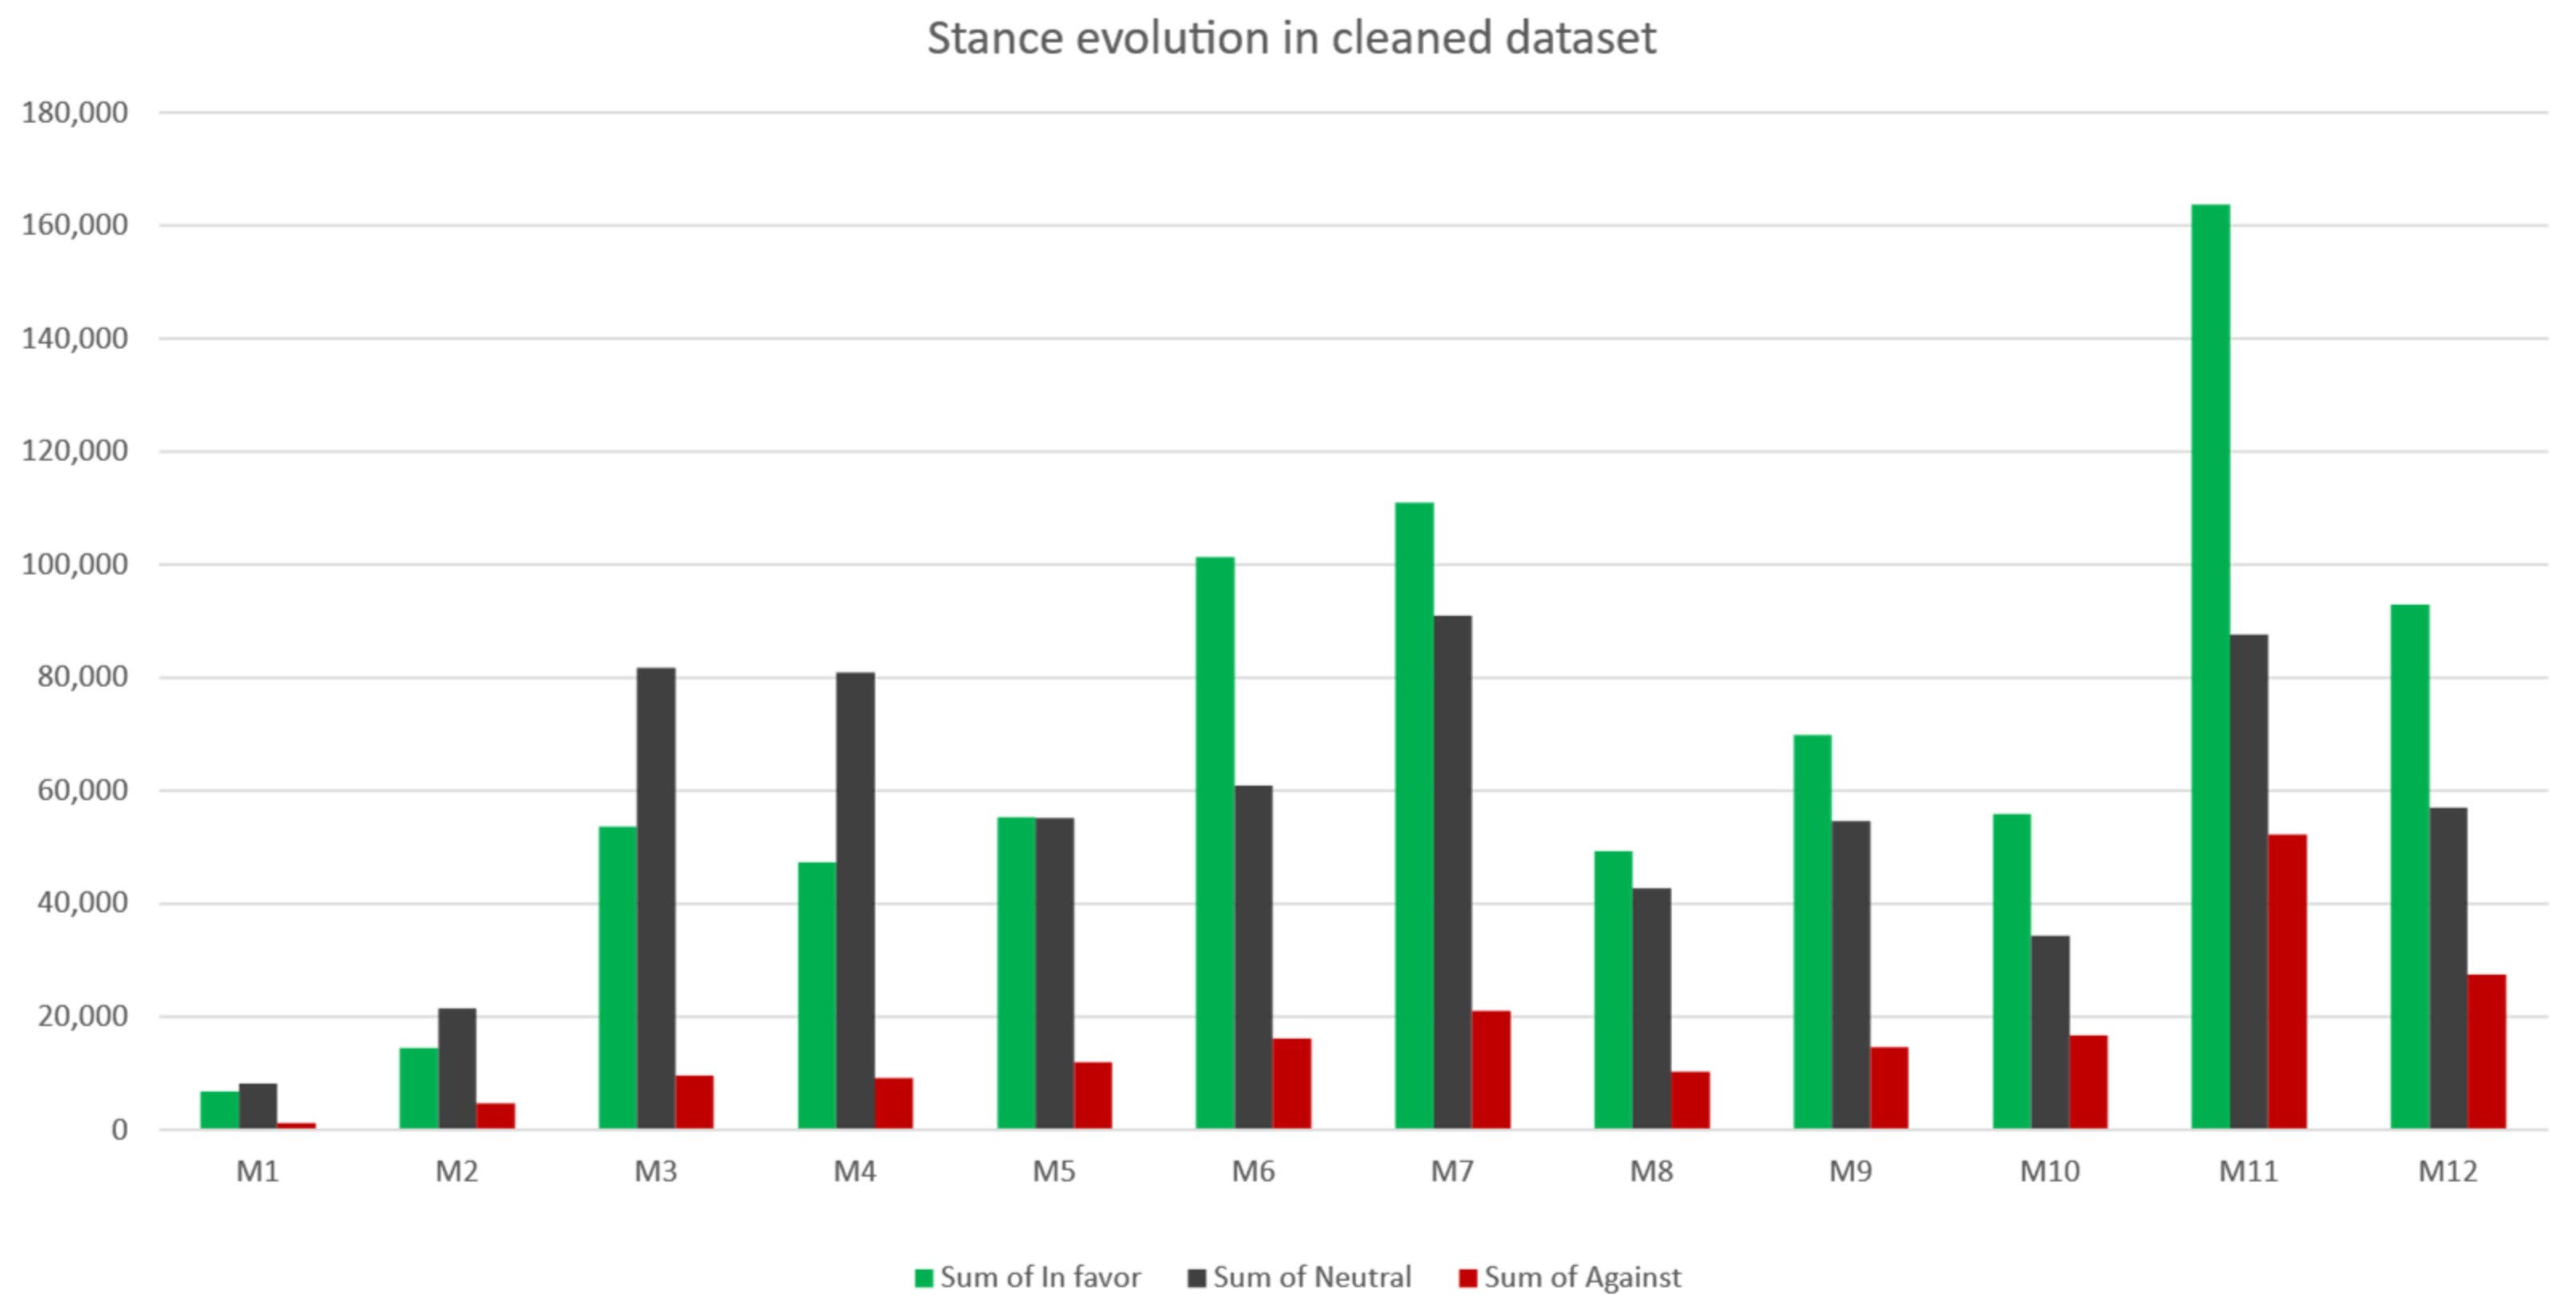
5.1. Mask Stance Detection on Cleaned Dataset

Considering the results of the stance analysis on the cleaned dataset, it has been determined that from the 1,692,437 tweets comprised in this set, the highest number of tweets have been encountered in the in favor category (821,522 tweets, representing 48.54%), followed by neutral (675,693 tweets, 39.92%) and against (195,222 tweets, 11.54%).
The daily evolution of the in favor tweets is depicted in Figure 3. It can be observed that the lowest number of in favor tweets was in the first month of the considered period (6779 tweets). Since then, the number of in favor tweets increased, reaching the highest value of posted tweets in M7 with 110,982. After this increase, in the following months, M8–M10, the number of in favor tweets stabilized, having an average of 58,329 tweets/month, while in M11, the number of in favor tweets increased to 163,672 tweets. For the last month considered in the analysis, M12, the number of in favor tweets decreased to 92,962.
The neutral tweets registered, as expected, the lowest number of tweets in M1 (8230 tweets), as shown in Figure 4, while the average number of neutral tweets in the following months was approximatively 60,678 tweets/month. Some of the months recorded an increased number of neutral tweets (above 80,000 tweets), such as M3, M4, M7 and M11.
Even in the case of the against tweets, the first month is characterized by the lowest number of tweets (1239 tweets), as shown in Figure 5. Starting with M5, the number of against tweets was above 10,000 tweets/month. The months with the higher number of against tweets were M11 (52,274 tweets), M12 (27,529 tweets) and M7 (21,020 tweets).
Figure 6 provides information related to the percentage of each opinion in the analyzed period for the cleaned dataset to increase the reader’s understanding.

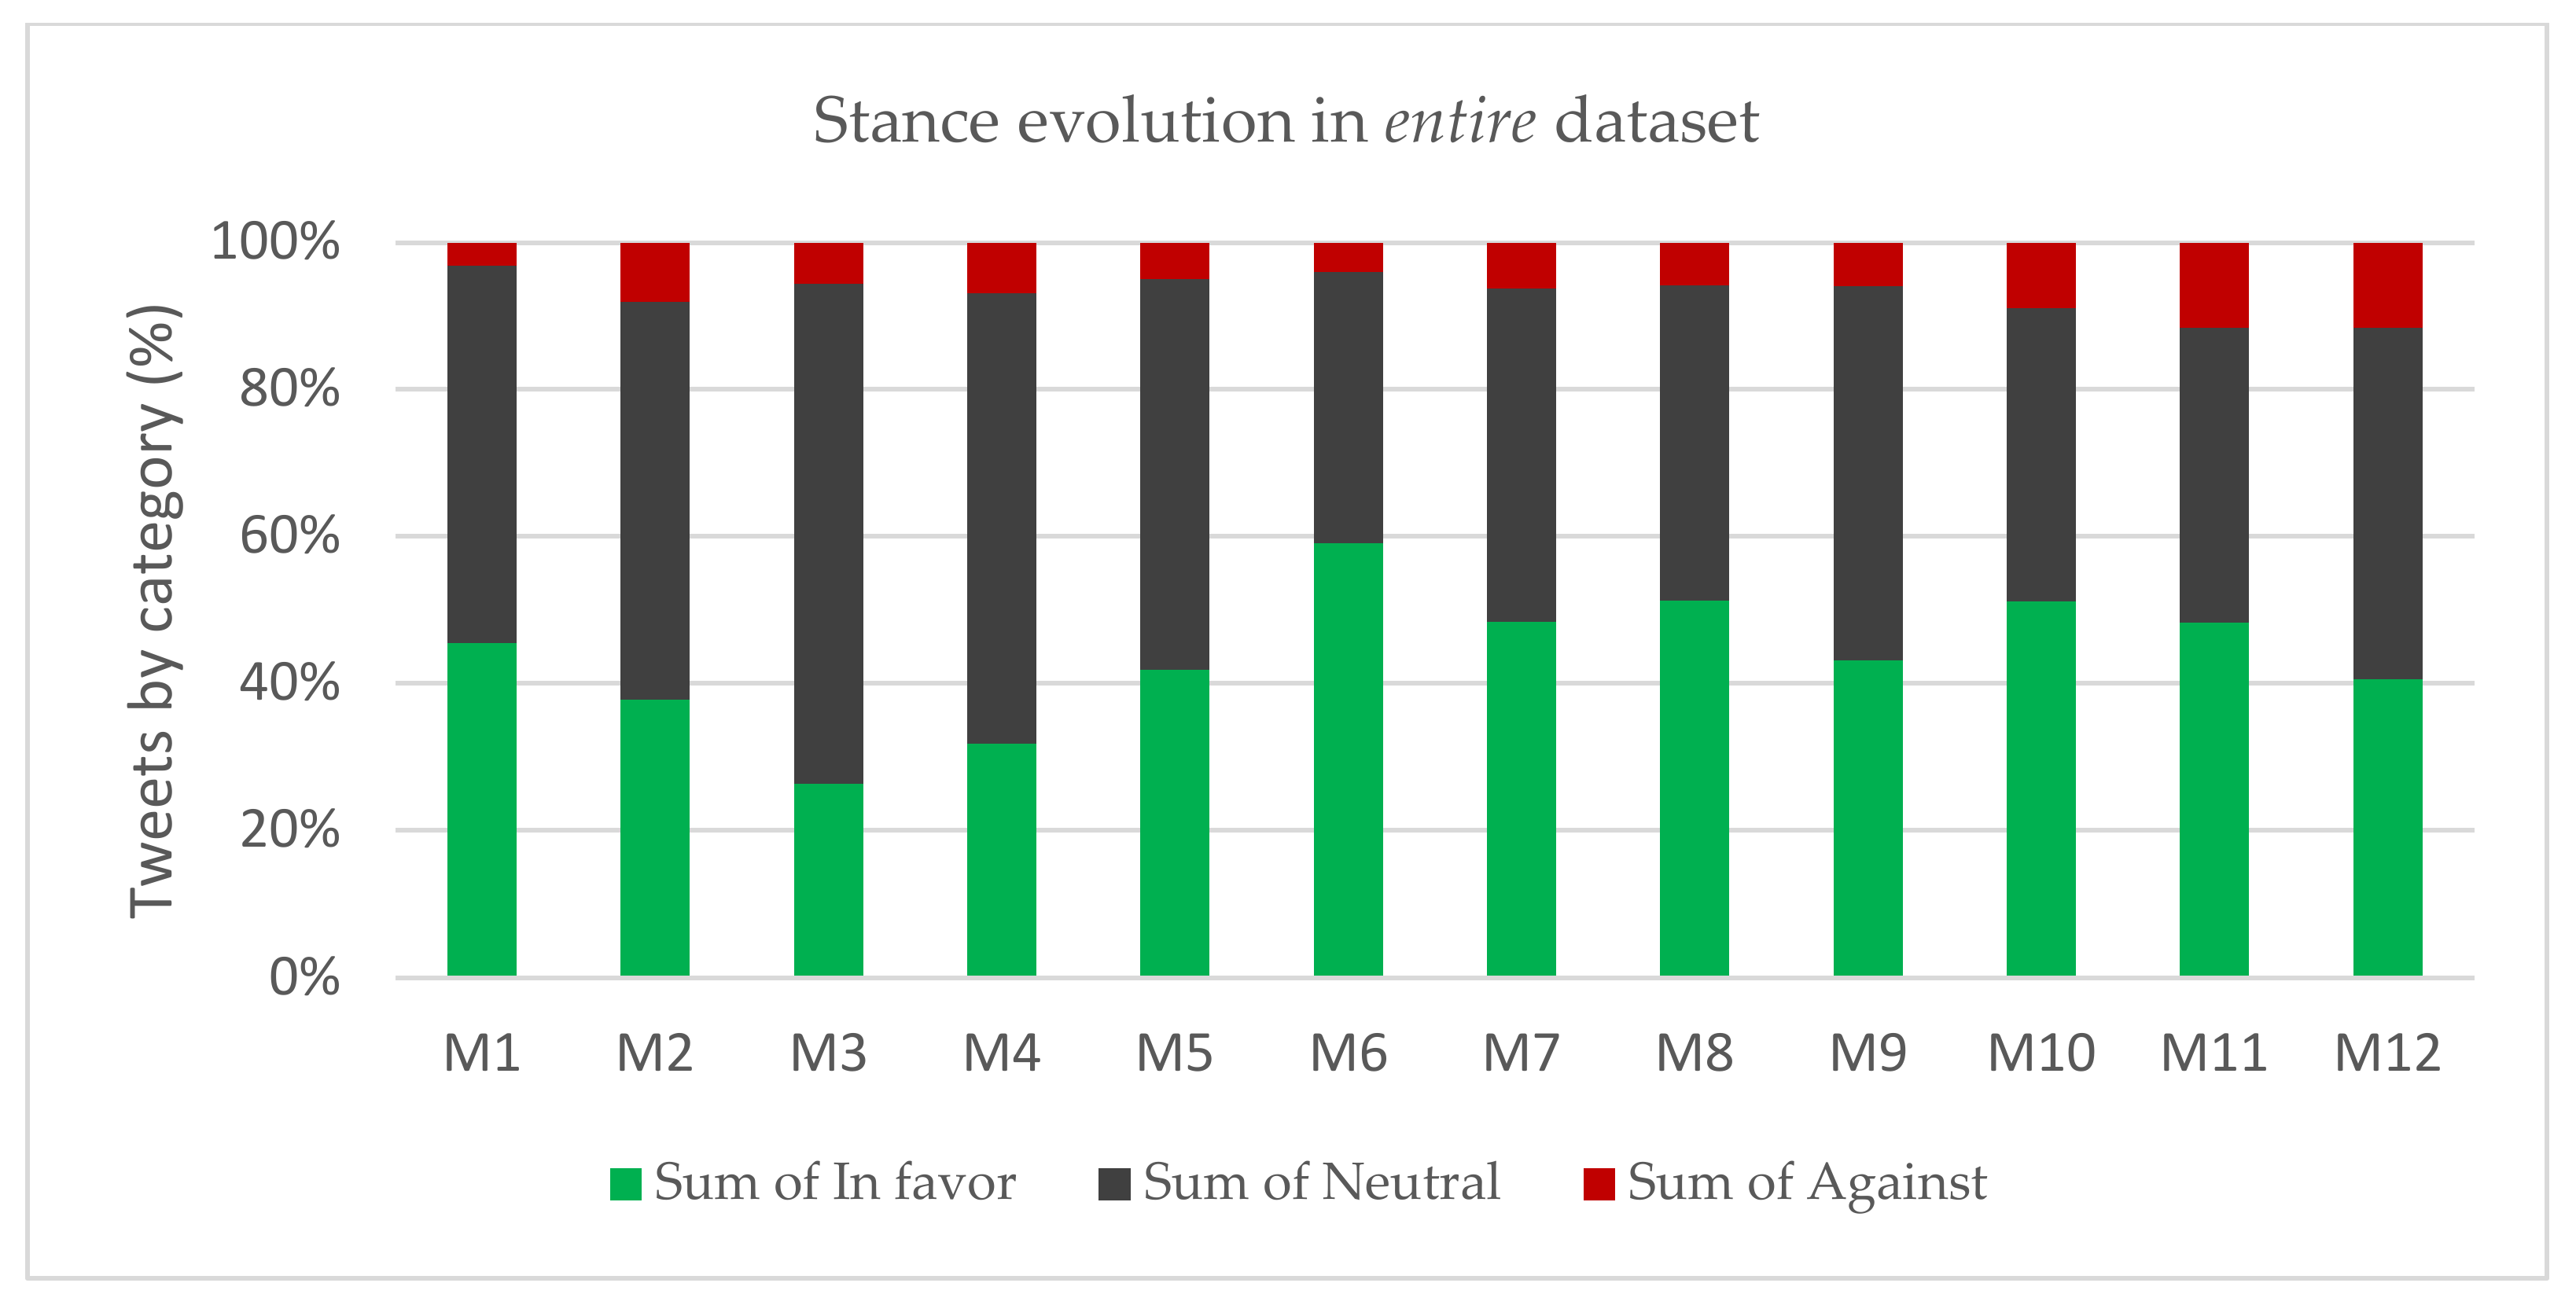
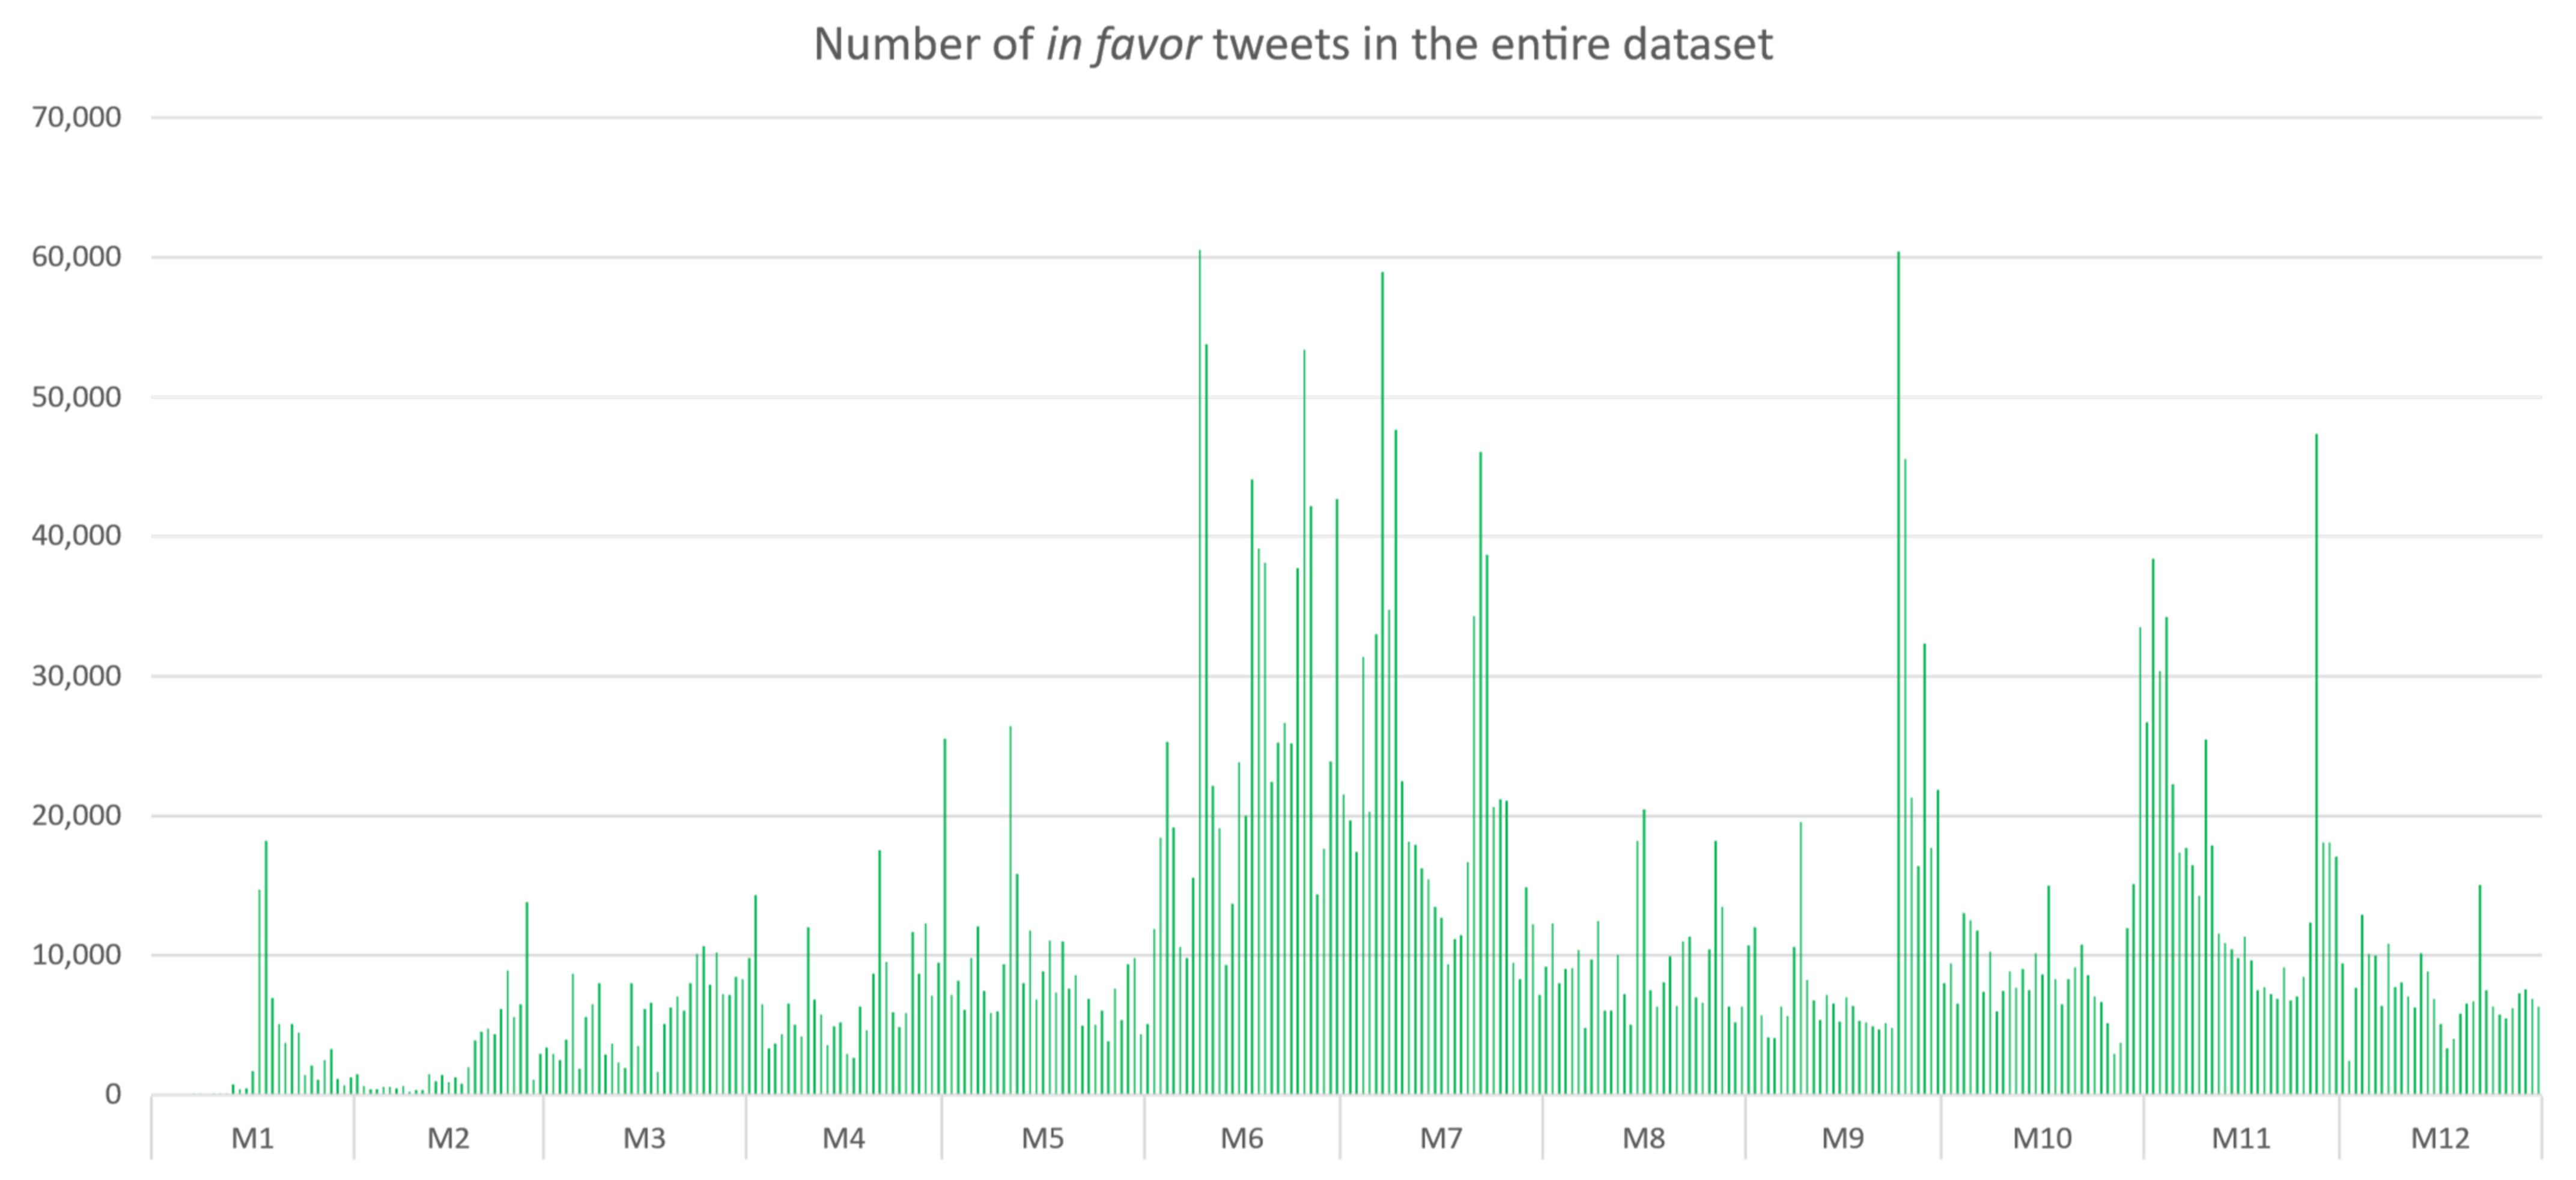
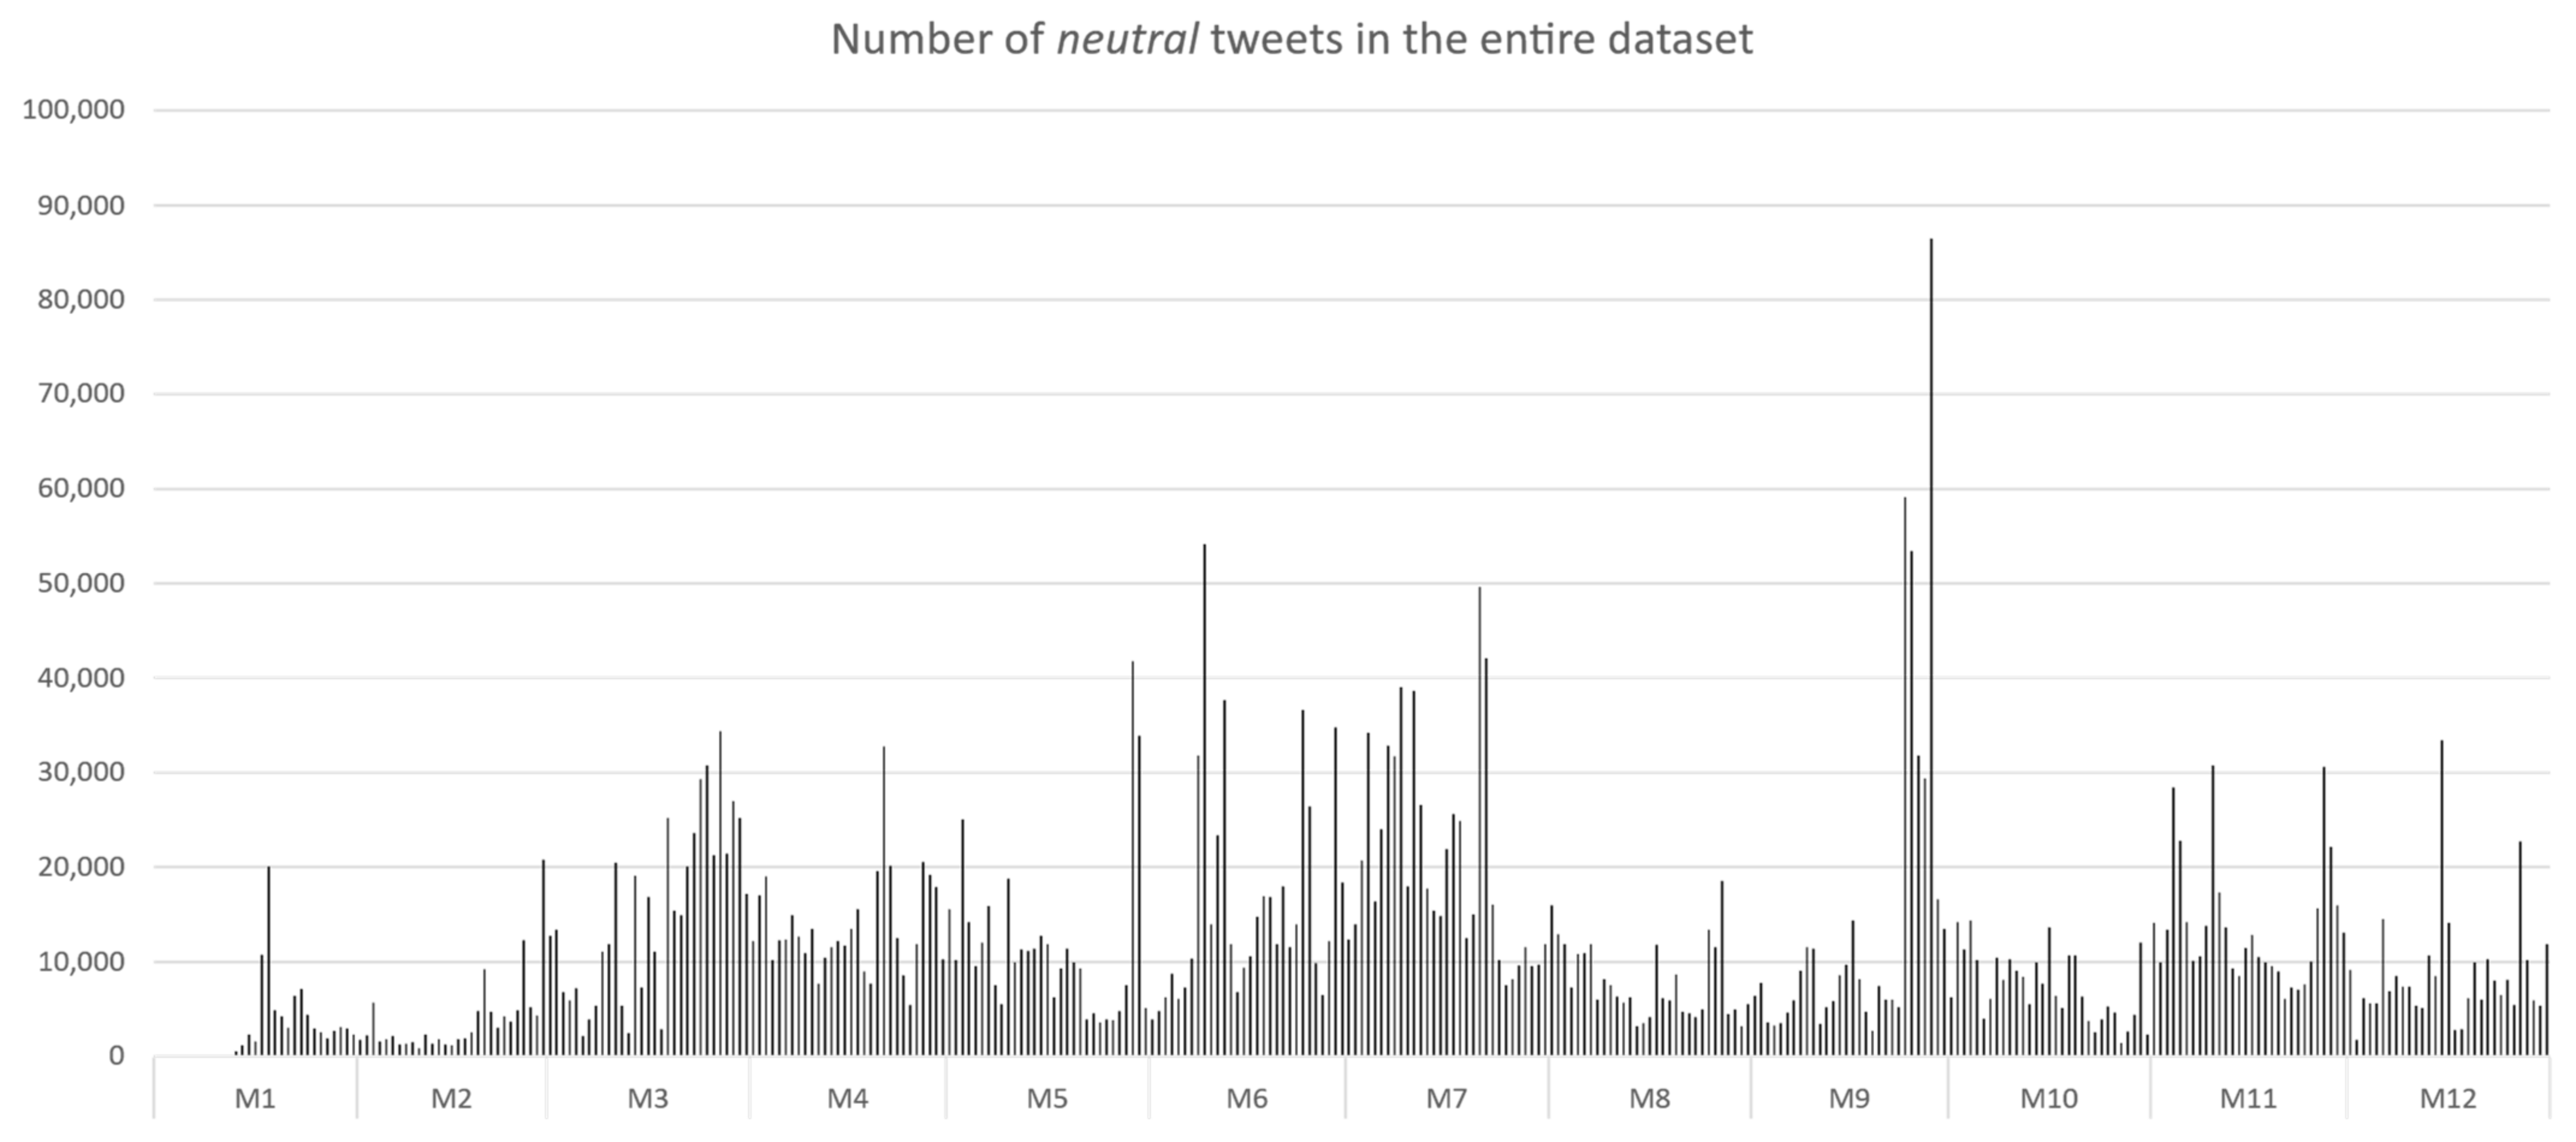
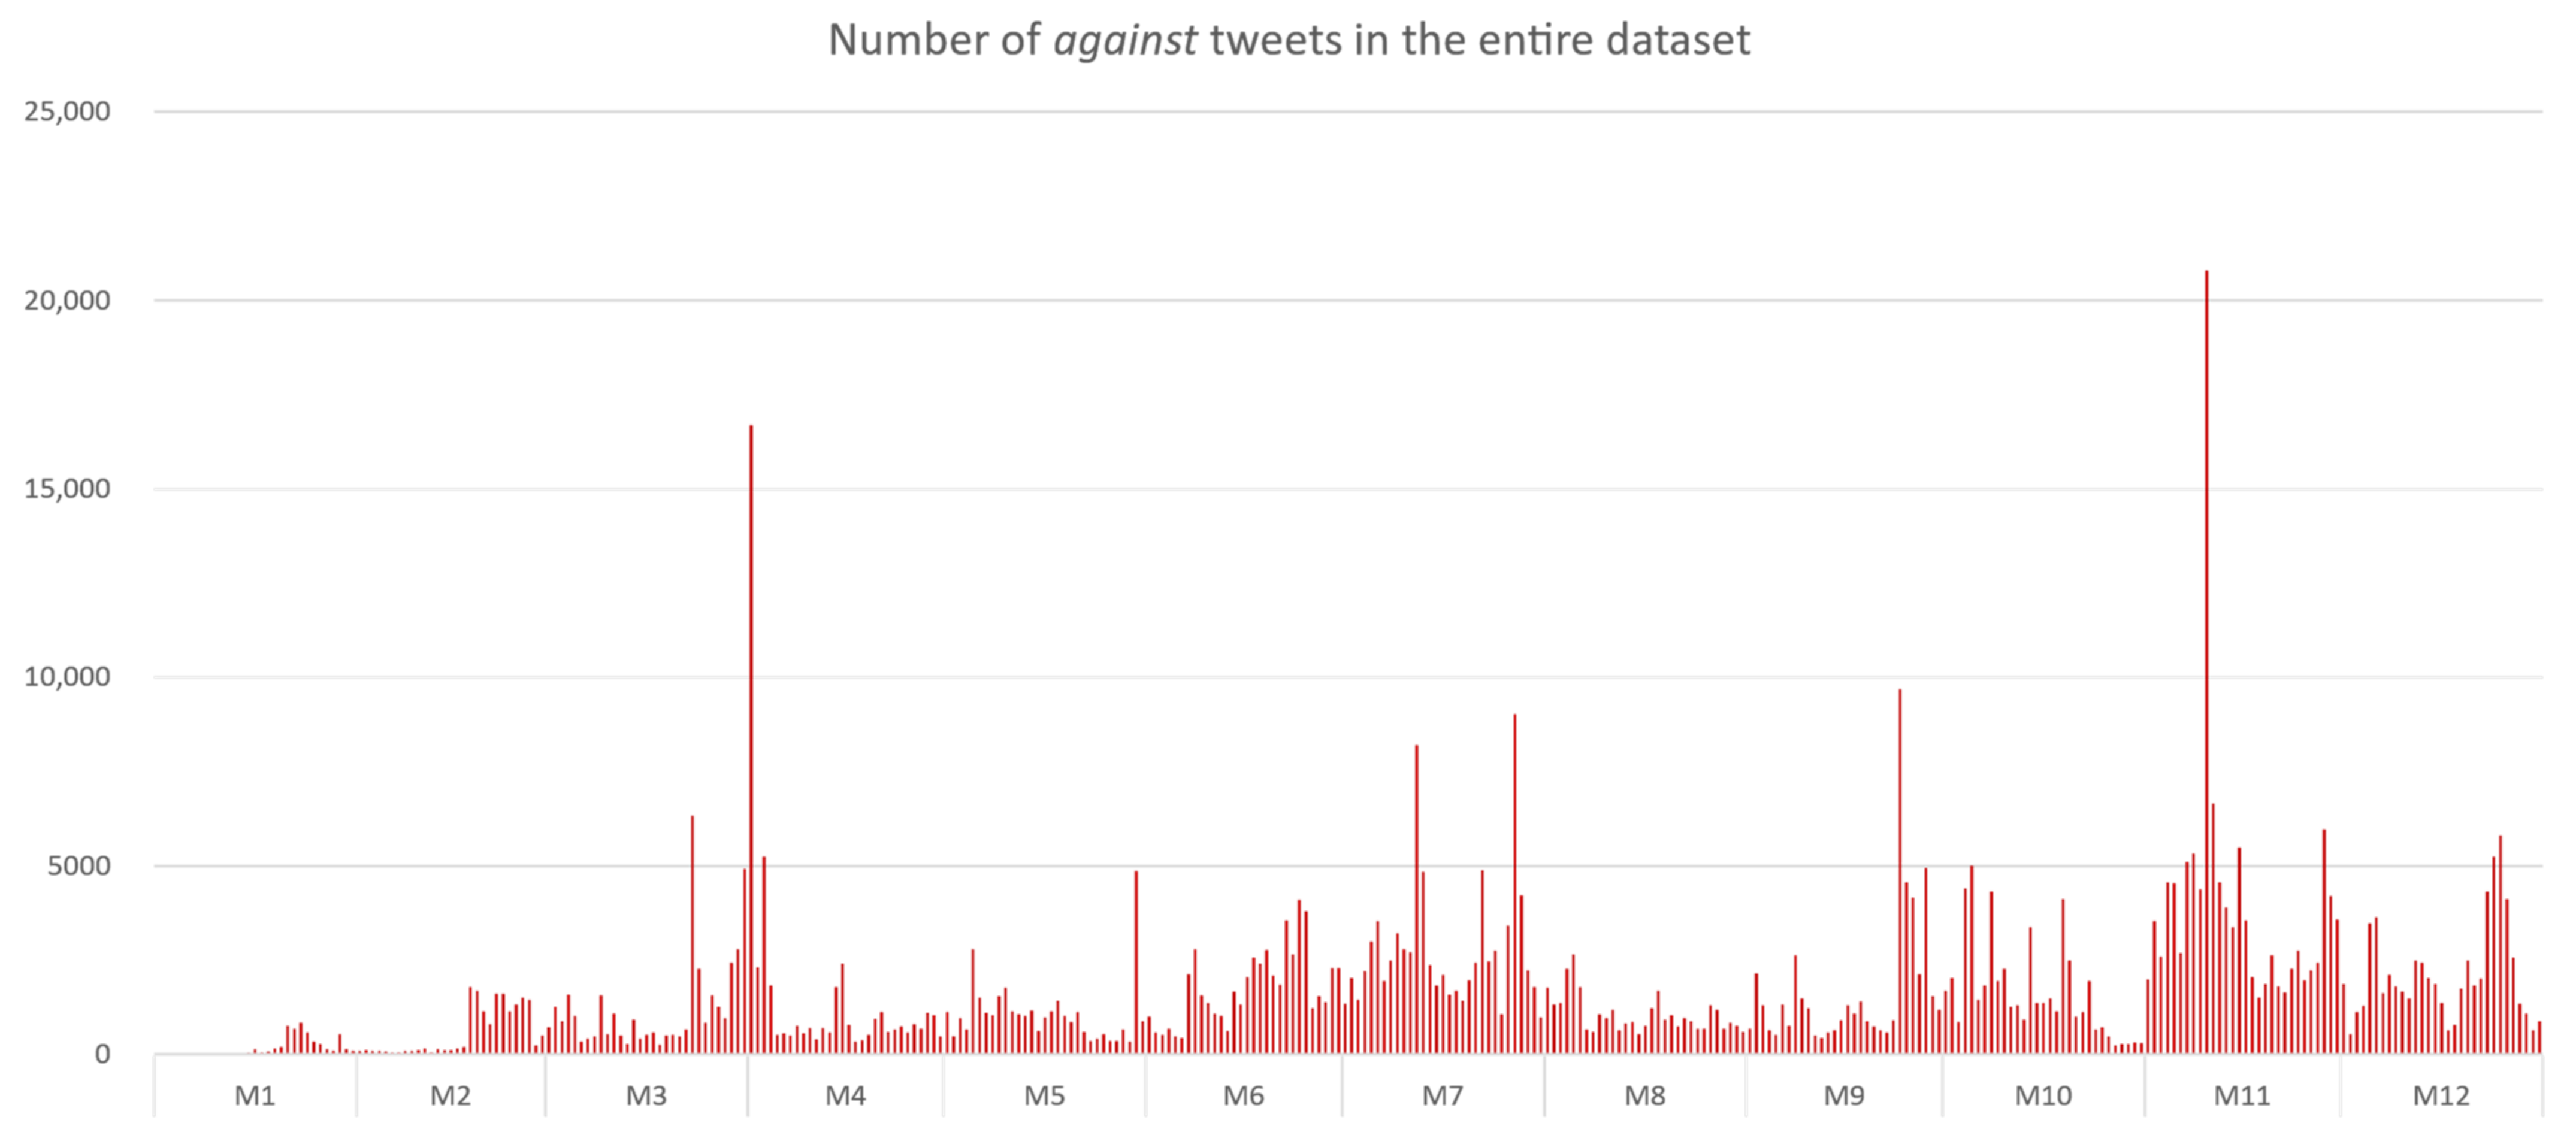
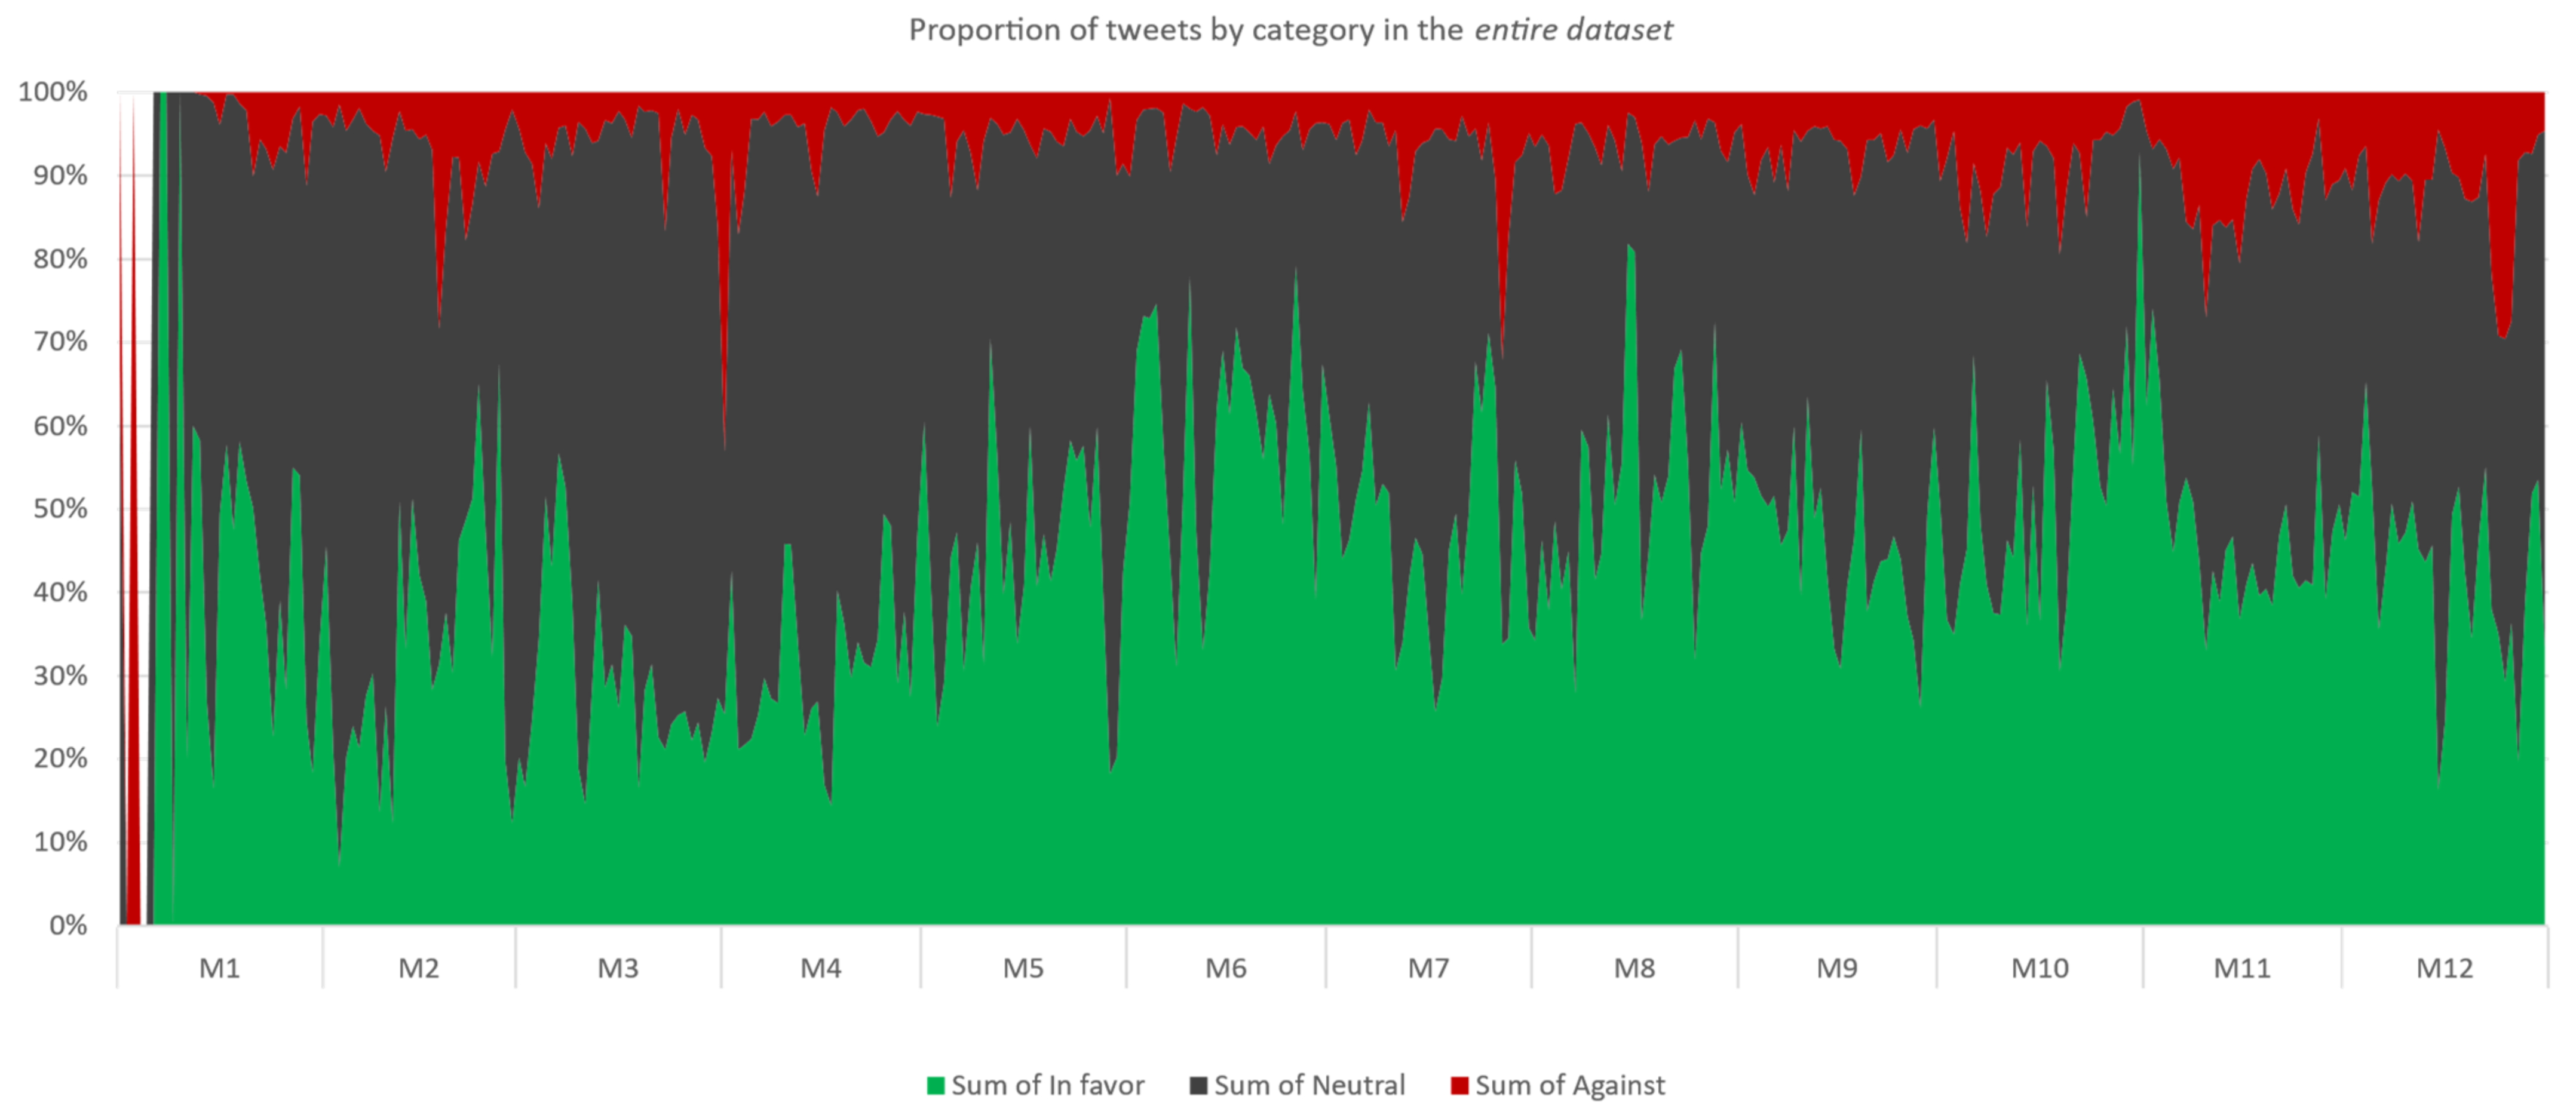
5.2. Mask Stance Detection on Entire Dataset

On the entire dataset, after performing the stance analysis, we can observe that most of the tweets are in the neutral category (4,184,300 tweets, representing 47.57%), followed by the in favor category (4,004,533 tweets, 45.53%) and the against category (606,800 tweets, 6.90%).
The daily evolution of the in favor tweets is presented in Figure 7. Based on the figure, it can be observed that the first two months considered have a comparable number of in favor tweets, being the lowest among the months in the analyzed period: M1 with 75,124 tweets and M2 with 77,650 tweets. The highest number of in favor tweets was recorded in M6 (791,092 tweets), M7 (683,752 tweets) and M11 (498,670 tweets)—the same months in which the number of in favor tweets in the cleaned dataset surpassed 100,000 tweets/month.
The evolution of the number of neutral tweets was smoother than in the case of in favor tweets in the entire datasetFigure 8, as in all the months (except for M7 with 641,830 tweets), the number of neutral tweets was under 500,000 tweets/month.
The against tweets evolution is depicted in Figure 9.
The highest number of against tweets has been recorded in M11 (120,035 tweets), representing 19.78% of the against tweets, followed by M7 (88,083 tweets), representing 14.52%, and M12 (66,362 tweets), representing 10.94%.
As observed even in the case of the against tweets in the cleaned dataset, the last months of the considered period have been characterized by an increase in the number of against tweets—approximatively one-third of the number of against tweets being recorded in M11 and M12.
The proportion per day of the tweets in each category is depicted in Figure 10.

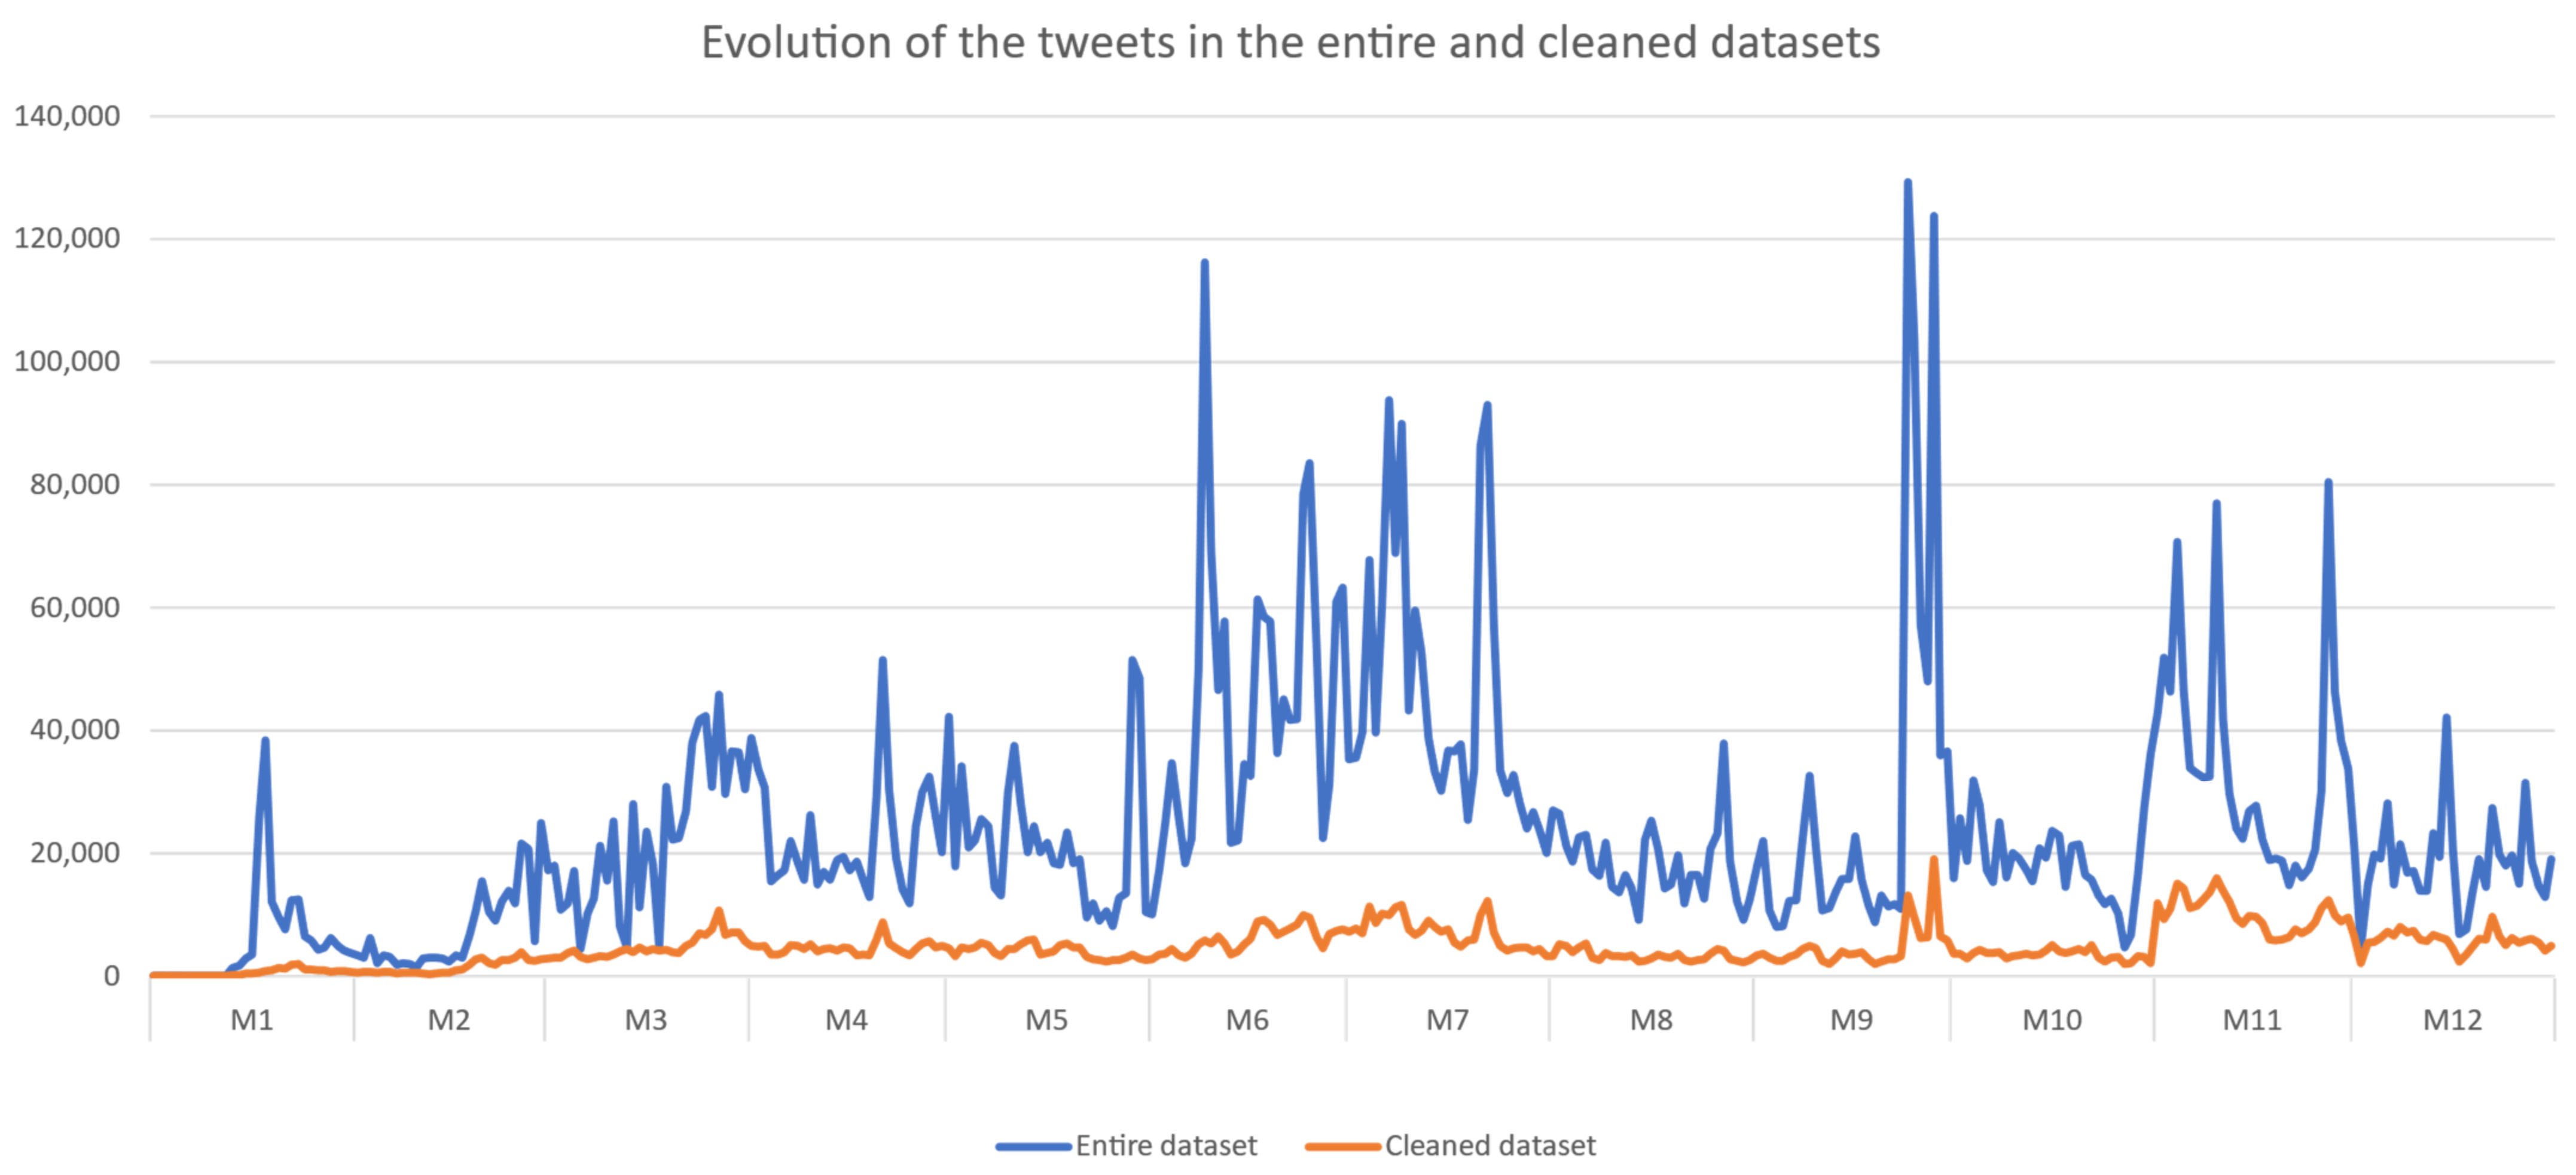
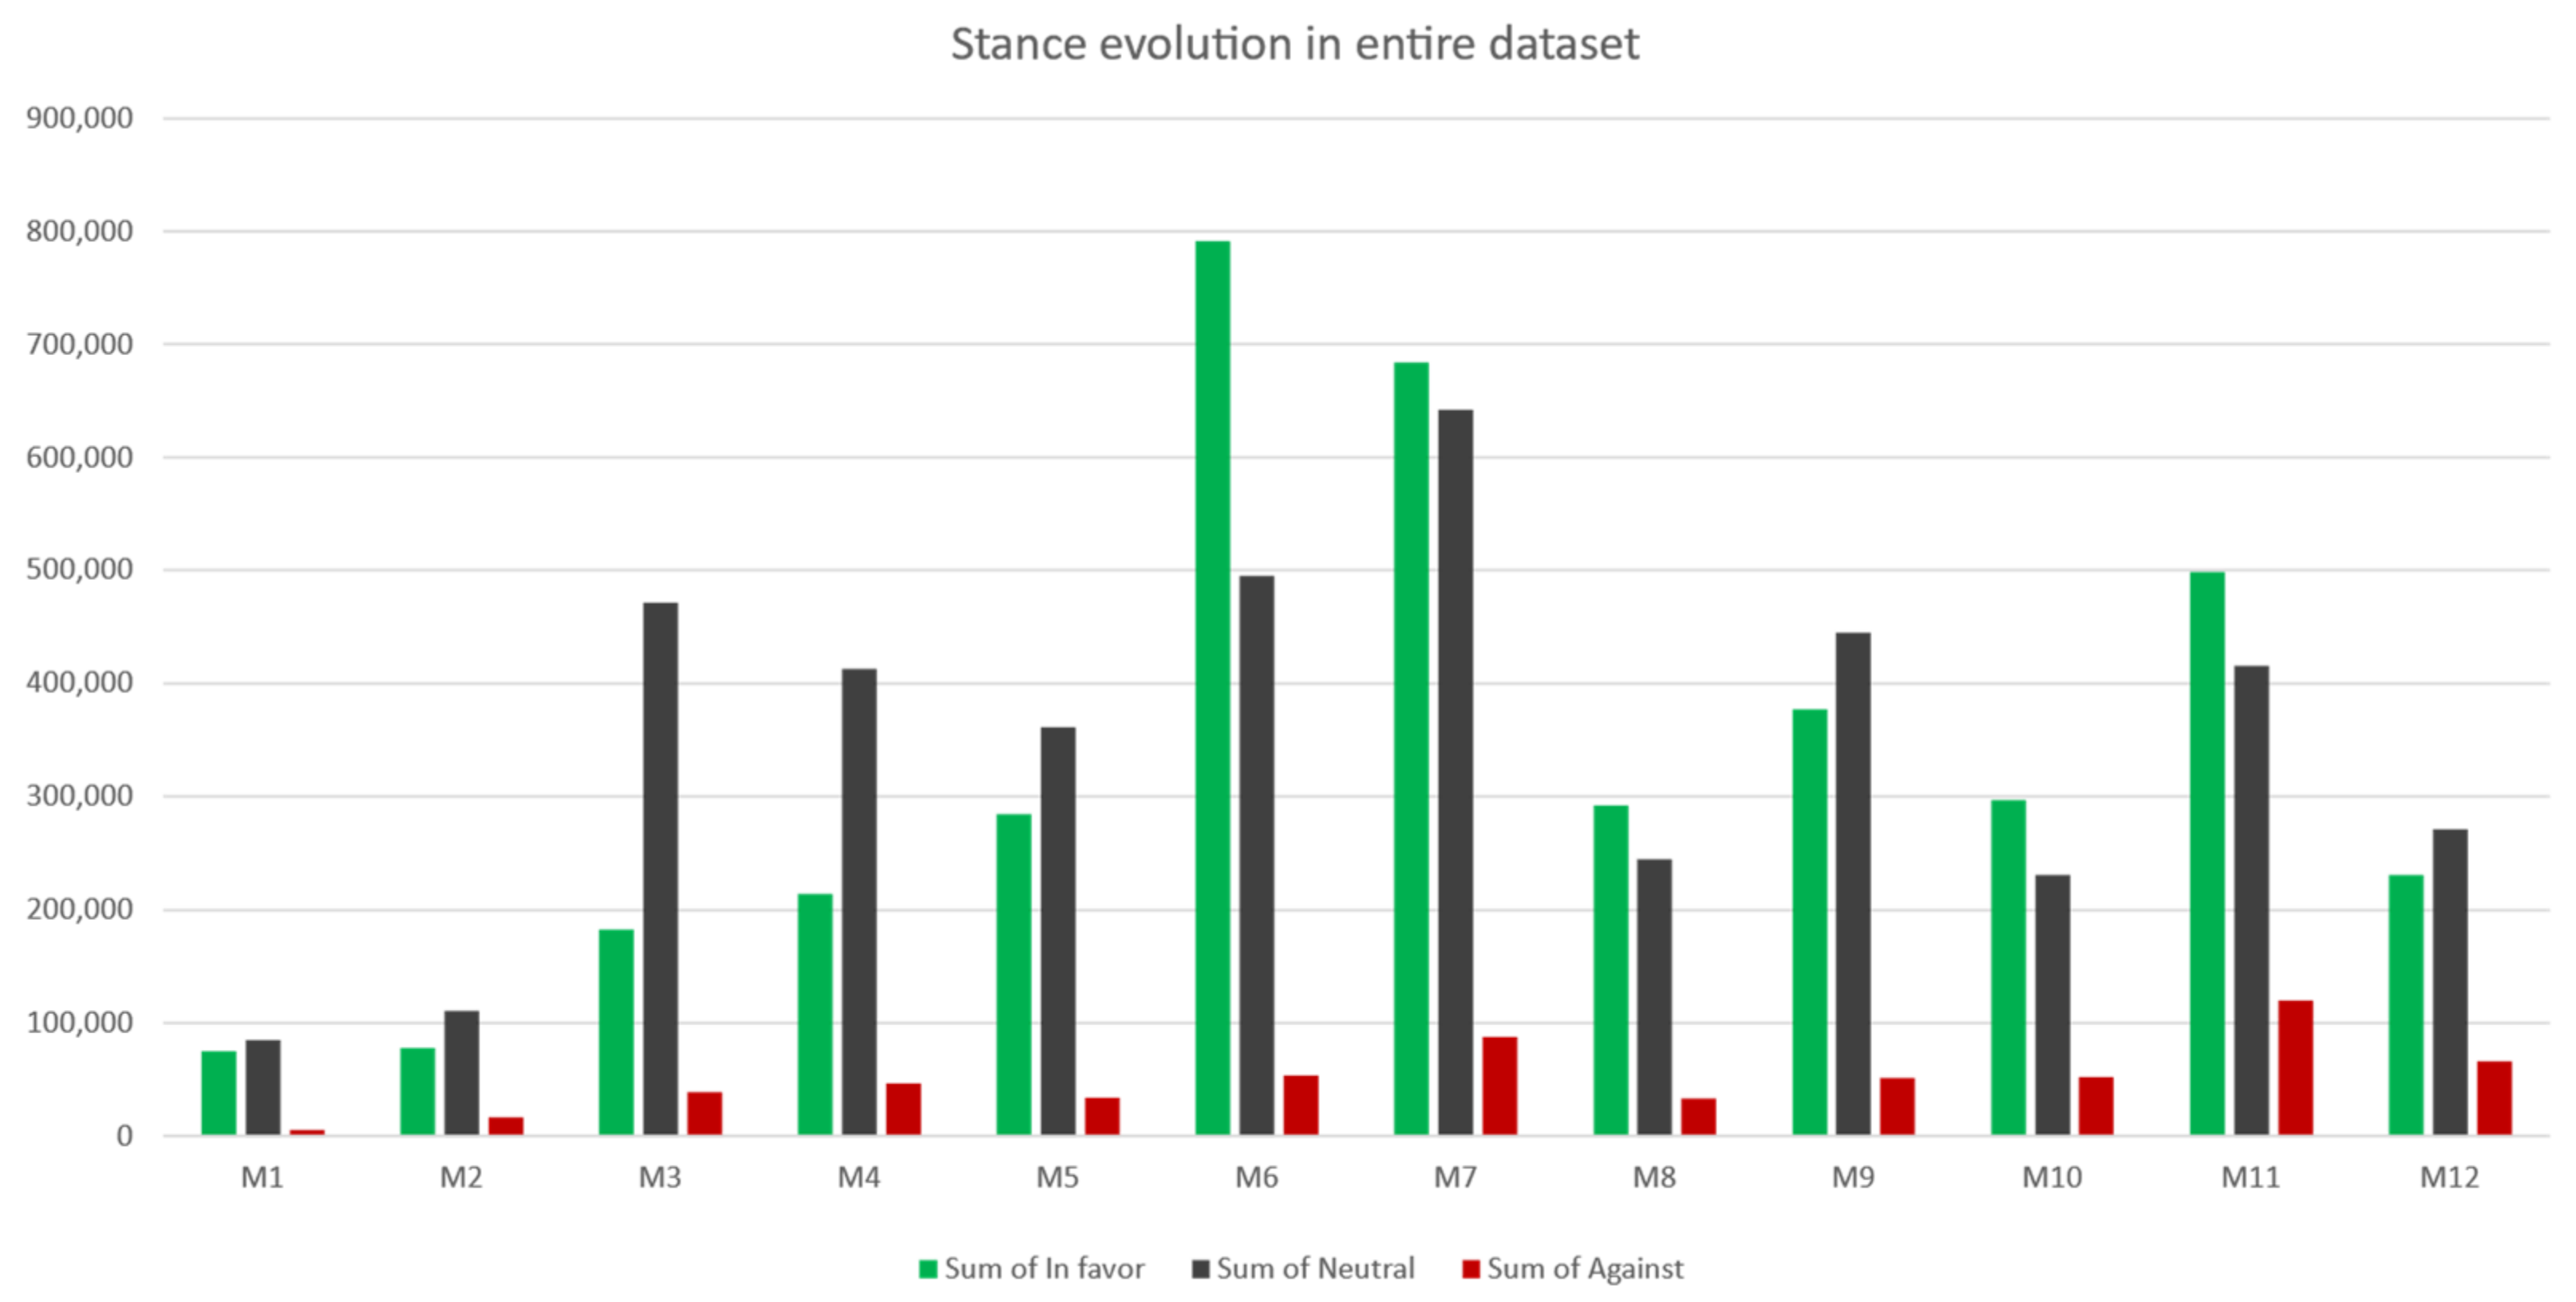
5.3. Mask Stance Detection Evolution in Both Cleaned and Entire Datasets

The evolution of the in favor, neutral and against tweets in the cleaned dataset is depicted in Figure 11, while the proportion of tweets by category in each month is presented in Figure A1. Based on the figure, it can be observed that in all the considered months, the number of the against tweets is the lowest in comparison with the other two considered categories, increasing in the last 2 months of the analyzed period.
As for the in favor and neutral tweets evolution, in the first 4 months of the analysis, the number of neutral tweets (192,409 tweets) exceeded the number of in favor tweets (122,224 tweets).
In M5, the number of in favor and neutral tweets is almost the same (55,317 vs. 55,228 tweets), while starting from M6, the number of in favor tweets (643,981 tweets) exceeds the number of neutral tweets (428,056 tweets).
Similar to the cleaned dataset, in the case of the entire dataset, the number of against tweets does not overpass the number of in favor and neutral tweets in none of the considered months—Figure 12. The proportion of tweets in the entire dataset by category in each month is presented in Figure A2.
Furthermore, it can be observed that the number of neutral tweets is above the number of the in favor tweets in most of the months, except for M6, M7, M8, M10 and M11.

6. Analyzing Mask-Wearing Opinions

As in the tweets’ stance detection, periods with increased activity have been identified; in this section, these periods have been extracted and analyzed along with the days with the highest number of in favor, neutral and against tweets.
In order to perform this analysis, the tweets from the cleaned dataset have been considered. For the selected periods and days, the news posted online has been extracted using the “News” section provided by Google. The list of news in each period or day has been refined by searching the keywords “COVID” and “mask”. The most important news has been put in connection with the stance of the tweets in the periods and days taken into account. Additionally, an n-gram analysis has been performed for validating that the selected news is representative for the respective period.

6.1. Periods with High Tweet Activity

In order to identify the periods with high tweets activity, an analysis has been performed on the cleaned dataset. As a result, the periods with an average of more than 9500 tweets/day have been selected. For determining the start/end day of the period to be selected, an additional constraint has been imposed, namely the number of tweets in the start and end day to be higher than 9500 tweets. In the case in which the imposed constraints are met for a day but not for any previous or following days in the analyzed dataset, the period will include only that day.
A total of eight periods (noted with Pi, i = 1, …, 8) have been identified that match the imposed constraints. These periods are analyzed in the following.

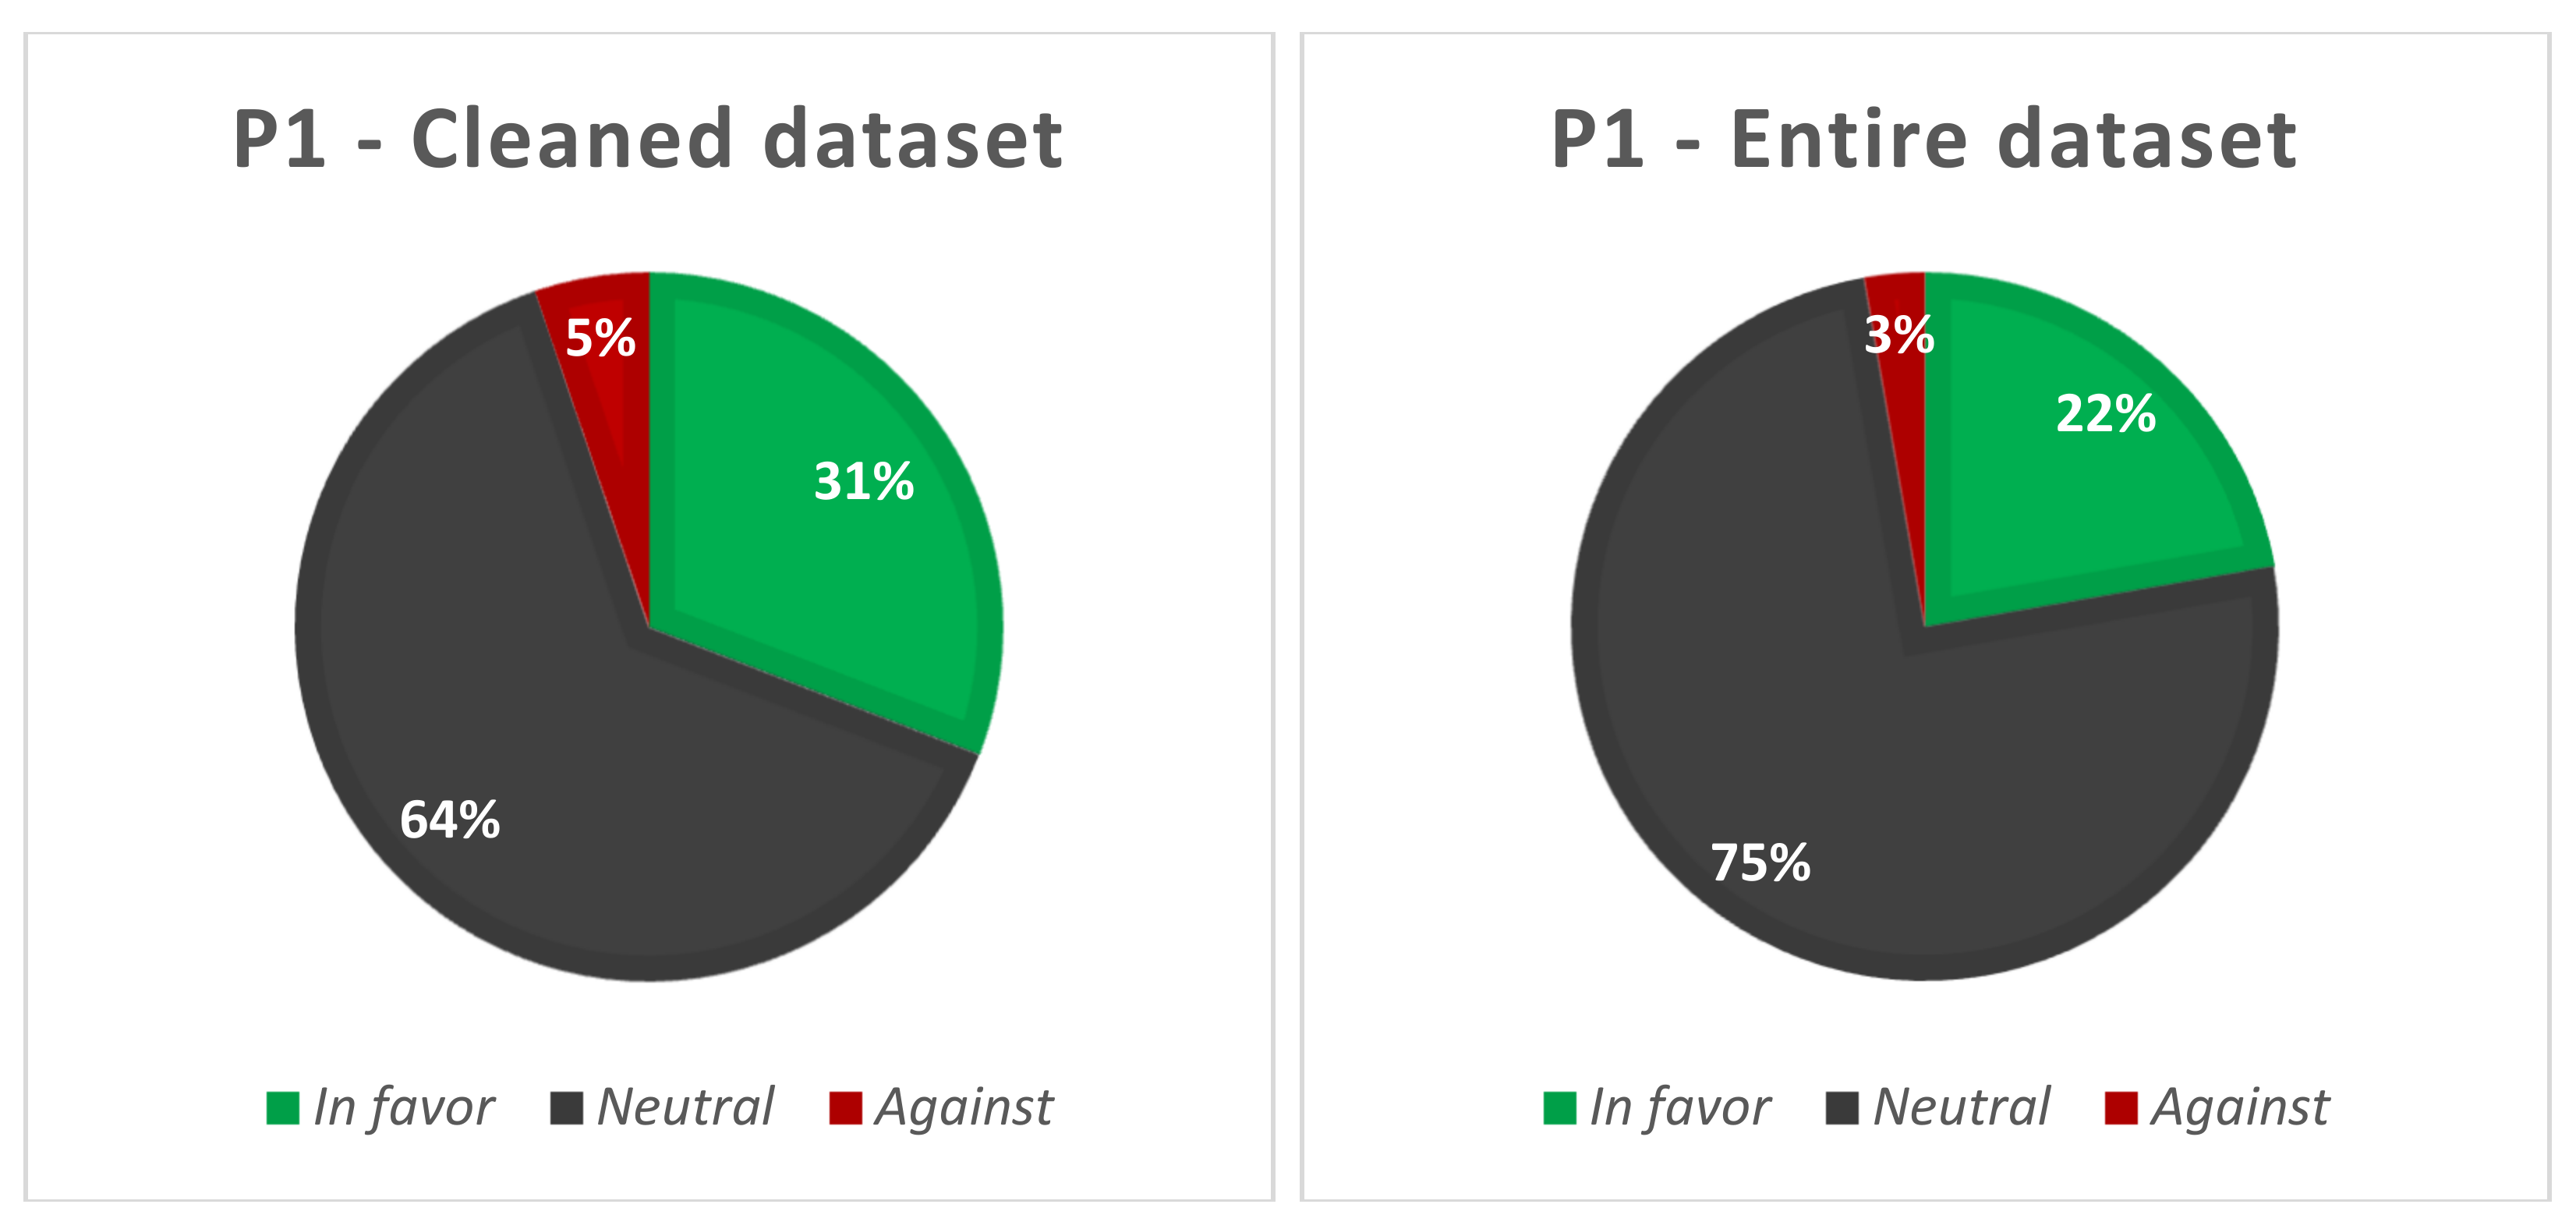
6.1.1. P1: 4 April 2020

The first considered period consists of a single day, April 4, 2020, in which there are 10,704 tweets reported in the cleaned dataset. As for the entire dataset, a number of 45,853 tweets have been collected. The proportion of the tweets expressing each of the considered three stances can be observed in Figure 13.
Based on the information in Figure 13, it can be observed that in this period, most of the tweets are in the neutral category—64% in the cleaned dataset and 75% in the entire dataset.
The proportion of in favor tweets has represented almost one-third of the tweets included in the cleaned dataset (31%), while in the entire dataset, which also contains the retweets, the percentage has been smaller (22%). Only 5% of the tweets in the cleaned dataset and 3% of the tweets in the entire dataset have been classified in the against category.
The main news on this date was related to the accusations made by Germany, according to which the U.S. was involved in “face mask piracy” (https://www.ft.com/content/bb52e108-a345-4278-8e72-f1c20e010cda, accessed on 11 April 2021). This is supported by the n-gram analysis, in which it was found that the most frequent trigram was “accused modern piracy” referred to 585 times, followed by “modern piracy diversion”, which was mentioned 568 times. The most frequent 4-g was “accused modern piracy diversion” mentioned 565 times, followed by “modern piracy diversion mask”, which appeared 564 times.
Given the informative nature of this news, it was expected that the number of tweets in the neutral category to be higher than the tweets in the other two categories (in favor and against) as the news was not containing any new information regarding the advantages or disadvantages of mask-wearing in times of COVID-19 pandemic.

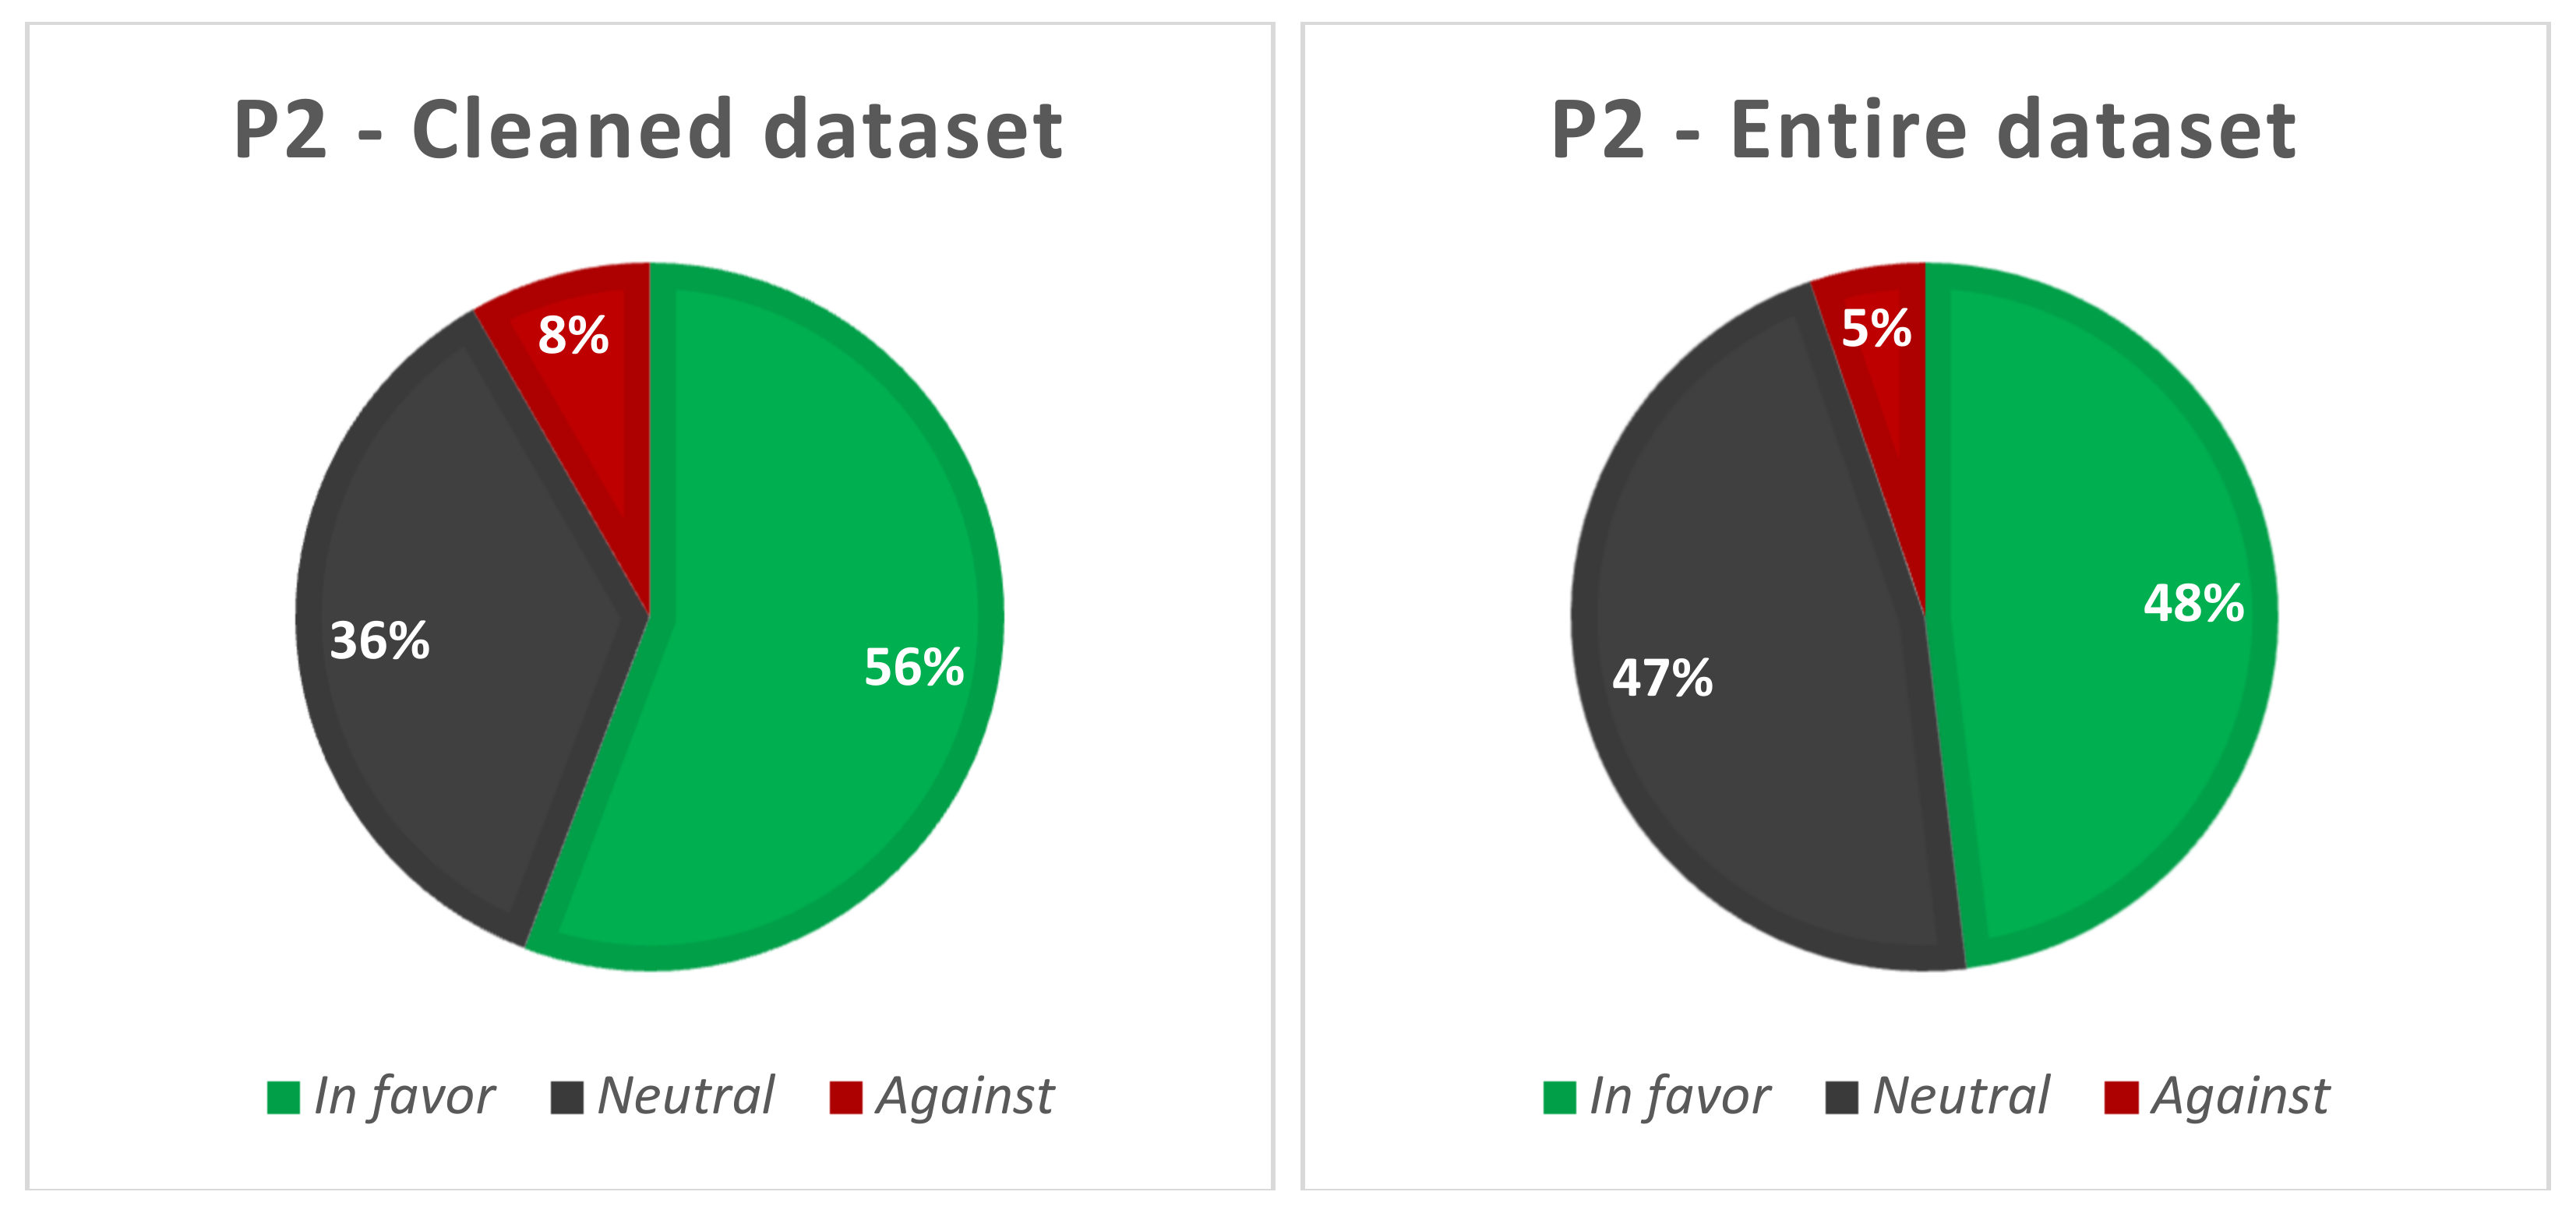
6.1.2. P2: 2 July 2020

The second period considered in the analysis is composed from a single day, July 2, 2020, when 9845 tweets have been recorded for the cleaned dataset, with 1550 tweets more than the previous day, and 78,461 for the entire dataset, with 36,647 more tweets than the previous day.
In terms of stances, it has been observed that in the cleaned dataset, most of the tweets posted in this day are in the in favor category (56%), while 36% are in neutral and 8% in the against category, as shown in Figure 14.
As for the entire dataset, the proportion between the in favor and neutral tweets is almost the same (48% vs. 47%), while the against tweets only represent 5%.
Looking for the news posted in this period, it shall be mentioned that the main news revolved around President Donald Trump’s gradual acceptance of mask-wearing (https://edition.cnn.com/2020/07/02/politics/donald-trump-coronavirus-masks-politics-joe-biden-election-2020/index.html, accessed on 11 April 2021) and how this could affect his reelection chances. The news discussed the mask-wearing option of President Donald Trump from both a political and medical point of view, making, in most of the cases, a comparison with the point of view of his counter-candidate, Joe Biden, who publicly admitted that, if elected, he would mandate mask-wearing nationally.
By extracting the most frequent 4-g from the cleaned tweets recorded for 2 July 2020, it can be observed that the “anti mask crusade coming” has been referenced 218 times, followed by “mask crusade coming back” mentioned 218 times, followed, in turn, by “trump anti mask crusade” mentioned 211 times, confirming that the spike in the number of tweets has been due to the selected news.
Compared to the previous period, P1, a shift between the in favor and neutral tweets has been observed. In P2, the users have tried more to present their opinion regarding mask-wearing and its advantages when posting on Twitter rather than sharing the news associated with this period. As a result of the increase in the in favor messages, it can be observed that even the against group has become “more vocal”, standing for its points of view.

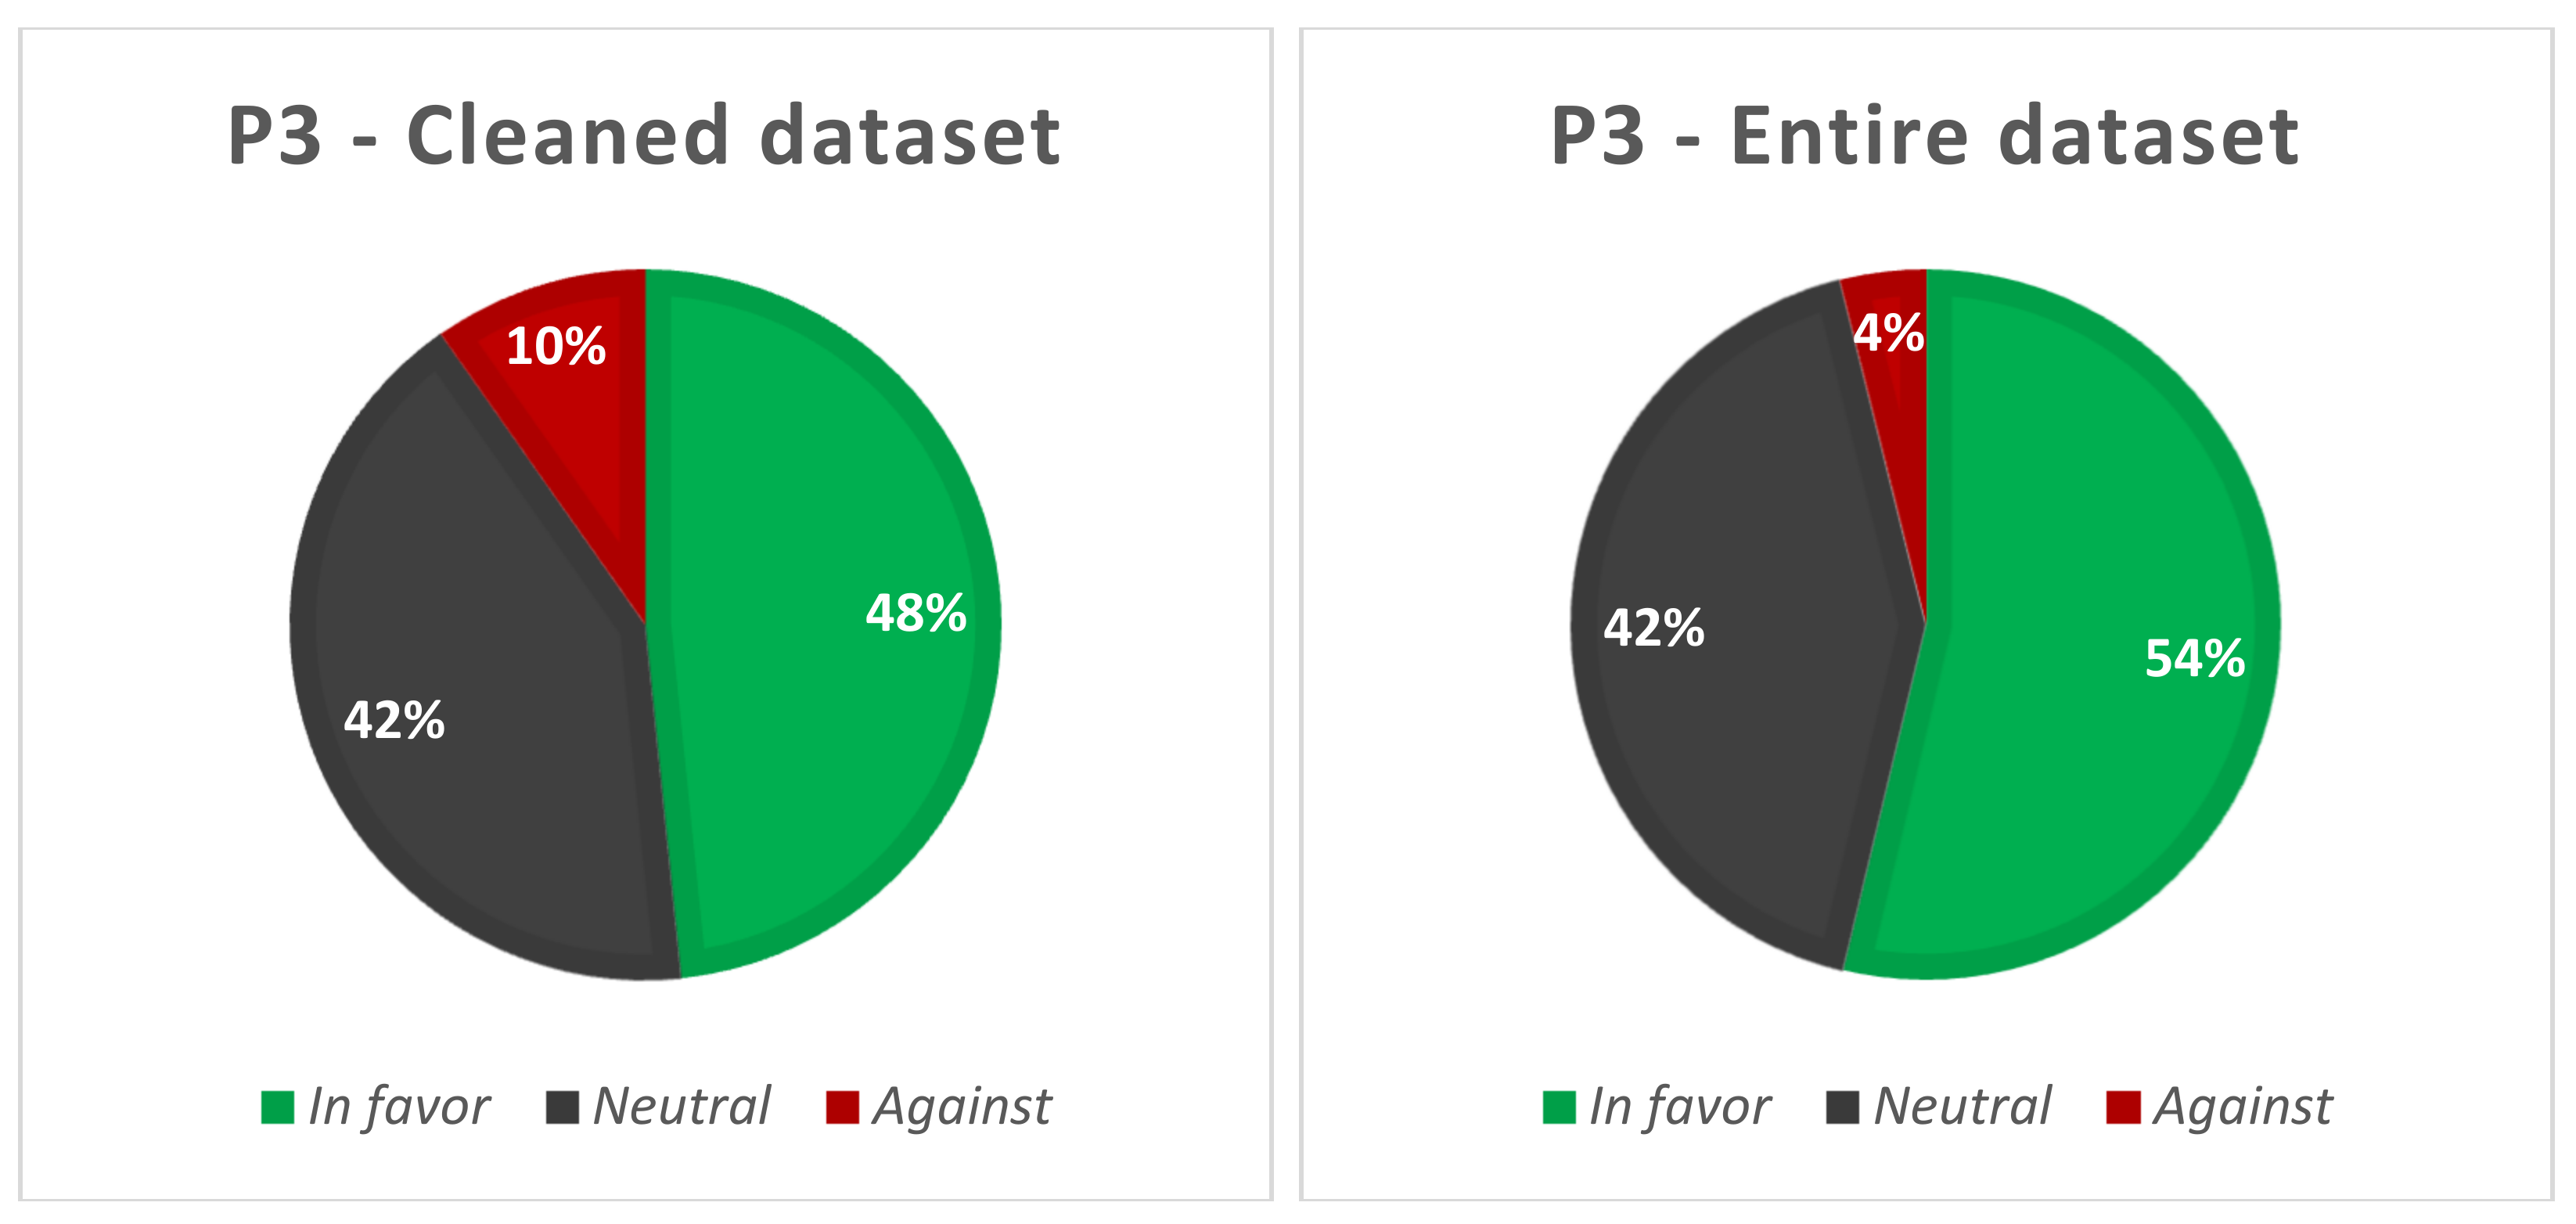
6.1.3. P3: 12 July 2020–17 July 2020

The 12 July 2020–17 July 2020 period is characterized by an increased number of tweets compared to the previous days, having an average of approximatively 10,443 tweets/day in the cleaned dataset and approximatively 70,097 tweets/day in the entire dataset. Most of the days included in this period have been marked by high tweet-posting activity, with a peak of 93,788 tweets on 15 July 2020, in the entire dataset.
Regarding the stance of the tweets, it can be mentioned that most of them were in the in favor category (48% in the cleaned dataset and 54% in the entire dataset), followed by neutral with 42% in both datasets and against with 10% in the cleaned dataset and, respectively, 4% in the entire dataset (Figure 15).
In the considered period, one of the most influential news was also from the political area where President Donald Trump started wearing a mask in public for the first time (https://www.latimes.com/politics/story/2020-07-12/infections-soar-trump-finally-wears-mask-will-it-help, accessed on 11 April 2021). As observed for the P2 period, the tweeters have been very responsive to the actions and speeches of the political figures, which stimulated them to engage in discussion related to their own opinions related to mask-wearing.
Compared to P2, in P3, slight changes can be observed in the proportion of the in favor and against tweets in the cleaned dataset, with a diminishing percentage of in favor tweets and an increasing percentage of against tweets.
For confirming the effect of the news of President Donald Trump wearing a mask for the first time in public, the most frequent 4-g has been extracted. It has been observed that “mask public first time” was mentioned 976 times, while “trump wears mask public” was mentioned 681 times, and “wears mask public first” was mentioned 603 times. The fourth most frequent 4-g is “trump finally wears mask”, mentioned 569 times, while the fifth one is “finally wears mask public”, which was mentioned 553 times. Similarly, “wears mask public” is the second most frequent trigram, mentioned 1314 times, after the more general “spread COVID 19”, which was mentioned 1632 times.
Another noticeable piece of news in this period was related to the governor of Georgia, who sued the mayor of Atlanta for requiring face masks in public (https://www.npr.org/sections/coronavirus-live-updates/2020/07/16/892109883/georgia-gov-brian-kemp-sues-atlanta-mayor-keisha-lance-bottoms-over-face-mask-or, accessed on 11 April 2021) as a result of the increasing number of COVID-19 cases. The news was discussed in the tweets posted in P3. The extracted 4-g “georgia gov brian kemp” ranked seventh in the extracted 4-g set, mentioned 520 times, confirming the importance of this news in the context of the posted tweets. Once again, the political actions of the public figures have had an impact on the Twitter discussions related to masks in times of coronavirus.

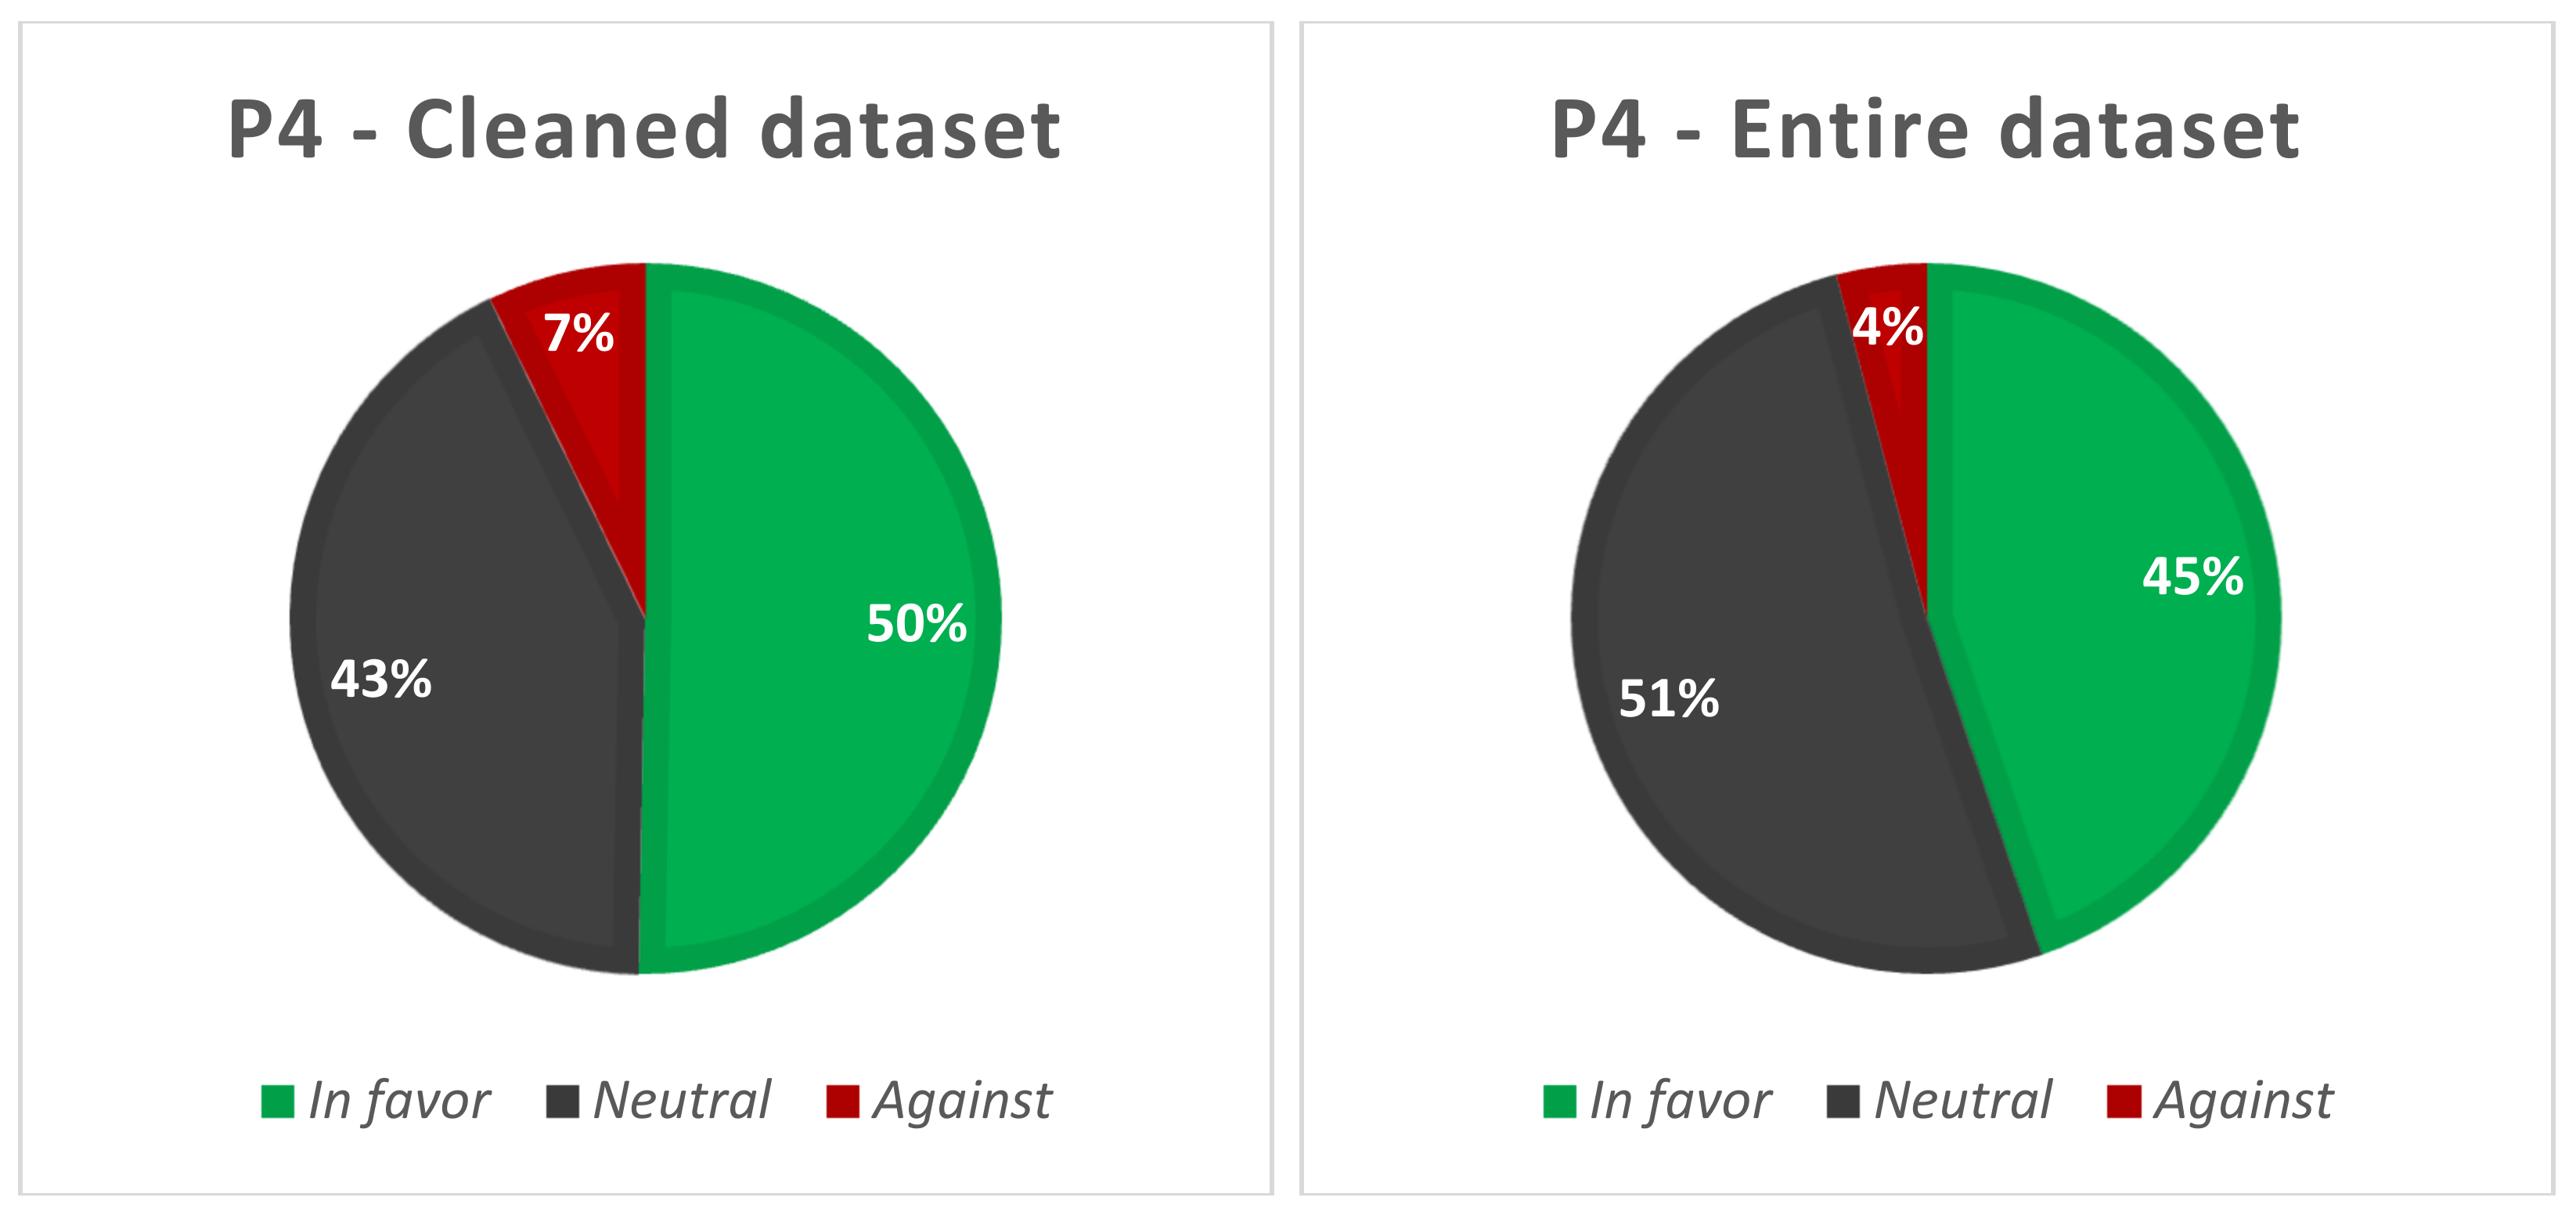
6.1.4. P4: 29 July 2020–30 July 2020

A new spike in tweets can be seen on 29 July 2020 and 30 July 2020, when the average number of tweets in the cleaned dataset was approximately 11,017 tweets/day, and the average number of tweets in the entire dataset was approximately 89,722 tweets/day.
The stance of the tweets is reported in Figure 16. Most of the tweets are in the in favor category (43%) in the cleaned dataset and in the neutral category (53%) in the entire dataset.
An important piece of news during this period was the fact that republican Texas congressman Louie Gohmert, who had previously refused to wear a mask, had tested positive for COVID-19. This news animated the Twitter users who have engaged in presenting their opinions related to this situation while stating their own point of view regarding mark wearing in COVID-19 times.
In this context, once again, it has been observed that the tweets are connected with the news. The most frequent 4-g is “wear mask tests positive”, mentioned 2100 times, followed by “refused wear mask tests”, mentioned 1922 times. The third most frequent 4-g was “gohmert refused wear mask”, mentioned 1896 times, while the sixth one was “louie gohmert refused wear”, mentioned 1664 times. The bigram “louie gohmert” is also the fourth most frequent one, being mentioned 3688 times, while the fifth most frequent one was “louie gohmert refused”, with 1666 mentions.

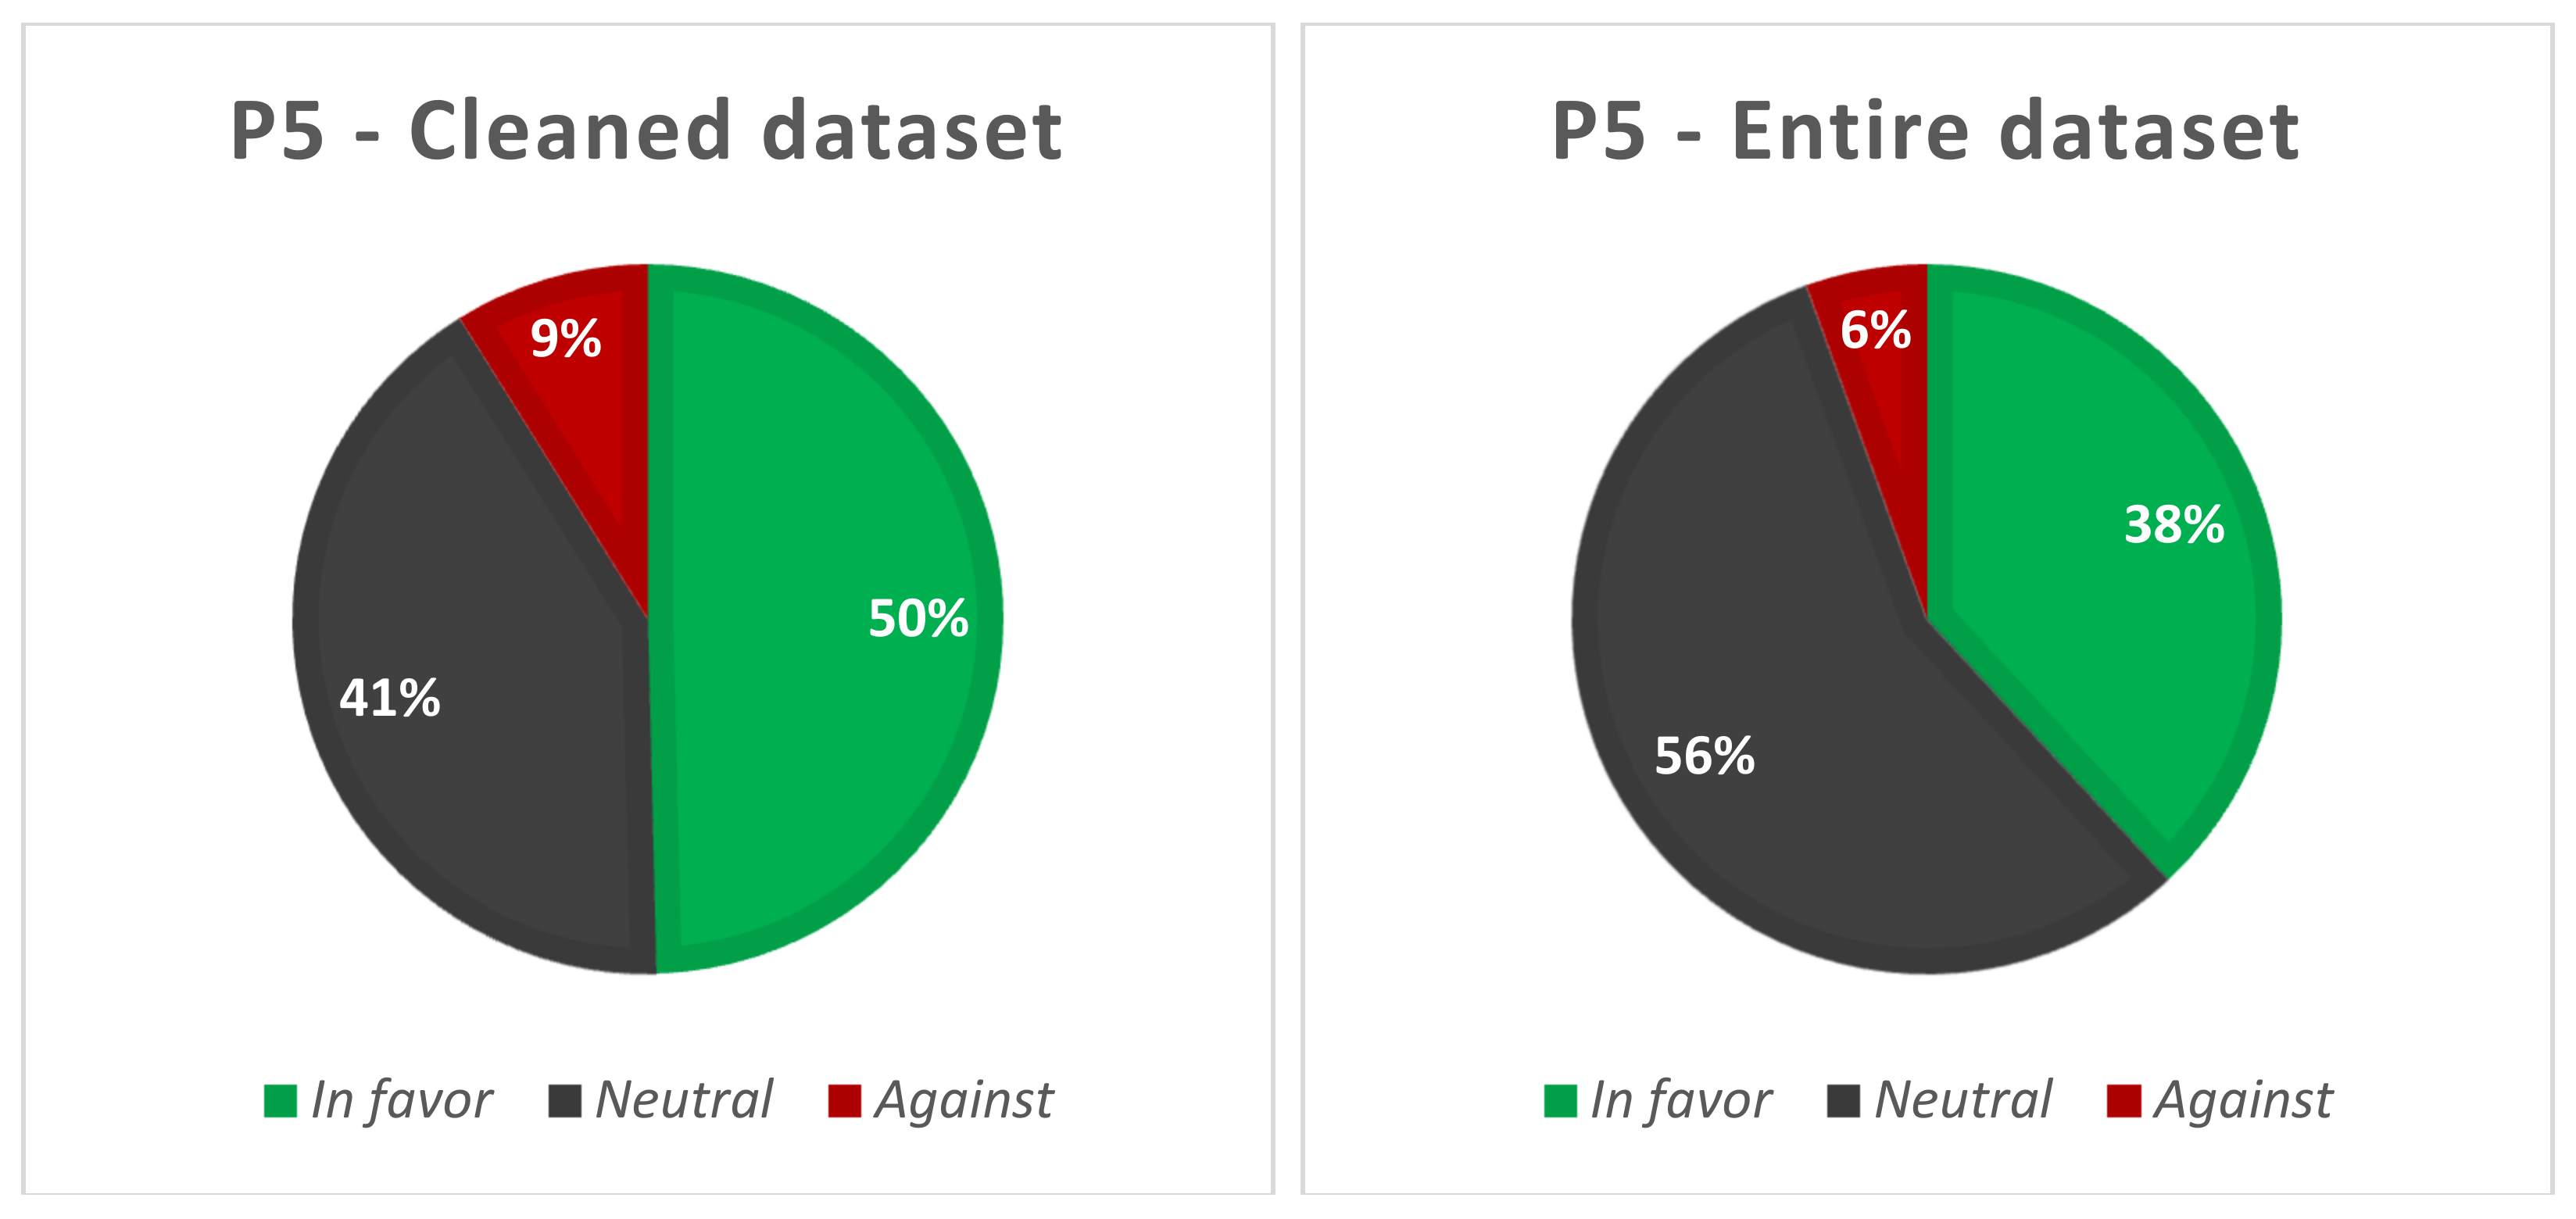
6.1.5. P5: 2 October 2020–6 October 2020

The days included in the P5 period are marked by an average of 10,795 tweets/day in the cleaned dataset and 92,375 tweets/day in the entire dataset.
In terms of stance, it can be observed that the in favor category represents 50% of the cleaned dataset, while the neutral category holds 56% of the entire dataset, as shown in Figure 17.
One of the most noticeable pieces of news during this period was related to President Donald Trump, who removed his mask upon returning to the White House after receiving COVID-19 treatment (https://apnews.com/article/virus-outbreak-donald-trump-ap-top-news-infectious-diseases-politics-d39bd670e8a280b6283abcdfc91d4794, accessed on 11 April 2021). The reactions of the Twitter users in terms of President Donald Trump’s actions are similar to the ones reported in the case of P3 in the cleaned dataset. As for the entire dataset, it seems that the news engaged more users who decided to post the information online rather than expressing their own point of view regarding this situation.
The impact of this event on the tweets published is demonstrated by the most frequent trigram in the period—“trump removes mask”. It was mentioned 8776 times. Correspondingly, the most frequent 4-g was “trump removes mask upon”, mentioned 8367 times, while the most frequent 5-g was “mask upon return white house”, mentioned 8233 times.

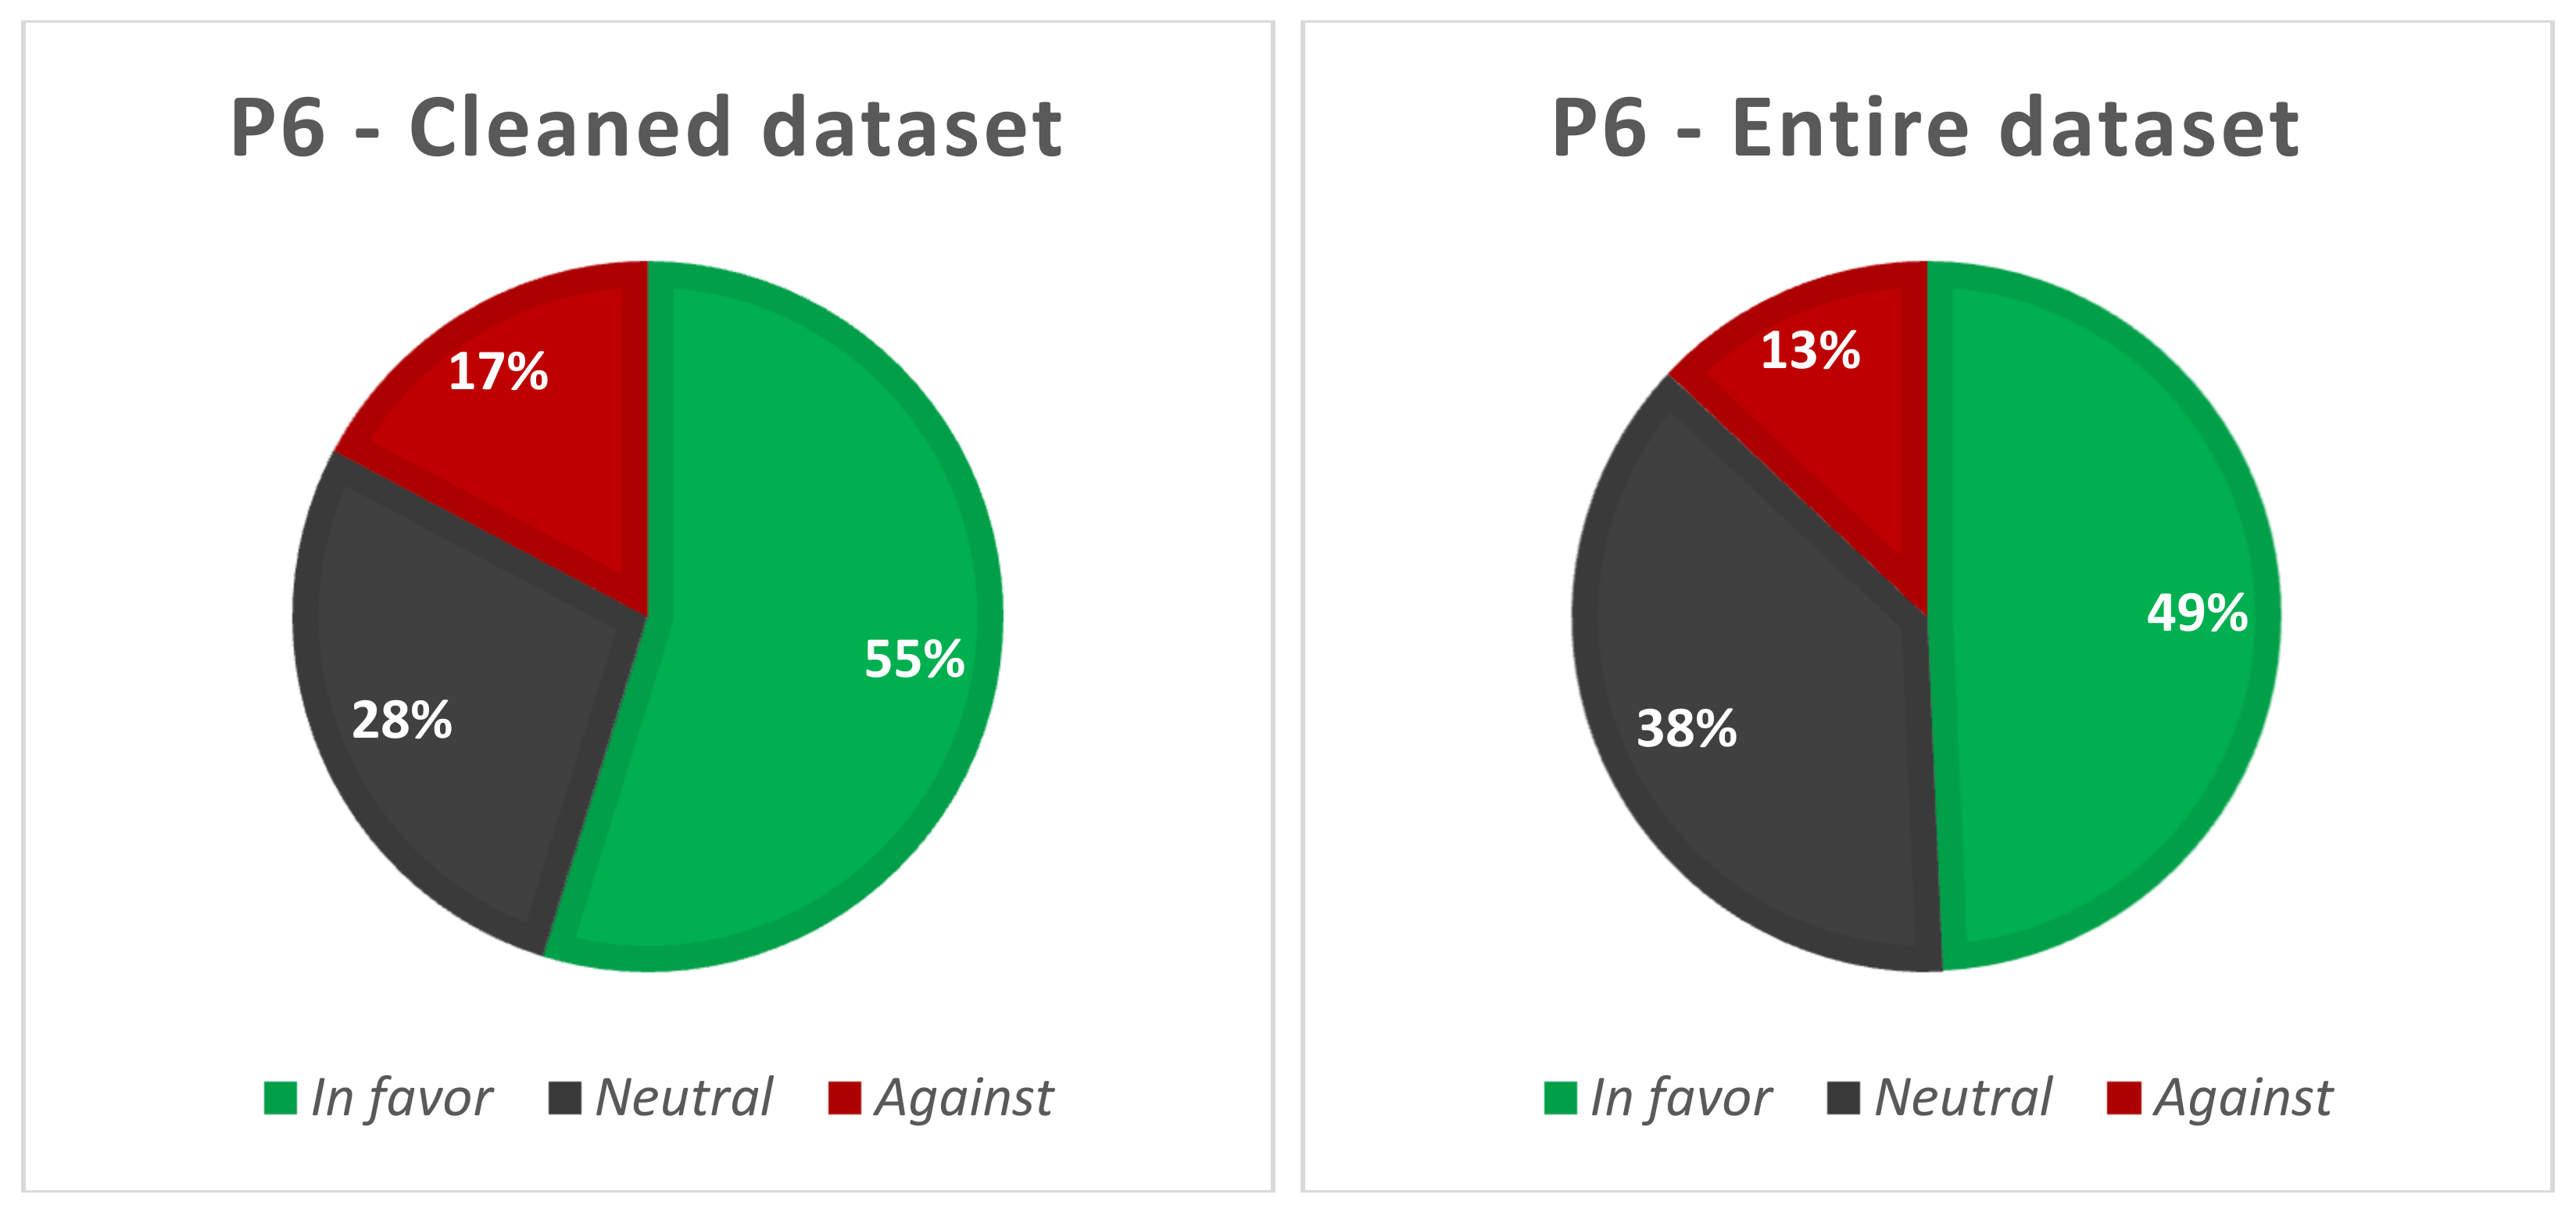
6.1.6. P6: 9 November 2020–24 November 2020

P6 is a period characterized by a large number of days compared to the other periods considered in the study, days in which the average tweets/day was 11,801 in the cleaned dataset and 39,953 in the entire dataset.
Another difference observed for this period, aside from its length, is the increased number of against tweets compared to the other periods, namely 17% in the cleaned dataset and 13% in the entire dataset, as shown in Figure 18.
The n-grams present in the tweets from this period highlight the continuing debate surrounding mask-wearing. Thus, while the most frequent 4-g is “distancing mask wearing work”, with 3626 mentions, the second most popular one is “coronavirus restrictions achieve nothing”, with 2960 mentions. The same aspect can be noticed in the case of trigrams, where the second most popular sequence of words is “mask wearing work”, with 3636 mentions, followed in fifth place by “please wear mask”, mentioned 3261 times, while the sixth position is occupied by “restrictions achieve nothing”, mentioned 2960 times. Among the trigrams, the presence of “statewide mask mandate” should be highlighted, with 2156 mentions, in relation to the mask mandates that have been imposed in different states, which is also highlighted in the news (https://www.grandforksherald.com/newsmd/coronavirus/6762637-North-Dakota-enacts-statewide-mask-mandate-restrictions-on-businesses-as-COVID-19-outbreak-rages, accessed on 11 April 2021).
Another piece of news that captured the attention of Twitter users is the publication of a study performed in Denmark, which concluded that masks only provide limited protection to the wearer (https://www.reuters.com/article/us-health-coronavirus-facemasks-idUSKBN27Y1YW, accessed on 11 April 2021). This is confirmed by the presence of the bigram “danish study”, referenced 1080 times.

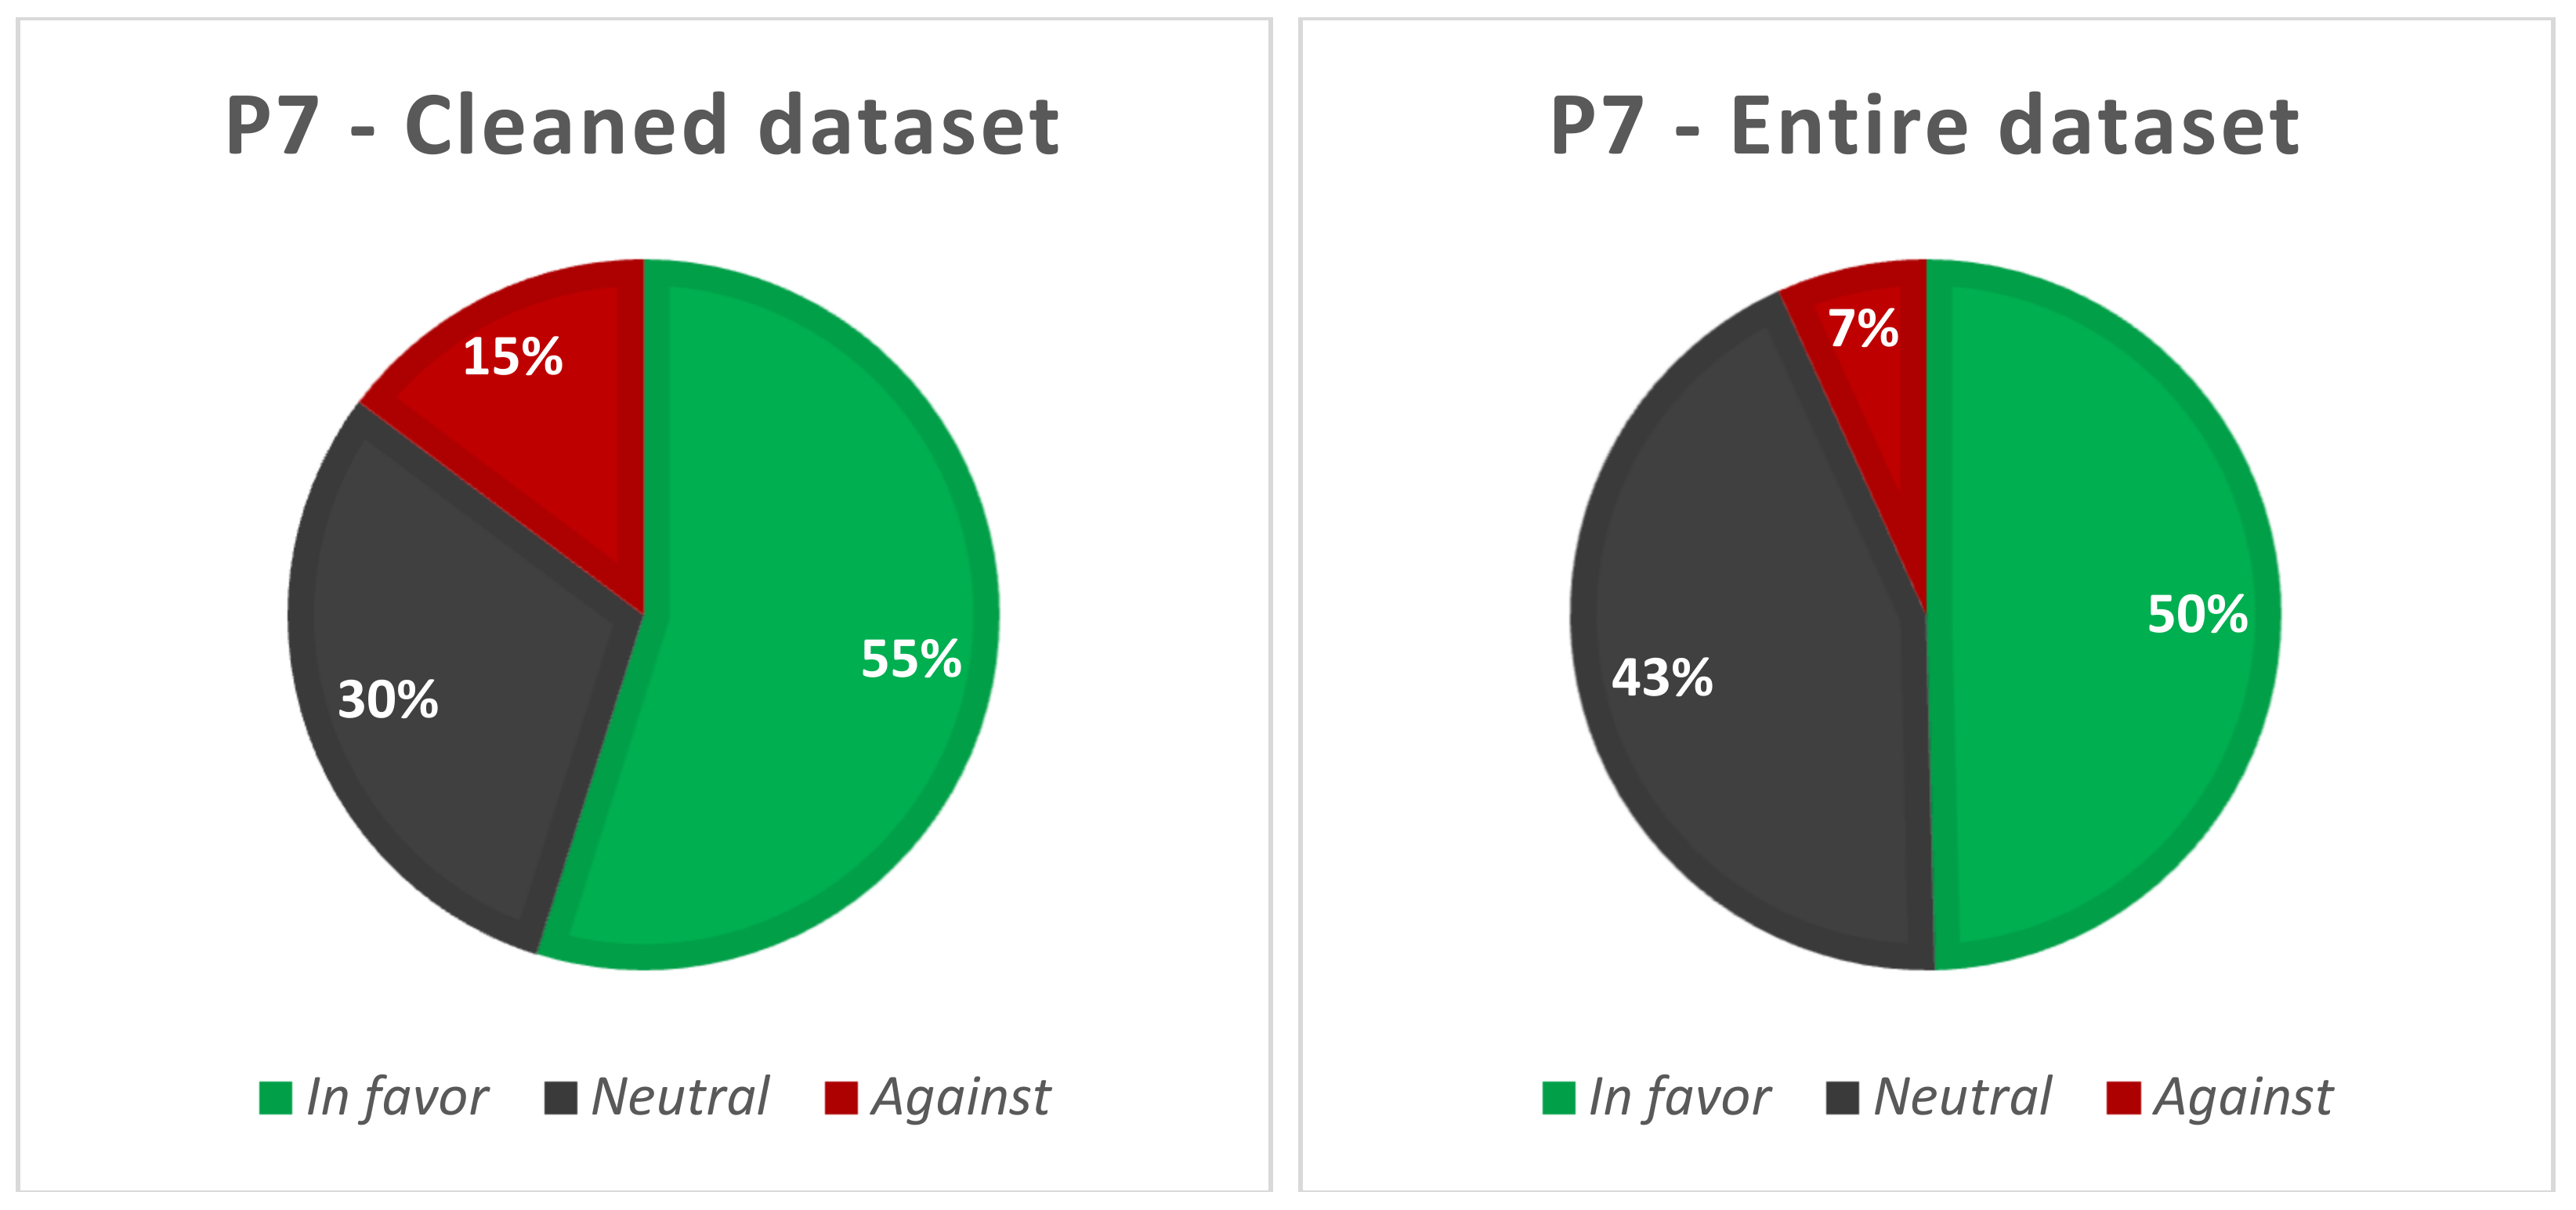
6.1.7. P7: 4 December 2020–6 December 2020

The 4 December 2020–6 December 2020 period is characterized by an average of 11,078 tweets/day in the cleaned dataset and 52,275 tweets/day in the entire dataset.
In terms of stance, the predominant opinion is in favor (55% in cleaned dataset and 50% in entire dataset), followed by neutral (with 30% in the cleaned dataset and 43% in the entire dataset), as shown in Figure 19. The against tweets continue to have a higher percentage than in P1–P5 periods and are comparable to the one recorded in P6 (15% in P7 vs. 17% in P6) for the cleaned dataset. As for the entire dataset, the percentage of tweets with an against stance is significantly reduced compared to P6 (7% in P7 vs. 13% in P6)—Figure 18.
During this period, one of the most relevant pieces of news was the United States’ president Joe Biden’s plan to ask Americans to wear masks during the first 100 days of his presidency (https://www.cbsnews.com/news/biden-call-for-masks-first-100-days-in-office-inauguration/, accessed on 11 April 2021).
This is emphasized by the fifth most frequent 4-g, “ask americans wear mask”, mentioned 284 times, and by the seventh, “masks first 100 days”, referred 242 times. The third most popular 5-g, “wear masks first 100 days”, mentioned 231 times, is also related to this news.
Another popular piece of news related is the obituary of a COVID-19 victim, which criticizes people who refuse to wear a mask (https://www.newsweek.com/obituary-kansas-covid-victim-who-died-isolation-blasts-anti-maskers-1552332, accessed on 11 April 2021). The impact of this news on Twitter is highlighted by the presence of the eleventh most frequent 4-g of “kansas COVID 19 victim”, mentioned 219, and by the twelfth most frequent 5-g, “obituary kansas COVID 19 victim”, with 204 mentions.

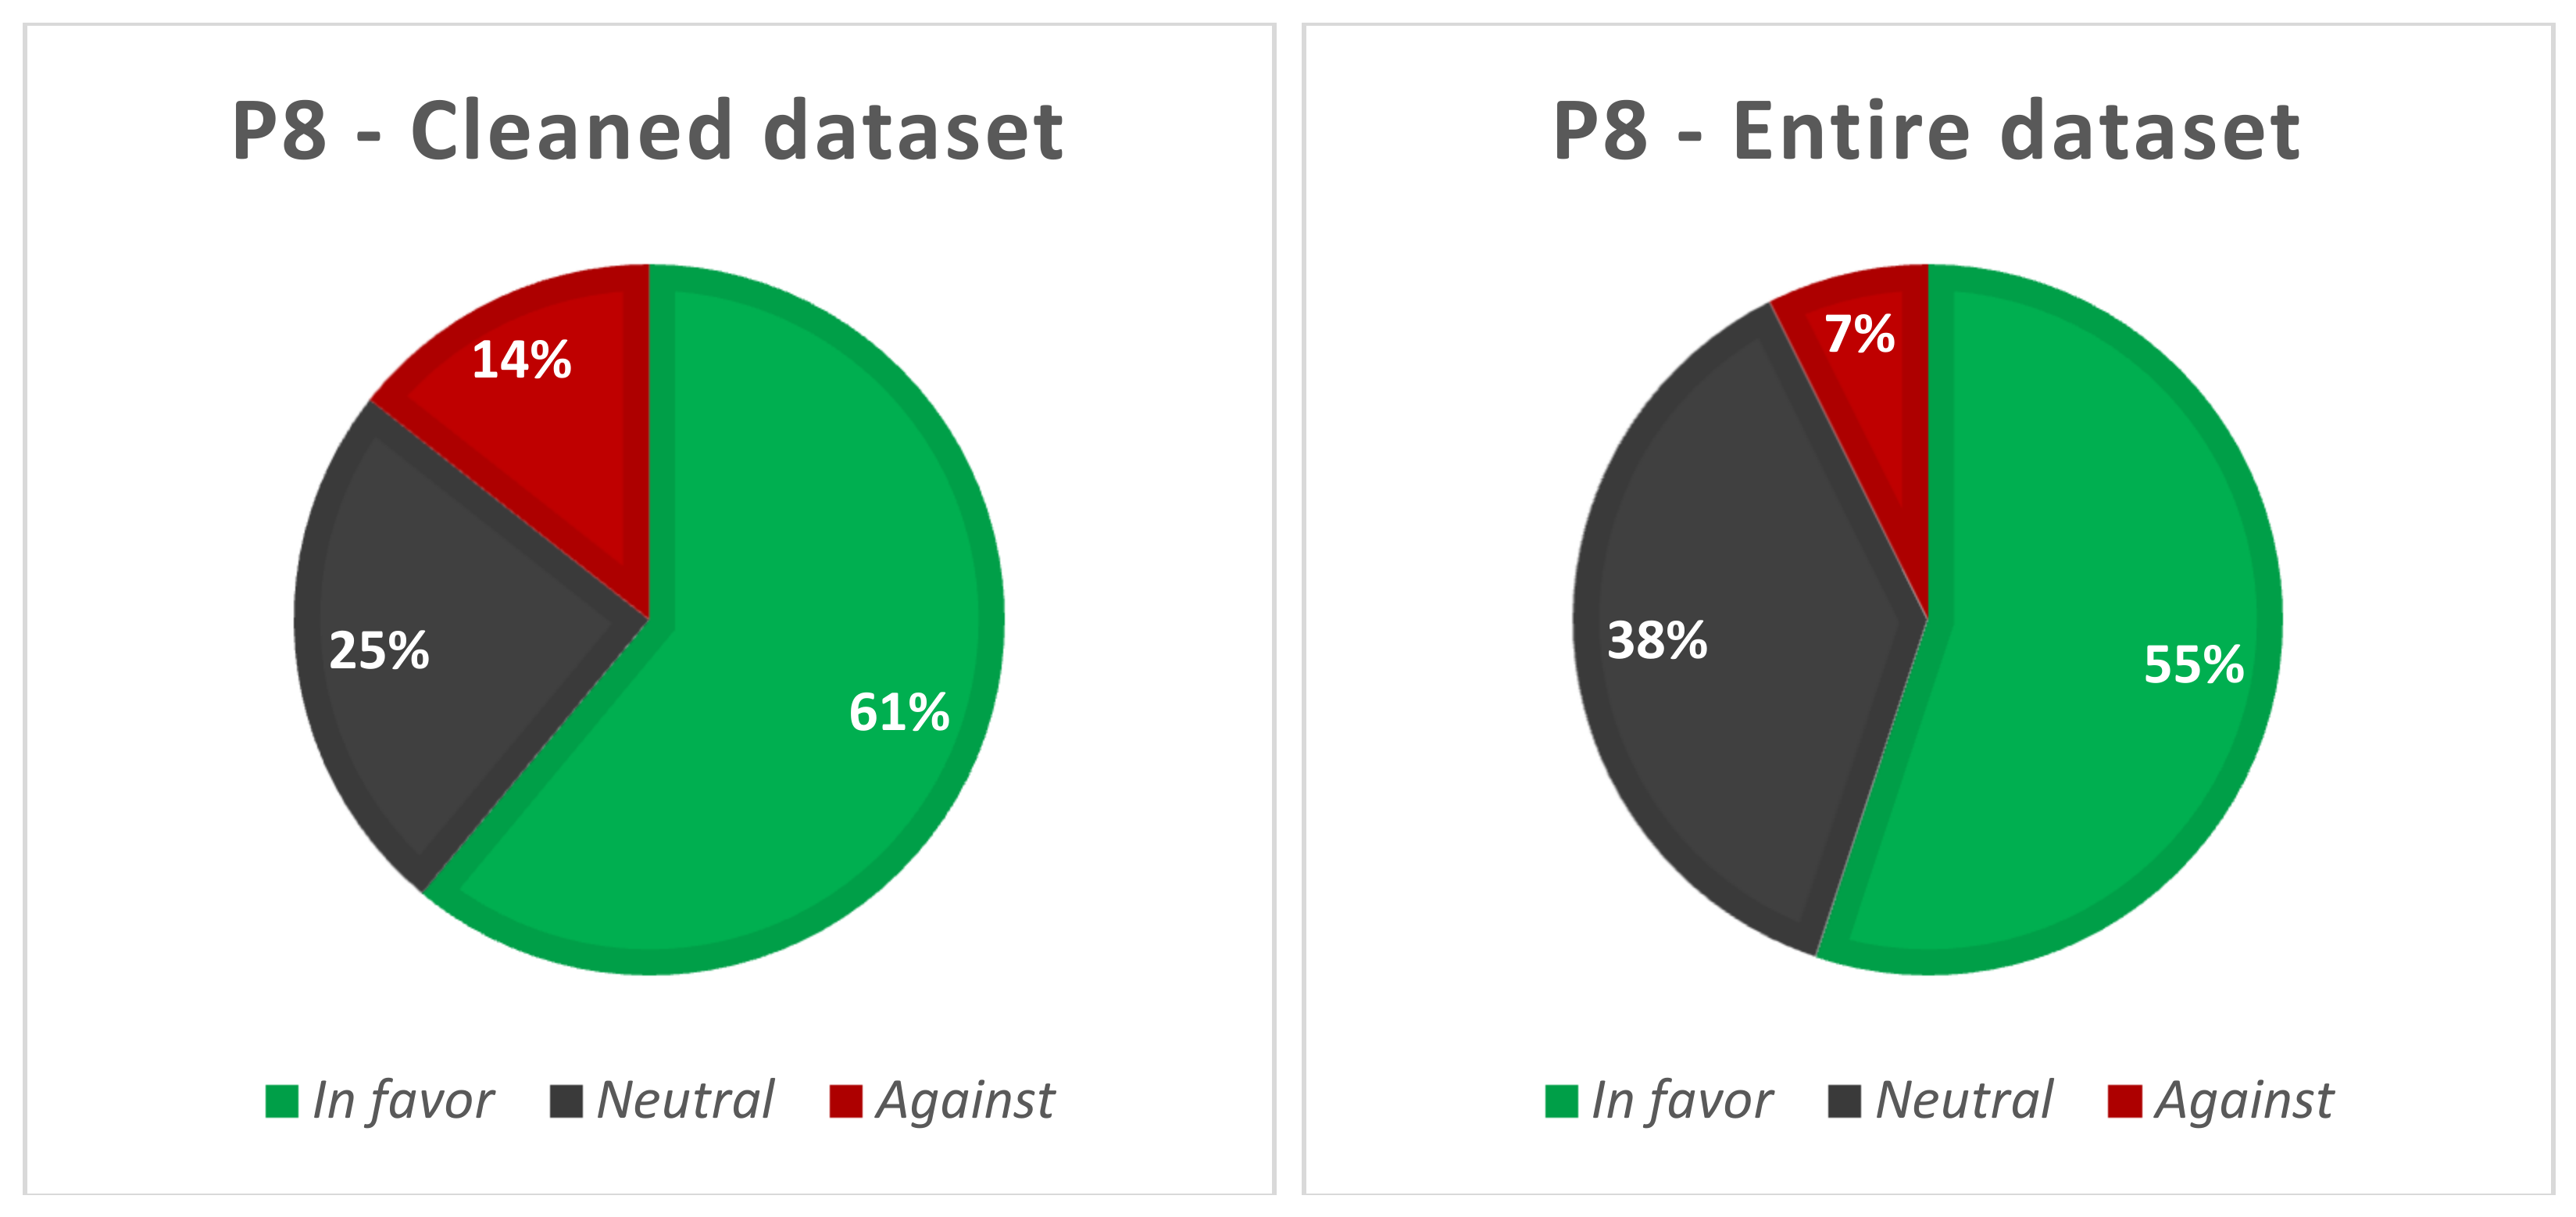
6.1.8. P8: 30 December 2020

On 30 December 2020, a number of 9,619 tweets were recorded in the cleaned dataset and 27,355 tweets in the entire dataset.
The stance analysis shows that for the selected day, the in favor tweets had the highest weight (61%, Figure 20) in the cleaned dataset when compared to the P1–P7 periods. The against tweets have had similar percentages in both cleaned and entire datasets as in P7.
A piece of news that has drawn particular was the death of congressman-elect Luke Letlow (https://apnews.com/article/louisiana-coronavirus-pandemic-shreveport-bd0de82f39d856ef262f81fd66dec1d8, accessed on 11 April 2021) from COVID-19.
This is highlighted by the presence of the second most frequent 4-g, “congressman elect luke letlow”, with 179 mentions, as well as by the fourth most popular 3-g, namely “elect luke letlow”, mentioned 197 times, and the fifth most popular 3-g, “congressman elect luk”, having 179 mentions.

6.2. Days with Peak Activity on Each Tweet Category

Based on Figure 3, Figure 4 and Figure 5, it has been observed that for some days (noted in the following with Di, i = 1, 2, 3), in the cleaned dataset, high values of the in favor, neutral and against tweets were recorded. These days are discussed in the following section in terms of reported news and their connection to the number of tweets.

6.2.1. D1: 12 November 2020—Announcement by United States Center for Disease Control

The highest number of in favor tweets, respectively, 8959, was recorded on 12 November 2020, while the second largest number of in favor tweets, namely 8514, was observed on the following day, 13 November 2020.
The surge in tweets could have been influenced by the announcement made by the United States Center for Disease Control, according to which masks protect both the wearer and those around (https://www.ctvnews.ca/health/coronavirus/u-s-centers-for-disease-control-now-says-masks-protect-both-the-wearers-and-those-around-them-from-covid-19-1.5184004, accessed on 11 April 2021).
The n-grams extracted from only the in favor tweets include the bigram “wear mask”, mentioned 3203 times, “wearing mask”, mentioned 748 times, “wear masks”, mentioned 731 times, and “wearing masks”, mentioned 433 times. The most frequent trigram was “please wear mask”, mentioned 409 times.

6.2.2. D2: 6 October 2020—Trump Removes Mask after COVID-19 Treatment

The date with the highest number of neutral tweets has been 6 October 2020, during which 12,600 tweets have been published.
The most prominent news on this date was related to President Trump removing his mask after returning to the White House, following his COVID-19 treatment (https://www.npr.org/sections/latest-updates-trump-covid-19-results/2020/10/06/920625432/maybe-i-m-immune-trump-returns-to-white-house-removes-mask-after-covid-treatment?t=1632233587952, accessed on 11 April 2021).
If we ignore the bigram “COVID 19”, the most frequent bigram for this date is “white house”, mentioned 10,053 times, followed by “removes mask”, mentioned 8935 times, followed, in turn, by “trump removes”, mentioned 8760 times. The most frequent trigram was “trump removes mask”, mentioned 8748 times.

6.2.3. D3: 18 November 2020—Danish Study Finds Mask Wearing Inefficient

The date on which the greatest number of against tweets were published is 18 November 2020, with a total number of 4034 tweets. It is closely followed by the following day, 19 November 2020, during which 2804 against messages were posted.
An important piece of news from this period is related to a study performed in Denmark, which concluded that masks only provide limited protection to the wearer (https://www.reuters.com/article/us-health-coronavirus-facemasks-idUSKBN27Y1YW, accessed on 11 April 2021).
This is confirmed by the presence of the bigram “danish study”, referenced 373 times, as the third most frequent bigram after the generic bigrams “COVID 19” and “mask wearing”.

7. Discussions and Limitations of the Study

Based on the extracted dataset for the one-year period since the first tweet related to mask-wearing in the COVID-19 context was posted, it can be observed that the online users of social networks have been interested in the subjects associated with this topic and have contributed to distributing either their own opinion—related to the choice to wear or not wear a mask—or news related to the efficiency of mask-wearing, behavior of public authorities, mask mandates, types of masks, proper use of masks, symptoms associated with a prolonged mask-wearing, etc.
The reactions on social networks to the events that surround us in our everyday life have been previously acknowledged in other Twitter studies, especially in the vaccination area [14,61,76].
In terms of stance analysis, it has been observed, as expected, that in the first period, comprising approximatively the first 5 months of the study, the number of tweets in the neutral category is higher than the number of tweets in the in favor and against categories. This situation occurred as a result of the increased need of the users to share any piece of information found and considered to be relevant for better addressing the upcoming pandemic. Since even authorities’ reactions were ambiguous at the start of the pandemic, e.g., first announcing that mask-wearing was not important when fighting with COVID-19, then starting to introduce mask mandates in different parts of the world, the need for sharing the information was higher at the beginning of the analyzed period. Once people had time to read news and develop their own opinion of mask-wearing, an increase in their “appetite” to share their own opinions (pro or cons) related to mask-wearing has been observed.
The political stage and the personal choices of the prominent political leaders have been extensively discussed and shared in tweets, as depicted in the analysis conducted on the periods with an increased number of daily tweets.
As a result, it can be stated that Twitter can be a useful tool for monitoring people’s opinions related to mask-wearing, mask mandates and their reactions to different news. This observation is in line with studies made on Twitter data, even though on smaller time periods during the COVID-19 pandemic. For example, Ahmed et al. [77] reported that for 27 June 2020–4 July 2020, most of the analyzed tweets in the area of mask-wearing have been positive, encouraging the people to wear a mask—the results being similar to the ones reported in the current paper for the month incorporating this period. Additionally, the opinions related to mask-wearing hesitancy could be analyzed more in-depth for better shaping the greater public’s resistance to governments’ prevention efforts. As shown in a recent study conducted by Keller et al. [78] on Facebook extracted data, 63% of the mentioned barriers in mask-wearing have been, in fact, based on misinformation and conspiracy theories.
The study has limitations. First, it should be mentioned that even though Twitter is a popular social network used worldwide, the English speakers on this platform represent only a part of the entire population that speaks English. Second, the selection of the mask tweets to be analyzed was made based on a series of keywords—as mentioned in the paper—and the results and their interpretation are strictly connected to the extracted set. If the search was conducted with a different set of keywords, the resulting set might be different. The stance detection analysis and the classification of the tweets in the three considered categories in favor, neutral and against is strictly given by the classifier used—RoBERTa, in our case, which has an accuracy of 85.38%. Nevertheless, the predictive capacity of any classifier is reduced in the case of irony, as mentioned by Tavoschi et al. [76] and by Giachanou and Crestani [79]. The automatic detection of irony is a difficult task for a classifier compared to a human being, who can easily identify irony in a natural manner. Last, the analyzed period represents another source of limitations. By extending the period, the results and interpretations might be altered.

8. Conclusions

The present paper considered the one-year period from when the first mask-related tweet on Twitter was posted about mask-wearing in the COVID-19 context and analyzed the evolution of people’s opinions on masks by dividing the tweets into three categories (in favor, neutral and against).
Based on the classification made through the use of RoBERTa, it can be observed that most of the tweets in the cleaned dataset are in the in favor category (48.54%), followed by neutral (39.92%) and against (11.54%) categories. As for the entire dataset, a switch is noticed between the neutral (47.57%) and in favor (45.53%) categories. The against tweets represent 6.9% of the entire dataset.
By connecting the periods of increased tweet activity to the news, we determined that the number of tweets and their content follow the topic of mainstream news. The actions of the political figures and the persons in charge of anti-COVID-19 policies are discussed in most of the tweets posted in the same periods of time, a fact demonstrated by the extracted n-grams.
As a result, it can be said that mining opinions based on tweets may be a timely and useful tool for obtaining an overview of the public’s opinions towards mask usage during COVID-19. The information extracted through tweet analysis can be used as a complementary source for other analysis methods, such as surveys, to better shape the public’s opinion on wearing masks. The approach can be useful for the public health authorities when deciding the policies to be used in emergency situations.
Extensions of the current study might include extracting the topics associated with the hesitant mask-wearing messages in order to better address the issues related to refusing to wear a mask. Additionally, the period and/or the language of the tweets considered in the study can be extended to obtain a more in-depth overview of mask-wearing. By using the geolocation property offered by Twitter, the refusal or acceptance to wear a mask can be put in connection with COVID-19 cases from particular parts of the world or with other aspects related to regional and/or cultural beliefs.

Supplementary Materials

The collected and annotated COVID-19 mask-related datasets, along with the unigrams, bi-grams and trigrams extracted for the considered period are available online at https://github.com/liviucotfas/covid-19-mask-stance-detection.

Author Contributions

Conceptualization, L.-A.C., C.D., R.G. and I.R.; Data curation, L.-A.C., C.D., R.G. and I.R.; Formal analysis, L.-A.C., C.D., R.G. and I.R.; Investigation, L.-A.C., C.D., R.G. and I.R.; Methodology, L.-A.C., C.D. and I.R.; Software, L.-A.C.; Validation, L.-A.C., C.D., R.G. and I.R.; Visualization, L.-A.C., C.D., R.G. and I.R.; Writing—original draft, L.-A.C., C.D., R.G. and I.R.; Writing—review and editing, L.-A.C., C.D., R.G. and I.R. All authors have read and agreed to the published version of the manuscript.

Funding

The work is supported by a grant from the Romanian Ministry of Research and Innovation, UEFISCDI, project number PN-III-P1-1.2-PCCDI-2017-0800/86PCCDI/2018-FutureWeb, within PNCDI III.

Institutional Review Board Statement

Not applicable.

Informed Consent Statement

Not applicable.

Data Availability Statement

The collected and annotated COVID-19 mask-related datasets, along with the unigrams, bi-grams and trigrams extracted for the considered period are available online at: https://github.com/liviucotfas/covid-19-mask-stance-detection.

Conflicts of Interest

The authors declare no conflict of interest.

Appendix A

Figure A1. Proportion of tweets by category per month (in favor, neutral, against) in the cleaned dataset.
Symmetry 13 01995 g0a1
Figure A2. Proportion of tweets by category per month (in favor, neutral, against) in the entire dataset.
Symmetry 13 01995 g0a2

References

  1. Ozili, P.K.; Arun, T. Spillover of COVID-19: Impact on the Global Economy. SSRN Electron. J. 2020. [Google Scholar] [CrossRef] [Green Version]
  2. Milne, R.J.; Delcea, C.; Cotfas, L.-A. Airplane boarding methods that reduce risk from COVID-19. Saf. Sci. 2020, 134, 105061. [Google Scholar] [CrossRef]
  3. Hale, T.; Angrist, N.; Goldszmidt, R.; Kira, B.; Petherick, A.; Phillips, T.; Webster, S.; Cameron-Blake, E.; Hallas, L.; Majumdar, S.; et al. A global panel database of pandemic policies (Oxford COVID-19 Government Response Tracker). Nat. Hum. Behav. 2021, 5, 529–538. [Google Scholar] [CrossRef]
  4. World Health Organization. Advice on the Use of Masks in the Community, during Home Care and in Healthcare Settings in the Context of the Novel Coronavirus (COVID-19) Outbreak. Available online: https://www.who.int/publications/i/item/advice-on-the-use-of-masks-in-the-community-during-home-care-and-in-healthcare-settings-in-the-context-of-the-novel-coronavirus-(2019-ncov)-outbreak (accessed on 2 March 2021).
  5. Leffler, C.T.; Ing, E.; Lykins, J.D.; Hogan, M.C.; McKeown, C.A.; Grzybowski, A. Association of Country-wide Coronavirus Mortality with Demographics, Testing, Lockdowns, and Public Wearing of Masks. Am. J. Trop. Med. Hyg. 2020, 103, 2400–2411. [Google Scholar] [CrossRef]
  6. Ma, Y.; Zhan, N. To mask or not to mask amid the COVID-19 pandemic: How Chinese students in America experience and cope with stigma. Chin. Sociol. Rev. 2020, 1–26. [Google Scholar] [CrossRef]
  7. Mw, Z.M.W. Mask crisis during the COVID-19 outbreak. Eur. Rev. Med. Pharmacol. Sci. 2020, 24, 3397–3399. [Google Scholar] [CrossRef]
  8. Grundmann, F.; Epstude, K.; Scheibe, S. Face Masks Reduce Emotion-Recognition Accuracy and Perceived Closeness. PLoS ONE 2021, 16, e0249792. [Google Scholar] [CrossRef] [PubMed]
  9. Scheid, J.L.; Lupien, S.P.; Ford, G.S.; West, S.L. Commentary: Physiological and Psychological Impact of Face Mask Usage during the COVID-19 Pandemic. Int. J. Environ. Res. Public Health 2020, 17, 6655. [Google Scholar] [CrossRef]
  10. Rieger, M.O. To wear or not to wear? Factors influencing wearing face masks in Germany during the COVID-19 pandemic. Soc. Health Behav. 2020, 3, 50. [Google Scholar] [CrossRef]
  11. Vahedian-Azimi, A.; Makvandi, S.; Karimi, L. Cultural Reasons: The Most Important Factors in Resisting Wearing a Mask. Hosp. Pract. Res. 2020, 5, 120–121. [Google Scholar] [CrossRef]
  12. Selvaranjan, K.; Navaratnam, S.; Rajeev, P.; Ravintherakumaran, N. Environmental challenges induced by extensive use of face masks during COVID-19: A review and potential solutions. Environ. Chall. 2021, 3, 100039. [Google Scholar] [CrossRef]
  13. Alamoodi, A.; Zaidan, B.; Zaidan, A.; Albahri, O.; Mohammed, K.; Malik, R.; Almahdi, E.; Chyad, M.; Tareq, Z.; Hameed, H.; et al. Sentiment analysis and its applications in fighting COVID-19 and infectious diseases: A systematic review. Expert Syst. Appl. 2020, 167, 114155. [Google Scholar] [CrossRef]
  14. Cotfas, L.-A.; Delcea, C.; Roxin, I.; Ioanas, C.; Gherai, D.S.; Tajariol, F. The Longest Month: Analyzing COVID-19 Vaccination Opinions Dynamics from Tweets in the Month Following the First Vaccine Announcement. IEEE Access 2021, 9, 33203–33223. [Google Scholar] [CrossRef]
  15. Cotfas, L.-A.; Delcea, C.; Gherai, R. COVID-19 Vaccine Hesitancy in the Month Following the Start of the Vaccination Process. Int. J. Environ. Res. Public Health 2021, 18, 10438. [Google Scholar] [CrossRef]
  16. Chakraborty, K.; Bhatia, S.; Bhattacharyya, S.; Platos, J.; Bag, R.; Hassanien, A.E. Sentiment Analysis of COVID-19 tweets by Deep Learning Classifiers—A study to show how popularity is affecting accuracy in social media. Appl. Soft Comput. 2020, 97, 106754. [Google Scholar] [CrossRef]
  17. Sun, C.X.; He, B.; Mu, D.; Li, P.L.; Zhao, H.T.; Li, Z.L.; Zhang, M.L.; Feng, L.Z.; Zheng, J.D.; Cheng, Y.; et al. Public Awareness and Mask Usage during the COVID-19 Epidemic: A Survey by China CDC New Media. Biomed. Environ. Sci. 2020, 33, 639–645. [Google Scholar] [PubMed]
  18. Goldberg, M.H.; Gustafson, A.; Maibach, E.; Ballew, M.T.; Bergquist, P.; Kotcher, J.; Marlon, J.R.; Rosenthal, S.A.; Leiserowitz, A. Mask-Wearing Increased After a Government Recommendation: A Natural Experiment in the U.S. during the COVID-19 Pandemic. Front. Commun. 2020, 5. [Google Scholar] [CrossRef]
  19. Hao, F.; Shao, W.; Huang, W. Understanding the influence of contextual factors and individual social capital on American public mask wearing in response to COVID–19. Health Place 2021, 68, 102537. [Google Scholar] [CrossRef] [PubMed]
  20. Stosic, M.D.; Helwig, S.; Ruben, M.A. Greater belief in science predicts mask-wearing behavior during COVID-19. Pers. Individ. Differ. 2021, 176, 110769. [Google Scholar] [CrossRef] [PubMed]
  21. Van Dyke, M.E.; Rogers, T.M.; Pevzner, E.; Satterwhite, C.L.; Shah, H.B.; Beckman, W.J.; Ahmed, F.; Hunt, D.C.; Rule, J. Trends in County-Level COVID-19 Incidence in Counties with and Without a Mask Mandate—Kansas, June 1–August 23, 2020. MMWR. Morb. Mortal. Wkly. Rep. 2020, 69, 1777–1781. [Google Scholar] [CrossRef]
  22. Krishnamachari, B.; Morris, A.; Zastrow, D.; Dsida, A.; Harper, B.; Santella, A.J. The role of mask mandates, stay at home orders and school closure in curbing the COVID-19 pandemic prior to vaccination. Am. J. Infect. Control 2021, 49, 1036–1042. [Google Scholar] [CrossRef]
  23. Gondim, J.A. Preventing epidemics by wearing masks: An application to COVID-19. Chaos Solitons Fractals 2020, 143, 110599. [Google Scholar] [CrossRef]
  24. Raymond, J. The Great Mask Debate: A Debate That Shouldn’t Be a Debate at All. WMJ 2020, 119, 229–239. [Google Scholar]
  25. Abboah-Offei, M.; Salifu, Y.; Adewale, B.; Bayuo, J.; Ofosu-Poku, R.; Opare-Lokko, E.B.A. A rapid review of the use of face mask in preventing the spread of COVID-19. Int. J. Nurs. Stud. Adv. 2020, 3, 100013. [Google Scholar] [CrossRef] [PubMed]
  26. Li, Y.; Liang, M.; Gao, L.; Ahmed, M.A.; Uy, J.P.; Cheng, C.; Zhou, Q.; Sun, C. Face masks to prevent transmission of COVID-19: A systematic review and meta-analysis. Am. J. Infect. Control 2020, 49, 900–906. [Google Scholar] [CrossRef] [PubMed]
  27. Boccardo, L. Self-reported symptoms of mask-associated dry eye: A survey study of 3,605 people. Contact Lens Anterior Eye 2021, 101408. [Google Scholar] [CrossRef] [PubMed]
  28. Silkiss, R.Z.; Paap, M.K.; Ugradar, S. Increased incidence of chalazion associated with face mask wear during the COVID-19 pandemic. Am. J. Ophthalmol. Case Rep. 2021, 22, 101032. [Google Scholar] [CrossRef] [PubMed]
  29. Maura, I.D.Y.I.; Genís, J.T.; Zabala, D.D.; Monaco, M.; Garcia, J.S.; Vielba, F.R.; i Turcó, J.V.; Grazioli, G. COVID-19: Analysis of cavitary air inspired through a mask, in competitive adolescent athletes. Apunt. Sports Med. 2021, 56, 100349. [Google Scholar] [CrossRef]
  30. Dost, B.; Kömürcü, Ö.; Bilgin, S.; Dokmeci, H.; Terzi, Ö.; Baris, S. Investigating the Effects of Protective Face Masks on the Respiratory Parameters of Children in the Post-Anesthesia Care Unit During the COVID-19 Pandemic. J. PeriAnesthesia Nurs. 2021. [Google Scholar] [CrossRef]
  31. Mueller, A.S.; Diefendorf, S.; Abrutyn, S.; Beardall, K.A.; Millar, K.; O’Reilly, L.; Steinberg, H.; Watkins, J.T. Youth Mask-Wearing and Social-Distancing Behavior at In-Person High School Graduations During the COVID-19 Pandemic. J. Adolesc. Health 2021, 68, 464–471. [Google Scholar] [CrossRef]
  32. Hantoko, D.; Li, X.; Pariatamby, A.; Yoshikawa, K.; Horttanainen, M.; Yan, M. Challenges and practices on waste management and disposal during COVID-19 pandemic. J. Environ. Manag. 2021, 286, 112140. [Google Scholar] [CrossRef]
  33. Dharmaraj, S.; Ashokkumar, V.; Hariharan, S.; Manibharathi, A.; Show, P.L.; Chong, C.T.; Ngamcharussrivichai, C. The COVID-19 pandemic face mask waste: A blooming threat to the marine environment. Chemosphere 2021, 272, 129601. [Google Scholar] [CrossRef]
  34. Fadare, O.O.; Okoffo, E.D. Covid-19 face masks: A potential source of microplastic fibers in the environment. Sci. Total. Environ. 2020, 737, 140279. [Google Scholar] [CrossRef]
  35. Hartanto, B.W.; Mayasari, D.S. Environmentally friendly non-medical mask: An attempt to reduce the environmental impact from used masks during COVID 19 pandemic. Sci. Total. Environ. 2020, 760, 144143. [Google Scholar] [CrossRef]
  36. Xiang, Y.; Song, Q.; Gu, W. Decontamination of surgical face masks and N95 respirators by dry heat pasteurization for one hour at 70 °C. Am. J. Infect. Control. 2020, 48, 880–882. [Google Scholar] [CrossRef] [PubMed]
  37. Rubio-Romero, J.C.; Pardo-Ferreira, M.D.C.; Torrecilla-García, J.A.; Calero-Castro, S. Disposable masks: Disinfection and sterilization for reuse, and non-certified manufacturing, in the face of shortages during the COVID-19 pandemic. Saf. Sci. 2020, 129, 104830. [Google Scholar] [CrossRef] [PubMed]
  38. Chu, D.; Akl, E.A.; Duda, S.; Solo, K.; Yaacoub, S.; Schünemann, H.J.; El-Harakeh, A.; Bognanni, A.; Lotfi, T.; Loeb, M.; et al. Physical distancing, face masks, and eye protection to prevent person-to-person transmission of SARS-CoV-2 and COVID-19: A systematic review and meta-analysis. Lancet 2020, 395, 1973–1987. [Google Scholar] [CrossRef]
  39. Howard, J.; Huang, A.; Li, Z.; Tufekci, Z.; Zdimal, V.; van der Westhuizen, H.-M.; von Delft, A.; Price, A.; Fridman, L.; Tang, L.-H.; et al. An evidence review of face masks against COVID-19. Proc. Natl. Acad. Sci. USA 2021, 118. [Google Scholar] [CrossRef] [PubMed]
  40. Liao, M.; Liu, H.; Wang, X.; Hu, X.; Huang, Y.; Liu, X.; Brenan, K.; Mecha, J.; Nirmalan, M.; Lu, J.R. A technical review of face mask wearing in preventing respiratory COVID-19 transmission. Curr. Opin. Colloid Interface Sci. 2021, 52, 101417. [Google Scholar] [CrossRef]
  41. Haman, M. The use of Twitter by state leaders and its impact on the public during the COVID-19 pandemic. Heliyon 2020, 6, e05540. [Google Scholar] [CrossRef] [PubMed]
  42. Koh, J.X.; Liew, T.M. How loneliness is talked about in social media during COVID-19 pandemic: Text mining of 4492 Twitter feeds. J. Psychiatr. Res. 2020. [Google Scholar] [CrossRef]
  43. Singh, P.; Singh, S.; Sohal, M.; Dwivedi, Y.K.; Kahlon, K.S.; Sawhney, R.S. Psychological fear and anxiety caused by COVID-19: Insights from Twitter analytics. Asian J. Psychiatry 2020, 54, 102280. [Google Scholar] [CrossRef]
  44. Garcia, K.; Berton, L. Topic detection and sentiment analysis in Twitter content related to COVID-19 from Brazil and the USA. Appl. Soft Comput. 2020, 101, 107057. [Google Scholar] [CrossRef]
  45. Abd-Alrazaq, A.; Alhuwail, D.; Househ, M.; Hamdi, M.; Shah, Z. Top Concerns of Tweeters during the COVID-19 Pandemic: Infoveillance Study. J. Med. Internet Res. 2020, 22, e19016. [Google Scholar] [CrossRef] [PubMed] [Green Version]
  46. Kwon, J.; Grady, C.; Feliciano, J.T.; Fodeh, S.J. Defining facets of social distancing during the COVID-19 pandemic: Twitter analysis. J. Biomed. Inform. 2020, 111, 103601. [Google Scholar] [CrossRef]
  47. Mutlu, E.C.; Oghaz, T.; Jasser, J.; Tutunculer, E.; Rajabi, A.; Tayebi, A.; Ozmen, O.; Garibay, I. A stance data set on polarized conversations on Twitter about the efficacy of hydroxychloroquine as a treatment for COVID-19. Data Brief 2020, 33, 106401. [Google Scholar] [CrossRef] [PubMed]
  48. Thelwall, M.; Kousha, K.; Thelwall, S. Covid-19 vaccine hesitancy on English-language Twitter. Prof. Inf. 2021, 30. [Google Scholar] [CrossRef]
  49. Wang, Y.; Hao, H.; Platt, L.S. Examining risk and crisis communications of government agencies and stakeholders during early-stages of COVID-19 on Twitter. Comput. Hum. Behav. 2020, 114, 106568. [Google Scholar] [CrossRef] [PubMed]
  50. Rao, H.R.; Vemprala, N.; Akello, P.; Valecha, R. Retweets of officials’ alarming vs reassuring messages during the COVID-19 pandemic: Implications for crisis management. Int. J. Inf. Manag. 2020, 55, 102187. [Google Scholar] [CrossRef]
  51. Morshed, S.A.; Khan, S.S.; Tanvir, R.B.; Nur, S. Impact of COVID-19 pandemic on ride-hailing services based on large-scale Twitter data analysis. J. Urban Manag. 2021, 10, 155–165. [Google Scholar] [CrossRef]
  52. Rahman, M.; Ali, G.N.; Li, X.J.; Samuel, J.; Paul, K.C.; Chong, P.H.; Yakubov, M. Socioeconomic factors analysis for COVID-19 US reopening sentiment with Twitter and census data. Heliyon 2021, 7, e06200. [Google Scholar] [CrossRef]
  53. Monmousseau, P.; Marzuoli, A.; Feron, E.; Delahaye, D. Impact of Covid-19 on passengers and airlines from passenger measurements: Managing customer satisfaction while putting the US Air Transportation System to sleep. Transp. Res. Interdiscip. Perspect. 2020, 7, 100179. [Google Scholar] [CrossRef]
  54. Sarker, A.; Lakamana, S.; Hogg-Bremer, W.; Xie, A.; Al-Garadi, M.A.; Yang, Y.-C. Self-reported COVID-19 symptoms on Twitter: An analysis and a research resource. J. Am. Med. Inform. Assoc. 2020, 27, 1310–1315. [Google Scholar] [CrossRef]
  55. Huang, X.; Li, Z.; Jiang, Y.; Li, X.; Porter, D. Twitter reveals human mobility dynamics during the COVID-19 pandemic. PLoS ONE 2020, 15, e0241957. [Google Scholar] [CrossRef]
  56. Al-Rakhami, M.S.; Al-Amri, A.M. Lies Kill, Facts Save: Detecting COVID-19 Misinformation in Twitter. IEEE Access 2020, 8, 155961–155970. [Google Scholar] [CrossRef]
  57. Shahi, G.K.; Dirkson, A.; Majchrzak, T.A. An exploratory study of COVID-19 misinformation on Twitter. Online Soc. Netw. Media 2021, 22, 100104. [Google Scholar] [CrossRef]
  58. Abdelminaam, D.S.; Ismail, F.H.; Taha, M.; Taha, A.; Houssein, E.H.; Nabil, A. CoAID-DEEP: An Optimized Intelligent Framework for Automated Detecting COVID-19 Misleading Information on Twitter. IEEE Access 2021, 9, 27840–27867. [Google Scholar] [CrossRef]
  59. Stephens, M. A geospatial infodemic: Mapping Twitter conspiracy theories of COVID-19. Dialogues Hum. Geogr. 2020, 10, 276–281. [Google Scholar] [CrossRef]
  60. Banda, J.; Tekumalla, R.; Wang, G.; Yu, J.; Liu, T.; Ding, Y.; Artemova, E.; Tutubalina, E.; Chowell, G. A Large-Scale COVID-19 Twitter Chatter Dataset for Open Scientific Research—An International Collaboration. Epidemiologia 2021, 2, 24. [Google Scholar] [CrossRef]
  61. D’Andrea, E.; Ducange, P.; Bechini, A.; Renda, A.; Marcelloni, F. Monitoring the public opinion about the vaccination topic from tweets analysis. Expert Syst. Appl. 2018, 116, 209–226. [Google Scholar] [CrossRef]
  62. Aloufi, S.; El Saddik, A. Sentiment Identification in Football-Specific Tweets. IEEE Access 2018, 6, 78609–78621. [Google Scholar] [CrossRef]
  63. Baziotis, C.; Pelekis, N.; Doulkeridis, C. DataStories at SemEval-2017 Task 4: Deep LSTM with Attention for Message-Level and Topic-Based Sentiment Analysis. In Proceedings of the 11th International Workshop on Semantic Evaluation (SemEval-2017), Vancouver, BC, Canada, 3–4 August 2017; pp. 747–754. [Google Scholar]
  64. Bird, S.; Klein, E.; Loper, E. Natural Language Processing with Python: Analyzing Text with the Natural Language Toolkit, 1st ed.; O’Reilly Media: Beijing, China, 2009; ISBN 978-0-596-51649-9. [Google Scholar]
  65. Zhang, M.-L.; Peña, J.M.; Robles, V. Feature selection for multi-label naive Bayes classification. Inf. Sci. 2009, 179, 3218–3229. [Google Scholar] [CrossRef]
  66. McCallum, A.; Nigam, K. A Comparison of Event Models for Naive Bayes Text Classification. In AAAI-98 Workshop on Learning for Text Categorization; CiteSeerX: State College, PA, USA, 1998; Volume 752, pp. 41–48. Available online: https://citeseerx.ist.psu.edu/viewdoc/summary?doi=10.1.1.46.1529 (accessed on 11 April 2021).
  67. Breiman, L. Random Forests. Mach. Learn. 2001, 45, 5–32. [Google Scholar] [CrossRef] [Green Version]
  68. Misra, S.; Li, H. Noninvasive fracture characterization based on the classification of sonic wave travel times. In Machine Learning for Subsurface Characterization; Gulf Professional Publishing: Houston, TX, USA, 2019; pp. 243–287. [Google Scholar] [CrossRef]
  69. Platt, J.C. Fast training of support vector machines using sequential minimal optimization. In Advances in Kernel Methods: Support Vector Learning; MIT Press: Cambridge, MA, USA, 1999; pp. 185–208. ISBN 978-0-262-19416-7. [Google Scholar]
  70. Mohammadi, V.; Minaei, S. Artificial Intelligence in the Production Process. In Engineering Tools in the Beverage Industry; Grumezescu, A.M., Holban, A.M., Eds.; The Science of Beverages; Woodhead Publishing: Sawton, UK, 2019; pp. 27–63. ISBN 978-0-12-815258-4. [Google Scholar]
  71. Devlin, J.; Chang, M.-W.; Lee, K.; Toutanova, K. BERT: Pre-Training of Deep Bidirectional Transformers for Language Understanding. In Proceedings of the 2019 Conference of the North American Chapter of the Association for Computational Linguistics: Human Language Technologies, Volume 1 (Long and Short Papers), Minneapolis, MN, USA, 2–7 June 2019; pp. 4171–4186. [Google Scholar]
  72. Liu, Y.; Ott, M.; Goyal, N.; Du, J.; Joshi, M.; Chen, D.; Levy, O.; Lewis, M.; Zettlemoyer, L.; Stoyanov, V. RoBERTa: A Robustly Optimized BERT Pretraining Approach. arXiv 2019, arXiv:1907.11692. [Google Scholar]
  73. Pedregosa, F.; Varoquaux, G.; Gramfort, A.; Michel, V.; Thirion, B.; Grisel, O.; Blondel, M.; Prettenhofer, P.; Weiss, R.; Dubourg, V.; et al. Scikit-Learn: Machine Learning in Python. J. Mach. Learn. Res. 2011, 12, 2825–2830. [Google Scholar]
  74. Kibriya, A.M.; Frank, E.; Pfahringer, B.; Holmes, G. Multinomial naive Bayes for text categorization revisited. In Ai 2004: Advances in Artificial Intelligence; Springer: Berlin/Heidelberg, Germany, 2004; Volume 3339, pp. 488–499. ISBN 978-3-540-24059-4. [Google Scholar]
  75. Hastie, T.; Tibshirani, R.; Friedman, J. The Elements of Statistical Learning: Data Mining, Inference, and Prediction, 2nd ed.; Springer Series in Statistics; Springer: New York, NY, USA, 2009; ISBN 9780387848570. [Google Scholar]
  76. Tavoschi, L.; Quattrone, F.; D’Andrea, E.; Ducange, P.; Vabanesi, M.; Marcelloni, F.; Lopalco, P.L. Twitter as a sentinel tool to monitor public opinion on vaccination: An opinion mining analysis from September 2016 to August 2017 in Italy. Hum. Vaccines Immunother. 2020, 16, 1062–1069. [Google Scholar] [CrossRef]
  77. Ahmed, W.; Vidal-Alaball, J.; Segui, F.L.; Moreno-Sánchez, P. A Social Network Analysis of Tweets Related to Masks during the COVID-19 Pandemic. Int. J. Environ. Res. Public Health 2020, 17, 8235. [Google Scholar] [CrossRef]
  78. Keller, S.; Honea, J.; Ollivant, R. How Social Media Comments Inform the Promotion of Mask-Wearing and Other COVID-19 Prevention Strategies. Int. J. Environ. Res. Public Health. 2021, 18, 5624. [Google Scholar] [CrossRef]
  79. Giachanou, A.; Crestani, F. Like It or Not: A Survey of Twitter Sentiment Analysis Methods. ACM Comput. Surv. 2016, 49, 1–41. [Google Scholar] [CrossRef]
Figure 1. Trend analysis.
Symmetry 13 01995 g001
Figure 2. Mask tweets evolution.
Symmetry 13 01995 g002
Figure 3. Evolution of the number of in favor tweets in the cleaned dataset.
Symmetry 13 01995 g003
Figure 4. Evolution of the number of neutral tweets in the cleaned dataset.
Symmetry 13 01995 g004
Figure 5. Evolution of the number of against tweets in the cleaned dataset.
Symmetry 13 01995 g005
Figure 6. Proportion of tweets by category (in favor, neutral, against) in the cleaned dataset.
Symmetry 13 01995 g006
Figure 7. Evolution of the number of in favor tweets in the entire dataset.
Symmetry 13 01995 g007
Figure 8. Evolution of the number of neutral tweets in the entire dataset.
Symmetry 13 01995 g008
Figure 9. Evolution of the number of against tweets in the entire dataset.
Symmetry 13 01995 g009
Figure 10. Proportion of tweets by category (in favor, neutral, against) in the entire dataset.
Symmetry 13 01995 g010
Figure 11. Evolution of the number of in favor, neutral and against tweets in the cleaned dataset.
Symmetry 13 01995 g011
Figure 12. Evolution of the number of in favor, neutral and against tweets in the entire dataset.
Symmetry 13 01995 g012
Figure 13. Stances of the tweets in the cleaned and entire datasets during P1.
Symmetry 13 01995 g013
Figure 14. Stances of the tweets in the cleaned and entire datasets during P2.
Symmetry 13 01995 g014
Figure 15. Stances of the tweets in the cleaned and entire datasets during P3.
Symmetry 13 01995 g015
Figure 16. Stances of the tweets in the cleaned and entire datasets during P4.
Symmetry 13 01995 g016
Figure 17. Stances of the tweets in the cleaned and entire datasets during P5.
Symmetry 13 01995 g017
Figure 18. Stances of the tweets in the cleaned and entire datasets during P6.
Symmetry 13 01995 g018
Figure 19. Stances of the tweets in the cleaned and entire datasets during P7.
Symmetry 13 01995 g019
Figure 20. Stances of the tweets in the cleaned and entire datasets during P8.
Symmetry 13 01995 g020
Table 1. Tweets searching keywords.
TopicKeywords
COVID-19COVID 19, COVID-19, coronavirus, coronaoutbreak, coronaviruspandemic, wuhanvirus, 2019nCoV
Maskmask
Table 2. The number of tweets extracted for each month.
MonthM1M2M3M4
Period1/9/2020–2/8/20202/9/2020–3/8/20203/9/2020–4/8/20204/9/2020–5/8/2020
Entire dataset164,957205,331693,193673,218
Cleaned dataset16,24840,666144,947137,425
MonthM5M6M7M8
Period5/9/2020–6/8/20206/9/2020–7/8/20207/9/2020–8/8/20208/9/2020–9/8/2020
Entire dataset679,3521,340,1961,413,665570,135
Cleaned dataset122,558178,477222,916102,224
MonthM9M10M11M12
Period9/9/2020–10/8/202010/9/2020–11/8/202011/9/2020–12/8/202012/9/2020–1/8/2021
Entire dataset873,153579,9781,034,001568,454
Cleaned dataset139,098106,905303,544177,429
Table 3. The first tweets posted on masks in times of COVID-19.
DateTimeTweet
9 January 202006:34:33Stil remember the SARS epidemic in 2003? Experts in China determine the # Wuhan # pneumonia is caused by a new type of coronavirus.Hong Kong health chief didn’t advise citizens to wear mask as a precaution. The govt is seeking to revive the mask ban in-stead. # ChinesePneumonia
07:31:13As HK has seen up to 38 citizens infected by the novel corona virus like SARS from Wu-han, the city is running out of mask n saline by both panic purchases n supply ban from China, price soar up to 10 times higher than usual. This also happens in Macau. #SOSHK #ChinesePneumonia
09:04:37Are we still talking about a mask ban now that there’s a new coronavirus outbreak? https://t.co/0R3RKFaPAx
Table 4. The first retweets posted on masks in times of COVID-19.
DateTimeRetweet
14 January 202018:44:57RT @Atvven: As HK has seen up to 38 citizens infected by the novel corona virus like SARS from Wuhan, the city is running out of mask n saline by both panic purchases n supply ban from China, price soar up to 10 times higher than usual. This also happens in Macau. # SOSHK # ChinesePneumonia
18 January 202016:10:05RT @goldencaskcap: Oh and that scary sounding coronavirus 229E is responsible for what otherwise known as the common cold. It’s been and will be a nasty flu season. Wear a mask, wash hands, and don’t take health advice from political reporters.
21:42:41RT @goldencaskcap: Oh and that scary sounding coronavirus 229E is responsible for what otherwise known as the common cold. It’s been and will be a nasty flu season. Wear a mask, wash hands, and don’t take health advice from political reporters.
Table 5. Example of tweets.
StanceTweet
in favorI wear masks all day every day. I don’t feel lightheadedI don’t become hypoxic (low oxygen levels) I don’t become hypercapnic (high CO2 levels) I don’t have symptoms of COVID-19. I wear my mask to protect you. Can you grant me that same courtesy? Thank you in advance Symmetry 13 01995 i001 https://t.co/piwXDx5Yfb
Schools begin in August? Really? No mask mandate? Really? #schoolsreopening https://t.co/0Ong4xBAzv
Refusing to Wear a Mask Is Like Driving Drunk https://t.co/ztE9lzUfDH It’s no more a “personal choice” than is drinking all night, then stumbling into your car and heading down the road. In a time of plague, shunning a face mask is like driving drunk, putting everyone in danger.
neutralDelta passengers who want mask exemption may be required to take pre-flight evaluation https://t.co/btGTHPEUh5
Coronavirus: American Airlines passenger removed for not wearing mask https://t.co/KSMDvAMyED
A security guard who worked at a market in Gardena (Los Angeles County) was charged with murder after he allegedly shot a man who entered the store without a mask, leading to a fight between the pair. https://t.co/5gNRZKVybp
againstNever wear a mask outside in a hot weather! You will get sick that way guaranteed! That’s how they create the 2nd/3rd COVID-19 waive. Don’t be a brainwashed fool!
@melindagates Wearing a mask for any length of time is detrimental to your health as it reduces your oxygen levels and can affect your immune system. We don’t wear masks for the ‘flu’ and annual vaccines do not prevent us from getting the flu which is a corona virus Symmetry 13 01995 i002
Flu virus = 80–120 nanometers in diameter. COVID-19 = 60–140 nanometers in diameter. Smoke = 2.5–20 nanometers in diameter. Pollen = 90–100 nanometers in diameter. Mask = 300–320 nanometers in diameter. Your mask is an incubator for the very thing your trying to prevent https://t.co/KXZc8xEXf9
Table 6. Statistics for annotated dataset.
CategoryNumberPercentage
in favor14,16447.83%
neutral12,30741.56%
against314210.61%
TOTAL9426100.00%
Table 7. Considered n-gram combinations.
N-GramsDescription
(1-1)unigrams
(2-2)bigrams
(3-3)trigrams
(1-2)unigrams and bigrams
(2-3)bigrams and trigrams
(1-3)unigrams, bigrams and trigrams
Table 8. Classifiers’ performance.
CodeClassifierClassPrecisionRecallF-ScoreAccuracy
C1MNB
n-gram: (1, 3);
features: all
in favor68.17%76.13%71.8975.44%
neutral91.43%67.28%77.48
against72.39%82.91%77.28
C2MNB
n-gram: (1, 2);
features: all
in favor66.10%78.52%71.7475.12%
neutral91.45%66.30%76.83
against74.24%80.55%77.25
C3RF
n-gram: (1, 3);
features: all
in favor69.47%70.72%70.0574.85%
neutral75.55%83.48%79.29
against80.42%70.37%75.04
C4RF
n-gram: (1, 2);
features: all
in favor68.91%72.47%70.6175.16%
neutral78.19%81.76%79.89
against79.18%71.26%74.99
C5SVM
n-gram: (1, 3);
features: all
in favor76.03%72.66%74.2578.63%
neutral87.19%77.47%82.00
against74.42%85.77%79.66
C6SVM
n-gram: (1, 2);
features: all
in favor75.11%73.52%74.2878.79%
neutral85.50%79.70%82.47
against76.52%83.16%79.67
C7BERT
cased: yes
in favor77.16%79.78%78.3982.38%
neutral87.44%83.13%85.19
against83.11%84.23%83.59
C8BERT
cased: no
in favor75.50%81.66%78.4582.60%
neutral89.32%82.70%85.85
against84.12%83.37%83.72
C9RoBERTain favor81.76%83.20%82.3985.38%
neutral89.73%84.21%86.82
against85.32%88.71%86.92
Publisher’s Note: MDPI stays neutral with regard to jurisdictional claims in published maps and institutional affiliations.

