Article

A Fast and Noise Tolerable Binarization Method for Automatic License Plate Recognition in the Open Environment in Taiwan

1
Department of Information and Communication Engineering, Chaoyang University of Technology, Taichung County 41349, Taiwan
2
Graduate Institute of Statistics and Information Science, National Changhua University of Education, Changhua City 50007, Taiwan
3
Department of Industrial Education and Technology, National Changhua University of Education, Changhua City 50007, Taiwan
4
Department of Operation, Visitor Service, Collection and Information Management, National Museum of Natural Science, Taichung City 40453, Taiwan
*
Author to whom correspondence should be addressed.
Symmetry 2020, 12(8), 1374; https://doi.org/10.3390/sym12081374
Submission received: 23 June 2020 / Revised: 7 August 2020 / Accepted: 13 August 2020 / Published: 18 August 2020
(This article belongs to the Section Computer)

Abstract

:
License plate recognition is widely used in our daily life. Image binarization, which is a process to convert an image to white and black, is an important step of license plate recognition. Among the proposed binarization methods, Otsu method is the most famous and commonly used one in a license plate recognition system since it is the fastest and can reach a comparable recognition accuracy. The main disadvantage of Otsu method is that it is sensitive to luminance effect and noise, and this property is impractical since most vehicle images are captured in an open environment. In this paper, we propose a system to improve the performance of automatic license plates reorganization in the open environment in Taiwan. Our system uses a binarization method which is inspired by the symmetry principles. Experimental results showed that when our method has a similar time complexity to that of Otsu, our method can improve the recognition rate up to 1.30 times better than Otsu.

1. Introduction

Recently, IT technology has been applied symmetrically in our daily life and intelligent transport system (ITS) has become more and more important. License plate recognition (LPR) is a normal and essential core technology of ITS, and it has been a positive research area in the past few years [1,2,3,4]. LPR is used widely in our daily life, such as traffic law enforcement [5], electronic toll collection, automatic payment of tolls on highways, and parking management systems [6]. LPR also helps vehicle tracking and provides a reference for activity analysis of vehicles [7]. Because of the different environments, LPR technologies vary from application to application and many related methods have been proposed. Ashtari, Nordin, and Fathy [8] proposed a method to detect the Iranian license plates by using a template on connected target pixels with the specific color. However, this method is invalid when there are areas whose color information is similar to that of the license plate. Türkyılmaz and Kaçan [9] proposed a LPR method using artificial neural networks. This method improved the recognition rate, but it spent more time on recognizing characters in license plates. Al-Ghaili et al. [10] proposed a fast vertical edge detection algorithm to improve the speed of license plate detection. The authors also compared their method to the Sobel operator in terms of accuracy and processing time. Du et al. [11] presented a survey on existing LPR methods, classified them according to the features used in each stage, and compared them in terms of accuracy and processing speed.
The main challenge of LPR is the large variety of license plates, which differ with respect to shape [12], color, size, and the ratio of height to width [13]. Other difficulties of LPR include severe poor lighting [14], weather conditions [15], the distance between vehicle and camera, and prescribed driveways [8]. The development of an accurate and efficient license plate recognition system (LPRS) that solves these problems mentioned above is important. In general a typical LPRS consists of three main stages [9]: license plate detection, character segmentation, and character recognition, as shown in Figure 1. The goal of license plate detection is to detect vehicle’s license plates in a captured image. Then in the stage of character segmentation [16], the LPRS aims at finding the segmentation of the characters on license plates. Finally, in the character recognition stage, different methods such as support vector machine [17], artificial neural networks [9], or template matching [18] is used to recognize the characters in a license plate.
For a typical LPRS, an image processing technique called image binarization is used to convert gray level images into binary ones. In general, image binarization uses grayscale pixels information to calculate a threshold value, and this threshold is then used to classify the image pixels as belonging to the background or foreground. A good image binarization algorithm helps a LPRS to achieve better efficiency and recognition accuracy. There are many proposed binarization methods such as iterative thresholding [19], peak-and-valley method [20], Otsu method [21], and so on. Proposed image binarization methods can be divided into six groups [22]: histogram shape-based methods, clustering-based methods, entropy-based methods, object attribute-based methods, spatial methods, and local thresholding methods. For a LPRS, real-time recognition is very important and the image background is usually very complicated. Therefore, spatial, entropy-based, and object attribute-based methods were rarely adopted in a LPRS since they require more computational time or have a poor performance when the image background is too complicated. Local thresholding methods were usually used in documents recognition because they have better performance under illumination conditions but also need more computational time.
The most famous and commonly binarization method adopted by a LPRS is Otsu, which is a clustering-based method [21,23,24,25]. According to our experimental analyses, we found that Otsu has two main drawbacks. First, Otsu has a poor performance when a license plate is in a bright or dark environment. That is, Otsu is very sensitive to the ambient light. An example is shown in Figure 2. Figure 2a shows a license plate captured in a bright environment and Figure 2b is the corresponding binary image generated by Otsu. As shown in Figure 2b, when we used Otsu to generate the binary image and then inputted the image into a LPRS, the LPRS was obviously unable to detect and recognize the license plate. Second, Otsu is easily affected by noise such as dirt or rusty screws on license plates. For a license plate in Taiwan, it is usually fixed by two or more screws. Since the climate in Taiwan is hot and humid, these screws get rusty easily. An example is shown in Figure 3. Figure 3a shows a license plate on which two screws got rusty and Figure 3b is the corresponding binary image generated by Otsu. As you can see in Figure 3b, after binarization the rusty screws adhere to the Character “E.” This condition made a LPRS difficult to recognize the character “E” on the license plate.
In order to solve the above-mentioned problems, we propose a LPRS named FANS (FAst and Noise tolerable automatic license plate recognition System). FANS cuts the image into small regions and then calculates a threshold for each region. This property enables FANS to be insensitive to ambient light and noise, and therefore produce better binary images to improve the recognition rate of license plates. Besides, FANS uses a strategy named summed area table [26], which will be discussed in Section 3, to reduce the binarization time. Experimental results showed that FANS needed less execution time than the LPRS using Otsu.
The rest of this paper is organized as follows. In Section 2 we discuss the related works. In Section 3 we propose our LPRS. In Section 4, experimental results and analyses are provided. Finally Section 5 presents the conclusions.

2. Related Works

In this section, we briefly discuss the three main stages of a typical LPRS and the proposed image binarization techniques.

2.1. License Plate Detection

The main goal of license plate detection is to identify some local patches containing license plates in an image. Because a license plate can exist anywhere in an image with different sizes, it is impractical to check every pixel in the image to locate the license plate. A preferable approach is to extract some useful features, such as the ratio of height to width or color and gray level information from images, and then use the obtained information to locate license plates.
Proposed license plate detection methods can be roughly classified into three categories [27]: texture-based, edge-based, and color-based. Among the three kinds of methods, edge-based method is the most popular because of its reliable performance. In general, a license plate is characterized by a rectangular shape with a specific aspect ratio. As a result, license plates can be theoretically extracted by checking all possible rectangles in the image. Kamat and Ganesan [28] used the Hough transform to find the boundaries of license plates and detected the license plates regions. However, the Hough transform’s computational complexity is very high and it is valid only when the image background is simple. Zheng, Zhao, and Wang [29] combined edge detection with the morphological operations to find rectangles of license plate location. The disadvantage of this method is that it is sensitive to the brightness change in the license plate region and the complicated background in images. There are two main problems of edge-based methods [23]. First, edge-based methods may be confused by some objects with rich texture and similar shape. Second, when a license plate changes its location in an image compared to observation, edge-based methods may only detect partial license plates or even miss them.
Color-based methods are based on the observation that many countries have specific colors in their license plates. Therefore we can intuitively extract license plates by locating colors in the images. For example, Shi, Zhao, and Shen [30] used a classifier of color model to detect the plates. Yang et al. [31] proposed a method based on fixed color collocation to detect license plates. Their method can eliminate the disturbances of the fake plate’s region and locate the plate efficiently by the color collocation of the plates’ background and characters combined with the plates’ structure and texture. Zhu, Hou, and Xing [32] proposed a method based on color feature and mathematical morphology to locate license plates in a complicated background. In their method, the color of each pixel in the image is identified by some characteristic functions. Then candidates of license plate areas are generated by a series of mathematical operations, and the license plate is extracted from these candidates. The main advantage of license plate detection using color information is that it can locate the deformed and inclined license plates. However, color-based approaches are sensitive to the illumination changes and complicated backgrounds.
Methods in the third category are focused on texture features. There are many texture features in license plates, such as color, shape, size, and so on. Kim, Jung, and Kim [33] presented a color texture-based method for license plate detection. They used support vector machine to analyze the color textural properties of license plate, and then locate license plates. Porikli and Kocak [34] used a covariance matrix and neural network to detect license plates. Their method converts an image into a feature covariance matrix, which can capture not only the license plate appearance but also the statistical properties of image regions.

2.2. Character Segmentation

Character segmentation is the procedure of extracting characters from license plates in an image [35]. The main objective of character segmentation is to obtain clean characters to improve the recognition rate of license plates. Many character segmentation methods have been proposed such as horizontal and vertical projections, mathematical morphology, and contour tracking. Among them, projection methods are commonly used in LPRS [36]. The main principle behind vertical projection is to calculate the number of pixels of each column on a license plate and use this information to separate characters. Shi, Zhao, and Shen [30] separated characters from each other using vertical projection at binary level. Nomura et al. [37] proposed a morphological method based on the histogram for character segmentation. Their method separates characters by searching for segmentation points in a histogram and then these points are combined to find characters.
Connected component analysis is another important technique in binary image processing. This technique was commonly used in license plate detection and character segmentation. It scans a binary image and labels its pixels into components based on pixel connectivity. Once all groups of pixels are determined, each pixel is labeled with a value according to the component to which it is assigned. According to the number of components used in connected component analysis, this method can further be classified into 4-connectivity and 8-connectivity [36].

2.3. Character Recognition

There are also many proposed character recognition methods such as support vector machine [17], artificial neural network [9], and template matching [18]. Türkyılmaz and Kaçan [9] used artificial neural network to recognize license plates. This method improves the recognition rate but spends more computational time to recognize license plates. Khan and others [17] proposed support vector machine to deal with the problems of light variations, occlusion, and multi-views. Their method can reach good recognition rate under these conditions. Gazcón, Chesñevar, and Castro [18] proposed an approach named intelligent template matching to solve the LPRS problem of Argentinean license plates. Experimental results showed that their method is superior to artificial neural network in classification accuracy and training time.

2.4. Image Binarization
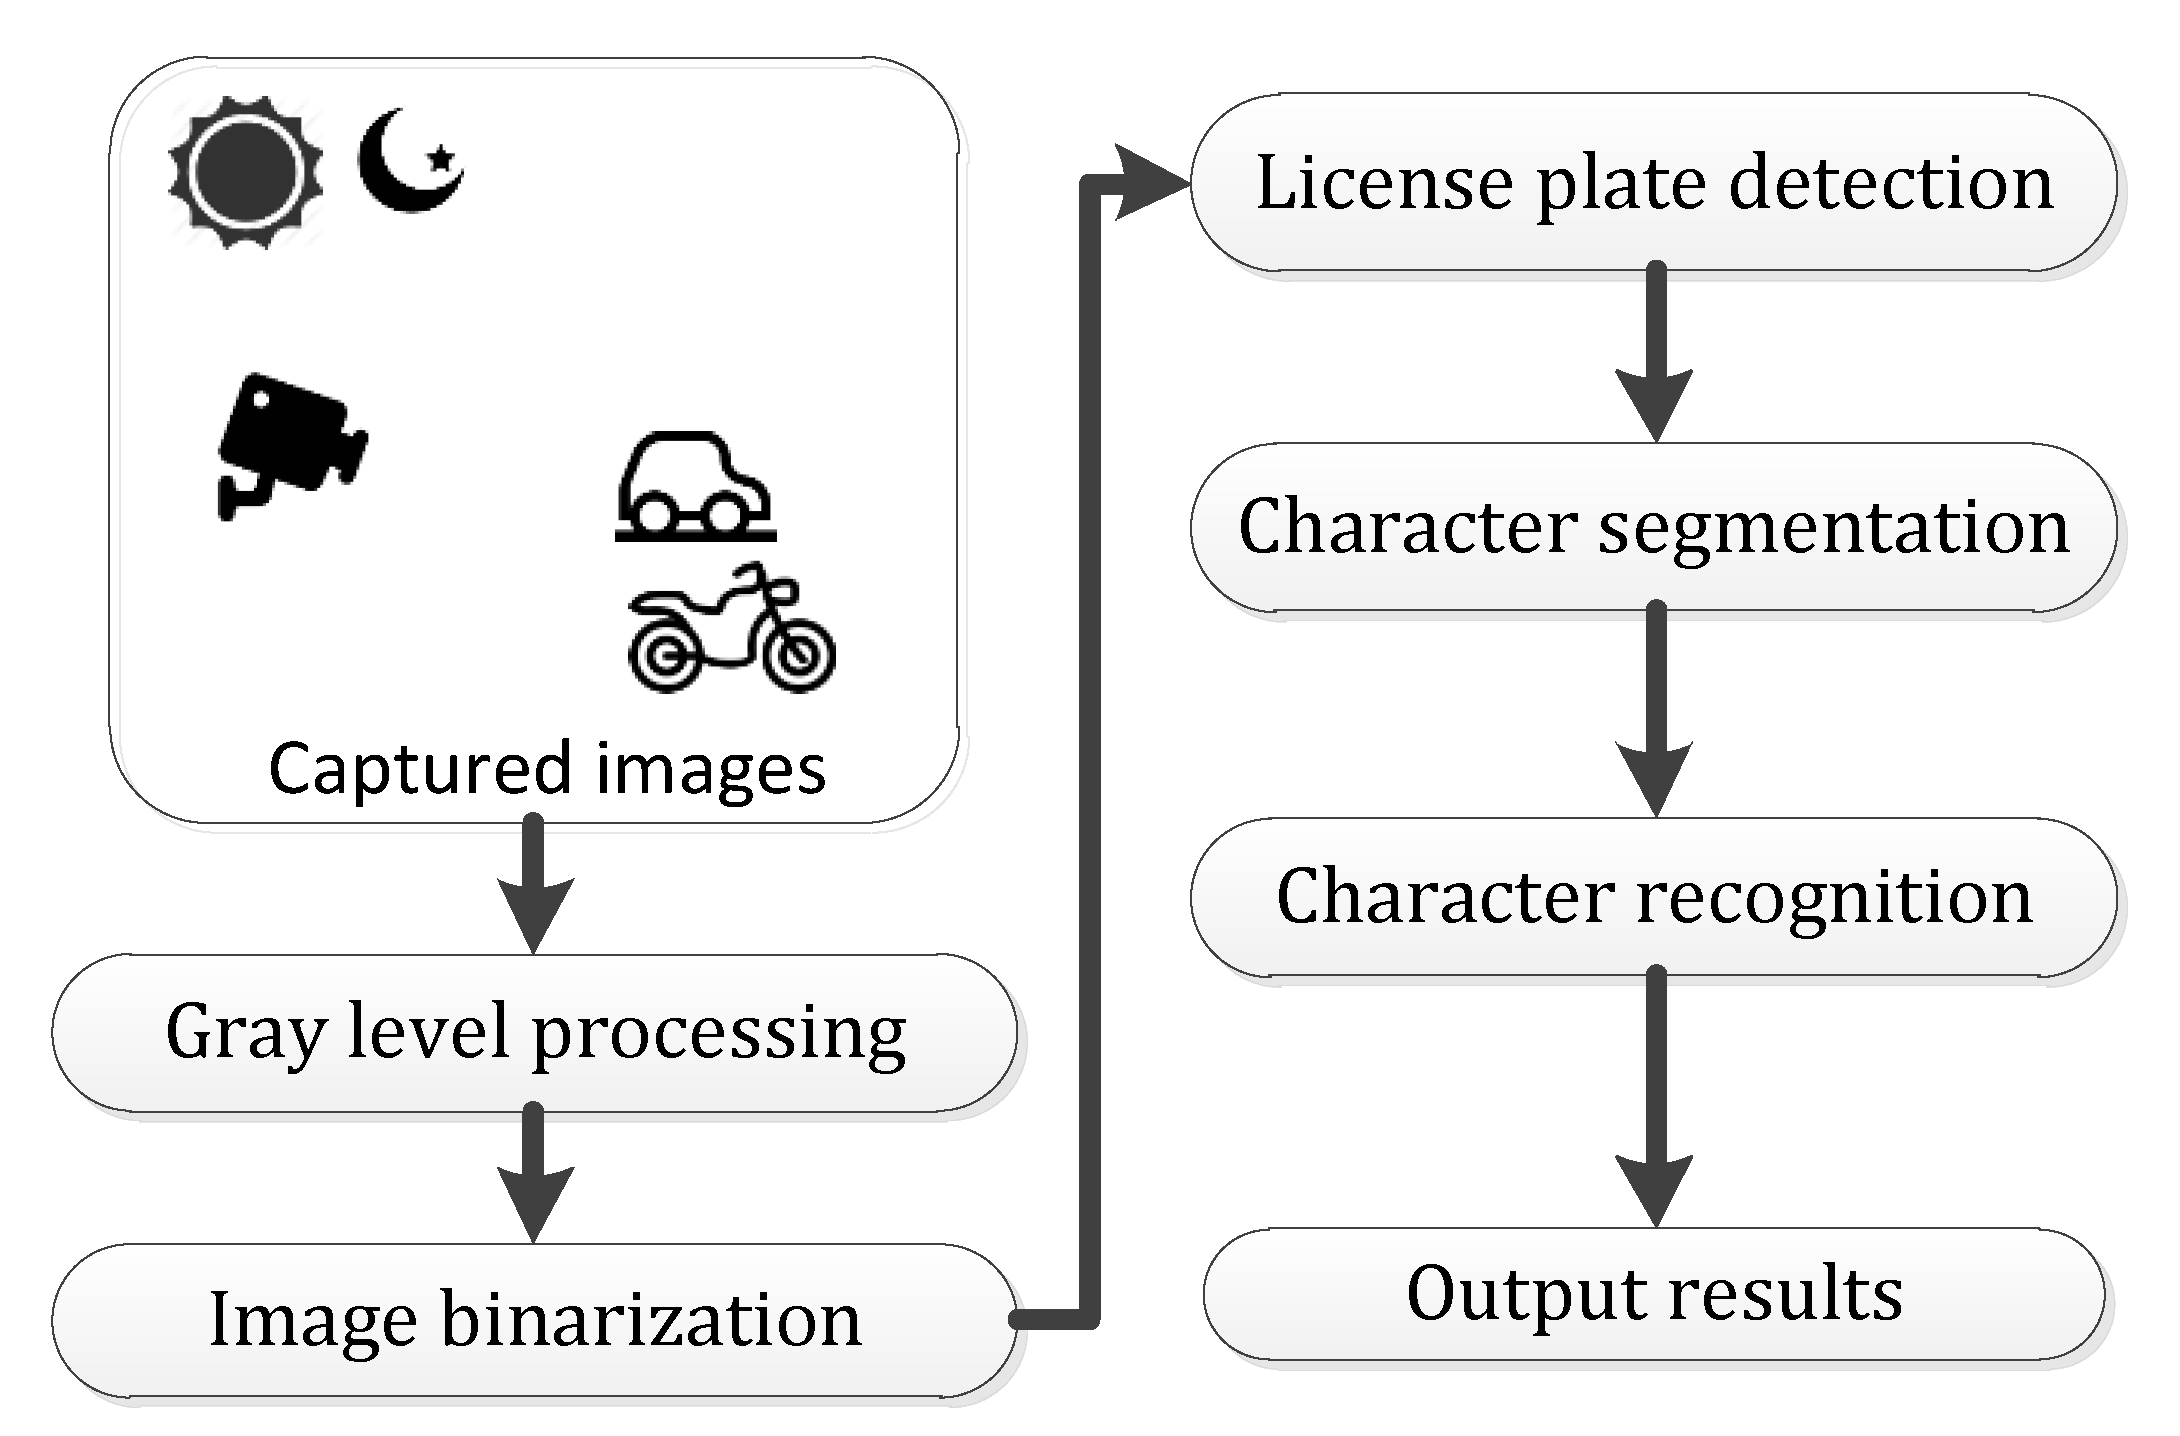
Image binarization is a process to convert an image to white and black. In general, a certain threshold is chosen to classify certain pixels as white and certain pixels as black. Proposed image binarization method can be divided into six groups according [22]: histogram shape-based methods, clustering-based methods, entropy-based methods, object attribute-based methods, spatial methods, and local thresholding methods. Histogram shape-based methods achieve thresholding based on the shape properties of the histogram. The main idea is to calculate the number of pixels in an image to obtain the corresponding histogram. Then the threshold is selected by searching for peaks and valleys in the histogram or by searching overlapping peaks via curvature analysis. For example, Rosenfeld and De La Torre [38] analyzed the concavities of histogram to choose a threshold. When the convex hull of the histogram is calculated, the deepest concavity points became candidates for a threshold. Sezan [17] proposed an adaptive peak detection algorithm. The algorithm uses a peak detection signal derived from the histogram to locate the peaks and chooses a threshold from peaks. The main problem of histogram shape-based methods is that they are easily affected by pixel distribution.
In clustering-based methods, the gray level data undergoes a clustering analysis in which the number of clusters is always set to two. Accordingly, pixels from gray level data are classified to two clusters: background and foreground. Since the two clusters correspond to the two lobes of a pixel histogram, some authors search for the midpoint of the peaks and treat the midpoint as a threshold [22]. Ridler and Calvard [19] proposed an iterative thresholding method. At each iteration, a new threshold is obtained by calculating the average of the foreground and background pixels. Otsu [18] minimized the weighted sum of within-class variances of the background and foreground pixels to establish a best threshold. Otsu has proved that the minimization of within-class variances is tantamount to the maximization of between-class scatter. When the numbers of pixels in each class were close to each other, Otsu method reaches satisfactory results.
Entropy-based methods utilize the entropy of the distribution of the gray levels to binarize images. For example, Kapur, Sahoo, and Wong [39] considered the image foreground and background as two different signal sources, so that when the sum of the two class entropies reaches its maximum, the image got an optimal threshold. The main drawback of entropy-based method is that it requires more computational time to calculate the entropy. Object attribute-based methods select the threshold based on similarity measure or some attribute quality between the original image and the binary image. These object attributes can take the form of shape compactness, gray level moments, edge matching, and so on. Hertz and Schafer [40] proposed a multi-thresholding technique in which a thinned edge field, obtained from the gray level image, was compared with the edge field obtained from the binary image. The threshold was given by the value that maximizes the coincidence of the two edge fields.
Spatial thresholding methods utilize the gray value distribution and dependency of pixels in a neighborhood, for example, in the form of correlation functions, context probabilities, co-occurrence probabilities, and so on. Chanda and Majumder [41] used gray level co-occurrence matrices to get a threshold. This method considers dependency of pixels in a neighborhood in images, and it is effective for segmenting noisy images. Local thresholding methods get a threshold by considering some local statistics like variance or range. White and Rohrer [42] proposed a local contrast method to binarize documents. This method compares the gray value of the pixel with the average of the gray values in the neighborhood. If the pixel is darker than the average, it is denoted as character; otherwise, it is classified as background. Local thresholding methods were usually used in documents recognition, because they have better performance under illumination conditions.
The most famous and commonly binarization method adopted by a LPRS is Otsu method since it is the fastest and can reach a comparable recognition rate [22,24]. For a gray level image, Otsu calculates the frequency and the probability distribution of each pixel and generate a corresponding histogram. Suppose that each pixel in a gray level image is represented by a gray level value i (0 ≤ i ≤ 255, i ∈ Z), the probability distribution p(i) is calculated by Equation (1).
p(i) = ni/N
In Equation (1), ni denotes the number of pixels at gray scale i, N denotes the total number of pixels in a gray level image, Σp(i) = 1, and N = Σni. Otsu checks all gray level values to obtain an optimal threshold and transfers a gray level image into binary image by this threshold. For a threshold t, Otsu divides 256 gray scales in an image into two classes: foreground pixel C1 and background pixel C2, where C1 = {0, 1, …, t} and C2 = {t + 1, t + 2, …, 255}. Then the probability of class occurrence ω1(t) and ω2(t) are calculated by Equation (2) and class mean μ1(t) and μ2(t) are calculated by Equation (3).
{ ω 1 ( t ) = p ( C 1 ) = Σ i t p ( i ) , ω 2 ( t ) = p ( C 2 ) = Σ i > t p ( i ) .
{ u 1 ( t ) = Σ i t ( p ( i ) i ) / ω 1 , u 2 ( t ) = Σ i > t ( p ( i ) i ) / ω 2 .
For any threshold t, the following relation is valid.
ω1(t) + ω2(t) = 1
Otsu uses the within-class variance σw2(t) and between-class variance σb2(t) as shown in Equations (5) and (6) to evaluate the goodness of a threshold t.
σw2(t) = ω1 × σ12 + ω2 × σ22.
σb2(t) = ω1(t) × ω2(t) × [μ1(t) − μ2(t)]2.
Otsu has proved that minimization of within-class variances is equivalent to the maximization of between-class scatter. Finally, the optimal threshold t* is obtained by finding the value that maximizes σb2(t) as shown in Equation (7).
σb2(t*) = max σb2(t)

3. Proposed System

3.1. Gray Level Processing

For a LRPS, an input image may consist of many objects and colors. Input images may also be captured in different lighting environment. The gray level conversion can enhance the features of input images and reduce the luminance effect by separating the darker values in images more differently. As in most LPRSs, the first step of FANS is gray level processing. The common method to transform color images into gray level ones is shown in Equation (8), which is defined by the National Television System Committee [43].
Gray = 0.299 × Red + 0.587 × Green + 0.114 × Blue.
Since floating-point operations spend more computational cost than integer operations, FANS reduces the number of floating-point operations by using Equation (9) to improve system performance. Figure 4 shows an example of gray level conversion in FANS.
Gray = (3 × Red + 6 × Green + Blue)/10.

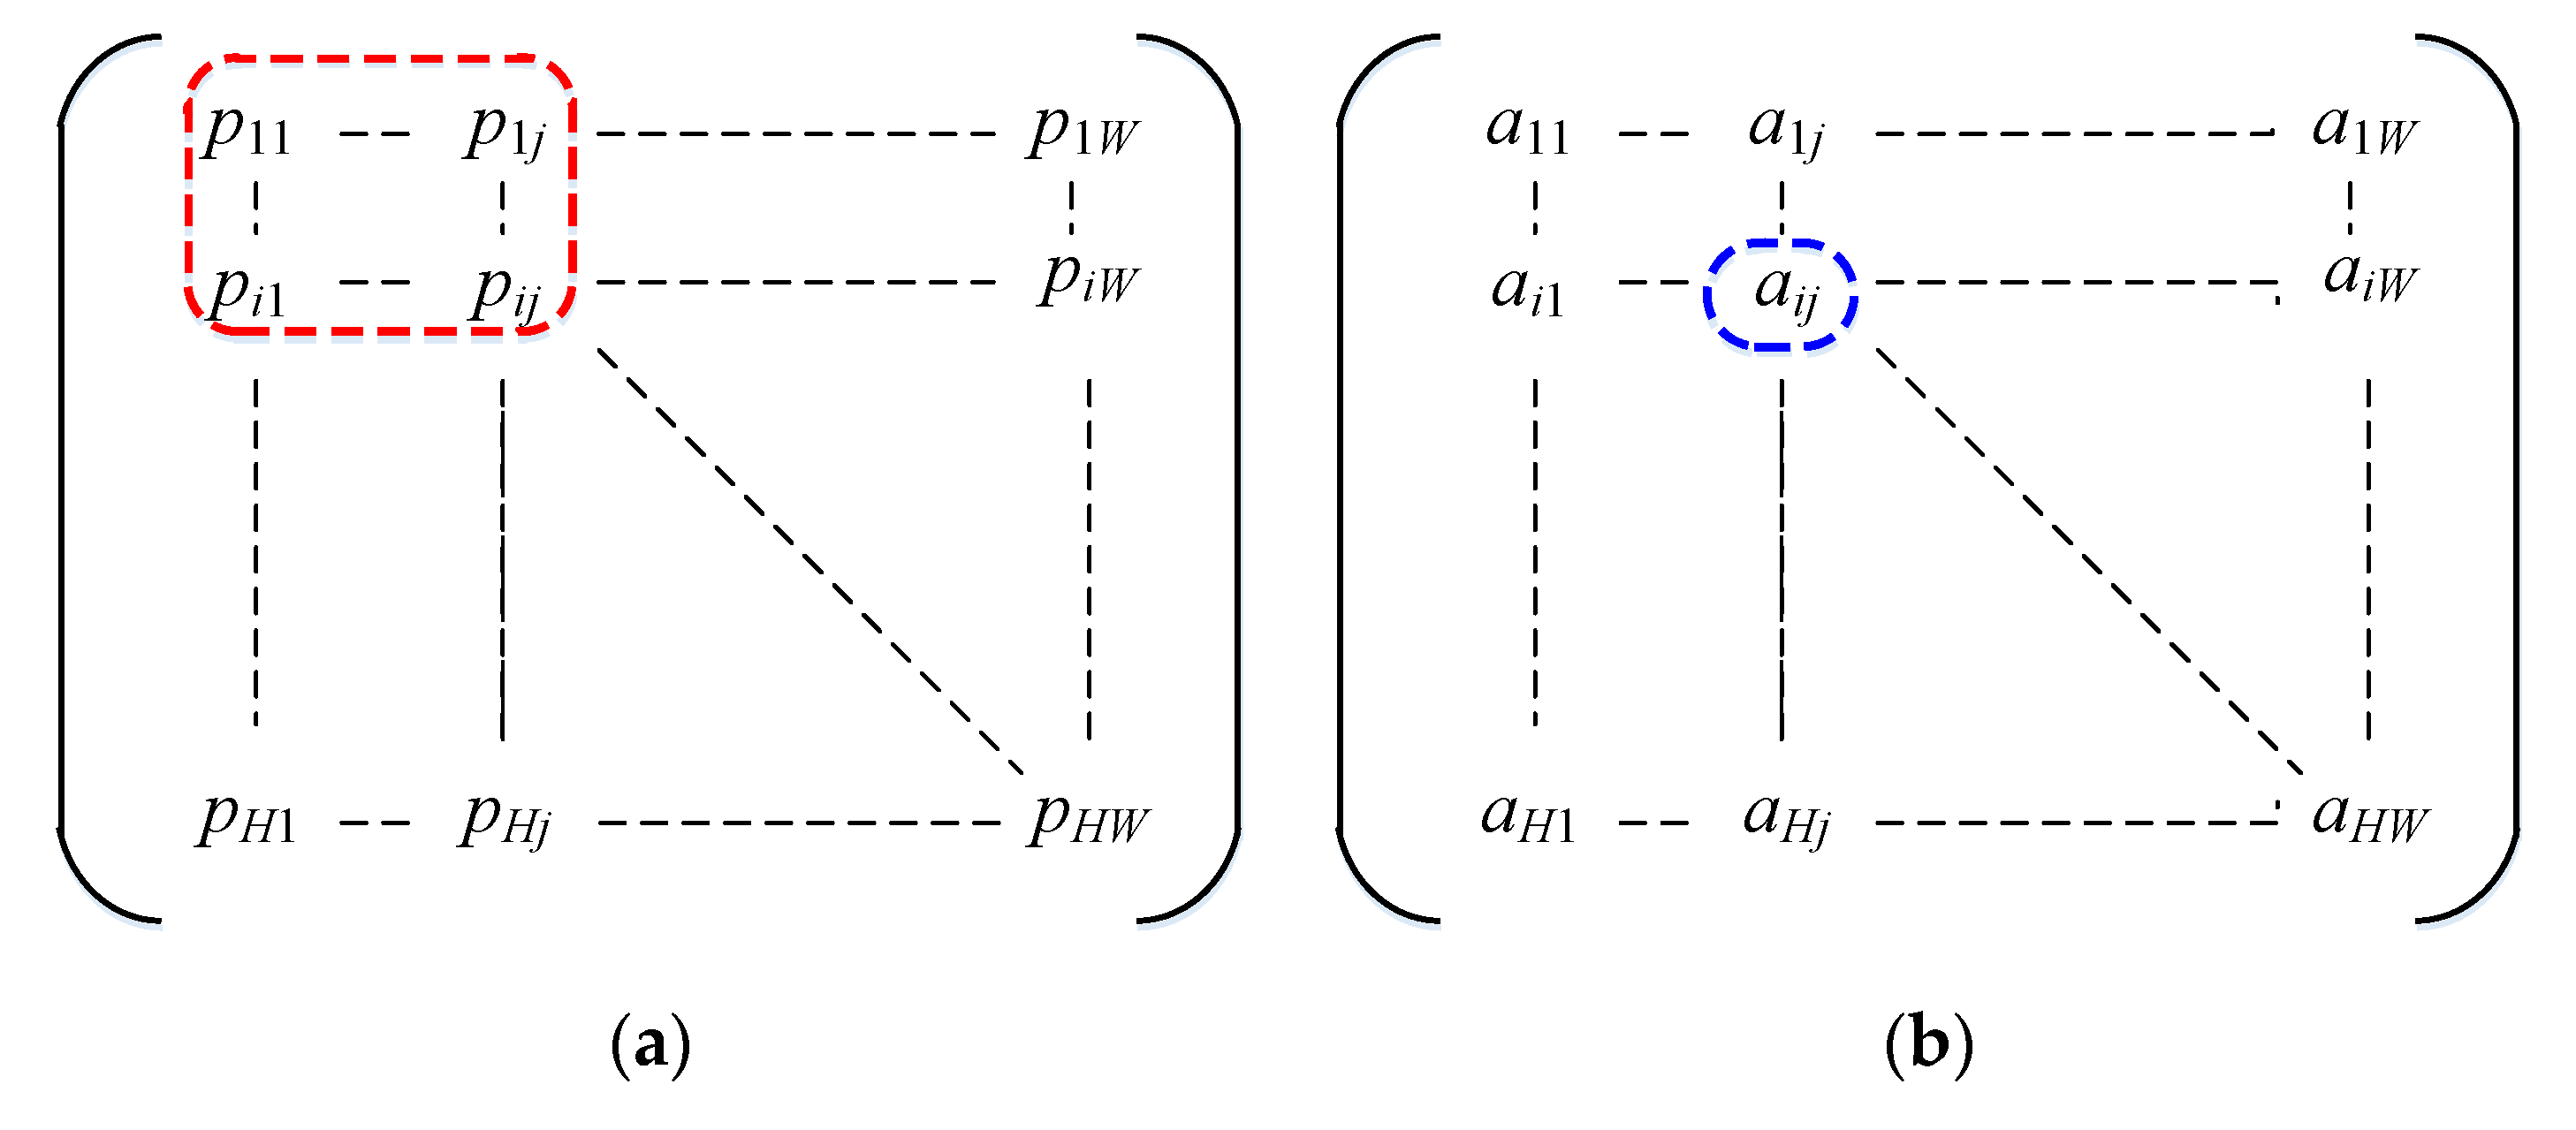
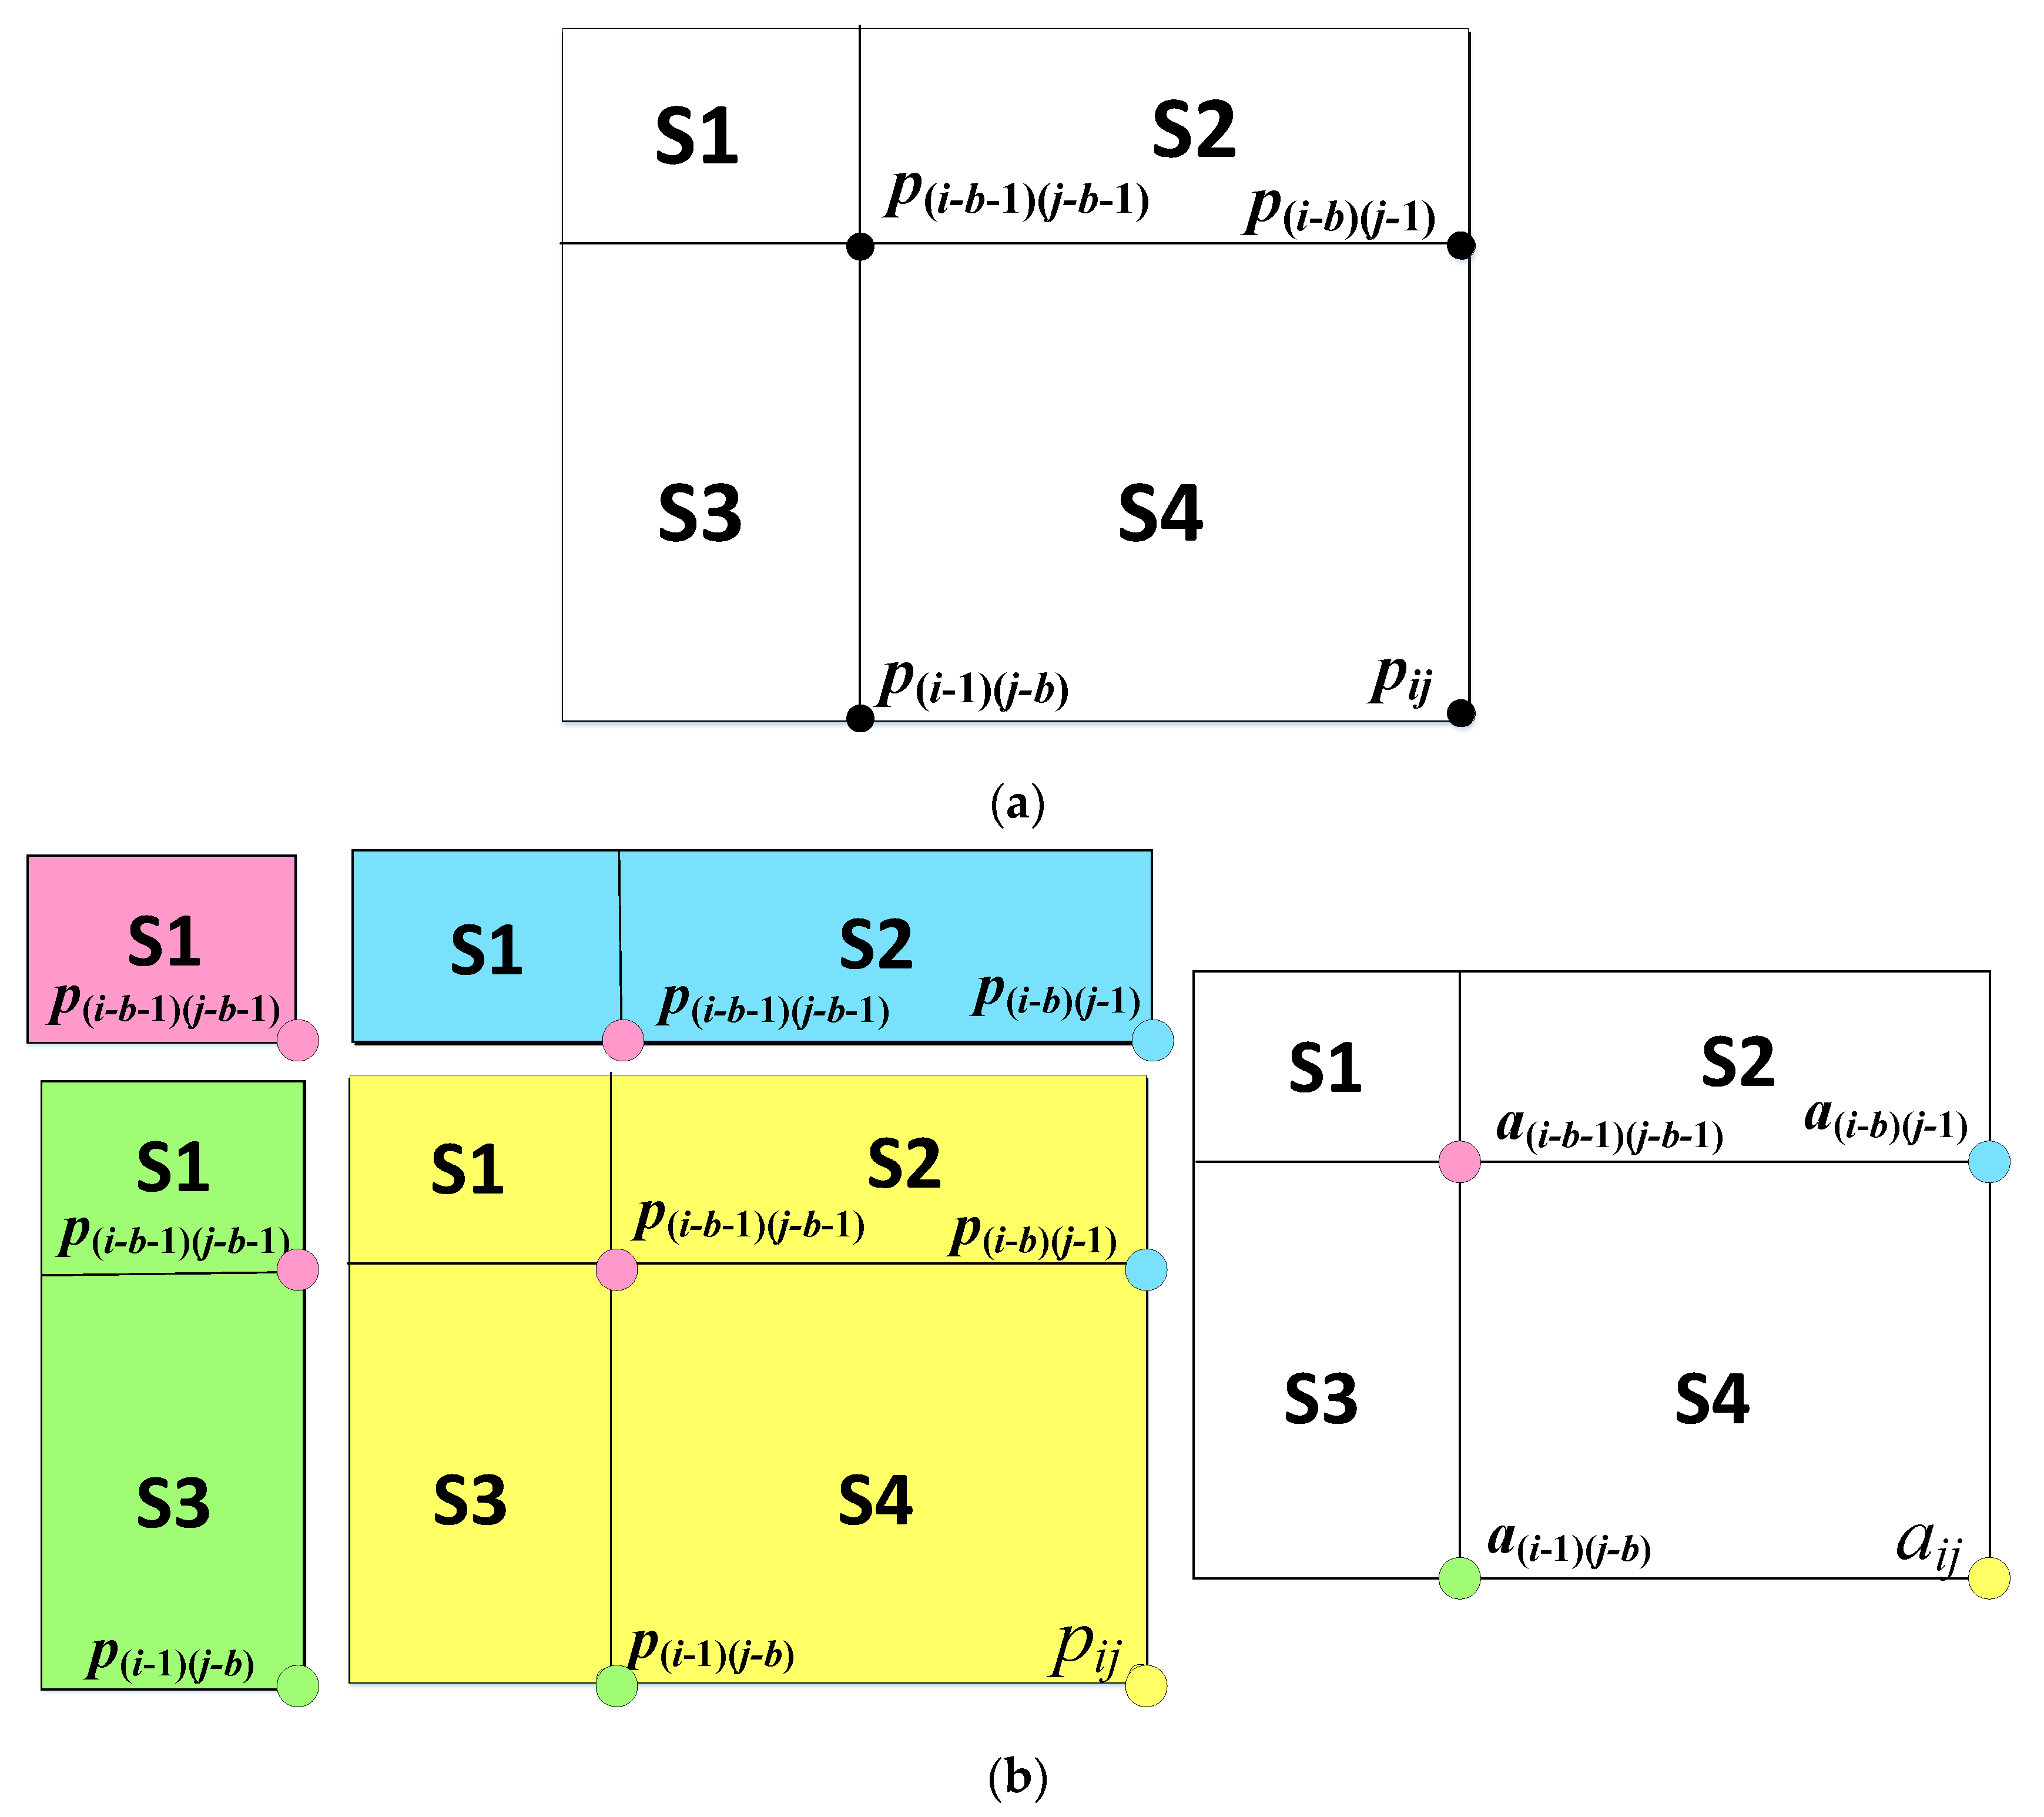
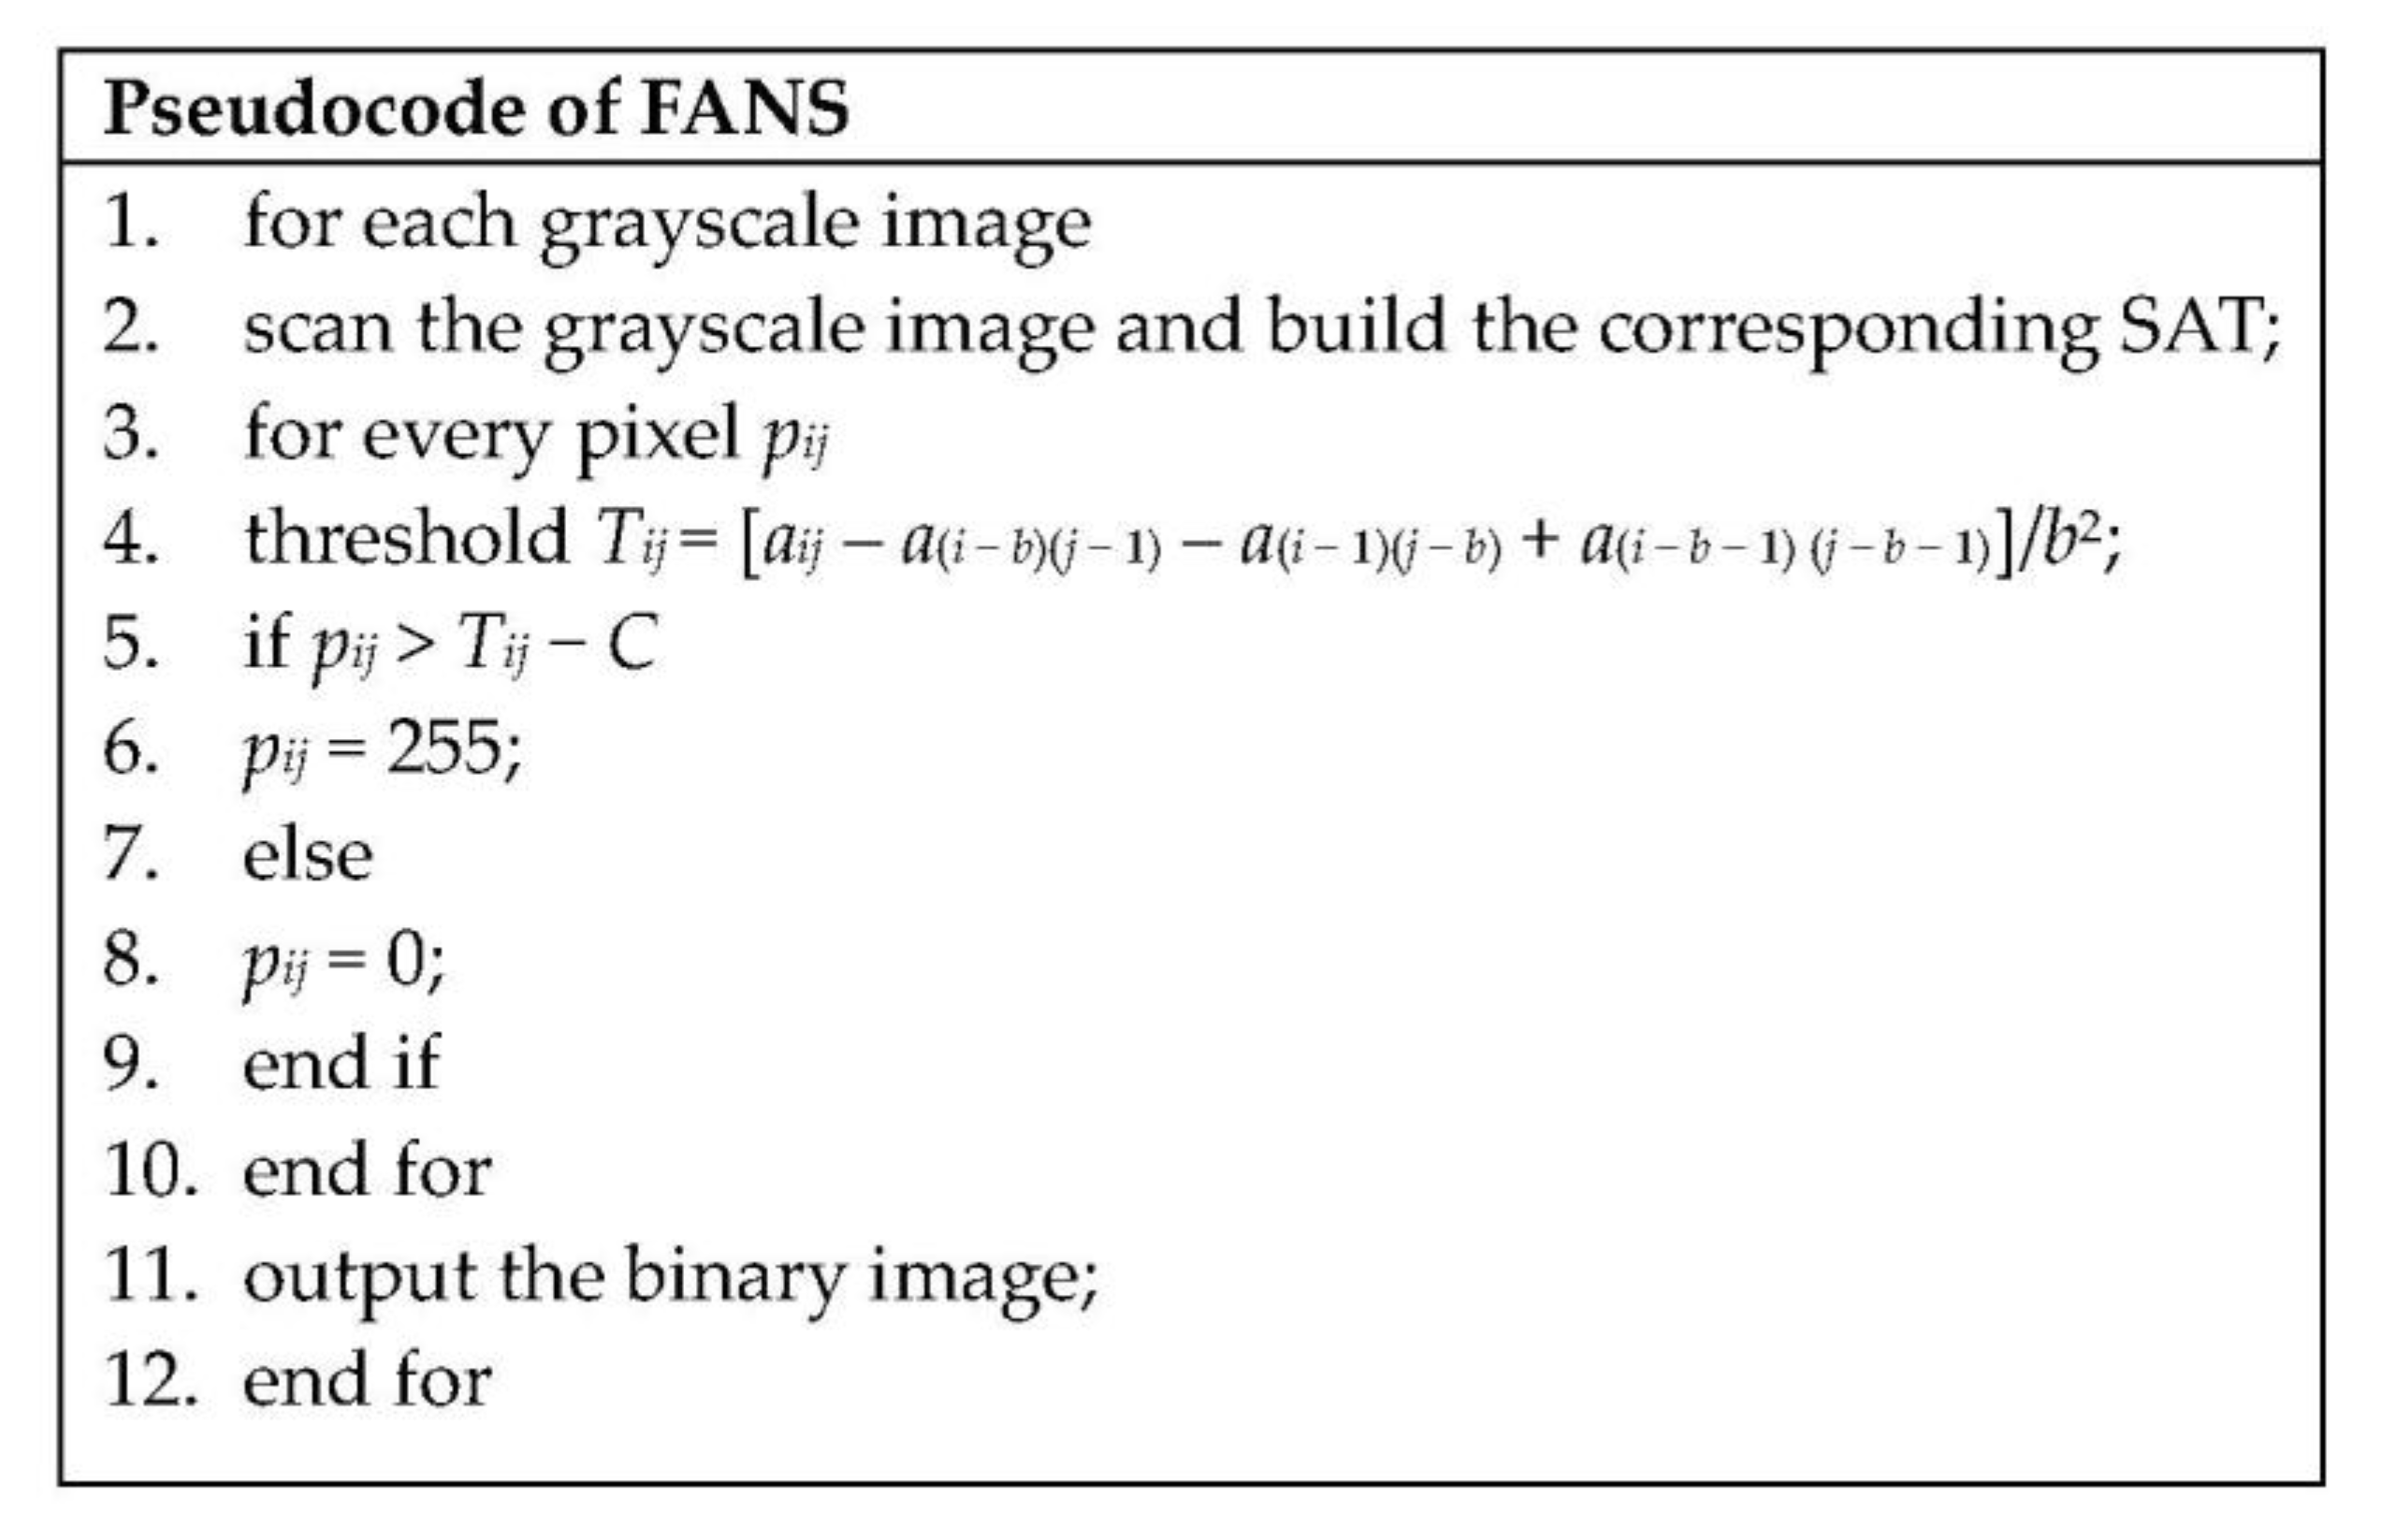
3.2. Fast and Noise Tolerable Binarization Algorithm

As discussed in Section 1 and Section 2, Otsu is the most famous and commonly used image binarization method in a LPRS because it is the fastest and can reach a comparable recognition rate. However, Otsu has two main drawbacks, i.e., it is sensitive to luminance effect and noise. To solve this problem, FANS uses a local threshold method. FANS uses an b × b mask to calculate a threshold Tij for each pixel pij as shown in Equations (10) and (11), where 1 ≤ iW, 1 ≤ jH, and W and H respectively denotes the width and height of the image.
Tij = Σ pxy/b
{ i ( b 1 ) / 2     x     i + ( b 1 ) / 2 , j ( b 1 ) / 2     y     j + ( b 1 ) / 2 .
However, when grayscale pixels are close to each other in a mask, the pixels of this region may be wrongly classified. For example, when there are night grayscale pixels in a 3 × 3 mask region, i.e., one pixel is 255 and the others are 250, the threshold of this region is 250.55. In this situation, the eight pixels are classified as black because the threshold is a bit higher. However, these pixels should be classified as white since they are actually white pixels but are affected by shadow. In a real application, this situation often occurs when license plates fall under luminance effect. To solve the above situation, FANS subtracts a constant C from threshold Tij as shown in Equation (12). This strategy was commonly used in many proposed binarization methods [44,45]. The experimental analysis of C in our LPRS is discussed in Section 4.
TijC = *Tij.
Consequently, FANS uses the threshold *Tij to binarize a pixel pij as shown in Equation (13). The main idea behind FANS is that if we use only one threshold to binarize the whole image, the results would be sensitive to luminance effect and noise. FANS finishes the binarization until the mask finishes scanning a whole image.
{   if   p i j   * T i j   ,     p i j = 0 ,         if   p i j >   * T i j   ,     p i j = 255 .
However, similar to the proposed local binarization methods, FANS spends time on calculating thresholds for each pixel. The computational time is affected by the mask size. The larger the mask size, the more binarization time FANS needs. To solve this problem, FANS uses a summed area table (SAT) [26] as defined in Definition 1 to reduce the computational cost.
Definition 1.
Suppose that the mask size is b × b. For a given matrix P[] which records the grayscale pij of pixels in an image, a SAT is a matrix in which each element aij stores the summation of pxy as shown in Equation (14), where 1 ≤ x i, 1 ≤ y j, and x, y Z.
aij = Σpxy
In other words, each element aij in a SAT is the summation of pxy which locates at the top-left corner of pij. The illustration of a SAT is shown in Figure 5, where Figure 5a is the pixels distribution matrix of a grayscale image consisting of W × H pixels and Figure 5b is the corresponding SAT generated by FANS. For example, the element aij in Figure 5b stores the sum of grayscales within the red region in Figure 5a. It is worth noting that before the image binarization starts, the first row of SAT is initialized to zero to avoid the program crashing.
FANS uses SAT to reduce the computational time. Without SAT, FANS needs b2 calculation steps in a double loop to calculate a threshold Tij, where b2 is the mask size. When FANS uses SAT, the number of steps is reduced from b2 to 1. That is, FANS needs only one step to calculate a local threshold. We prove this property in Lemma 1.
Lemma 1.
For a given pixels distribution matrix of a grayscale image, suppose that the mask size is b × b, SAT enables FANS to reduce the number of calculation steps from b2 to 1 when calculating a local threshold.
Proof. 
As shown in Equation (10), FANS needs b2 steps to obtain the sum Σpxy to calculate a threshold Tij. However, for any pixel pij, we can divide an image into four regions S1, S2, S3, and S4 as shown in Figure 6a. Since the mask size is b × b, we can get that Σpxy is the summation of pixels located at Region S4. Since every element aij in SAT stores the summation of pxy which locates at the top-left corner of pij, we can get
aij = S1 + S2 + S3 + S4,
as shown in Figure 6b. Similarly, we can get
a(I − b)(j − 1) = S1 + S2,
a(I − 1)(j − b) = S1 + S3,
a(I − b − 1) (j – b − 1) = S1.
Combine Equations (15) to (18), we can get
aija(i − b)(j − 1)a(i − 1)(j − b) + a(i − b − 1) (j − b − 1) = S4 = Σpxy
That is, with SAT, FANS needs only one calculation step, i.e., aija(i − b)ja i(j − b) + a (i − b) (j − b), to calculate a threshold.  □
The pseudocode of binarization in FANS is shown in Figure 7. After inputting the grayscale image in Line 1, FANS generates SAT in Line 2. In Line 4, FANS calculates the local threshold for each pixel and utilizes the SAT to speed up the calculation time. In Lines 5 to 9, FANS binarizes a pixel. FANS finishes the binarization of an image until all pixels are binarized. Finally, FANS outputs the binary image in Line 11. We analyze and compare the computational complexity of Otsu and FANS as shown in Table 1 and Table 2. For a grayscale image consisting of W × H pixels, Otsu needs W × H calculation steps to obtain the histogram and probability distribution. Then, Otsu calculates a global threshold form the histogram, and this procedure needs 256 steps. Finally, Otsu uses the threshold to binaries the image, which needs W × H steps. As a result, the total computational complexity of Otsu is 2WH + 256. As to FANS, the time complexity of building a SAT is W × H. FANS also needs W×H steps to binarize each pixel. It is worth noting that without SAT, the computational complexity of this step is W × H × b2. Consequently, the total computational complexity of FANS is 2WH. From the viewpoint of big O analysis, Otsu and FANS have the same time complexity O(WH).

3.3. License Plate Detection and Character Segmentation

FANS uses 4-connectivity to label connected components and remove noise and then uses an edge-based method that uses a mask to detect license plates. The mask locates the license plate by a fixed license plate ratio of height to width. If the number of black pixels within this mask is close to that of a real license plate, this area covered by the mask is regarded as a license plate. A standard license plate ratio of height to width is 2.375 in Taiwan as shown in Figure 8. After license plate detection, FANS uses the projection method to segment characters.

3.4. Character Recognition

License numbers consist of single characters, including letters and numbers. In the final step, FANS uses a template matching method to recognize the characters in a license plate. Template matching is a simple and straightforward method in character recognition. The recognition is achieved by comparing each extracted character with the templates in a pre-defined database. The template with highest matching value is regarded as the recognized character. Since the sizes of license plates in input images may be different, we need to normalize the character sizes before recognizing them. Templates size used by Türkyılmaz and Kaçan is 20 × 30 pixels [9]. However, the characters size in Taiwan’s license plates is 45 × 90 mm and consequently the ratio of height to width is 0.5. Therefore, FANS normalized templates to 15 × 30 pixels, which has a same ratio of height to width 0.5. Since the size of our experimental images is 4032 × 3024, which is too big for a LPRS, we normalized all images to 800 × 600. Both aspect ratios are 1.333. The license plates have twenty-six letters and ten numbers, so the minimum number of templates in a database is thirty-six. Our database has 854 templates. In order to avoid the problem of overfitting, the templates were created by 246 captured images that were different to those used in our experimental analysis.

4. Experimental Results and Discussions

4.1. Experimental Environment and Data

We implemented five LPRSs by Java. The five LPRSs are the same except for the image binarization method they adopted. In order to facilitate the following explanation, we use the term “Otsu” to represent the LPRS in the rest of this paper. The interfaces of the LPRSs of FANS and Otsu are shown in Figure 9, in which the gray buttons were used to observe the experimental results, such as gray level, detection rate, and recognition rate. All experiments were done on a laptop with Intel(R) Core(TM) i7-6700 3.50 GHz quad-core CPU, 8.0 GB RAM memory, and Windows 10 home version OS. All experimental images were taken by an iPhone 8 which has a built-in camera with 1.22 μm pixel size. The resolution of all captured experimental images is 4032 × 3024. The camera’s flash was set to “automatic.” With regard to the number of experimental images and the distance from the camera to the license plate, we followed the experimental setups in [8] and [9]. The distance from the camera to license plates ranged from 1.5 to 3 m and 340 images were captured from the real environment in Taiwan. In order to compare the detection rate and recognition rate in different illumination conditions, we collected 170 experimental images in the daytime and the other 170 images in the nighttime in Taiwan. Among the 340 experimental images, 44 images contained dirt and these images were used to make comparisons with recognizing dirty license plates.
Table 3 is the analysis of parameter C used in FANS in Equation (12). In Table 3, detection rate denotes the percentage of license plates that were correctly detected and recognition rate denotes the percentage of license plates in which all characters were correctly recognized. According to our experimental analysis, we found that when C was 4, FANS reached the best detection rate and recognition rate. From Table 3 we also found that the recognition rate and detection rate fell when C was larger 10. The reason is that when C became too large, the threshold *Tij became smaller. Consequently, there were more pixels classified as to white, but these pixels possibly belong to black in this mask region. This binarization error reduced the recognition rate of a LPRS. Table 4 is the analysis of mask size and we found that when the mask size was 9 × 9, FANS reached the best performance. The reason is that a small mask would make the characters in a license plate too thin while a big mask would make the characters too thick, so a moderate mask size is more appropriate. According to Table 3 and Table 4, the default mask size of FANS was set to 9 × 9 and C was set to 4 in the following experiments.

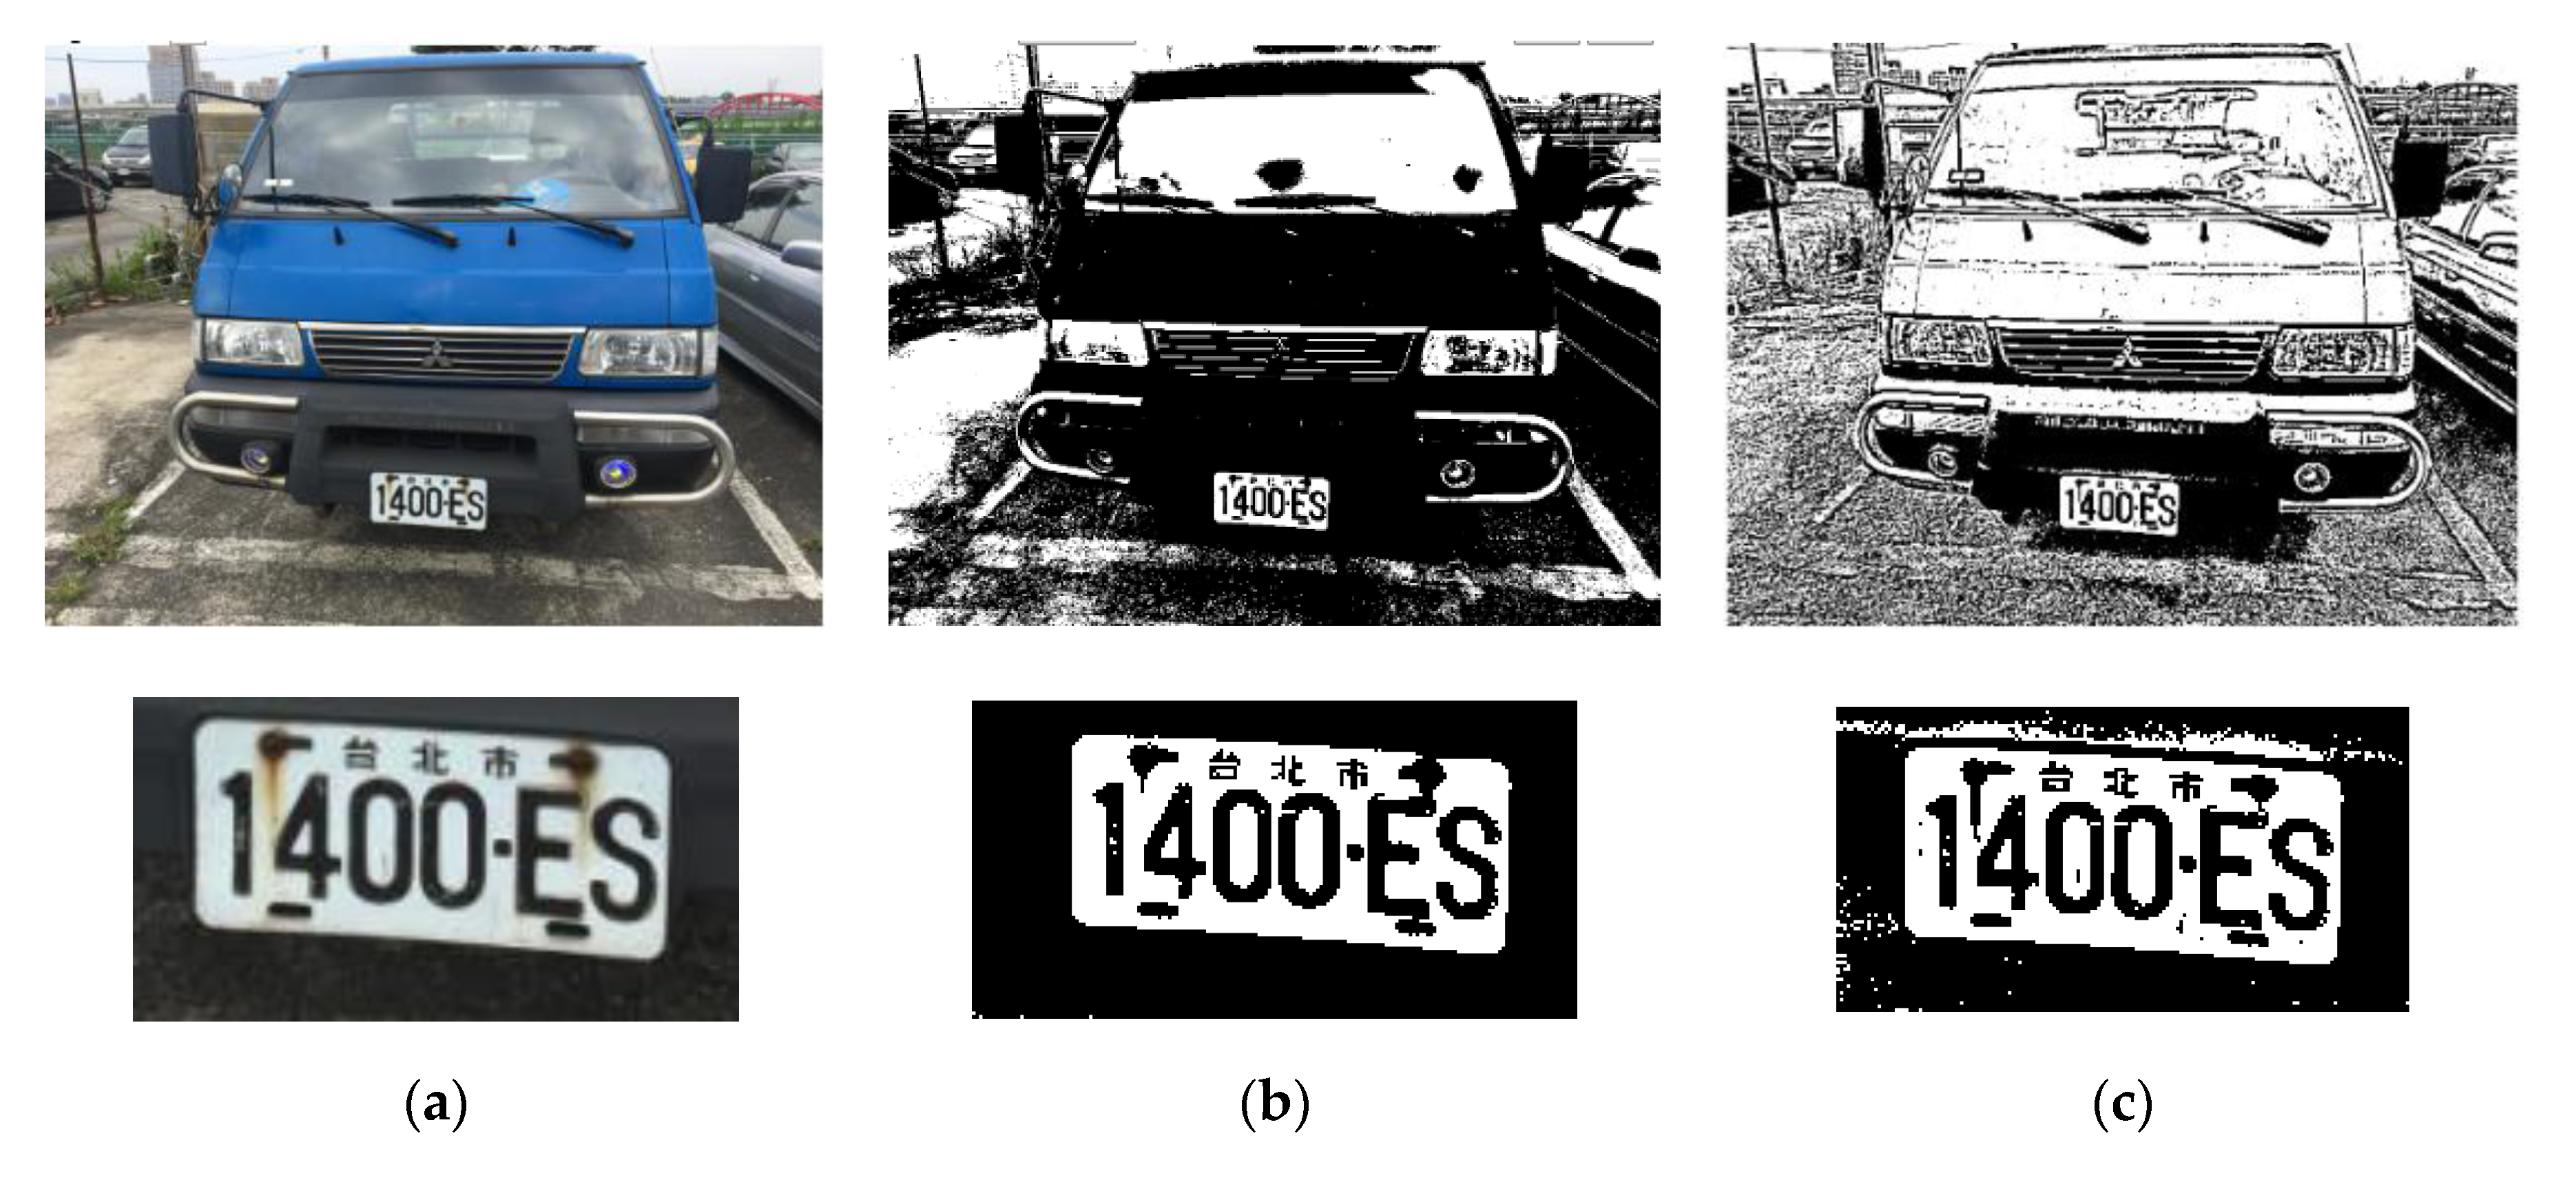
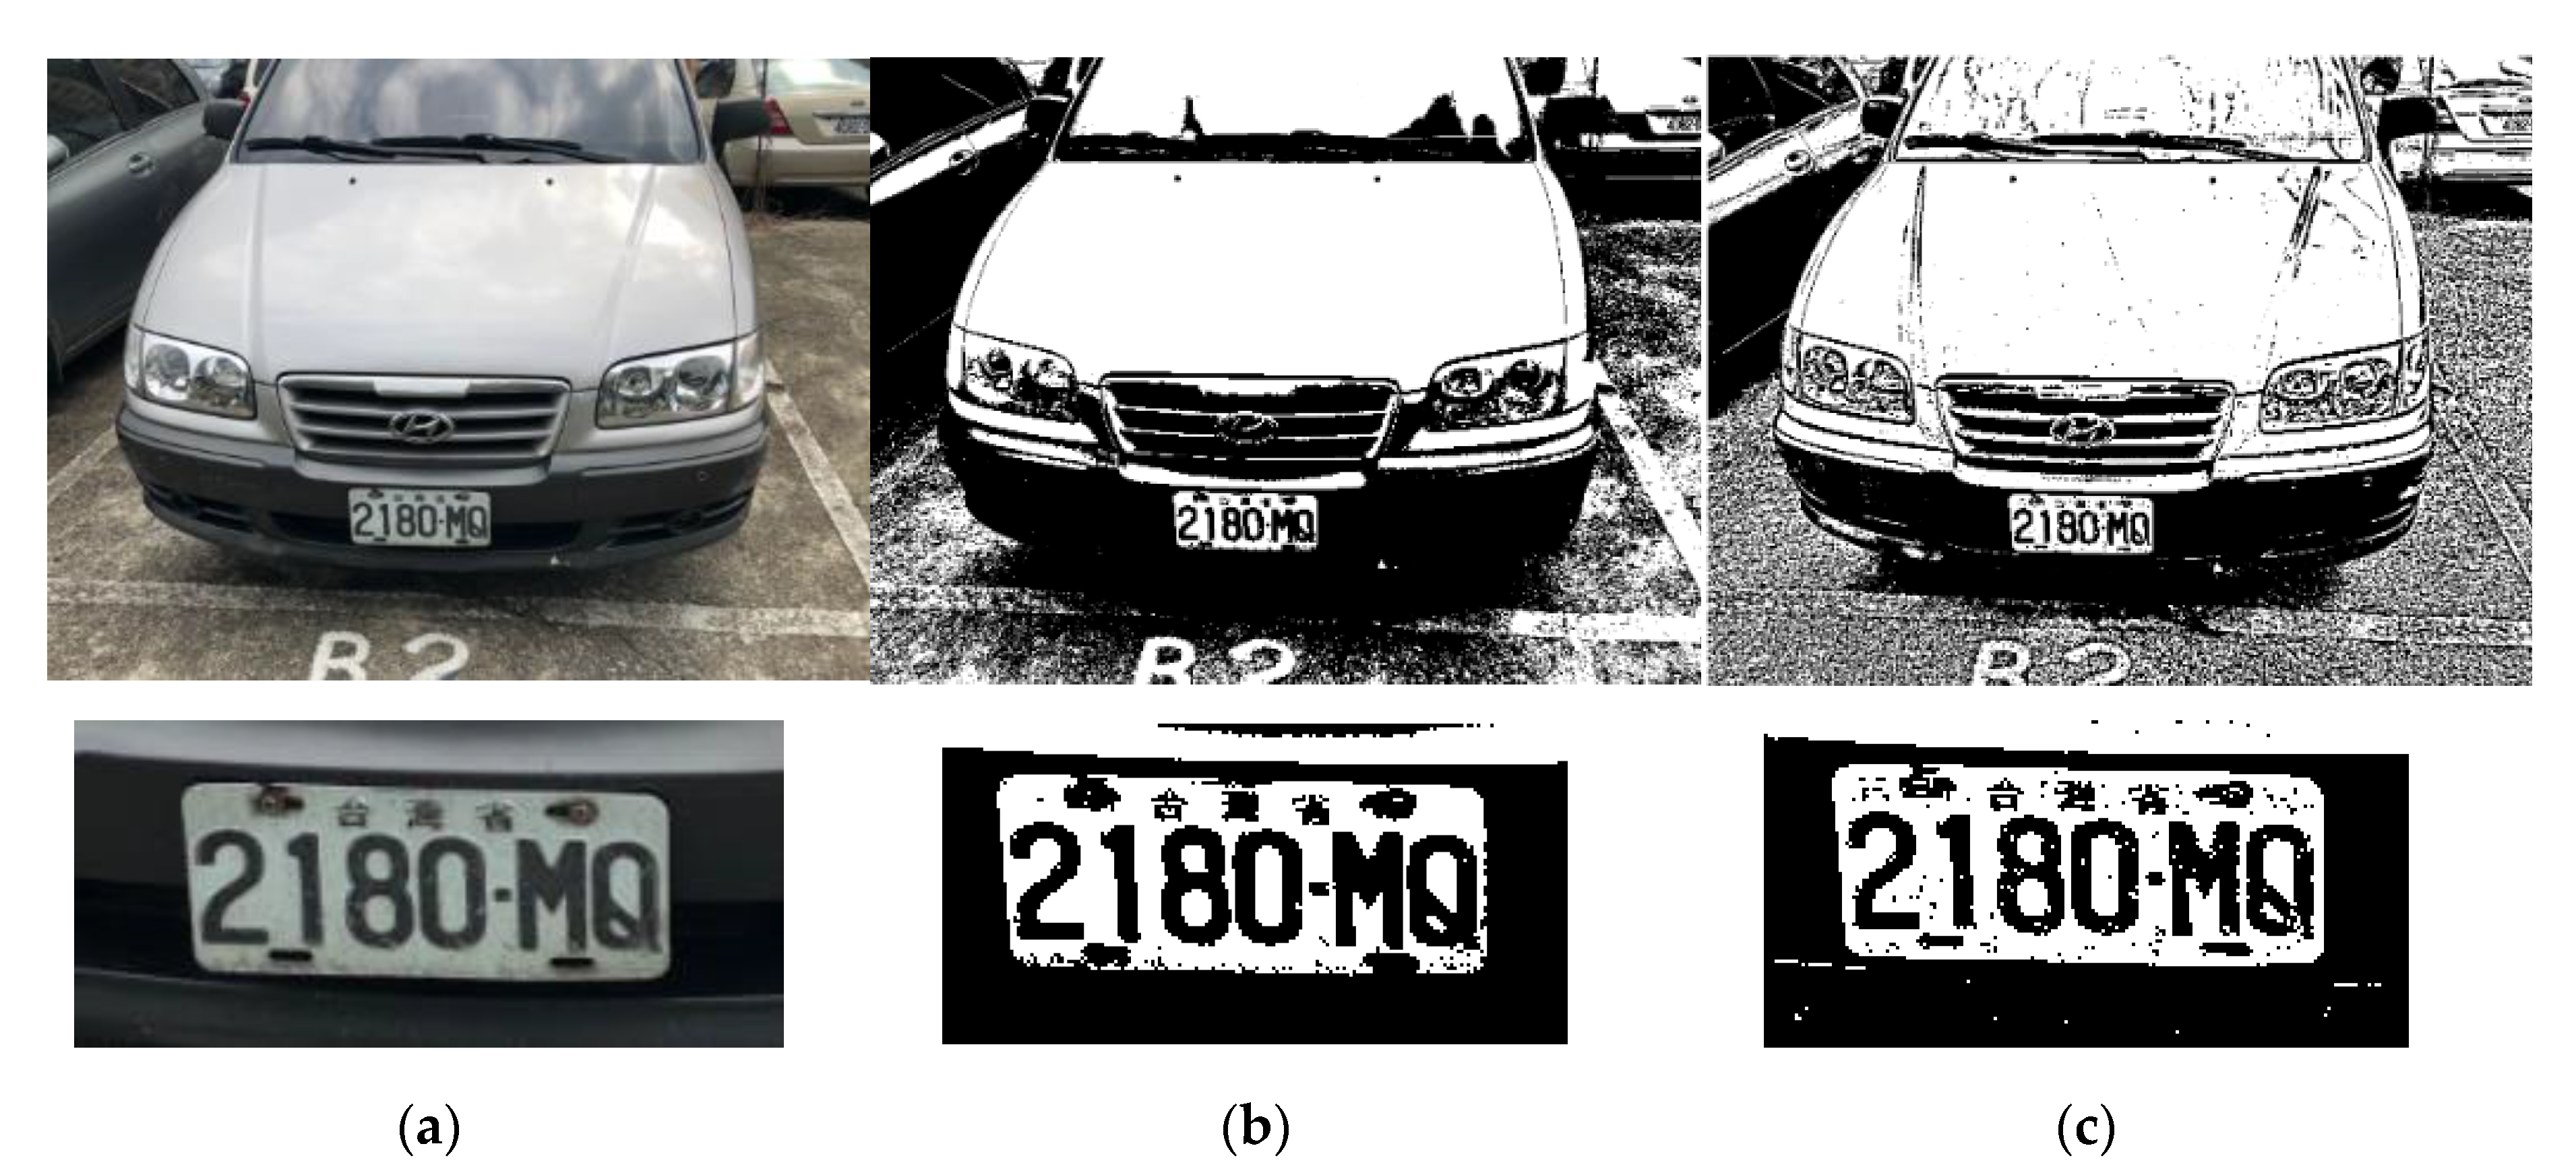
4.2. Comparisons between FANS and Otsu in the Daytime

The comparisons between FANS and Otsu in the daytime are shown in Table 5. From Table 5 we found that FANS reached 100% detection rate and 92.94% recognition rate, and Otsu reached 89.41% detection rate and 73.52% recognition rate. Obviously, FANS is superior to Otsu when images were captured in the daytime. After analyzing our experimental data, we found some plates were detected correctly but recognized unsuccessfully. This problem is caused by the template matching method used in our two LPRSs. Some characters are too similar in our template database, such as 2 and Z, D and 0, G and C, and so on. This situation made both LPRSs recognize the characters unsuccessfully.
Otsu performed worse than FANS because of the two main reasons. First, Otsu performed badly when images were taken in a high brightness environment, as shown in Figure 10a–c where the binary images were generated by Otsu and FANS respectively. In Figure 10a, because the sun was strong, the characters in the license plate were fuzzy, adhering, and fractured. Consequently Otsu generated a bad binary image as shown in Figure 10b, in which Characters “0” and “X” were fractured and therefore resulted in failed detection and recognition. Obviously, the binary image generated by FANS in Figure 10c did not have this problem. Another problem of Otsu is the noise interference as shown in Figure 11. In Figure 11a, the Character “9” is fractured since it is covered with dirt. Figure 11b,c shows the binary images generated by Otsu and FANS respectively. After binarization, the Character “9” in Figure 11b was very similar to Character “3.” This problem made the Otsu recognize plate characters unsuccessfully. On the contrary, the binary image generated by FANS did not have this problem as shown in Figure 11c.

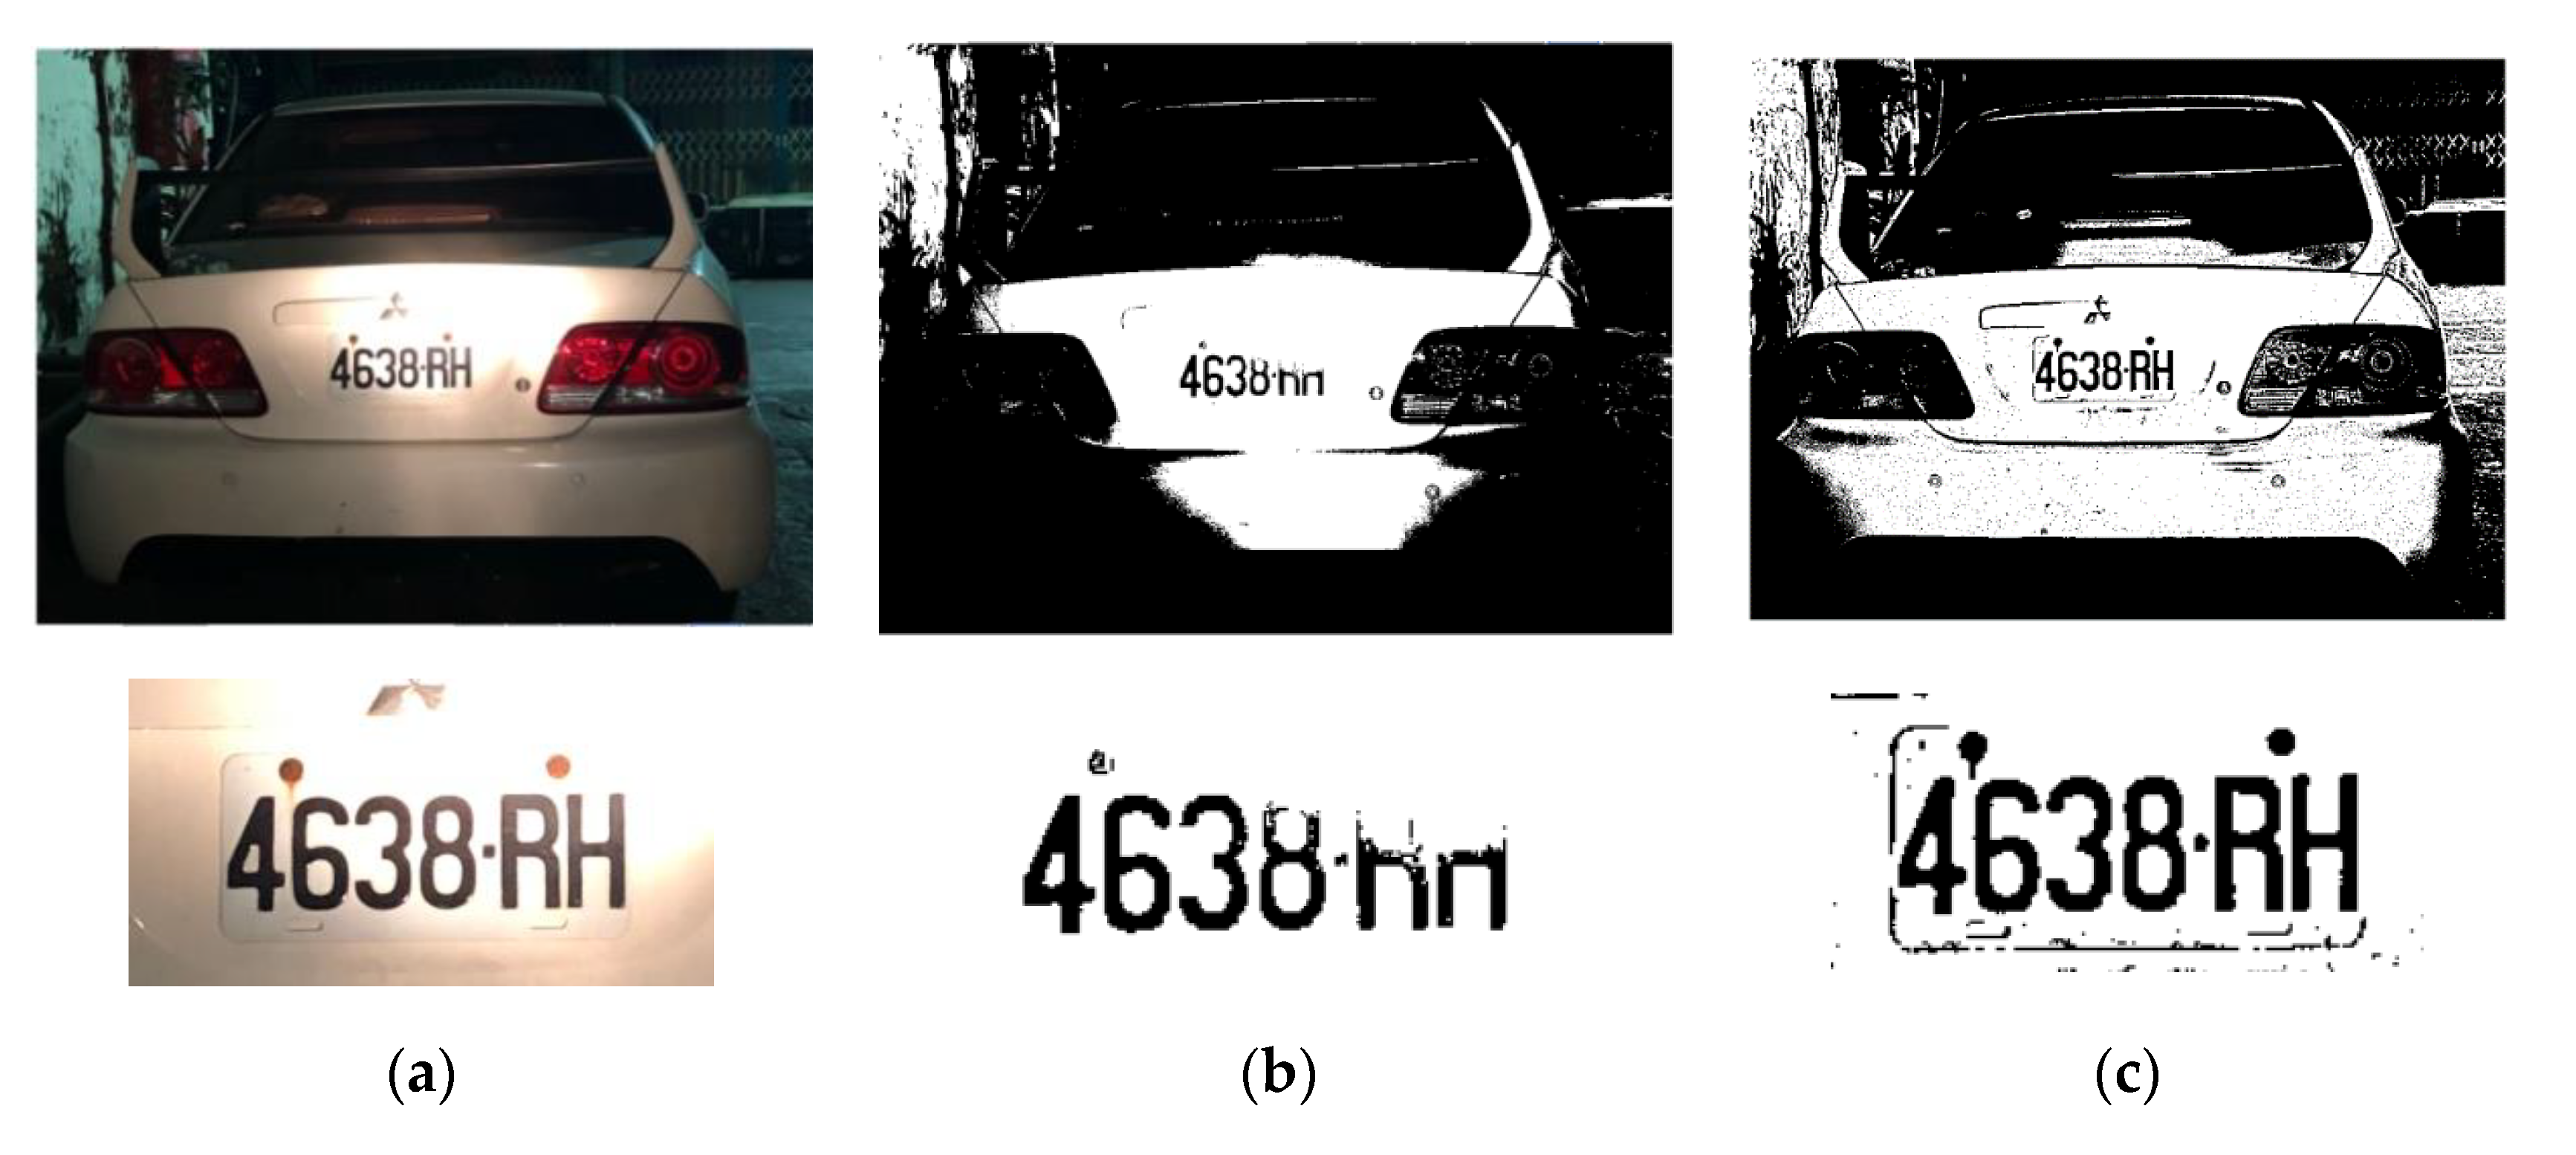
4.3. Comparisons between FANS and Otsu in the Nighttime

Table 6 shows the comparisons between FANS and Otsu in the nighttime. FANS reached 100% detection rate and 81.76% recognition rate, and Otsu reached 81.17% detection rate and 60.58% recognition rate. Obviously, FANS outperforms Otsu in the nighttime. However, since the light is darker and license plates are often covered by shadow in the nighttime, the detection rates and recognition rates of both FANS and Otsu became worse than those in the daytime.
There are many factors that interfere with the performance of a LPRS in the nighttime, and two main factors are shadow and light. Figure 12a is an image taken in the nighttime. Since the license plate in Figure 12a was covered by a shadow, the binary image generated by Otsu in Figure 12b was difficult to be detected and recognized. Figure 12c is the binary image generated by FANS. It is obvious that Figure 12c is much better than Figure 12b. Another factor that interferes with the performance of LPRS in the nighttime is light. For example, Figure 13a is an image captured with a car headlight. In the binary image generated by Otsu in Figure 13b, some parts of Characters “8,” “R,” and “H” disappeared. On the contrary, the binary image generated by FANS in Figure 13c was not affected by the car headlight. It is worth noting that in a real application, license plates are usually affected by the headlights of cars or motorcycles in the nighttime.

4.4. Comparisons between FANS and Otsu in Dealing with Dirty License Plates

The comparisons between FANS and Otsu in dealing with dirty license plates are shown in Table 7. FANS reached 100% detection rate and 93.18% recognition rate, and Otsu reached 70.45% detection rate and 50% recognition rate. Obviously, FANS performed better than Otsu in dealing with dirty plates. This result corresponds to our discussion in Section 1, i.e., Otsu has poor performance when there is dirt on license plates. After analyzing our experimental data, we also found that since some characters are covered with too much dirt, template matching method could not recognize them successfully even FANS reaches 100% detection rate.
For license plates in Taiwan, this problem is very important since the climate in Taiwan is usually hot and humid and license plates in Taiwan are fixed by two or more screws. These screws gather rust easily and therefore become dirty hence degrading the recognition rate. Figure 14a shows an image contained rusty screws in Taiwan. As shown in Figure 14a, the two screws on the plate were rusty and their locations were very close to Characters “E” and “4.” In the binary image generated by Otsu as shown in Figure 14b, one rusty screw adhered to Character “E” and this situation made the LPRS difficult to detect and recognize the license plate. The binary image generated by FANS is shown in Figure 14c. Obviously, Character “E” and the rusty screw were separated, so the LPRS could successfully detect and recognize the license plate. Figure 15a is an image with dirty plate in which there was silt between Characters “M” and “Q.” The binary image generated by Otsu is shown in Figure 15b, in which Characters “M” and “Q” adhered to each other. Although Otsu can detect the license plate correctly, it could not successfully recognize all characters on this plate. On the other hand, the binary image generated by FANS had no problem. As shown in Figure 15c, the Characters “M” and “Q” were obviously separated. Consequently, FANS can successfully recognize all the characters on this plate.

4.5. Summary and Discussion

Please note, there are some new binarization methods proposed in recent years. However, as we discussed in Section 1, although these new methods improved the binarization results, they required a higher computational cost. When a LPRS is used in a real-time application, the computational cost is a very important factor. Suppose that we implement a LPRS to recognize the license plates captured by a 120 fps camera, if the recognition time is more than 0.01 s, the LPRS cannot recognize all images in real time since there are 120 images in a second. Consequently, Otsu is still one of the most commonly used binarization method in a LPRS, as reported in many recently published papers. The main purpose of this paper is to propose a binarization method that will not only improve the binarization results of license plates taken in the open environment in Taiwan, but also keeps the time complexity as simple as Otsu.
Table 8 shows of the summary comparisons between FANS and Otsu in dealing with all 340 images. We also included three newer binarization methods in Table 8. In Table 8, FANS reached 100% detection rate and 87.35% recognition rate, and Otsu reached 85.29% detection rate and 67.05% recognition rate. Although FANS does not reach the best recognition rate, it improved the detection rate up to 1.17 times better than Otsu and improved the recognition rate up to 1.30 times better than Otsu. The comparisons of average execution time of the five LPRSs is shown in Table 9. From Table 9 we found that FANS is the fastest.

5. Conclusions

License plate recognition is a positive research area in the past few years and is used widely in our daily life. In this paper, we propose a LPRS named FANS for the automatic license plate recognition in the open environment in Taiwan. Experimental results in Section 4 show that FANS reached a better performance than Otsu in the daytime, in the nighttime, and in dealing with noise. FANS improved the detection rate up to 1.17 times better than Otsu and improved the recognition rate up to 1.30 times better than Otsu. With regard to the efficiency, in a real application, the FANS needs less execution time than that of Otsu.

Author Contributions

Conceptualization: C.-C.P., C.-J.T., T.-Y.C., J.-Y.Y.; Methodology: C.-C.P., C.-J.T.; Project administration: C.-C.P., C.-J.T.; Writing – original draft: C.-C.P., C.-J.T.; Writing – review & editing: C.-C.P., C.-J.T.; Supervision: C.-C.P., C.-J.T., T.-Y.C., J.-Y.Y.; Implementation, Data Collection and Data analysis: H.D., M.-H.T. All authors have read and agreed to the published version of the manuscript.

Funding

This research received no external funding.

Acknowledgments

This research was partially supported by the Ministry of Science and Technology of the Republic of China under Grant Nos. MOST 107-2622-E-018-002-CC3, MOST 107-2221-E-018-015, MOST 108-2622-E-018-002 -CC3 and MOST 109-2622-E-018 -002 -CC3.

Conflicts of Interest

The authors declare that they have no conflict of interest.

References

  1. Deb, K.; Chae, H.-U.; Jo, K. Vehicle License Plate Detection Method Based on Sliding Concentric Windows and Histogram. J. Comput. 2009, 4, 771–777. [Google Scholar] [CrossRef]
  2. Kim, M.-K. Adaptive Thresholding Technique for Binarization of License Plate Images. J. Opt. Soc. Korea 2010, 14, 368–375. [Google Scholar] [CrossRef]
  3. Izidio, D.M.F.; Ferreira, A.P.A.; Medeiros, H.R.; Barros, E.N. An embedded automatic license plate recognition system using deep learning. Des. Autom. Embed. Syst. 2019, 24, 23–43. [Google Scholar] [CrossRef]
  4. Omar, N.; Sengur, A.; Al-Ali, S.G.S. Cascaded deep learning-based efficient approach for license plate detection and recognition. Expert Syst. Appl. 2020, 149, 113280. [Google Scholar] [CrossRef]
  5. Eslami, H.; Raie, A.A.; Faez, K. Precise Vehicle Speed Measurement Based on a Hierarchical Homographic Transform Estimation for Law Enforcement Applications. IEICE Trans. Inf. Syst. 2016, 99, 1635–1644. [Google Scholar] [CrossRef]
  6. Ahmed, R.E. GPark: Vehicle parking management system using smart glass. J. Sens. 2016. [Google Scholar] [CrossRef]
  7. Rajput, H.; Som, T.; Kar, S.; Hitesh, R. An Automated Vehicle License Plate Recognition System. Computer 2015, 48, 56–61. [Google Scholar] [CrossRef]
  8. Ashtari, A.H.; Nordin, J.; Fathy, M. An Iranian License Plate Recognition System Based on Color Features. IEEE Trans. Intell. Transp. Syst. 2014, 15, 1690–1705. [Google Scholar] [CrossRef]
  9. Türkyılmaz, I.; Kaçan, K. License Plate Recognition System Using Artificial Neural Networks. ETRI J. 2017, 39, 163–172. [Google Scholar] [CrossRef]
  10. Al-Ghaili, A.M.; Mashohor, S.; Ramli, A.R.; Ismail, A. Vertical-Edge-Based Car-License-Plate Detection Method. IEEE Trans. Veh. Technol. 2012, 62, 26–38. [Google Scholar] [CrossRef] [Green Version]
  11. Du, S.; Ibrahim, M.; Shehata, M.; Badawy, W. Automatic License Plate Recognition (ALPR): A State-of-the-Art Review. IEEE Trans. Circuits Syst. Video Technol. 2012, 23, 311–325. [Google Scholar] [CrossRef]
  12. Ye, S.-Y.; Choi, J.-Y.; Nam, K.-G. The Detection of Rectangular Shape Objects Using Matching Schema. Trans. Electr. Electron. Mater. 2016, 17, 363–368. [Google Scholar] [CrossRef] [Green Version]
  13. Gou, C.; Wang, K.; Yao, Y.; Li, Z. Vehicle License Plate Recognition Based on Extremal Regions and Restricted Boltzmann Machines. IEEE Trans. Intell. Transp. Syst. 2015, 17, 1096–1107. [Google Scholar] [CrossRef]
  14. Tian, J.; Wang, G.; Liu, J.; Xia, Y. License plate detection in an open environment by density-based boundary clustering. J. Electron. Imag. 2017, 26, 33017. [Google Scholar] [CrossRef]
  15. Azam, S.; Islam, M. Automatic license plate detection in hazardous condition. J. Vis. Commun. Image Represent 2016, 36, 172–186. [Google Scholar] [CrossRef]
  16. Khare, V.; Shivakumara, P.; Chan, C.S.; Lu, T.; Meng, L.K.; Woon, H.H.; Blumenstein, M. A novel character segmentation-reconstruction approach for license plate recognition. Expert Syst. Appl. 2019, 131, 219–239. [Google Scholar] [CrossRef]
  17. Khan, M.; Sharif, M.; Javed, M.Y.; Akram, T.; Yasmin, M.; Saba, T. License number plate recognition system using entropy-based features selection approach with SVM. IET Image Process. 2018, 12, 200–209. [Google Scholar] [CrossRef]
  18. Gazcón, N.F.; Chesñevar, C.; Castro, S.M. Automatic vehicle identification for Argentinean license plates using intelligent template matching. Pattern Recognit. Lett. 2012, 33, 1066–1074. [Google Scholar] [CrossRef]
  19. Ridler, T.W.; Calvard, S. Picture thresholding using an iterative selection method. IEEE Trans. Syst. Man Cybern. 1978, 8, 630–632. [Google Scholar]
  20. Sezan, M.I. A peak detection algorithm and its application to histogram-based image data reduction. Comput. Vis. Graph. Image Process. 1990, 49, 36–51. [Google Scholar] [CrossRef]
  21. Otsu, N. A Threshold Selection Method from Gray-Level Histograms. IEEE Trans. Syst. Man Cybern. 1979, 9, 62–66. [Google Scholar] [CrossRef] [Green Version]
  22. Sankur, B.; Sezgin, M. Survey over image thresholding techniques and quantitative performance evaluation. J. Electron. Imag. 2004, 13, 146–166. [Google Scholar] [CrossRef]
  23. Xue, J.H.; Titterington, D.M. t-tests, F-tests and Otsu’s Methods for image thresholding. IEEE Trans. Image Process. 2011, 20, 2392–2396. [Google Scholar] [PubMed]
  24. Boiangiu, C.A.; Tigora, A. Applying localized Otsu for watershed segmented images. Rom. J. Inf. Sci. Technol. 2014, 17, 219–229. [Google Scholar]
  25. Ieno, E.; Socarrás, L.M.G.; Cabrera, A.J.; Pimenta, T.C. Simple generation of threshold for images binarization on FPGA. Ing. Investig. 2015, 35, 69–75. [Google Scholar] [CrossRef] [Green Version]
  26. Crow, F.C. Summed-area tables for texture mapping. Comput. Graph. 1984, 18, 207–212. [Google Scholar] [CrossRef]
  27. Zhou, W.; Li, H.; Lu, Y.; Tian, Q. Principal Visual Word Discovery for Automatic License Plate Detection. IEEE Trans. Image Process. 2012, 21, 4269–4279. [Google Scholar] [CrossRef]
  28. Kamat, V.; Ganesan, S. An efficient implementation of the Hough transform for detecting vehicle license plates using DSP’S. In Proceedings of the Real-Time Technology and Applications Symposium, Chicago, IL, USA, 15–17 May 1995; pp. 58–59. [Google Scholar]
  29. Zheng, D.; Zhao, Y.; Wang, J. An efficient method of license plate location. Pattern Recognit. Lett. 2005, 26, 2431–2438. [Google Scholar] [CrossRef]
  30. Shi, X.; Zhao, W.; Shen, Y. Automatic license plate recognition system based on color image processing. In Proceedings of the International Conference on Computational Science and Its Applications, Singapore, 9–12 May 2005; Springer: Berlin/Heidelberg, Germany, 2005; pp. 1159–1168. [Google Scholar]
  31. Yang, Y.Q.; Bai, J.; Tian, R.L.; Liu, N. A vehicle license plate recognition system based on fixed color collocation. In Proceedings of the IEEE Proceedings of 2005 International Conference on Machine Learning and Cybernetics, Guangzhou, China, 18–21 August 2005; pp. 5394–5397. [Google Scholar]
  32. Zhu, W.G.; Hou, G.J.; Xing, J. A study of locating vehicle license plate based on color feature and mathematical morphology. In Proceedings of the IEEE 6th International Conference on Signal Processing, Beijing, China, 26–30 August 2002; pp. 748–751. [Google Scholar]
  33. Kim, K.I.; Jung, K.; Kim, J.H. Color texture-based object detection: An application to license plate localization. In Pattern Recognition with Support Vector Machines. Lecture Notes in Computer Science; Springer: Berlin/Heidelberg, Germany, 2002; Volume 2388, pp. 293–309. [Google Scholar]
  34. Porikli, F.; Kocak, T. Robust license plate detection using covariance descriptor in a neural network framework. In Proceedings of the IEEE International Conference on Video and Signal Based Surveillance, Sydney, Australia, 22–24 November 2006; p. 107. [Google Scholar]
  35. Castro-Zunti, R.D.; Yepez, J.; Ko, S.-B. License plate segmentation and recognition system using deep learning and OpenVINO. IET Intell. Transp. Syst. 2020, 14, 119–126. [Google Scholar] [CrossRef]
  36. Patel, C.; Shah, D.; Patel, A. Automatic Number Plate Recognition System (ANPR): A Survey. Int. J. Comput. Appl. 2013, 69, 21–33. [Google Scholar] [CrossRef]
  37. Nomura, S.; Yamanaka, K.; Katai, O.; Kawakami, H.; Shiose, T. A novel adaptive morphological approach for degraded character image segmentation. Pattern Recognit. 2005, 38, 1961–1975. [Google Scholar] [CrossRef]
  38. Rosenfeld, A.; De La Torre, P. Histogram concavity analysis as an aid in threshold selection. IEEE Trans. Syst. Man Cybern. 1983, 13, 231–235. [Google Scholar] [CrossRef]
  39. Kapur, J.N.; Sahoo, P.K.; Wong, A.K. A new method for gray-level picture thresholding using the entropy of the histogram. Comput. Vis. Graph. Image Process. 1985, 29, 273–285. [Google Scholar] [CrossRef]
  40. Hertz, L.; Schafer, R.W. Multilevel thresholding using edge matching. Comput. Vis. Graph. Image Process. 1988, 44, 279–295. [Google Scholar] [CrossRef]
  41. Chanda, B.; Majumder, D.D. A note on the use of the gray level co-occurrence matrix in threshold selection. Signal Process. 1988, 15, 149–167. [Google Scholar] [CrossRef]
  42. White, J.M.; Rohrer, G.D. Image Thresholding for Optical Character Recognition and Other Applications Requiring Character Image Extraction. IBM J. Res. Dev. 1983, 27, 400–411. [Google Scholar] [CrossRef]
  43. Prabhakar, P.; Anupama, P. A novel design for vehicle license plate detection and recognition. In Proceedings of the IEEE 2nd International Conference on Current Trends in Engineering and Technology, Coimbatore, India, 8 July 2014; pp. 7–12. [Google Scholar]
  44. Sauvola, J.; Pietikäinen, M. Adaptive document image binarization. Pattern Recognit. 2000, 33, 225–236. [Google Scholar] [CrossRef] [Green Version]
  45. Niblack, W. An Introduction to Digital Image Processing; Prentice-Hall: Englewood Cliffs, NJ, USA, 1986. [Google Scholar]
  46. Halabi, Y.S.; Sasa, Z.; Hamdan, F.; Yousef, K.H. Modeling adaptive degraded document image binarization and optical character system. Eur. J. Sci. Res. 2009, 28, 14–32. [Google Scholar]
  47. Phansalkar, N.; More, S.; Sabale, A.; Joshi, M. Adaptive local thresholding for detection of nuclei in diversely stained cytology images. In Proceedings of the IEEE international conference on communication and signal processing, Calicut, India, 10–12 February 2011; pp. 218–222. [Google Scholar]
  48. Saxena, L.P. An effective binarization method for readability improvement of stain-affected (degraded) palm leaf and other types of manuscripts. Curr. Sci. 2014, 107, 489–496. [Google Scholar]
Figure 1. Exampled flowchart of a typical license plate recognition system (LPRS).
Symmetry 12 01374 g001
Figure 2. (a) A license plate captured in a bright environment, (b) the binary image generated by Otsu, where the license plate disappears.
Symmetry 12 01374 g002
Figure 3. (a) A license plate on which two screws get rusty, (b) the binary image generated by Otsu, where rusty screws adhere to the Character “E.”
Symmetry 12 01374 g003
Figure 4. (a) An input image, (b) the result of gray scale conversion in our LPRS.
Symmetry 12 01374 g004
Figure 5. (a) The pixels distribution matrix of a grayscale image consists of W × H pixels, (b) the summed area table.
Symmetry 12 01374 g005
Figure 6. (a) An image can be separated into four regions; (b) four corresponding points in a summed area table (SAT).
Symmetry 12 01374 g006
Figure 7. The pseudocode of FANS.
Symmetry 12 01374 g007
Figure 8. A standard license plate in Taiwan.
Symmetry 12 01374 g008
Figure 9. (a) The interface of LPRS uses FANS, (b) the interface of LPRS uses Otsu.
Symmetry 12 01374 g009
Figure 10. (a) An image taken in a high brightness environment in the daytime; (b) the binary image generated by Otsu, where characters “0” and “X” were fractured; (c) the binary image generated by FANS.
Symmetry 12 01374 g010
Figure 11. (a) An image contains noise and was taken in the daytime; (b) the binary image generated by Otsu, where the Character “9” was very similar to Character “3”; (c) the binary image generated by FANS.
Symmetry 12 01374 g011
Figure 12. (a) A license plate that was covered by a shadow and taken in the nighttime; (b) the binary image generated by Otsu, where the license plate disappears; (c) the binary image generated by FANS.
Symmetry 12 01374 g012
Figure 13. (a) An image captured with a camera flash in the nighttime; (b) the binary image generated by Otsu, where some parts of Characters “8,” “R,” and “H” disappeared. (c) The binary image generated by FANS.
Symmetry 12 01374 g013
Figure 14. (a) A license plate contained rusty screws, (b) the binary image generated by Otsu, where the rusty screw adhered to Character “E,” (c) the binary image generated by FANS.
Symmetry 12 01374 g014
Figure 15. (a) An image contained dirty plates, (b) the binary image generated by Otsu, where Characters “M” and “Q” adhered to each other. (c) The binary image generated by FANS.
Symmetry 12 01374 g015
Table 1. The computational complexity of Otsu.
ProcedureComputation
Generate the histogramWH
Threshold calculation256
Image binarizationWH
Total2WH + 256
Table 2. The computational complexity of FANS.
ProcedureComputation
Generate the SATWH
Threshold calculation and image binarization WH
Total2WH
Table 3. The analysis of parameter C used in FANS, where the row in bold denotes FANS reaches the best recognition rate.
Value C# of Images# of Correct Detection# of correct RecognitionDetection RateRecognition Rate
134033527598.52%80.88%
2340340289100%85.00%
3340340288100%84.70%
4340340297100%87.35%
5340340285100%83.82%
6340340295100%86.76%
734033728199.11%82.64%
8340340286100%84.11%
9340340285100%83.82%
1034033928399.70%83.23%
2034033727199.11%79.70%
3034033526198.52%76.76%
4034032524895.58%72.94%
5034031824693.52%72.35%
Table 4. The analysis of mask size used in FANS, where the row in bold denotes FANS reaches the best recognition rate.
Mask Size# of Images# of Correct Detection# of Correct RecognitionDetection RateRecognition Rate
3 × 334031722093.23%64.70%
5 × 534030621990.00%64.11%
7 × 734033627198.82%79.70%
9 × 9340340297100%87.35%
11 × 11340340272100%80%
13 × 1334033828399.41%83.23%
15 × 15340340278100%81.76%
17 × 17340340269100%79.11%
19 × 19340340273100%80.29%
Table 5. The comparisons of detection rate and recognition rate between FANS and Otsu in the daytime, where the results marked with boldface depict the best results.
Method# of Images# of Correct Detection# of Correct RecognitionDetection RateRecognition Rate
FANS170170158100%92.94%
Otsu17015212589.41%73.52%
Table 6. The comparisons of detection rate and recognition rate between FANS and Otsu at the nighttime, where the results marked with boldface depict the best results.
Method# of Images# of Correct Detection# of Correct RecognitionDetection RateRecognition Rate
FANS170170139100%81.76%
Otsu17013810381.17%60.58%
Table 7. The comparisons of detection rate and recognition rate between FANS and Otsu in dealing with dirty license plates, where the results marked with boldface depict the best results.
Method# of Images# of Correct Detection# of Correct RecognitionDetection RateRecognition Rate
FANS444441100%93.18%
Otsu44312270.45%50.00%
Table 8. Summary comparisons of detection rate and recognition rate between five binarization methods, where the results marked with boldface depict the best results.
Method# of Images# of Correct Detection # of Correct RecognitionDetection RateRecognition Rate
Otsu (1979) [21]34029022885.29%67.05%
Halabi et al. (2009) [46]340340292100%85.88%
Phansalkar et al. (2011) [47]340340302100%88.88%
Saxena (2014) [48]340340315100%92.65%
FANS (2020)340340297100%87.35%
Table 9. Comparisons of average execution time between five binarization methods, where the results marked with boldface depict the best results.
MethodAverage Execution Time (s)
Otsu (1979) [21]0.7066
Halabi et al. (2009) [46]2.2984
Phansalkar et al. (2011) [47]1.6467
Saxena (2014) [48]3.1550
FANS (2020)0.6817

