Abstract
Variants of the capital Latin letter T were prepared with the straight strokes replaced by J-, C-, or S-curves, mimicking handwritten Ts. These were used to test the hypothesis that the overestimation of the length of the T’s undivided line, relative to the length of its divided line may be understood as an adaptation to a corresponding letter schema. The illusion was greater for S-curve Ts than for C- and J-curve Ts, suggesting that approximate bilateral mirror symmetry is more important for the illusion to occur than letterness. Despite the illusion, observers were quite sensitive to the different lengths of the Ts’ curves.
1. Introduction
We questioned why the upstroke of the capital Latin letter T looks longer than its cross-stroke when both have the same length. This seemingly innocuous question, first posed by the French philosopher Malebranche (1638–1715) [1], has puzzled psychologists for more than a century. Schumann [2], discussing an inverted T (henceforth: ⊥), reasoned that the ⊥’s divided line was apprehended as two short lines, which would give rise to the impression of the compound line’s appearing shorter than the ⊥’s undivided line. Schumann took the ⊥ to be an illustration of the horizontal-vertical illusion, according to which vertical extents are overestimated relative to horizontal ones [3]. However, by gradually transforming the ⊥ into an L, Künnapas [4] demonstrated that the bisectioning of one line by another, orthogonal one is the more powerful component of the illusion. By presenting the ⊥ at different orientations, Künnapas also showed that there is no difference in the amount of illusion between upright and inverted Ts.
Going back to the letter T, and noting that its upstroke is typically drawn longer than its cross-stroke [5], an obvious idea is to suppose that we are adapted to the shape of this letter as it is commonly written [6]. During the acquisition of writing skills, top-down reversals of letters are not uncommon, and proficient literates can recognize letters in any orientation [7]. Hence, adapting to a letter schema at its default orientation may generalize to other orientations as well, although empirically, it does so only to a limited degree [8]. The adaptation hypothesis bears some similarity to Segall, Campbell, and Herskovits’ [9] hypothesis of environmental determinants of geometrical illusions, which they tested in a grand-scale cross-cultural study. For the ⊥ and a top-down inverted L (here still regarded as cases of the horizontal-vertical illusion), the assumption had been that observers would interpret the vertical line as extending into depth so that people who live in “open”, flat terrain should be more susceptible to the illusion that typically comes with these figures. However, the results were mixed and did not replicate [10]. Worse: Ward, Porac, Coren, and Girgus [11] found no evidence for a three-dimensional (3D) interpretation of the ⊥. As cross-cultural studies often lack sufficient experimental control, I took a different approach.
If observers are adapted to the shape of the letter T, minor variations of writing style should not matter. This is meant to be a long-term adaptation, that is, after having seen and having written Ts for many years, a kind of schema may develop to the effect that a given T will either appear appropriate or strange [7]. I tested the effects of replacing the T’s straight lines by curves, so that the T would look like a handwritten one. Instead of attempting to do an ecological sampling, which in the face of the great variety of styles and fonts appeared impractical, I constructed Ts from curves of different symmetries (cf. [12] for a demonstration of the importance of this property of the ⊥, by tilting its lines relative to each other). For delimited figures, only two of the four symmetry operations that exist for the Euclidean plane apply: Reflection and rotation [13]. Restricting choices to maximally simple curves, and adding an asymmetric example, yielded three types of Ts, composed from J-, C-, or S-curves, respectively (Figure 1) [14], p. 279. Only four of the eight possible J-curve Ts were used because such a T’s cross-stroke is not normally drawn with its right-hand end curved upwards or downwards [5]. Curves were drawn as second-order Bézier curves and arranged in such a way that the undivided curve met the divided one orthogonally at its midpoint. For the J-curve Ts, this was achieved by defining outer tangent boundaries. For the C- and the S-curve Ts, the curves’ endpoints were connected by imaginary straight lines, which (or the extensions of which) would meet or cross at right angles. As the curved-line Ts qualify as minor modifications of the prototype, straight-lines T, the common illusion—overestimation of the T’s undivided line relative to its divided line was expected to indistinguishably occur with the J-, C-, and S-curve Ts as well.
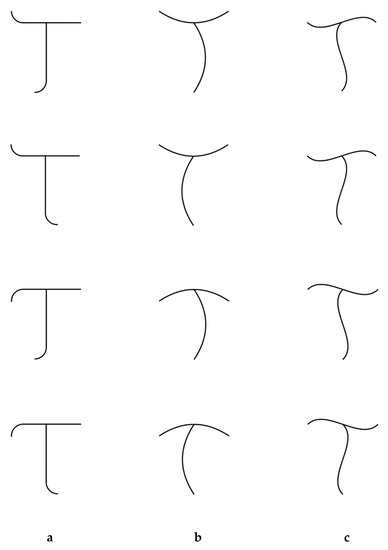
Figure 1.
The default specimens of the stimuli used in the experiment, with the two curves of all Ts being equally long. (a) J-curve Ts; (b) C-curve Ts; (c) S-curve Ts.
2. Materials and Methods
2.1. Participants
Fourteen psychology undergraduates took part in the experiment. The number of participants had been decided upon a priori to be slightly in excess of the minimum number needed to achieve statistical power of 1 − β ≥ 0.95 for a repeated-measures analysis of variance with mildly correlated measurements, r = 50, α = β = 0.05, and ηp2 ≥ 0.300 [15]. Written, informed consent was obtained from all participants, and they were treated in accordance with the Declaration of Helsinki [16]. All participants had normal or corrected-to-normal vision.
2.2. Apparatus and Stimulus Presentation
The essential part of the apparatus was a touch-sensitive computer screen (size: 50.9 × 28.6 cm; resolution: 1920 × 1080 pixels; response time: 5 ms) which was used for both stimulus presentation and response registration. The screen was oriented frontoparallel at a distance of 44 cm from the observer. Stimuli—curved-line Ts—drawn from thin black lines (width = 1.25 mm; lengths: 6.5, 7, or 7.5 cm), were presented within a circular, light grey window (diameter: 28.5 cm; plane visual angle: 35.9°; luminance: 228 cd m−2; CIE-coordinates: x = 0.306; y = 0.308; Weber contrast between stimulus and background: CW = −0.998); the rest of the screen was dark (0.355 cd m−2), and there was only faint, indirect illumination of the room. Stimuli were presented for 2 s. Then, one of the T’s curves changed its color from black to red for 200 ms, and then, for another 200 ms, back to black. Subjectively, this color change appears as blinking. The observer’s response started the next trial after a delay of 200 ms.
2.3. Responses and Data Analysis
The response format was two alternative forced choice (2AFC). Observers had to compare the undivided curve of the T to its divided curve or vice versa, and indicate whether the blinking curve had been longer or shorter than the other, non-blinking curve. Responses were delivered by gently touching response buttons which appeared on the computer screen after the stimulus had been turned off. Effective response registration was signaled to participants by the buttons shining light blue.
The data were analyzed by fitting psychometric functions with cumulative Gaussians. The parameters were computed using a binary logistic regression routine of SPSS™ and transferred to customized software in Mathematica™. Points of subjective equality (PSE) were found at the 50% points of the necessarily symmetric functions for the longer and shorter judgments, which had been plotted against an abscissa defined by the difference in length between the divided and the undivided curves of the Ts. Difference thresholds were determined as half the difference between the 25% and the 75% points on the psychometric functions.
2.4. Additional Variables and Design
As suggested, observers adapted to letter schemata may recognize letters at any orientation [7]. Presenting the T at oblique orientations effectively eliminates the horizontal-vertical component of the ⊥-illusion [17], and it also reduces possible demand characteristics of the task (e.g., comparing writing styles). I used four rotations of the T: Two, at which the T’s undivided curve pointed upwards (45°, 315°), and two, at which this curve pointed downwards (135°, 225°; rotation angles refer to the ⊥’s divided curve and counterclockwise rotation; see Figure 2 for examples).
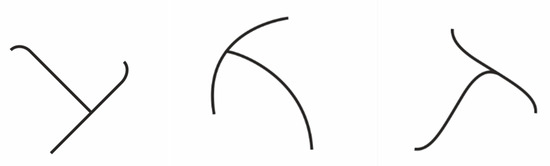
Figure 2.
Examples of the stimuli as actually presented in the experiment.
The three different lengths that were used for the Ts’ curves (6.5, 7, and 7.5 cm) were factorially crossed. For four different specimens of each type of T, presented at four different orientations (45°, 135°, 225°, and 315°), and two directions of comparison (divided to undivided line and vice versa), this made for 9 × 4 × 4 × 2 = 288 unique trials for each type of T. Trials were arranged in random order. Participants completed three experimental sessions, one per type of figure. The order of the sessions was balanced between participants, and each session lasted about 45 min.
3. Results
Parameters of the psychometric functions were determined per participant, type of T, and target line (that is, data were aggregated across the different orientations of the Ts). Functions could not be fitted for one participant who had chosen longer for the Ts’ undivided curves and shorter for their divided curves on almost every such trial. Fits also failed for two of the six analyzed conditions for one other participant. A Greenhouse-Geisser corrected repeated-measures analysis of variance (rmANOVA) on the PSE values with type of T and target line as factors revealed no effect of the target line, F(1, 11) = 0.003, p < 0.958, ηp2 = 0.000, and no interaction effect, F(1.434, 15.777) = 0.012, p < 0.964, ηp2 = 0.001, but a weak, statistically nonsignificant effect of figure type, F(1.303, 14.333) = 3.279, p < 0.083, ηp2 = 0.230, r = 0.718, 1 − β = 0.99. However, simple contrasts showed that illusion magnitudes differed significantly between the S- and the C-curve Ts, F(1, 11)S vs. C = 6.557, p < 0.026, ηp2 = 0.373, r = 0.743, 1 − β = 0.99, and between the S- and the J-curve Ts, F(1, 11)S vs. J = 5.679, p < 0.036, ηp2 = 0.341, r = 0.520, 1 − β = 0.99. Relative to the lengths of the divided curves, the lengths of the undivided curves of all T-figures were generally overestimated—on average, for the J-curve Ts by 8 % (M = 0.56 cm; SD = 0.20 cm), for the C-curve Ts by 8.9 % (M = 0.62 cm; SD = 0.31 cm), and for the S-curve Ts by 10.2% (M = 0.71 cm; SD = 0.29 cm).
Despite the illusion, observers were quite sensitive to the different lengths of the Ts’ curves. Mean estimated difference thresholds differed slightly, but insignificantly between the three types of Ts: MJ = 0.29 cm, SDJ = 0.09 cm, MC = 0.27 cm, SDC = 0.06 cm, MS = 0.26 cm, SDS = 0.05 cm, F(1.669, 18.360) = 1.351, ns. Response bias and sensitivity were almost uncorrelated, r(26)J = 0.329, ns, r(25)C = −203, ns, r(25)S = −179, ns.
4. Discussion
Although all curved-line, letter-like Ts elicited the common ⊥-illusion, there were unexpected differences between them. How could these be explained? The main difference between the J-curve Ts and the others is the absence of any local or global symmetry. Across trials, the S-curve Ts incorporated implicit bilateral mirror symmetries in that the centers of twofold rotation of the individual curves, as well as their endpoints, lay on straight, orthogonal lines, which, equivalent to the lines of a hidden T, effectively acted as axes of reflection for the different S-curves used (cf. Figure 1). For the C-curve Ts, something similar held for the endpoints of the undivided curve, but not the divided one, and the transformation of the curves was ambiguous between reflection and rotation. Seen this way, the S-curve Ts displayed the greatest similarity to straight-line Ts, the J-curve Ts the least, and the C-curve Ts an intermediate one, rendering the results intelligible. Another possible interpretation of the C-curve Ts’ data’s deviation from those of the S-curve Ts might be the nonprototypicality of the C-curve Ts, but this argument hardly applies to the J-curve Ts, leaving the explanation incomplete.
The uncorrelatedness of the amounts of illusion and the difference thresholds is in agreement with findings in psychophysics and signal detection research [18]. The fact that thresholds are often very low and independent of any perceptual error implies that it is not wholly adequate to speak of “illusions” in the first place. As long as the elements that are to be compared differ significantly, the discrimination is trivial. It is only when the elements are very similar that observers are bound to fail. In accordance with accepted terminology, it may, therefore, be better to speak of response biases that result from decisions under uncertainty [19].
Still, the direction of the bias needs to be explained. While the presently reported findings suggest that the ⊥-effect is not due to the operation of a letter schema, they can be read to support the notion of a more general, nonliterate T-schema [20]. Alternatively, local interactions within the neural substrate—orientation-sensitive and end-stopped neurons in particular—may be the proximate cause [21]. In future, neuroscientific investigations will have to unravel these mechanisms. At present, on the basis of the available falsifying evidence, it is easier to say what the ⊥-illusion probably is not. Yet, the results, as communicated here, must be regarded as preliminary for two methodological reasons: (1) The optimum sample size would have been nine instead of fourteen. Although a reanalysis with the data of the first nine participants who had provided full data sets yielded similar results, a replication with a new sample, preferably from a different population, would be desirable. (2) Generally, there is no agreement on whether or not it is legitimate to interpret contrasts if there is no significant main effect. I put more faith in the effect-size and statistical-power values, but others may trust the p value more. The dilemma is that small or medium-sized effects, as they seem to exist in the present case, are easier and more safely detected with a large sample size. Perhaps, both ways should be tried, in order to make sure that the presently reported results do not depend on specific statistical models [22].
Funding
This research was funded by the Deutsche Forschungsgemeinschaft, LA 487/6-3: “Visuelle und haptische Täuschungen in komplexen Reizanordnungen”.
Acknowledgments
I thank Agnes Münch for programming the experiment and preparing the figure, Bernhard Both for providing customized software to estimate psychometric functions, and Annegret Isensee for gathering and transcribing the data.
Conflicts of Interest
The author declares that there are no conflicts of interest. The funders had no role in the design of the study; in the collection, analyses, or interpretation of data; in the writing of the manuscript, or in the decision to publish the results.
References
- Pastore, N. Selective History of Theories of Visual Perception: 1650–1950; Oxford University Press: New York, NY, USA, 1971. [Google Scholar]
- Schumann, F. Beiträge zur Analyse der Gesichtswahrnehmungen. Zweite Abhandlung. Zur Schätzung räumlicher Größen [Contributions to the analysis of visual perceptions. Second treatise. On the estimation of spatial extents]. Z. Psychol. Physiol. Sinnesorgane 1900, 24, 1–33. [Google Scholar]
- Fick, A. Tractatur de Errore Optico Quodam Asymetria Bulbi Oculi Effecto; Koch: Marburg, Germany, 1851. [Google Scholar]
- Künnapas, T.M. An analysis of the “vertical-horizontal illusion”. J. Exp. Psychol. 1955, 49, 134–140. [Google Scholar] [CrossRef] [PubMed]
- Daniels, P.T. The World’s Writing Systems; Bright, W., Ed.; Oxford University Press: New York, NY, USA, 1996. [Google Scholar]
- Chang, C.H.C.; Pallier, C.; Wu, D.H.; Nakamura, K.; Jobert, A.; Kuo, W.-J.; Dehaene, S. Adaptation of the human visual system to the statistics of letters and line configurations. NeuroImage 2015, 120, 428–440. [Google Scholar] [CrossRef] [PubMed]
- Neisser, U. Cognitive Psychology; Meredith: New York, NY, USA, 1967. [Google Scholar]
- Landwehr, K. Visual and visually mediated haptic illusions with Titchener’s ⊥. Atten. Percept. Psychophys. 2014, 76, 1151–1159. [Google Scholar] [CrossRef] [PubMed]
- Segall, M.H.; Campbell, D.T.; Herskovits, M.J. Cultural differences in the perception of geometric illusions. Science 1963, 139, 769–771. [Google Scholar] [CrossRef] [PubMed]
- Jahoda, G. Geometric illusions and environment: A study in Ghana. Br. J. Psychol. 1966, 57, 193–199. [Google Scholar] [CrossRef] [PubMed]
- Ward, L.M.; Porac, C.; Coren, S.; Girgus, J.S. The case for misapplied constancy scaling: Depth associations elicited by illusion configurations. Am. J. Psychol. 1977, 90, 609–620. [Google Scholar] [CrossRef] [PubMed]
- Cormack, E.O.; Cormack, R.H. Stimulus configuration and line orientation in the horizontal-vertical illusion. Percept. Psychophys. 1974, 16, 208–212. [Google Scholar] [CrossRef][Green Version]
- Coxeter, H.S.M. Introduction to Geometry, 2nd ed.; Original Work Published in 1961; Wiley: New York, NY, USA, 1969. [Google Scholar]
- Grünbaum, B.; Shephard, G.C. Tilings and Patterns; Freeman: New York, NY, USA, 1987. [Google Scholar]
- Faul, F.; Erdfelder, E.; Lang, A.-G.; Buchner, A. G*Power 3: A flexible statistical power analysis program for the social, behavioral, and biomedical sciences. Behav. Res. Methods 2007, 39, 175–191. [Google Scholar] [CrossRef] [PubMed]
- World Medical Association (1964/2013). WMA Declaration of Helsinki—Ethical Principles for Medical Research Involving Human Subjects. Available online: http://www.wma.net/en/30publications/10policies/b3/index.html. (accessed on 9 August 2020).
- Deregowski, J.B. The horizontal-vertical illusion and the ecological hypothesis. Int. J. Psychol. 1967, 2, 269–273. [Google Scholar] [CrossRef]
- Macmillan, N.A.; Creelman, C.D. Detection Theory: A User’s Guide, 2nd ed.; Erlbaum: Mahwah, NJ, USA, 2005. [Google Scholar]
- Morgan, M.J.; Hole, G.J.; Glennerster, A. Biases and sensitivities in geometrical illusions. Vis. Res. 1990, 30, 1793–1810. [Google Scholar] [CrossRef]
- Shevelev, I.A.; Lazareva, N.A.; Novikova, R.V.; Tikhomirov, A.S.; Sharaev, G.A.; Cuckiridze, D.Y. Tuning to Y-like figures in the cat striate neurons. Brain Res. Bull. 2001, 54, 543–551. [Google Scholar] [CrossRef]
- Landwehr, K. Titchener’s T with flanks. Acta Psychol. 2018, 191, 244–250. [Google Scholar] [CrossRef]
- Lehmann, E.L. The Fisher, Neyman-Pearson theories of testing hypotheses: One theory or two? J. Am. Stat. Assoc. 1993, 88, 1242–1249. [Google Scholar] [CrossRef]
© 2020 by the author. Licensee MDPI, Basel, Switzerland. This article is an open access article distributed under the terms and conditions of the Creative Commons Attribution (CC BY) license (http://creativecommons.org/licenses/by/4.0/).