Article

Model and Solution of Complex Emergency Dispatch by Multiple Rescue Centers with Limited Capacity to Different Disaster Areas

1
College of Environment and Resources, Fuzhou University, Fuzhou 350108, China
2
College of Civil Engineering, Fuzhou University, Fuzhou 350108, China
*
Author to whom correspondence should be addressed.
Symmetry 2020, 12(7), 1138; https://doi.org/10.3390/sym12071138
Submission received: 20 May 2020 / Revised: 10 June 2020 / Accepted: 19 June 2020 / Published: 8 July 2020

Abstract

:
A disaster emergency consists of many unfavorable factors, such as different disaster areas, the limited capacity of the rescue centers, and complex rescue conditions. After taking into account the resources of the rescue centers, the ability of rescue teams, and the distance between the rescue centers and the disaster areas, this paper has established a complex model for multiple centers with limited capacity to dispatch teams for emergencies in different disaster areas. The model is solved by the genetic algorithm. Firstly, the paper takes the rescue task as the subunit to perform integer programming. Secondly, a rule is designed according to the symmetry of parents’ crossing. According to the rule, single parent crossover only allows two situations, (1) different rescue mission for the same rescue center and (2) different rescue centers under the same rescue mission. Finally, the performance of parent crossing and symmetric single parent crossing is compared. The results show that the two algorithms can converge to the optimal solution, but each of them has unique advantages in terms of convergence speed and stability. It is suggested that the strategy of the single-parent crossover should be used to deal with local emergency responses and that the two-parent crossover strategy is be used for more complicated global emergency responses.

1. Introduction

Due to the change in the global environment and climate, natural disasters, such as landslides and mudslides, occur frequently in China [1]. Natural disasters have a wide range of impacts, and some disasters affect multiple areas at the same time. In July 1982, torrential rain in Sichuan led to more than 30,000 landslides [2] in Zhong County alone. As the number of disaster areas keeps increasing, multiple rescue centers are required to cooperate for rescue. Therefore, it is important to develop an effective emergency dispatch plan.
Task allocation for emergencies is essentially an optimization problem with multiple variables, objectives, and constraints. Its solution can be generally divided into three types: (1) classical mathematical methods, (2) heuristic algorithms, and (3) intelligent algorithms [3]. Intelligent algorithms are widely used in emergency responses for their accuracy and efficiency. Niu [4] used the 0-1 encoding method to design a multi-objective genetic algorithm to get the optimal solution for satellite scheduling in disaster areas. Li [5] designed a mixed element inspiration model for integrated ant colony optimization and taboo search solutions. Zhao Ming [6] used symbol coding and an intersection method that randomly crosses two individuals to determine the optimal solution for the emergency scheduling of multiple targets. Hu Feihu [7] divided the coding sequence into a first-level and second-level chromosome and two-level chromosome to form a genetic unit. Based on the goal of the shortest time, the method solved the problem of the layered scheduling of emergency rescue supplies. Wang Qianfeng [8] encoded individuals with natural positive numbers to map distribution routes. The discrete bee colony algorithm is used to determine the optimal scheduling scheme for emergency logistic vehicles. Wang Yanting [9] and Zhang [10] designed a heuristic algorithm to help planning and dynamic adjustment in a quantitative way. To eliminate the impact of sudden pollution events in upper and middle water supply systems, Wang [11] designed a decision support system for emergency dispatch and used genetic algorithms to optimize the dispatch plan. Considering the timeliness, economy, workload, and responsibility, Feng [12] established a multi-objective optimization model for choosing the location of rescue stations. Zhang [13] designed a multi-objective three-stage random programming model to minimize time and costs for transportation and to reduce dissatisfaction. Bi [14] proposed a method based on machine learning to assess liquefaction disasters. Shen [15] optimized an emergency logistics system by mixing two-stage algorithms. Li [16] introduced task fitness and time fitness to establish a model for rescue personnel allocation among multiple disaster areas. Sotoudeh-Anvari [17] used a random multi-objective optimization model to allocate resources and time for search and rescue. Chen [18] used the wargame theory to optimize emergency rescue plans. Ozdamar [19] designed a Lagrange relaxation heuristic algorithm to solve the problem of dynamic transportation with time changes. Swamy [20] proposed a local search heuristic algorithm to calculate transportation routes. Perez-Galarce [21] proposed an optimization model with changeable variables based on the level of rescue services. Ren [22] combined PSO with genetic algorithms to derive the minimum distance the rescue team needs to go to reach the disaster area.
Various effective and feasible emergency models have been designed by scholars, and intelligent algorithms have also been widely used to solve these models. However, further research needs to be done. On the one hand, few algorithms are improved and adjusted based on the actual situation. On the other hand, in practice, many disaster areas and rescue centers may be involved at the same time. In other words, the rescue process is a complex matching process and the resources owned by the rescue force are limited. This paper proposes the concept of restricted rescue centers. It describes that once the dispatched rescue force exceeds the resource limit, the center will not be able to handle other rescue tasks. In addition, the modeling of a rescue center’s capability can be further improved. Based on the problems above, this paper builds a complex emergency dispatch model of multiple restricted rescue centers in multiple disaster areas, and it applies an improved genetic algorithm to solve the model.

2. Task Allocation Model for Emergency Dispatch

2.1. Proposed Model

During an emergency rescue, the distance between the rescue center and the disaster area, the number of rescue teams, and the rescue teams’ capabilities will all influence the results. Rescue missions are allocated in a scientific way to match the supply of rescue forces dispatched by the rescue center with the demand of the disaster area. The task allocation plan for emergency dispatch can be evaluated based on five points, as follows:
(1) The rescue center closer to the disaster area is the better choice. The shorter the distance is, the sooner the people in the disaster area will get rescued, and the lower the risk of secondary injury.
(2) It is better to have more rescue teams dispatched by the rescue center at one time, as it will avoid the fragmentation of rescue forces, which is good for rescue management and reduces the energy consumption of rescue teams on the road.
(3) Rescue teams with greater rescue capabilities will have better rescue effects, and thus be more helpful to the disaster area.
(4) The task load should not exceed the operating range of the rescue center. If the load of a rescue mission is beyond the capacity of the rescue center, the rescue effect may fall short of expectations.
(5) The dispatched rescue team must meet the needs of the disaster area. If it does not meet the needs, the rescue effect may be not up to expectations.

2.2. Model Construction

To meet the five criteria above, this paper builds a task allocation model for emergency dispatch. Let us assume that there are m disaster areas, and the task set is recorded as θ = { θ j | 1 j m } , where θ j is the j-th disaster area and θ j also represents the j-th mission. In our assumption, θ j requires t θ j rescue teams in total.
In other words, the total number of rescue teams required for the j-th mission is t θ j . The rescue center set is recorded as C = { c i | 1 i n } , where n is the total number of rescue centers; c i is the i-th rescue center and its rescue capacity is denoted as t c i . Therefore, the problem of task assignment can be summarized as: m tasks need to be assigned to n rescue centers for completion. The distribution of rescue forces and emergency demand is shown in Table 1.
In Table 1, i = 1 n t i 1 indicates the sum of tasks assigned by the rescue centers for the first mission. If the total number of rescue teams dispatched by rescue centers do not meet the demand of the disaster area, tθj, the rescue centers are regarded as limited and will be punished. j = 1 m t 1 j shows the sum of tasks that the first rescue center is responsible for. If the number of teams that the first rescue center needs to dispatch exceeds its capacity, it will be punished for its limited resources, too. Based on the five criteria above, the task allocation model for emergency dispatch is shown in Formula (1):
f = j = 1 m i = 1 n u i j e ( α + β ) .
In this paper, three parameters, u i j , α , β , are adopted to reflect the five criteria above, as shown in formula (1), where u i j denotes the rescue capacity coefficient of the rescue center, in accordance with criteria 1, 2, and 3. In the formula, α and β are the penalty factors, which punish the insufficient capacity of a rescue center or the insufficient teams dispatched by the rescue center, respectively. They are set to reflect criteria 4 and 5.

2.3. Model Unfolding

As the setting of the model parameters will affect the final result, the key parameters are modeled and expanded, as follows:
(1) Coefficient u of the rescue center’s capacity
It is denoted that there are t c i rescue teams working for the rescue center c i , which means the i-th rescue center. The distance between c i and the j-th disaster area θ j is recorded as d i s t a n c e i j . The team under the command of rescue center c i has a capability of c a p t u r e i j to perform the j-th task (in disaster area θ j ). Its capability can be divided into four levels, from low to high, among which level 4 is the highest level. It is better to have a small d i s t a n c e i j and a higher c a p t u r e i j . The coefficient u i j reflects the i-th rescue center’s capacity to perform the j-th mission, and it is shown in Formula (2):
u i j = t ci c a p t u r e i j d i s t a n c e i j .
(2) Penalty coefficient α related to the rescue centers’ capacity
α = {    0 ,    t c i j = 1 m t i j 0 j = 1 m t i j t c i , t c i j = 1 m t i j < 0 .
Formula (3) indicates that if the rescue team of the rescue center t c i is larger than j = 1 m t i j , which represents the team required to be dispatched by the rescue center, it indicates that the rescue center is not limited in resources. In other words, the center has abundant capacity and will not be punished, so its α shall be 0; if t c i is less than j = 1 m t i j , it means that the rescue center has not enough capacity to meet the demand of the rescue and there will be a punishment, with the α of j = 1 m t i j t c i .
(3) Penalty coefficient β related to the dispatch of rescue teams
β = { t θ j i = 1 n t i j ,      t θ j i = 1 n t i j > 0 ( i = 1 n t i j t θ j ) γ , t θ j i = 1 n t i j < 0      0 ,      t θ j i = 1 n t i j = 0 .
According to Formula (4), if the total rescue force i = 1 n t i j is larger than t θ j , it means the rescue center has greater capacity to meet the demand of the disaster area. The oversupply of rescue forces is acceptable, but it wastes the resources, so a moderate amount of punishment shall be given and the punishment coefficient β related to inappropriate dispatch of the rescue team is obtained as ( i = 1 n t i j t θ j ) γ . If the contrary is true, when i = 1 n t i j is smaller than t θ j , it means that the rescue center has dispatched a smaller rescue force i = 1 n t i j than t θ j , which is the actual demand from the disaster area. This is not acceptable and the punishment shall be increased. In this situation, β equals the result of t θ j i = 1 n t i j . In exceptional cases, β = 0 , when the rescue force dispatched is equal to the demand of the disaster area.

3. Model Solving Based on Genetic Algorithm

A genetic algorithm (GA), which is inspired by the process of natural selection that belongs to the larger class of evolutionary algorithms, uses self-adaption to find optimal global solutions. Genetic algorithms have many advantages over traditional optimization methods. For example, they have unique advantages in solving optimization problems that are difficult to convert to a numerical concept and only have the code concept. They can generate high-quality solutions to objective functions that are almost impossible to derive and are good at handling optimization problems for functions that do not have derivatives. Moreover, they can be used to solve combinatorial optimization problems. With strong global search capabilities, genetic algorithms are used to find the global optimal solution without falling into a local optimal solution [23,24,25,26].
The steps of a genetic algorithm include coding, defining fitness function, and determining genetic strategy [27] (population size, selection, crossover, and mutation, etc.). The four key steps of coding, fitness function, crossover, and mutation are illustrated, as below:

3.1. Coding Scheme and Individual Representation

Individuals are also called chromosomes, which represent a feasible solution to the problem of task assignment. As the number of rescue team is an integer, an integer coding scheme is used to randomly generate an integer sequence with the length of m × n, as can be shown in Figure 1.
To solve the problem under the condition of multiple rescue centers and multiple disaster areas, two basic requirements are met: firstly, the number of rescue teams dispatched by the rescue centers to the disaster area is not greater than the overall capacity of the rescue centers and secondly, the total number of rescue teams dispatched to one disaster area should not be less than the demand of the area, as shown in Formula (5). In the formula, t c i represents the number of rescue teams owned by a rescue center, j = 1 m t i j represents the number of rescue teams required to be dispatched by a rescue center, t θ j represents the rescue teams required by the disaster area, and i = 1 n t i j represents the total number of rescue teams dispatched by rescue centers to a disaster area.
{ j = 1 m t i j t c i i = 1 n t i j t θ j , 1 i n , 1 j m .
Figure 2 shows one type of gene sequence, according to which θ1, θ2, θ3, and θ4 represent four disaster areas, and C1, C2, and C3 represent three rescue centers. In this example, rescue centers C1, C2, and C3 dispatch two teams, three teams, and one team, respectively, to accomplish the first task. (in disaster area θ1). They also dispatch four teams, zero teams, and two teams, respectively, to go to the second task (in disaster area θ2). Task θ3 and task θ4 follow the same procedure.
It is assumed that the four disaster areas demand five, six, seven, and eight rescue teams, respectively, and the capacities of the three rescue centers are all 10. According to Formula (5), we have 11 = j = 1 4 t 1 j t c 1 = 10 and 4 = i = 1 3 t i 4 t θ 4 = 8 . Therefore, the gene sequence in Figure 2 is not a feasible solution.

3.2. Fitness Function

As the fitness function is related to the performance of individuals in the group, this paper takes the task allocation model for emergency dispatch (Formula 1) as the fitness function. After obtaining the fitness function results, it adopts the roulette strategy to select the individuals [16].
f = j = 1 m i = 1 n u i j e ( α + β ) .
Let us suppose that the initial population size is five, so five strings of bits (chromosomes) are randomly generated. Figure 2 shows one string of them. The distances between rescue centers and disaster areas, and the rescue capacities of rescue centers, are known factors. Each rescue center is equipped with 10 teams, and the four disaster areas (θ1, θ2, θ3, θ4) require seven, eight, five, and six rescue teams, respectively. The calculation of the fitness value is performed as follows:
(1) The calculation of u i j : for example, the distance between the first rescue center and the first disaster area is 9 km, and the capability of the team under the command of the first rescue center is level 2. Thus, we obtain u11 = 2/9; the calculation of u i j for other rescue centers follows similar steps.
(2) The calculation of α : for example, the first rescue center (rescue center C1) needs to dispatch 11 rescue teams to accomplish the four rescue missions. As the demand exceeds the rescue team’s capacity, which is 10, we get the α as 11−10 = 1.The second rescue center needs to send six rescue teams for the four rescue missions. As the demand can be met by the capacity of the rescue center, α is 0.
(3) The calculation of β : for example, the number of rescue teams required for the first disaster area (task θ1) is seven, and the total number of rescue teams dispatched by the rescue centers is six. As rescue teams cannot meet the demand of the disaster area, the value of β is 7−6 = 1. The number of rescue teams required for the third disaster area (task θ3) is five, and the total number of rescue teams dispatched is six. As the supply of rescue teams exceeds the demand from the disaster area, the value of β equals 0.5 × (6−5) = 0.5. In this equation, the value of coefficient γ , which is 0.5, is set based on the experience.
(4) The standardization of α + β (0 ~ 0.9).
(5) The calculation of the fitness value is based on j = 1 4 i = 1 3 u i j e ( α + β ) . For example, u 11 = 2/9, α =1, β = 1, and the standardized e ( α + β ) = e-0.51, u 11 × e-0.51 = 0.13. The rest of the data are calculated based on similar steps to derive the fitness value of this string of chromosomes.

3.3. Crossover Operator

This paper designs two crossover strategies, including the two-parent crossover and single-parent crossover. It has analyzed the difference of the two crossover strategies.
(1) Two-parent crossover
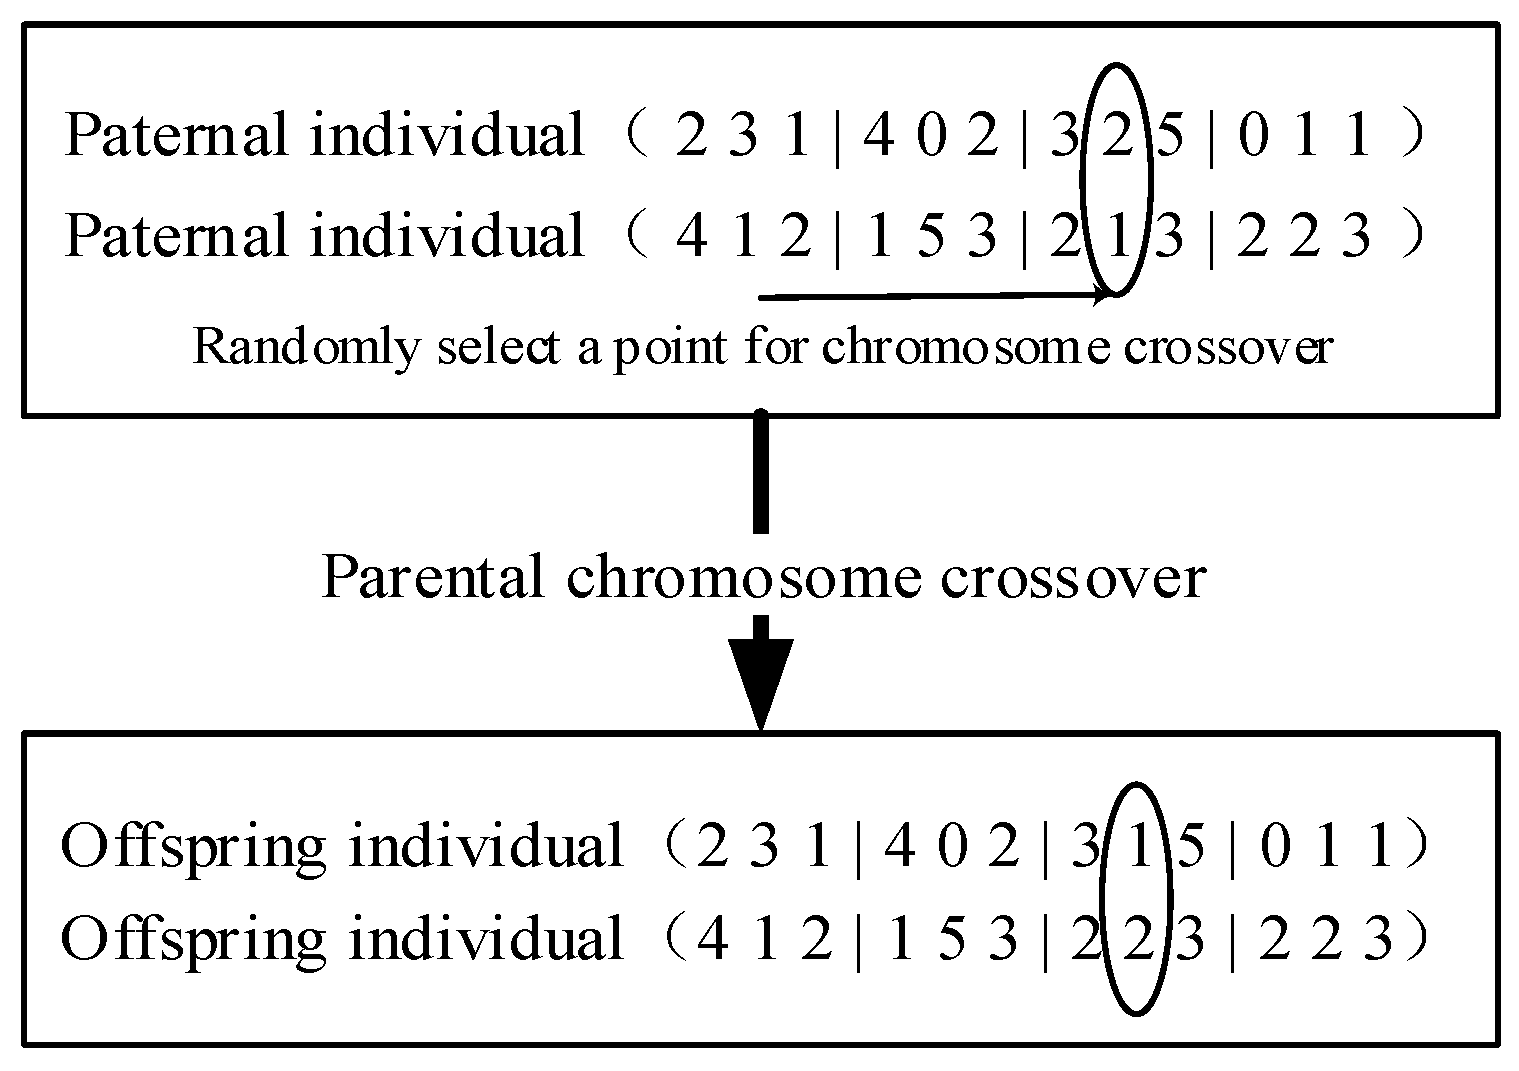
In genetic algorithms, crossover is a basic genetic operator used to combine the genetic information of two parents to generate new offspring (also called recombination). Two-parent crossover can avoid the generation of only a local optimal solution. Figure 3 shows a single-point crossover. In other words, a point on a parent’s chromosome is randomly selected and exchanged between symmetrical parents. As is shown in Figure 3, on each side of the parent chromosomes, the two teams and one team dispatched by the rescue center C2 to perform task θ3 are designated as the “crossover” points. This results in two offspring, each carrying some genetic information from both parents.
In this paper, two crossover strategies are designed, which are parents crossing and symmetrical parent crossing. It compares the performance of the two crossover strategies.
(2) Single-parent crossover
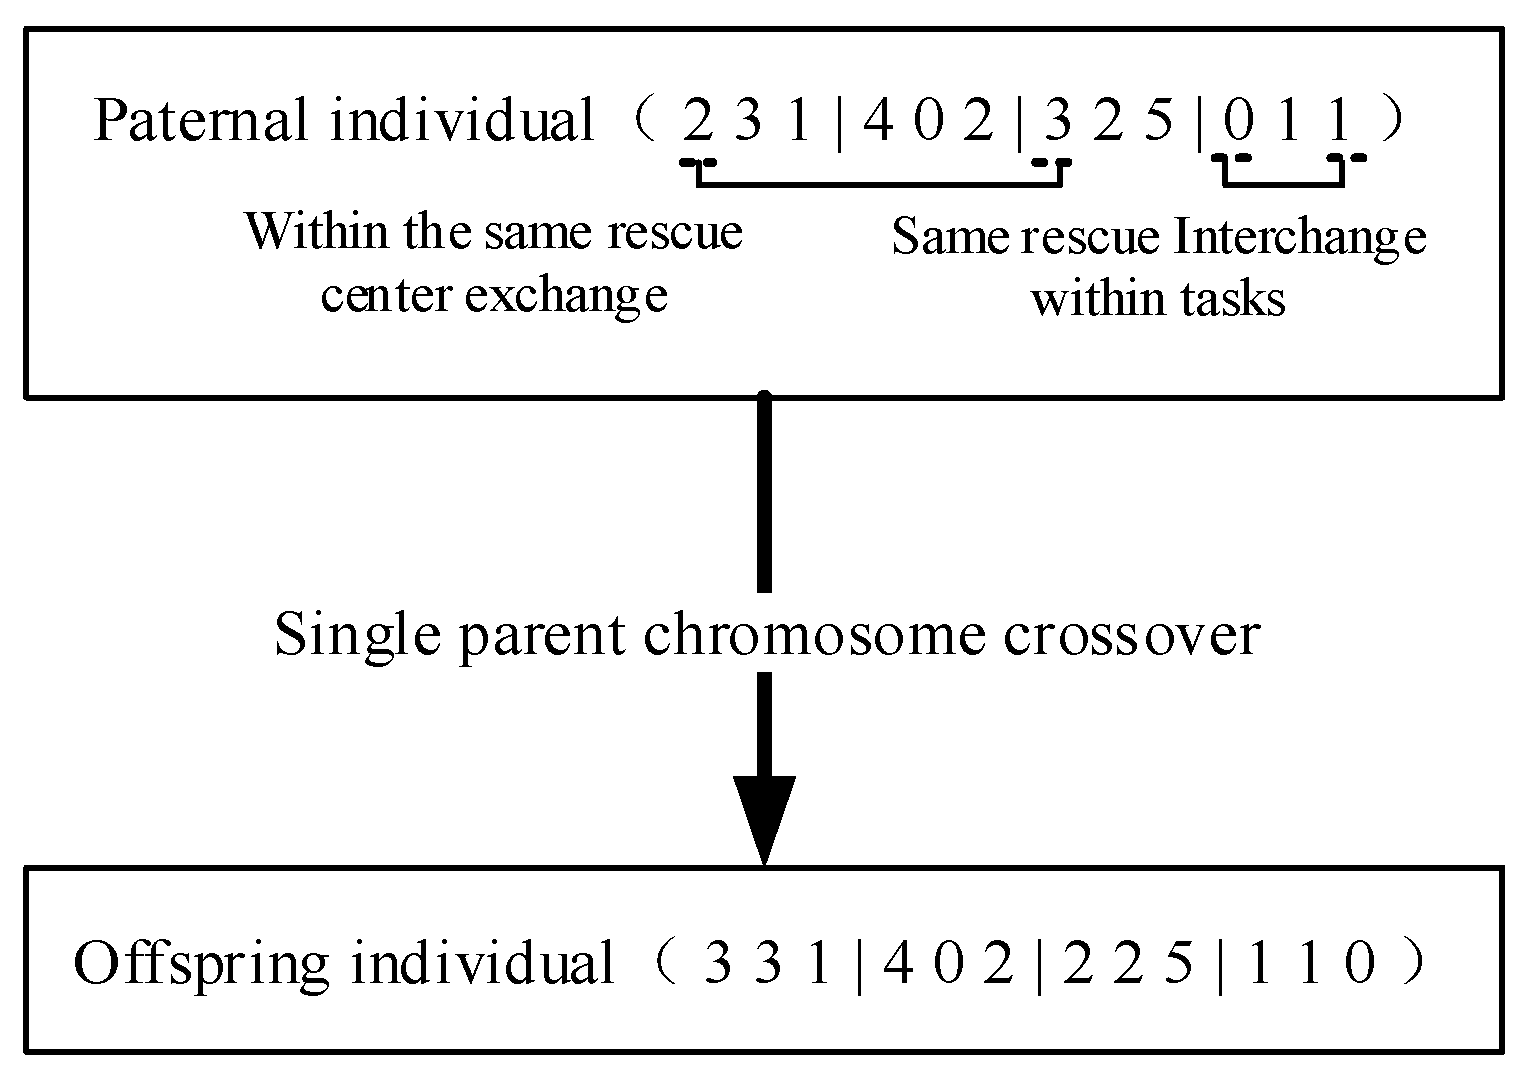
The single-parent crossover generates an offspring by applying the crossover to one individual. Any pair of genes on the maternal gene segment can be swapped, and the crossover position is randomly selected. It improves the probability of obtaining a viable solution.
To avoid a large number of invalid individuals, two preconditions are set for the crossover: (1) only different rescue missions for the same rescue center can perform crossovers and (2) only different rescue centers under the same rescue mission can perform crossovers. This is illustrated in As shown in Figure 4, two groups C1 of task θ1 and three groups C1 of symmetrical task θ3 are exchanged. Another condition is that the 0 teams assigned by C1 for task theta 4 are exchanged with a symmetric C3 for the same task assignment.

3.4. Mutation

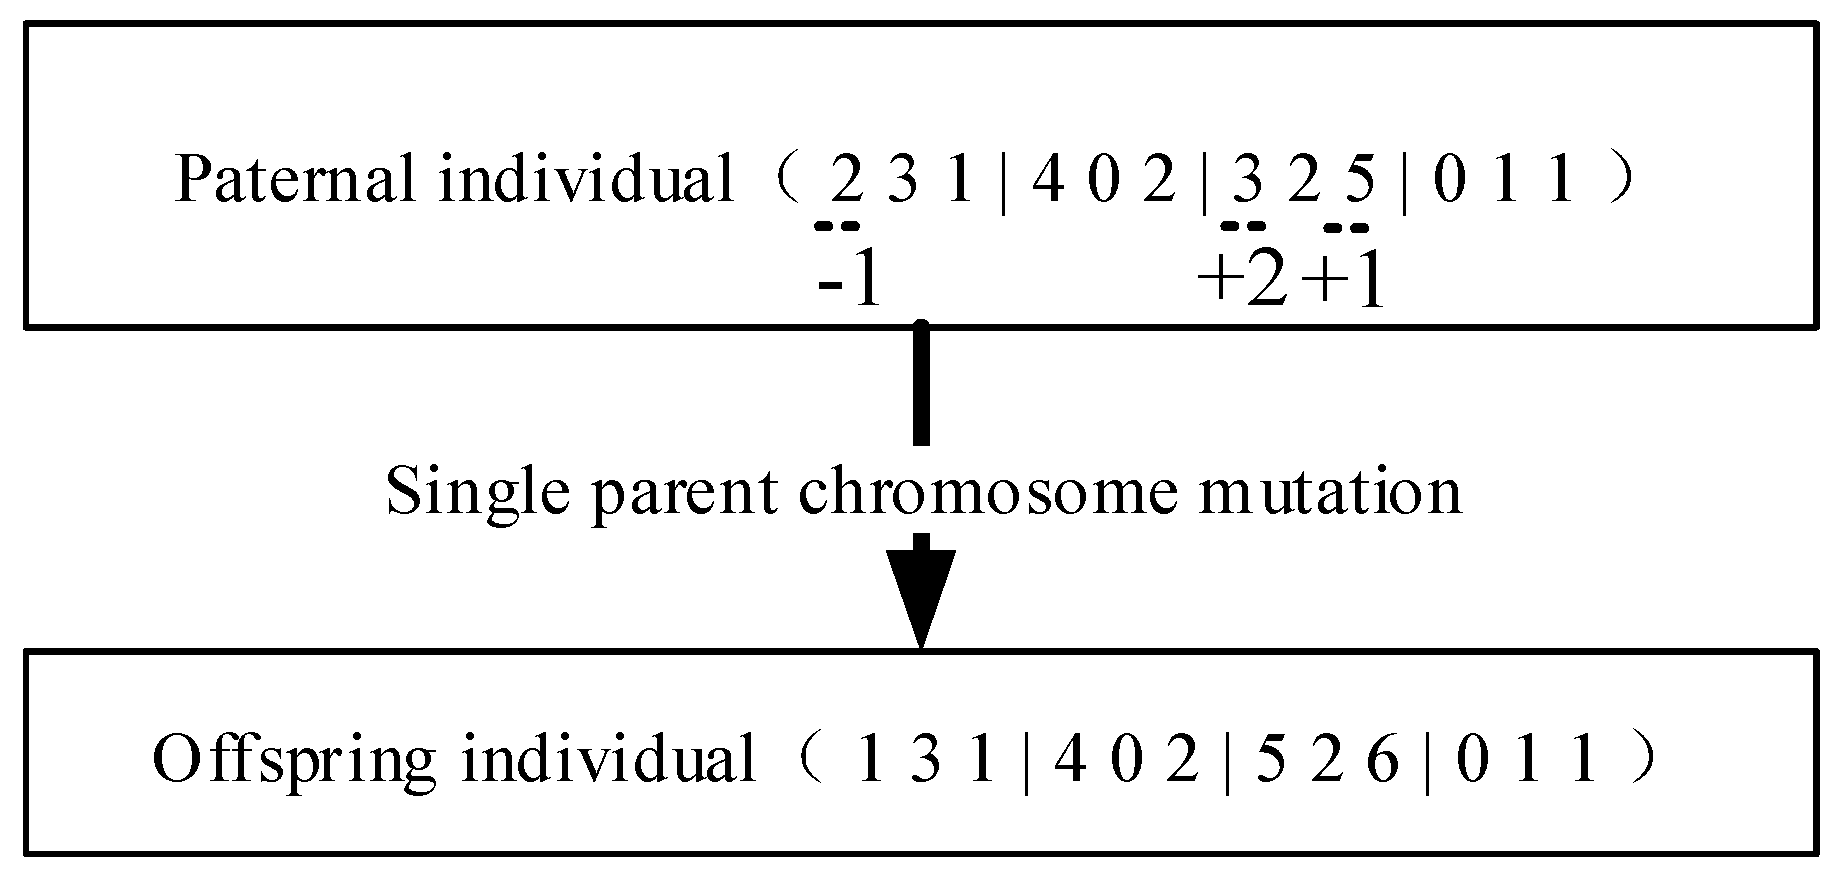
Single-parent mutation is a genetic operator that randomly alters one or more gene values in the maternal chromosome from its initial state to generate new offspring individuals. As the nature of task assignment for emergency dispatch is integer programming, a mutation of this kind of chromosome means to randomly add or subtract one integer at several genetic positions. As is shown in Figure 5, the number of teams dispatched by C1 for task θ1 is randomly reduced by one; the number of teams dispatched by C1 for task θ3 is randomly increased by two; and the number of teams dispatched by C3 for task θ3 is randomly increased by one.

4. Case Analysis

(1) Problem description and modeling
The topological relationship between the disaster area and the rescue center during a rainstorm emergency is shown in Figure 6. The size of the circle indicates the demand for the rescue team in the disaster area, and the value on the connected line indicates the distance from each rescue center to the disaster area. The thickness of the connecting line indicates the level of the rescue center’s rescue capability for the disaster area. There are four levels in total, from thick to thin, in an order of 4–1.
Based on Figure 6, it can be seen that there are four disaster areas, recorded as θ = { θ j | 1 j 4 } . θ j is the j-th disaster area, and the number of rescue teams required for the four disaster areas is seven, eight, five, and six, respectively. There are three rescue centers in total, recorded as C = { C i | 1 i 3 } . Ci is the i-th rescue center, and its rescue team capacity is 10. As is shown in Table 2, 2/9 indicates that the distance from rescue center C1 to the disaster area θ1 is 9km. The team under the command of C1 to perform task θ1 has a capability of level 2.
(2) Model solution
Genetic algorithm test parameters: the population size was set as 100, the maximum evolutionary generation as 500, the genetic generation gap as 0.9, the single-parent crossover probability as 0.9, the two-parent crossover probability as 0.9, and the mutation probability as 0.1.
At the beginning of the calculation, one of the random initial populations was (6 2 8 | 0 3 3 | 6 7 1 | 4 4 5), and the rescue capacity coefficient u of the rescue center was (2.22, 2.86, 4.29, 0.83; 2.31, 0.77, 2.86, 5.00; 0.83, 3.33, 2.86, 4.29). The penalty factor for the rescue center’s capacity was α = [6,6,7]; the punishment coefficient for the insufficient dispatch of teams was β = [4.5,2,4.5,3.5], and the fitness value f = 21.6534.
(3) Results analysis
After 500 iterations, the optimal allocation plan was (3 3 1 | 3 1 4 | 3 1 1 | 0 3 3), with the fitness value f = 28.3119. The rescue center C1, for example, needed to dispatch five, two, one, one, and two rescue teams to the disaster areas θ1, θ2, θ3, and θ4, as is shown in Table 3.
(4) Comparison of two-parent crossover and single-parent crossover
a. Convergence rate
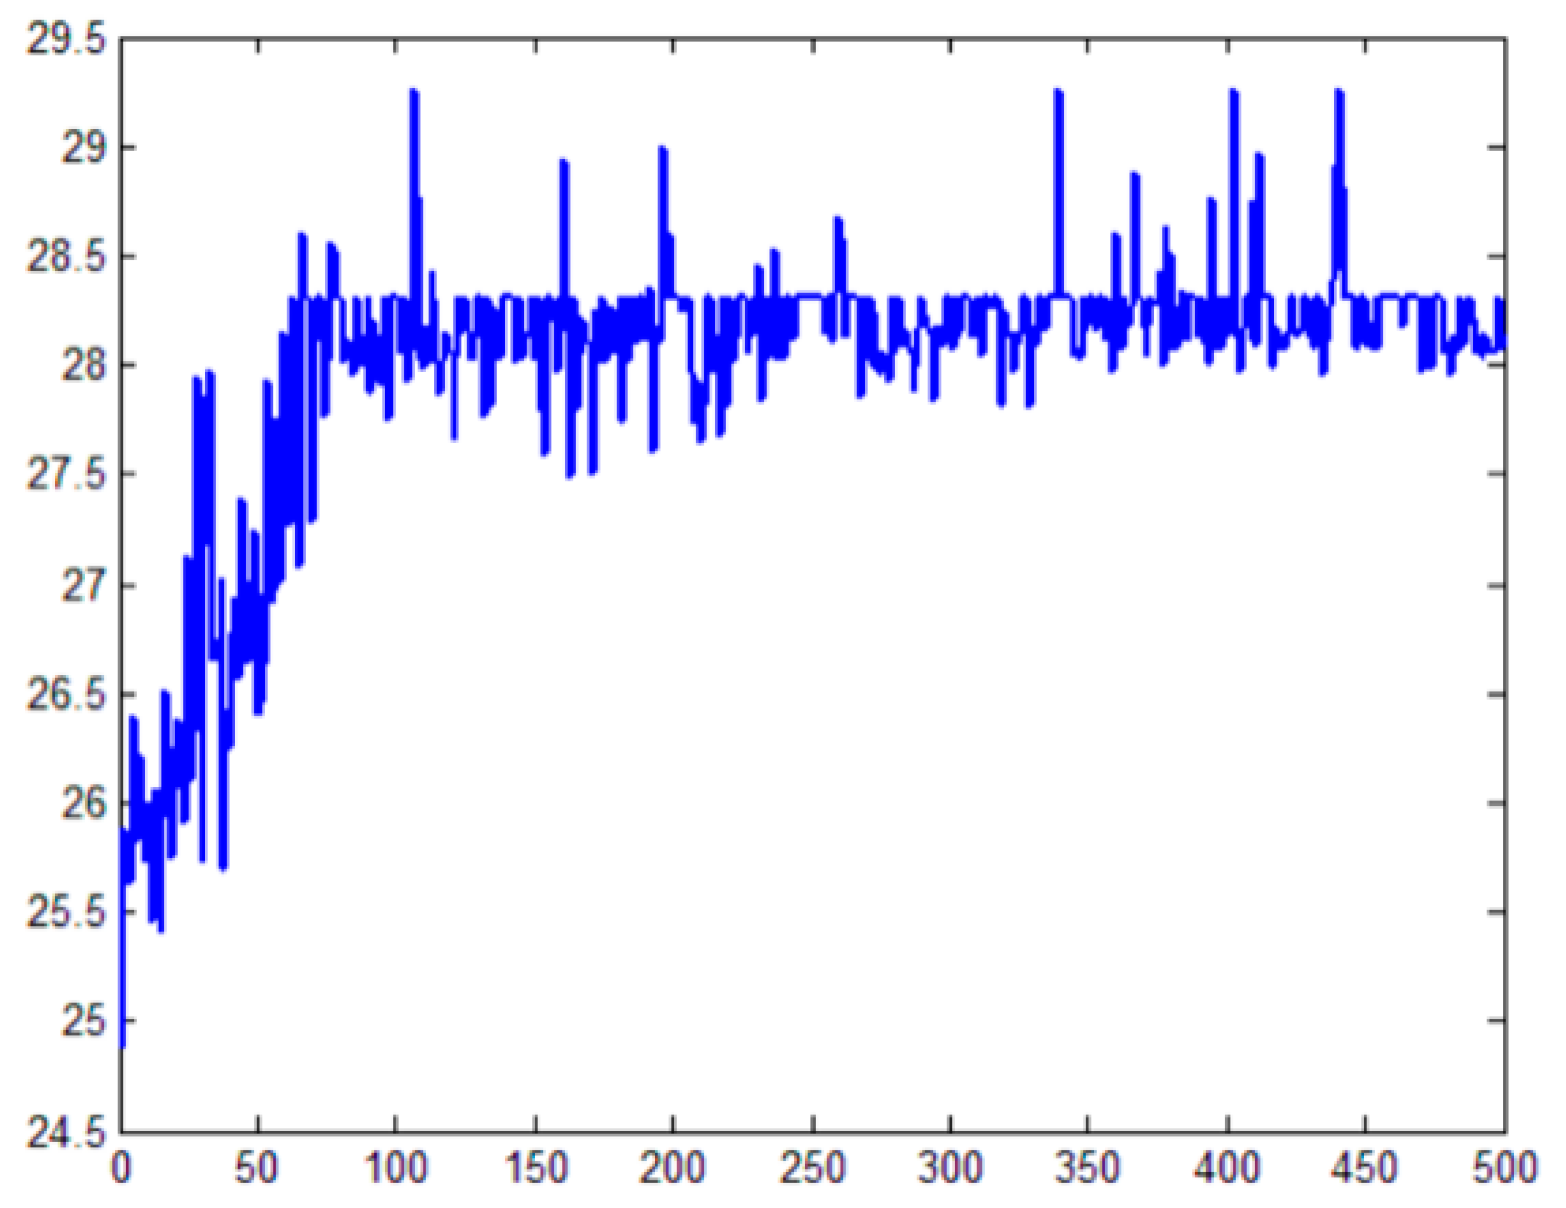
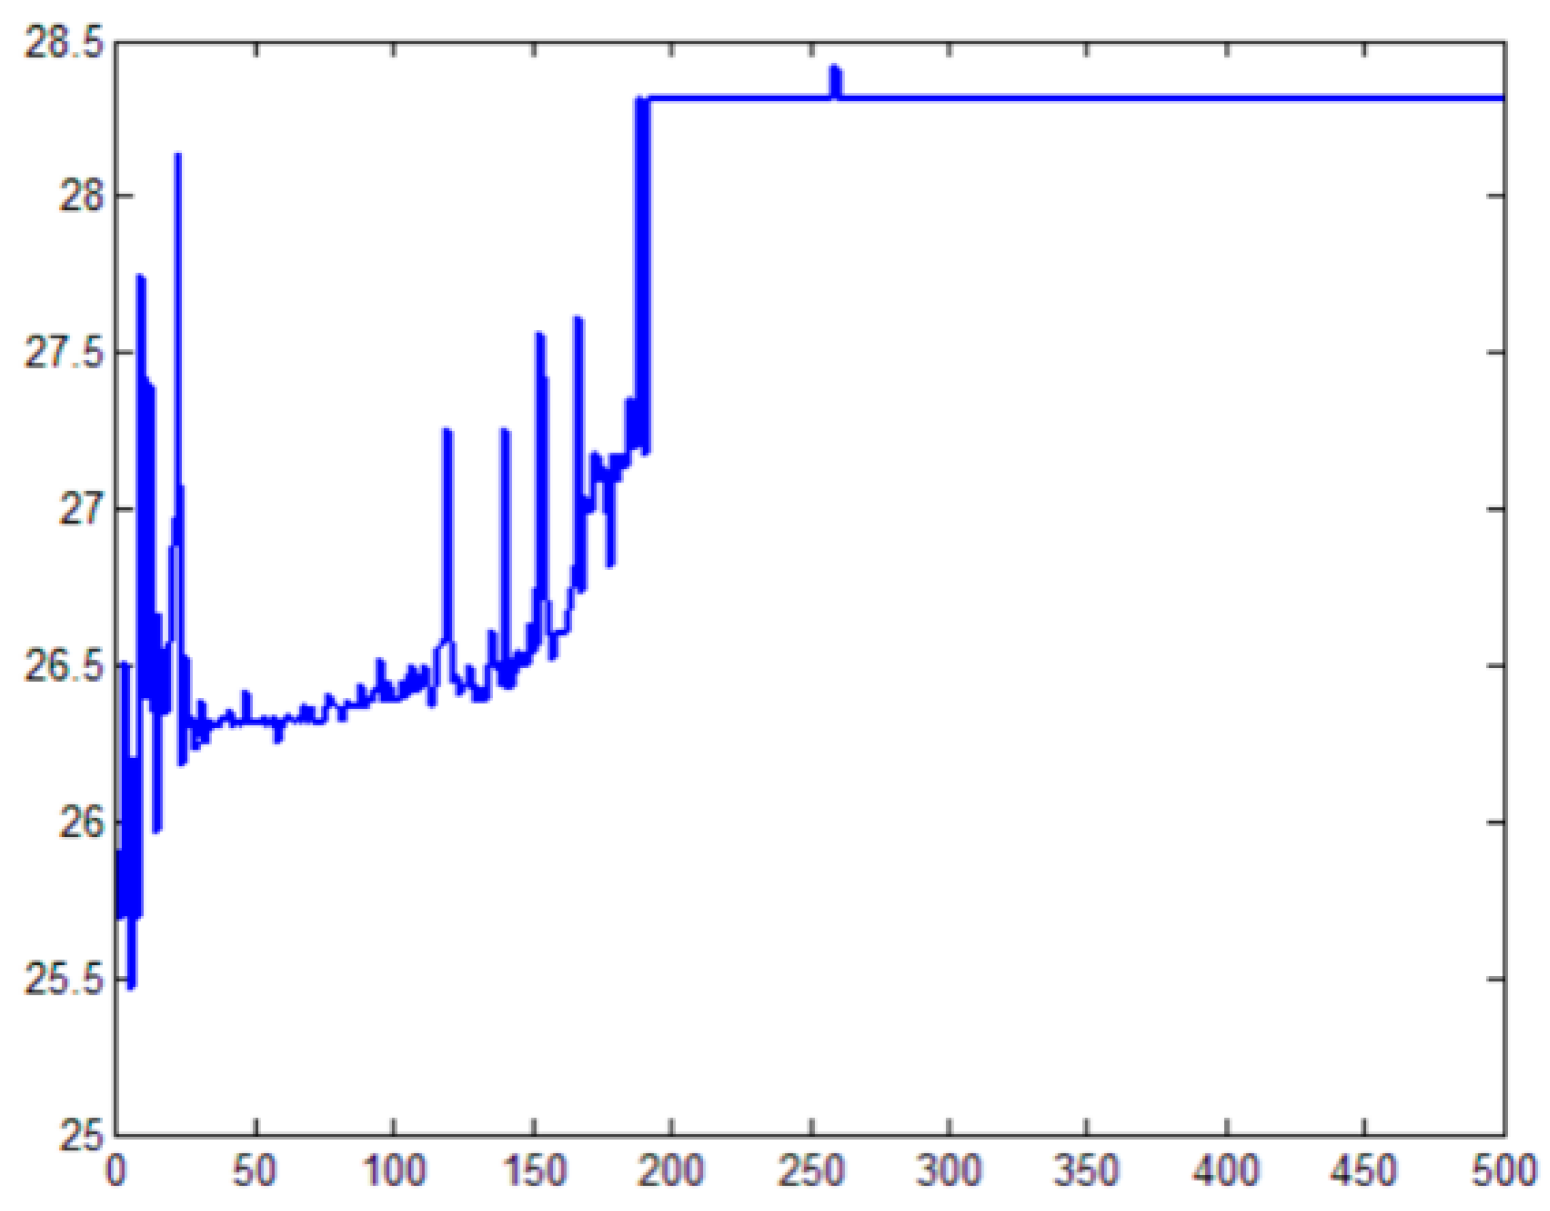
Figure 7 and Figure 8 show the performance of the two strategies after 500 iterations. It can be seen that the two-parent crossover began to converge after 200 generations while the single-parent crossover started to converge after around 80 generations. Both strategies’ fitness values converged at 28.3119, but the single-parent crossover converged faster.
b. Convergence stability
According to the results of multiple experiments, The probability of the optimal allocation scheme (fitness value 28.3119) obtained by the two parent algorithm and the symmetrical single parent algorithm is 95% and 70%, respectively. Moreover, two-parent crossover had higher stability.
Why do the two-parent and single-parent crossover strategies differ in speed and stability? The essence of the single parent crossover is to sacrifice a degree of freedom in exchange for higher convergence speed. How to limit the degree of freedom so that the crossover results can have both efficiency and stability? This is the further direction of this paper. It is proven that both strategies can converge to the optimal value. As the two strategies complement each other in terms of efficiency and stability, it is recommended to adopt the single-parent crossover in local emergency responses and the two-parent crossover in global complex emergency responses.

5. Conclusions

(1) Firstly, this paper establishes a task allocation model for emergency dispatch. It designates the rescue capability of the rescue center coefficient as “u” and defines the capacity penalty factor α based on the rescue center’s distance from the disaster area, its rescue capability, limitation, and the rescue needs of the disaster area. Moreover, this paper defines the penalty factor β to measure the performance of rescue centers in team dispatch. Thus, the task allocation model for emergency dispatch is f = j = 1 m i = 1 n u i j · e ( α + β ) .
(2) Secondly, this paper uses the genetic algorithm to solve the model and applies integer programming to randomly generate integer sequences with individual lengths of m × n: ( t 11 t i 1 t n 1 | | t 1 j t i j t n j | | t 1 m t i m t n m ). This paper makes a detailed explanation of each parameter and sets two preconditions for the crossover strategies: (1) only different rescue missions under the same center can perform the crossover and (2) only different rescue centers under the same rescue mission can perform the crossover.
(3) Thirdly, this paper compares the efficiency and stability of convergence between two-parent crossovers and single-parent crossovers. The two-parent crossover and the single-parent crossover begin to converge at around 200 generations and 80 generations, respectively, indicating that the single-parent crossover converges faster. Besides, the probabilities of obtaining the optimal allocation plan for two-parent crossovers and single-parent crossovers are 95% and 70%, respectively, indicating that the two-parent crossover has better stability of cross-convergence. This is because the degree of freedom during crossover will affect the convergence efficiency and stability. To conclude, it is recommended to use the single-parent crossover in local emergency responses and the two-parent crossover for global and complex emergency responses.

Author Contributions

Conceptualization, Z.D. and F.Y.; methodology, L.F. and J.G.; software, Z.D. and Y.H.; validation, P.H., Z.D. and Y.H.; formal analysis, P.H., Z.D. and Y.H.; investigation, Z.D. and Y.H.; resources, Z.D. and Y.H.; data curation, Z.D. and Y.H.; writing—original draft preparation, Z.D. and Y.H.; writing—review and editing, Z.D. and Y.H.; visualization, Z.D.; supervision, Z.D.; project administration, Z.D.; funding acquisition, Z.D. All authors have read and agreed to the published version of the manuscript.

Funding

This article was supported by National Social Science Foundation of China (No. 17CGL049), National Natural Science Foundation of China (No. 71804026).

Conflicts of Interest

The authors declare no conflict of interest.

References

  1. Zhang, G.; Song, J.; Shao, X.; Han, Y.; Yang, X. Analysis of recent large-scale geological hazard prediction and risk prevention in China. J. Nat. Disasters 2015, 24, 20–27. [Google Scholar]
  2. Xu, S.; Xiao, L.; Li, C.; Wang, M. Review on the Development of two typical geological hazard regionalization techniques in China. J. Nat. Disasters 2017, 2, 22–31. [Google Scholar]
  3. Duan, Z. Chemical Park for Distribution Engineering Risk Analysis and Accident Rescue Research; Beijing Institute of Technology: Beijing, China, 2015. [Google Scholar]
  4. Niu, X.; Tang, H.; Wu, L. Satellite scheduling of large areal tasks for rapid response to natural disaster using a multi-objective genetic algorithm. Int. J. Disaster Risk Reduct. 2018, 28, 813–825. [Google Scholar] [CrossRef]
  5. Li, Q.; Tu, W.; Zhuo, L. Reliable Rescue Routing Optimization for Urban Emergency Logistics under Travel Time Uncertainty. Isprs Int. J. Geo-Inf. 2018, 7, 77. [Google Scholar] [CrossRef] [Green Version]
  6. Zhao, M.; Song, X.; Dong, J.; Wang, S. Using genetic algorithm to solve the optimal problem of emergency material scheduling. J. Shenyang Jianzhu Univ. (Nat. Sci.) 2012, 28, 944–948. [Google Scholar]
  7. Hu, F.; Tian, Z.; Zhao, M.; Han, X. Study on hierarchical linkage dispatch of emergency material based on genetic algorithm. Appl. Res. Comput. 2016, 33, 439–443. [Google Scholar]
  8. Wang, Q. An Emergency Logistics vehicle scheduling algorithm based on discrete bee colony. J. Inner Mongolia Normal Univ. (Nat. Sci. Ed.) 2018, 47, 39–43+54. [Google Scholar]
  9. Wang, Y.; He, Z.; Liu, R. Integrated Optimization of proactive and reactive scheduling for emergency rescue. Syst. Eng.-Theory Pract. 2015, 35, 945–954. [Google Scholar]
  10. Zhang, P. Study on Optimization of Earthquake Emergency Traffic Scheduling Based on The Lifting of Cyberspace. China Commun. 2015, 12, 138–143. [Google Scholar]
  11. Wang, Q.; Liu, S.; Liu, W.; Zoran, K.; Dragan, S. Decision Support System for emergency scheduling of raw water supply systems with multiple sources. Front. Environ. Sci. Eng. 2013, 7, 777–786. [Google Scholar] [CrossRef]
  12. Feng, J.; Gai, W.; Li, J. Multi-objective optimization of rescue station selection for emergency logistics management. Saf. Sci. 2019, 120, 276–282. [Google Scholar] [CrossRef]
  13. Zhang, J.; Liu, H.; Yu, G.; Ruan, J.; Felix, T.S.; Chan, F.T. A three-stage and multi-objective stochastic programming model to improve the sustainable rescue ability by considering secondary disasters in emergency logistics. Comput. Ind. Eng. 2019, 135, 1145–1154. [Google Scholar] [CrossRef]
  14. Bi, C.; Fu, B.; Chen, J.; Zhao, Y.; Yang, L.; Duan, Y.; Shi, Y. Machine learning based fast multi-layer liquefaction disaster assessment. World Wide Web 2019, 22, 1935–1950. [Google Scholar] [CrossRef]
  15. Shen, L.; Tao, F.; Shi, Y.; Qin, R. Optimization of Location-Routing Problem in Emergency Logistics Considering Carbon Emissions. Int. J. Environ. Res. Public Health 2019, 16, 2982. [Google Scholar] [CrossRef] [Green Version]
  16. Li, M.; Zhao, X.; Fan, Z.; Cao, P.P.; Qu, X.N. A model for assignment of rescuers considering multiple disaster areas. Int. J. Disaster Risk Reduct. 2019, 38, 101201. [Google Scholar] [CrossRef]
  17. Sotoudeh-Anvari, A.; Sadjadi, S.J.; Hadji Molana, S.M.; Sadi-Nezhad, S. A stochastic multi-objective model based on the classical optimal search model for searching for the people who are lost in response stage of earthquake. Sci. Iran. 2019, 26, 1842–1864. [Google Scholar] [CrossRef] [Green Version]
  18. Chen, P.; Zhang, J.; Sun, Y. Research on Emergency Rescue of Urban Flood Disaster Based on Wargame Simulation. J. Indian Soc. Remote Sens. 2018, 46, 1677–1687. [Google Scholar] [CrossRef] [Green Version]
  19. Özdamar, L.; Ekinci, E.; Küçükyazici, B. Emergency logistics planning in natural disasters. Ann. Oper. Res. 2004, 129, 217–245. [Google Scholar] [CrossRef]
  20. Swamy, R.; Kang, J.E.; Batta, R.; Chung, Y. Hurricane evacuation planning using public transportation. Socio-Econ. Plan. Sci. 2016, 59, 43–55. [Google Scholar] [CrossRef]
  21. Pérez-Galarce, F.; Canales, L.J.; Vergara, C.; Candia-Véjar, A. An optimization model for the location of disaster refuges. Socio-Econ. Plan. Sci. 2016, 59, 59–66. [Google Scholar] [CrossRef]
  22. Ren, Y.; Tian, G. Emergency scheduling for forest fires subject to limited rescue team resources and priority disaster areas. Ieej Trans. Electr. Electron. Eng. 2016, 11, 753–759. [Google Scholar] [CrossRef]
  23. Han, B.; Yao, P.; Sun, Y. UAVS Cooperative Task allocation based on Multi-Objective MSQPSO algorithm. Acta Electron. Sin. 2017, 45, 1856–1863. [Google Scholar]
  24. Wu, J.; Shi, Z. Distribution Center location problem based on genetic algorithm. J. South China Univ. Technol. (Nat. Sci. Ed.) 2004, 32, 71–74. [Google Scholar]
  25. Akin, L.; Dusunceli, F. A new approach for weighted hardy’s operator in VELS. Appl. Math. Nonlinear Sci. 2019, 4, 417–432. [Google Scholar] [CrossRef] [Green Version]
  26. Bunimovich, L.; Smith, D.; Webb, B. Finding hidden structures, hierarchies, and cores in networks via isospectral reduction. Appl. Math. Nonlinear Sci. 2019, 4, 231–254. [Google Scholar] [CrossRef] [Green Version]
  27. Cai, J.; Zhou, P.; Sheng, B.; He, J. Feedback fuzzy test method based on improved roulette strategy. J. Sichuan Univ. (Eng. Sci. Ed.) 2016, 48, 132–138. [Google Scholar]
Figure 1. Gene sequence.
Symmetry 12 01138 g001
Figure 2. Example of gene sequences.
Symmetry 12 01138 g002
Figure 3. An example of a two-parent crossover with a one-point swap.
Symmetry 12 01138 g003
Figure 4. An example of a single-parent crossover.
Symmetry 12 01138 g004
Figure 5. An example of a single-parent mutation.
Symmetry 12 01138 g005
Figure 6. Topological relationship between rescue centers and disaster areas.
Symmetry 12 01138 g006
Figure 7. Iteration diagram of single-parent crossover.
Symmetry 12 01138 g007
Figure 8. Iteration diagram of two-parent crossover.
Symmetry 12 01138 g008
Table 1. Task allocation table for the rescue center.
Rescue Teams Needed in the Disaster Area t θ 1 t θ j t θ m
Rescue team capacity θ 1 θ j θ m Number of rescue teams to be dispatched by each rescue center
t c 1 C 1 t 11 t 1 j t 1 m j = 1 m t 1 j
t c i C i t i 1 t i j t i m j = 1 m t i j
t c n C n t n 1 t n j t n m j = 1 m t n j
Number of rescue teams dispatched by each mission i = 1 n t i 1 i = 1 n t i j i = 1 n t i m i = 1 n j = 1 m t i j
Table 2. Detailed data sheet for disaster areas and rescue centers.
Rescue Team Rescue Capability/Rescue DistanceRescue Team t θj Required in the Disaster Area7856
Rescue Team Capacity t ci θ1θ2θ3θ4
10C12/94/143/71/12
10C23/131/132/74/8
10C31/122/64/143/7
Table 3. Optimal allocation results.
θ1θ2θ3θ4
C13330
C23113
C31413