Article

A Two-Tier Partition Algorithm for the Optimization of the Large-Scale Simulation of Information Diffusion in Social Networks

1
College of Systems Engineering, National University of Defense Technology, Changsha 410073, China
2
Department of Information Management and Information Systems, School of Management, Fudan University, Shanghai 200433, China
*
Author to whom correspondence should be addressed.
Symmetry 2020, 12(5), 843; https://doi.org/10.3390/sym12050843
Submission received: 26 April 2020 / Revised: 13 May 2020 / Accepted: 14 May 2020 / Published: 21 May 2020
(This article belongs to the Special Issue Recent Advances in Social Data and Artificial Intelligence 2019)

Abstract

:
As online social networks play a more and more important role in public opinion, the large-scale simulation of social networks has been focused on by many scientists from sociology, communication, informatics, and so on. It is a good way to study real information diffusion in a symmetrical simulation world by agent-based modeling and simulation (ABMS), which is considered an effective solution by scholars from computational sociology. However, on the one hand, classical ABMS tools such as NetLogo cannot support the simulation of more than thousands of agents. On the other hand, big data platforms such as Hadoop and Spark used to study big datasets do not provide optimization for the simulation of large-scale social networks. A two-tier partition algorithm for the optimization of large-scale simulation of social networks is proposed in this paper. First, the simulation kernel of ABMS for information diffusion is implemented based on the Spark platform. Both the data structure and the scheduling mechanism are implemented by Resilient Distributed Data (RDD) to simulate the millions of agents. Second, a two-tier partition algorithm is implemented by community detection and graph cut. Community detection is used to find the partition of high interactions in the social network. A graph cut is used to achieve the goal of load balance. Finally, with the support of the dataset recorded from Twitter, a series of experiments are used to testify the performance of the two-tier partition algorithm in both the communication cost and load balance.

1. Introduction

With the development of Internet technology, Facebook, Twitter, WeChat, Weibo, and other social network applications have developed rapidly. As of 31 December 2018, Facebook had 2.32 billion monthly active users, with an average of 1.52 billion daily active users in December 2018. According to the annual data report of WeChat in 2018 [1], up to September of this year, there were 1.0825 billion active online users every month, and the daily information delivery volume of WeChat reached 45 billion times. The rapid development of all kinds of social media makes the use of the Internet has had a profound change, from the simple information search and browsing to the establishment and maintenance of online social relations, information creation, communication, and sharing based on social relationships. Social networks have penetrated every aspect of our life [2]. The role of social relationships in information diffusion, guidance for individuals, media influence, and promoting attitude or behavior change are influenced by social networks [3]. Research on social networks can be summarized into three types: the structural characteristics and evolution mechanism of social networks, the formation and interaction of group behaviors in social networks, and the law and evolution of information diffusion in social networks [4]. However, the coverage of current mainstream media is widespread, and corresponding social network nodes are massive, complex in structure, and the calculation of whether nodes transmit information is complicated. Relevant theories in the fields of psychology, communication, and complex networks are difficult to be directly applied in quantitative researches. As a result, agent-based modeling and simulation (ABMS) [5] is one of the most popular methods to solve these problems in a symmetry simulation world. In ABMS, every node in the social network is mapped into an agent. As all the agents follow human behavioral mode, a social network evolves during the running of the simulation. Under certain conditions, a specific emergence may occur, reflecting the evolution of real society. In this symmetrical way, real-world data can be used to revise the information diffusion in the symmetrical simulation world, and at the same time, through the study of information diffusion in the symmetrical simulation world, we can intervene in real-world information diffusion.
The applications of ABMS tools, such as NetLogo, Repast, and Swarm, are very popular in the fields of sociology, communication, and psychology [6,7,8,9]. However, these simulation tools are designed with more consideration of generalization, and the flexibility and scalability are limited; in particular, the performance is not acceptable in large-scale simulation. Although Repast has an HPC(High Performance Computing) version, which is for high performance computing, it is not optimized for social network simulation. Repast HPC is suitable for modeling general agent-based complex systems, but complex networks themselves have characteristics that are different from general complex systems, such as small-world characteristics, scale-free characteristics, etc. At the same time, the propagation calculations in complex networks have special fast calculation requirements related to networks such as node degrees, clustering coefficients, and community structure. Therefore, as a generic ABMS tool, Repast HPC does not directly support the fast calculation of these characteristics of complex networks. Although Repast HPC is well known in the implementation of large scale ABMS, it hadn’t been proven to perform well in the simulation of large-scale complex network propagation. Thus, large-scale social network simulation is a problem worth studying.
Large-scale social network simulation is used to study information diffusion and topology changes in the network through the modeling and simulation of large-scale social networks. The amount of data involved is huge, and various difficulties are faced in the actual studies.
  • Difficulties in the storage, management, and analysis of big data. For large-scale social networks, such as WeChat and Weibo, the scale of data is very large—usually hundreds of millions or even billions. It is difficult to manage such unstructured data based on traditional file storage or relational databases. When the network scale is too large, the time consumption of connectivity is not acceptable in the traditional relational database, let alone in the analysis and calculation of network indexes such as node degree, cascades, and so on.
  • Difficulties with the implementation of the simulation of large-scale social networks. Existing high-performance simulation engines, including MPI-based(Message Passing Interface) simulation tools, GPU-based(Graphic Processing Unit) simulation engines [10], and so on, cannot obtain high performance in the simulation of large-scale social networks because of the strong correlations in the network. Too many interactions among nodes decrease the performance greatly, especially when the nodes are distributed in different machines.
With the advent of the era of big data [11], many big data platforms such as Hadoop and Spark have been spawned. With the support of these technologies, it is easy to analyze big data by the efficient management and application of clusters, cloud environments, etc. [12,13]. These platforms can also support the simulation of the social networks obtained from big data. This paper proposes a method to implement a large-scale social network simulation based on Spark, and the optimization based on the network structure is also given to improve the performance of the simulation. The rest of this paper is organized as follows. Section 2 gives the current research on large-scale social network simulation; Section 3 introduces how to build the large-scale social network simulation using the Spark platform; Section 4 presents the optimization of the social network simulation based on the network structure; the effectiveness of the optimization method is testified by the experiments in Section 5; the conclusion and areas for future work are given in Section 6.

2. Related Works

There are many studies on agent modeling based on existing tools, such as NetLogo, Swarm, MASON, and Repast [14,15]. NetLogo, with its heritage as an educational tool, stands out for its ease of use and excellent documentation. However, the performance of large models is hard to bear. Usually, only hundreds of agents are supported. For example, Anuj and Caroline et al. proposed an agent-based model to predict the performance of different residential distributed solar models with respect to the stakeholders’ objectives [16]. Swarm is relatively small and well-organized while providing a fairly complete set of tools. However, it cannot support a large-scale simulation either. It is fast for simple models but slow for complex ones. MASON could be a good choice for experienced programmers working on computationally intensive models. However, it is nonstandard and sometimes confusing terminology is given. Repast is certainly the most complete Java platform, but it is not suitable for large-scale simulation [9]. The scale of agents developed in Repast is usually less than 1 million because of performance. For example, in reference [17], Griffin and Stanish developed an agent-based model using the Repast agent-based modeling toolkit. They took 500,000 agents for this model in total. In reference [18], Mock and Testa developed an agent-based model of predator–prey relationships between transient killer whales and threatened marine mammal species in Alaska based on Repast for about 200,000 agents. Existing agent-based modeling tools cannot support the large-scale simulation of information diffusion well.
Based on Hadoop, Kangsun Lee et al. designed ARLS (After-action Reviewer for Large-scale Simulations), a tool for analyzing simulation results, and used MapReduce to batch process simulation log files to accelerate the analysis of the simulation results [19]. Reference [20] proposed an agent-based modeling method based on Hadoop; the MapReduce programming model was used to implement the simulation kernel. Hadoop automatically realized the underlying load balance and fault tolerance. Compared with the traditional simulation tools, this framework greatly improves the performance and scalability of the simulation. References [21,22] applied Hadoop in the simulation of molecular dynamics and power systems. He Liang et al. proposed a large-scale Online Social Network (OSN) worm simulation based on MapReduce. The OSN worm propagation process was divided into different stages and MapReduce was used to construct the corresponding map and reduce algorithms [23]. However, because the programming model of Hadoop is relatively simple, and the hard disk needs to be read and written frequently during the operations, the above large-scale simulation research based on Hadoop still has many limitations in performance.
With the improvement of the Spark ecosystem, Spark has gradually become the most popular big data framework. Chuan Ai et al. [24] implemented the propagation simulation of large-scale social networks based on Spark’s graph computing library GraphX and the Pregel algorithm. The performance of the simulation kernel was increased greatly GraphX is Apache Spark’s API (Application Programming Interface) for graphs and graph-parallel computation, with a built-in library of common algorithms. The networks are organized and managed in the form of nodes and edges. Pregel is a bulk synchronous parallel computing model (BSP model). The simulation of propagation is abstracted as a series of supersteps. Nodes in each superstep pass messages to each other and the nodes update the state according to the messages received previously and their state update mechanism. The large-scale social network simulation method based on Pregel is simple and fast. However, because Pregel is tightly packaged, users can analyze the simulation process and results only after the simulation is completed, and state transformations cannot visually be observed during the simulation. As a result, the difficulties faced by actual large-scale social network simulations lie in the whole process from data management to the analysis of the simulation results.
Based on the problems discussed above, this paper proposes a large-scale social network simulation framework based on Spark. The built-in components in the Spark ecosystem are used to support data management, data analysis, and simulation experiments in a large-scale social network simulation.

3. The Spark-Based Large-Scale Simulation of Information Siffusion in Social Networks

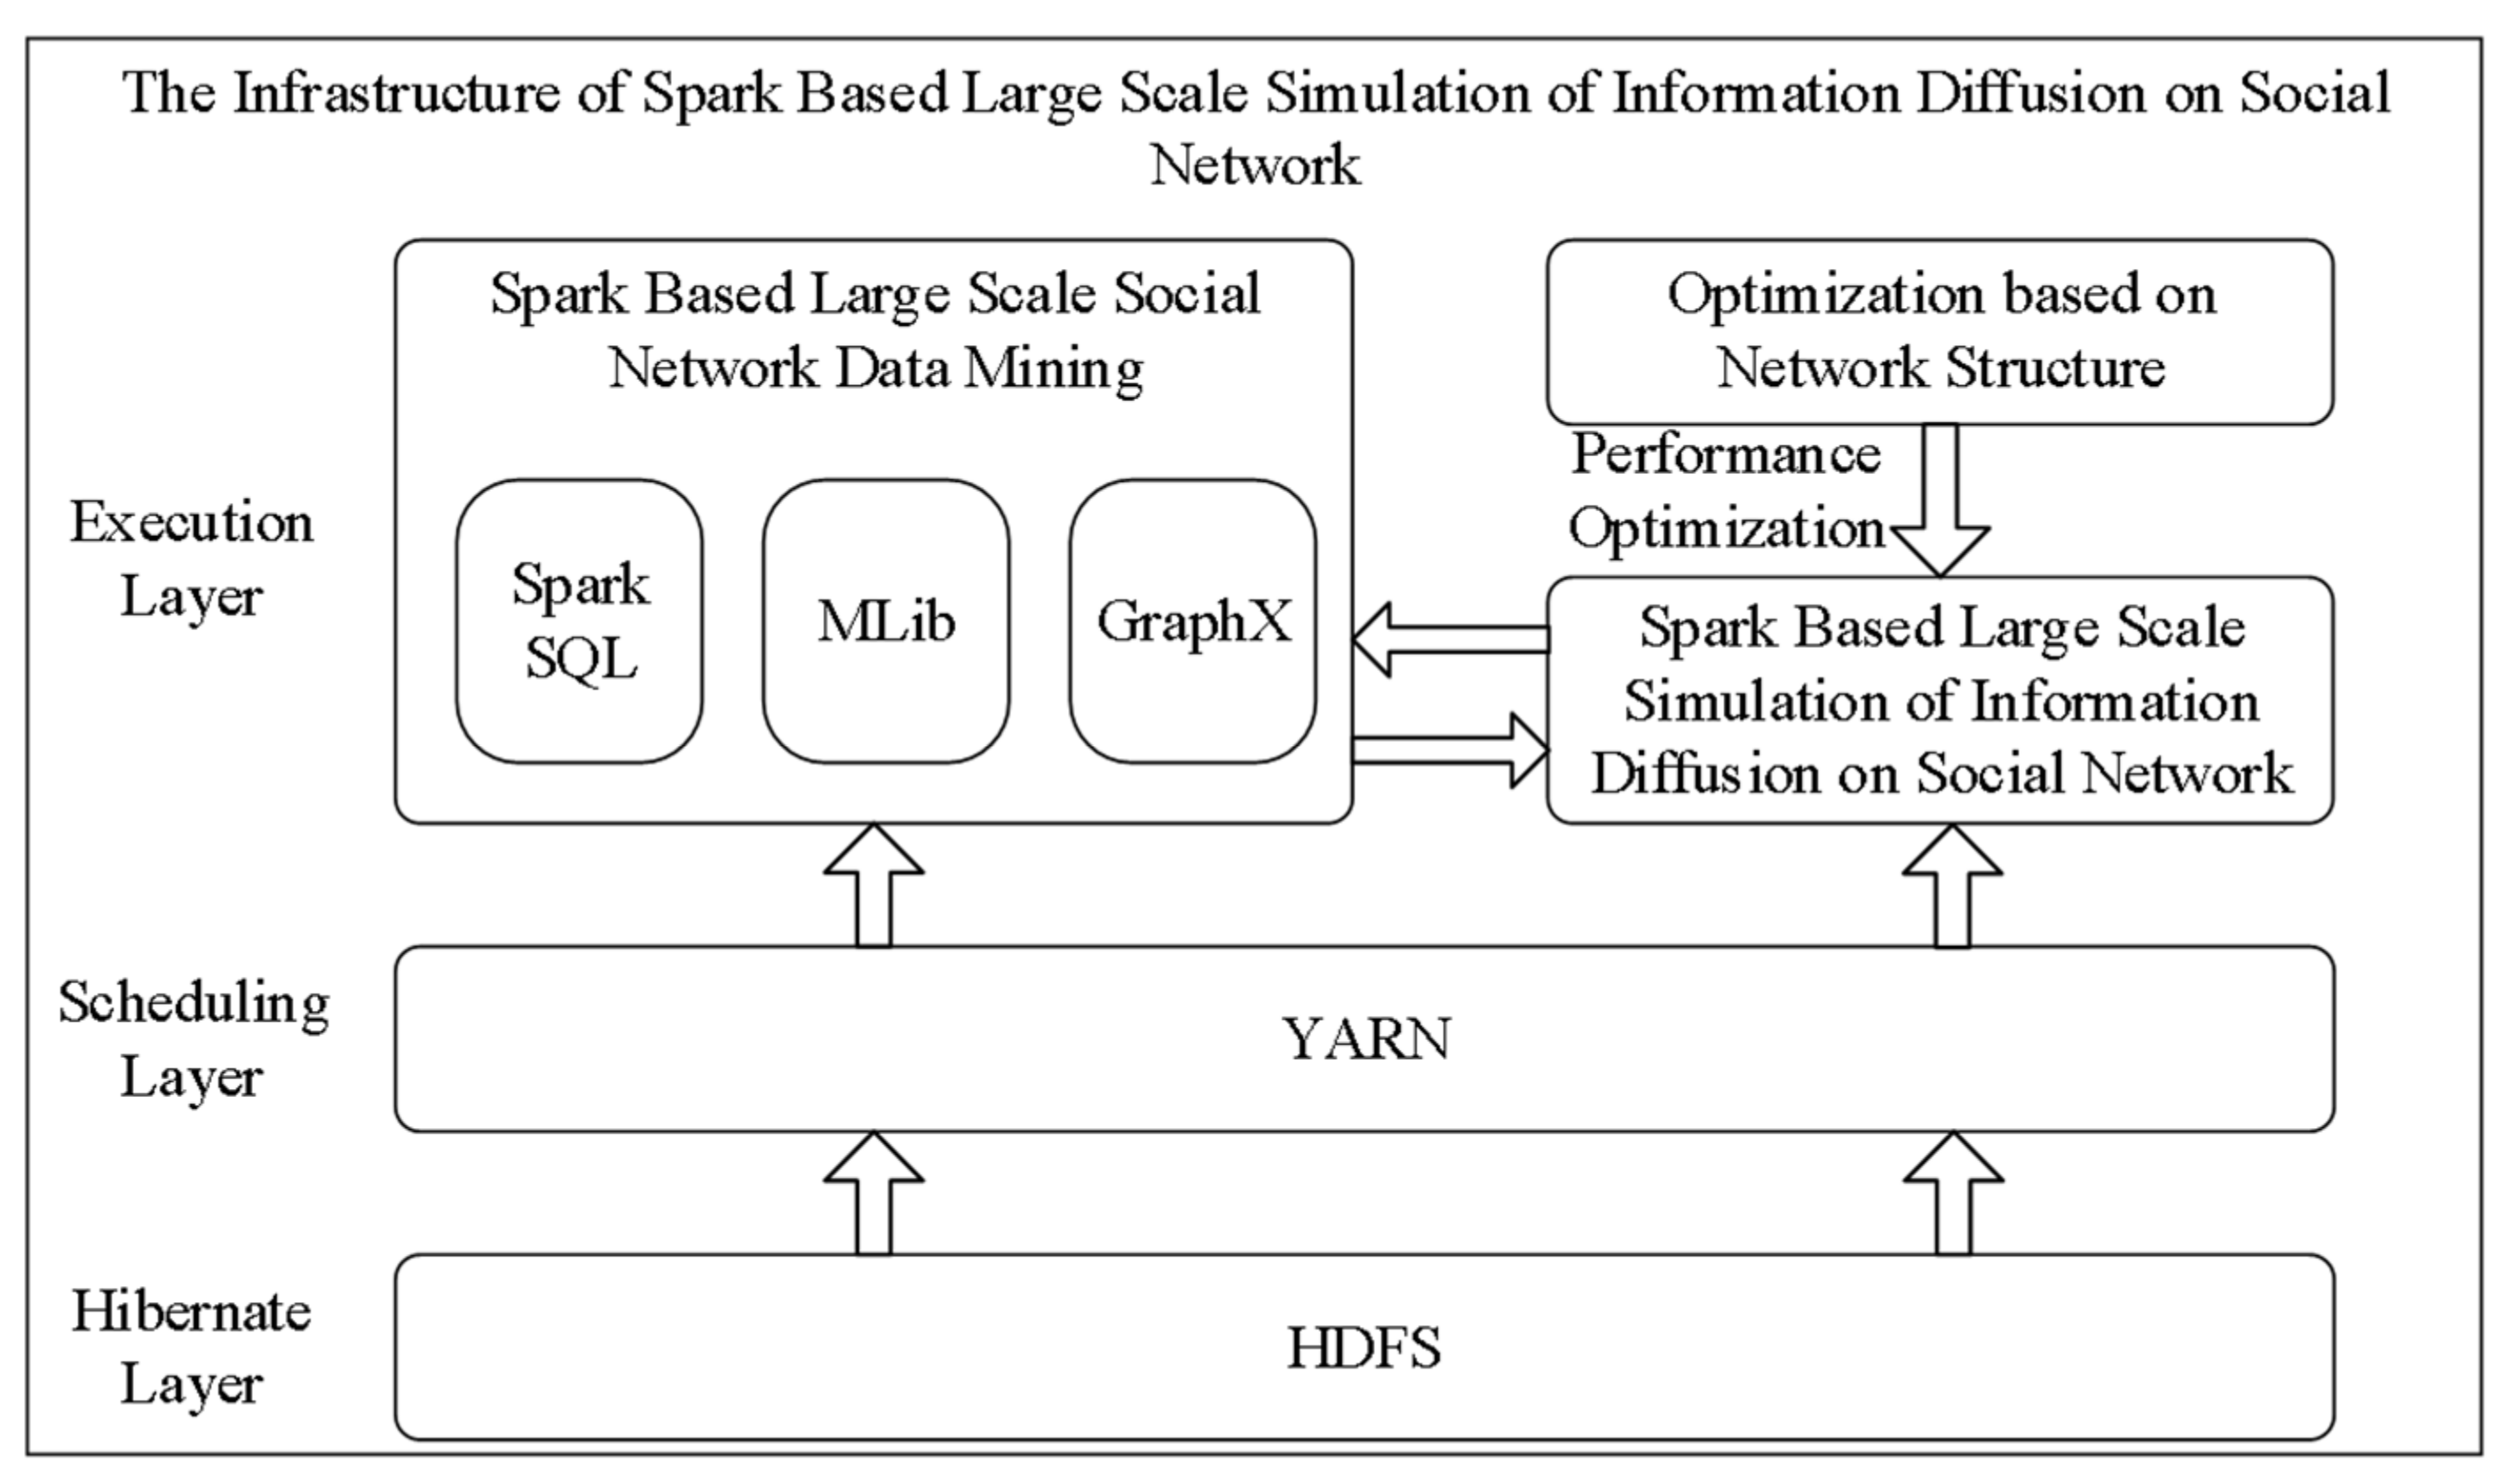
3.1. The Infrastructure of Simulation

The infrastructure of the Spark-based large-scale simulation of information diffusion in social networks designed in this paper is shown in Figure 1. The simulation framework is composed of three layers. From the bottom up, they are the hibernate layer, the scheduling layer, and the execution layer. The hibernate layer is used for the big data storage of large-scale social networks in HDFS (Hadoop Distributed File System). The scheduling layer is responsible for job scheduling and distribution, distributing large-scale social network simulation and analysis jobs to different nodes in the cluster. The execution layer is the top layer, which is composed of a data analysis module and a simulation kernel. The simulation kernel is the core part of the large-scale social network simulation framework based on Spark. Based on the data interaction characteristics and the characteristics of large-scale social networks, the optimization of the simulation kernel is proposed to further accelerate the execution of a large-scale social network simulation.
The large-scale social network simulation based on Spark is the core module that supports the execution of the agent-based simulation on distributed clusters. The agent model and the implementation of the simulation kernel on Spark are illustrated below.

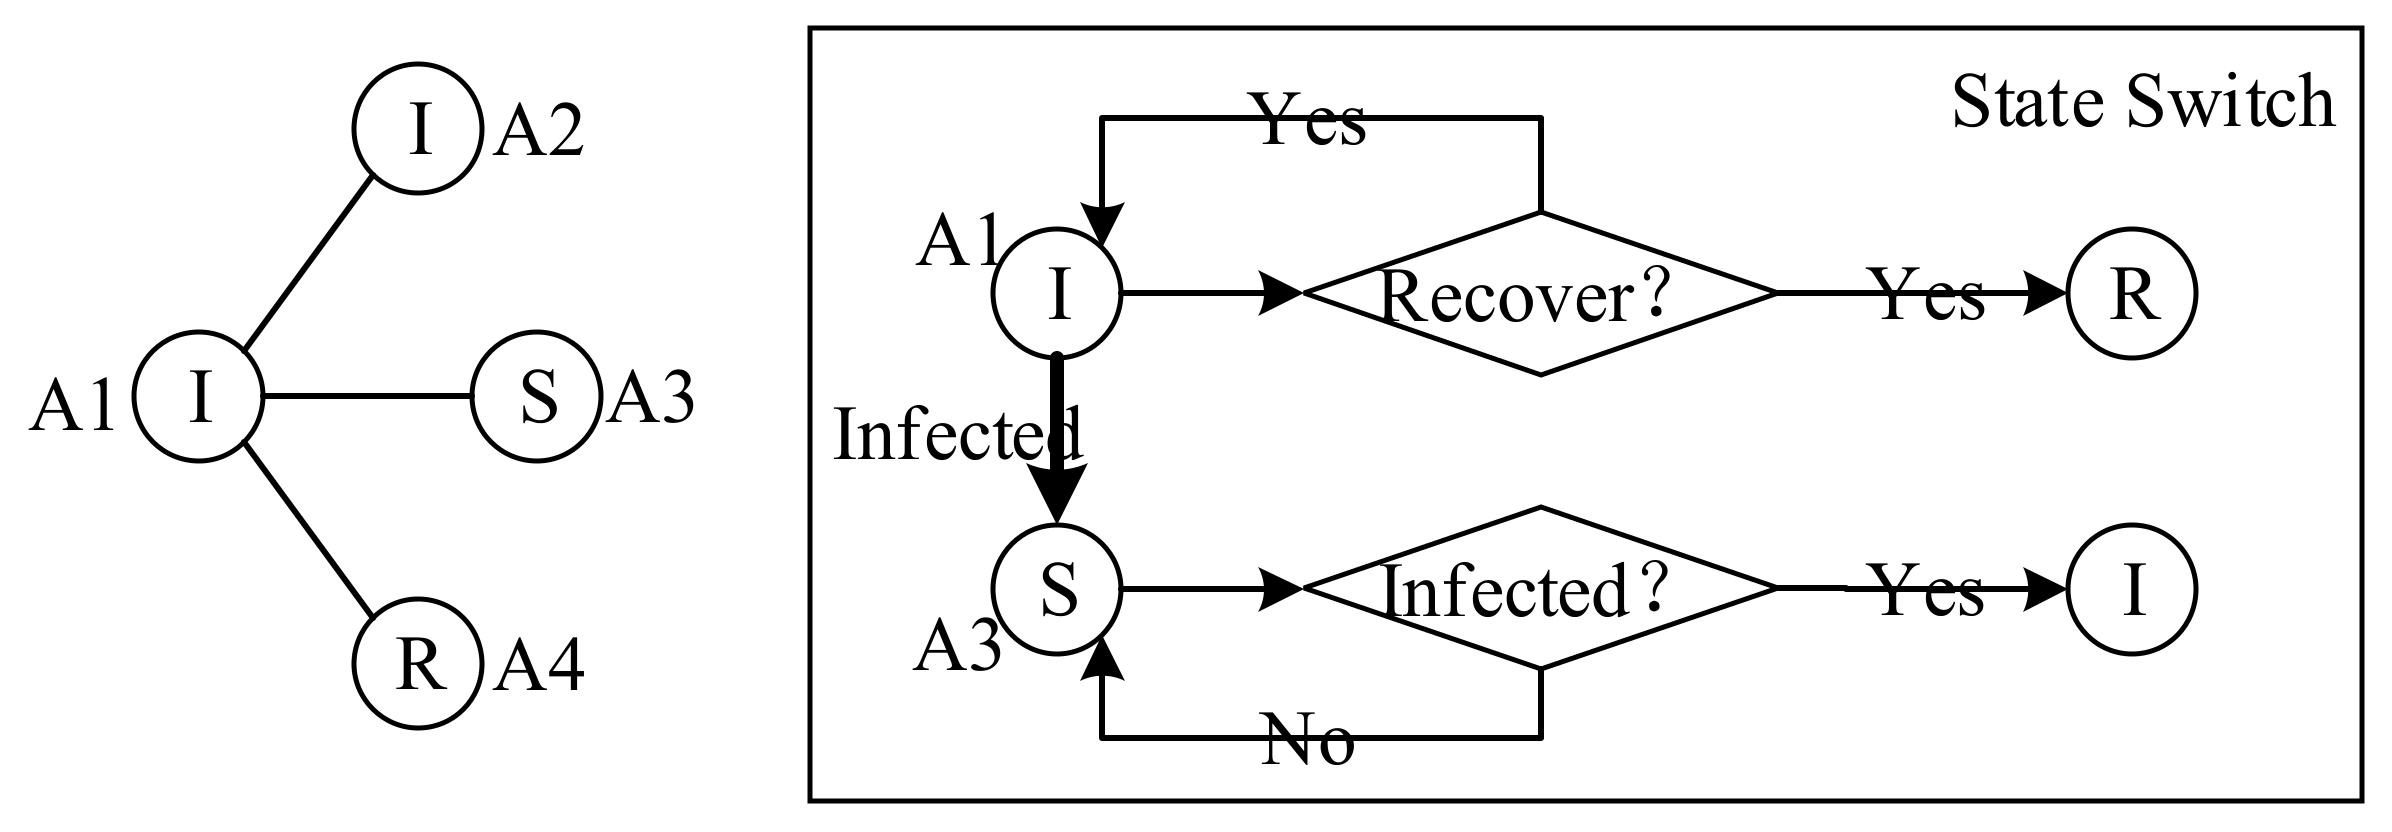
3.2. The Agent Model

This paper uses ABMS to model information diffusion in large-scale social networks. Each agent represents a node in the social network. In a large-scale social network diffusion simulation, information is transmitted between nodes in the network according to a certain mechanism. In this paper, the SIR (Susceptible Infected Recovered) model is used for the large-scale social network diffusion simulation. First, the definition of the agent model is given as follows:
<ID, ASN, S, I, R, M>.
ID represents the unique identifier of the agent; ASN represents the set of out-degree neighbors, that is, the set of agents to whom the current agent will send messages. S, I, and R are the states of the agents. S means susceptible—it represents the agent who has not received the message or has received the message but the message is not enough to attract his attention; I means infected—it represents the agent who has received the message and would like to forward this message to his neighboring agents; R means recovered, which is always after S and never transforms to other states again—it represents the agent who does not care about the message and will never send this message to his neighboring agents. M is the message transmitted by the agent.
The behavior of the agent follows the mechanism of the SIR model. The SIR model is essentially the process by which an infected node infects its neighboring susceptible nodes and the self-immune. As for information diffusion in large-scale social networks, the switching of the model states is shown in Figure 2. The left side of the figure shows a simple case of a four-agent network. A1, A2, A3, and A4 stand for the agent ID. The letters in the circle represent the agent state. The states of A1 and A2 are I, which means that they have received the message and will forward the message. The A3 status is S, indicating that if he receives the message, he may turn to I. A4 is R, which means that he is immune to this message and does not care or will not forward it. Because A3 is a neighbor of A1, when A1 forwards the message, A3 will receive the message and transform to the I state according to a certain probability. Meanwhile, A1 will also automatically transform to the R state according to a specific probability. The state switching process is shown on the right side of Figure 2.

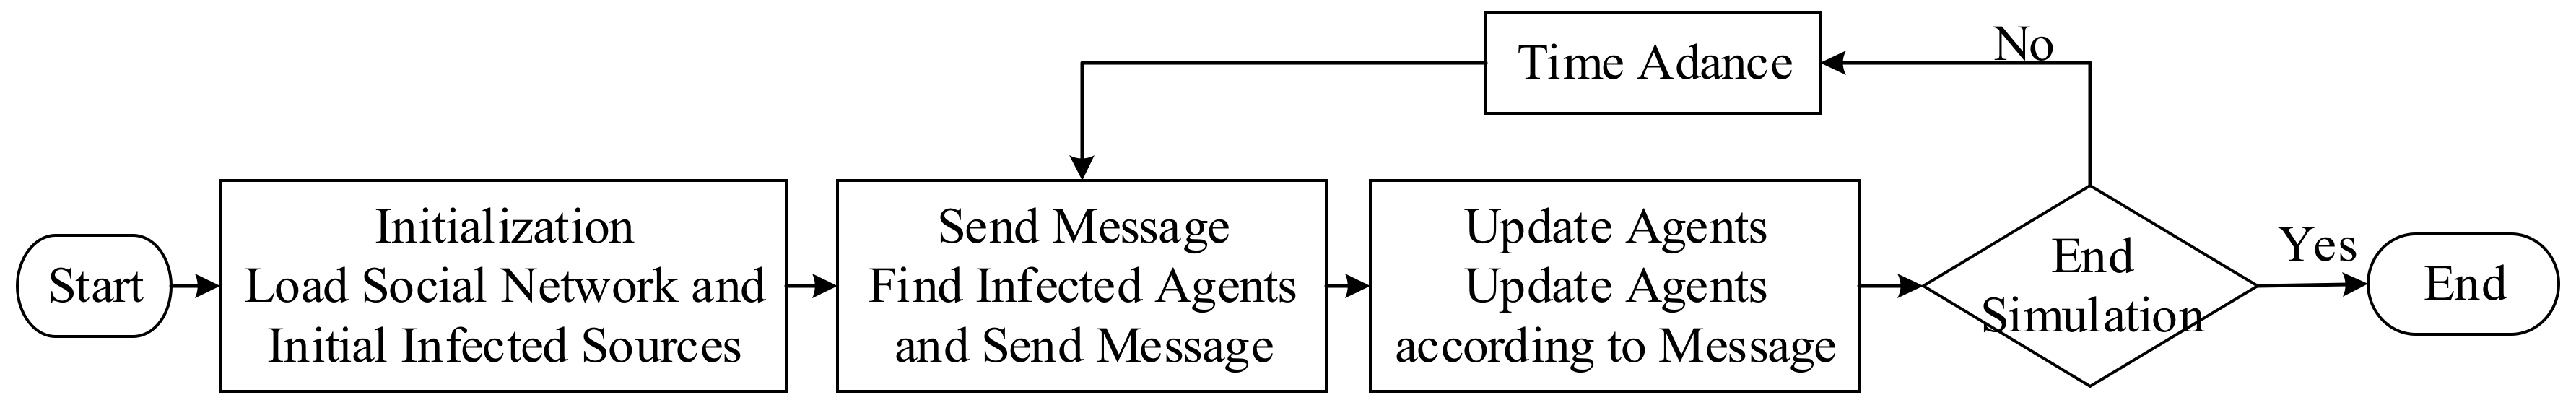
3.3. The Implementation of a Simulation Kernel in Spark

A simulation kernel is composed of the calculation of agents and the scheduling algorithm. As the simulation kernel is implemented in Spark, it is necessary to partition the social network reasonably and design the scheduling algorithm based on the Spark programming model. As a result, the Spark data structure, Resilient Distributed Data (RDD), is used to organize the large-scale social network, and the Spark programming model is also used to build the processing flow of the simulation kernel. Actually, the functions of the simulation kernel are implemented by a series of operations and transformations on the social network model stored in RDD in the cluster. Each computing node in the cluster performs local computing on a part of the network stored in the node and then aggregates to achieve parallel computation. Therefore, the design of a large-scale social network simulation kernel based on Spark can be divided into two parts: the design of the data structure and the design of the scheduling algorithm.

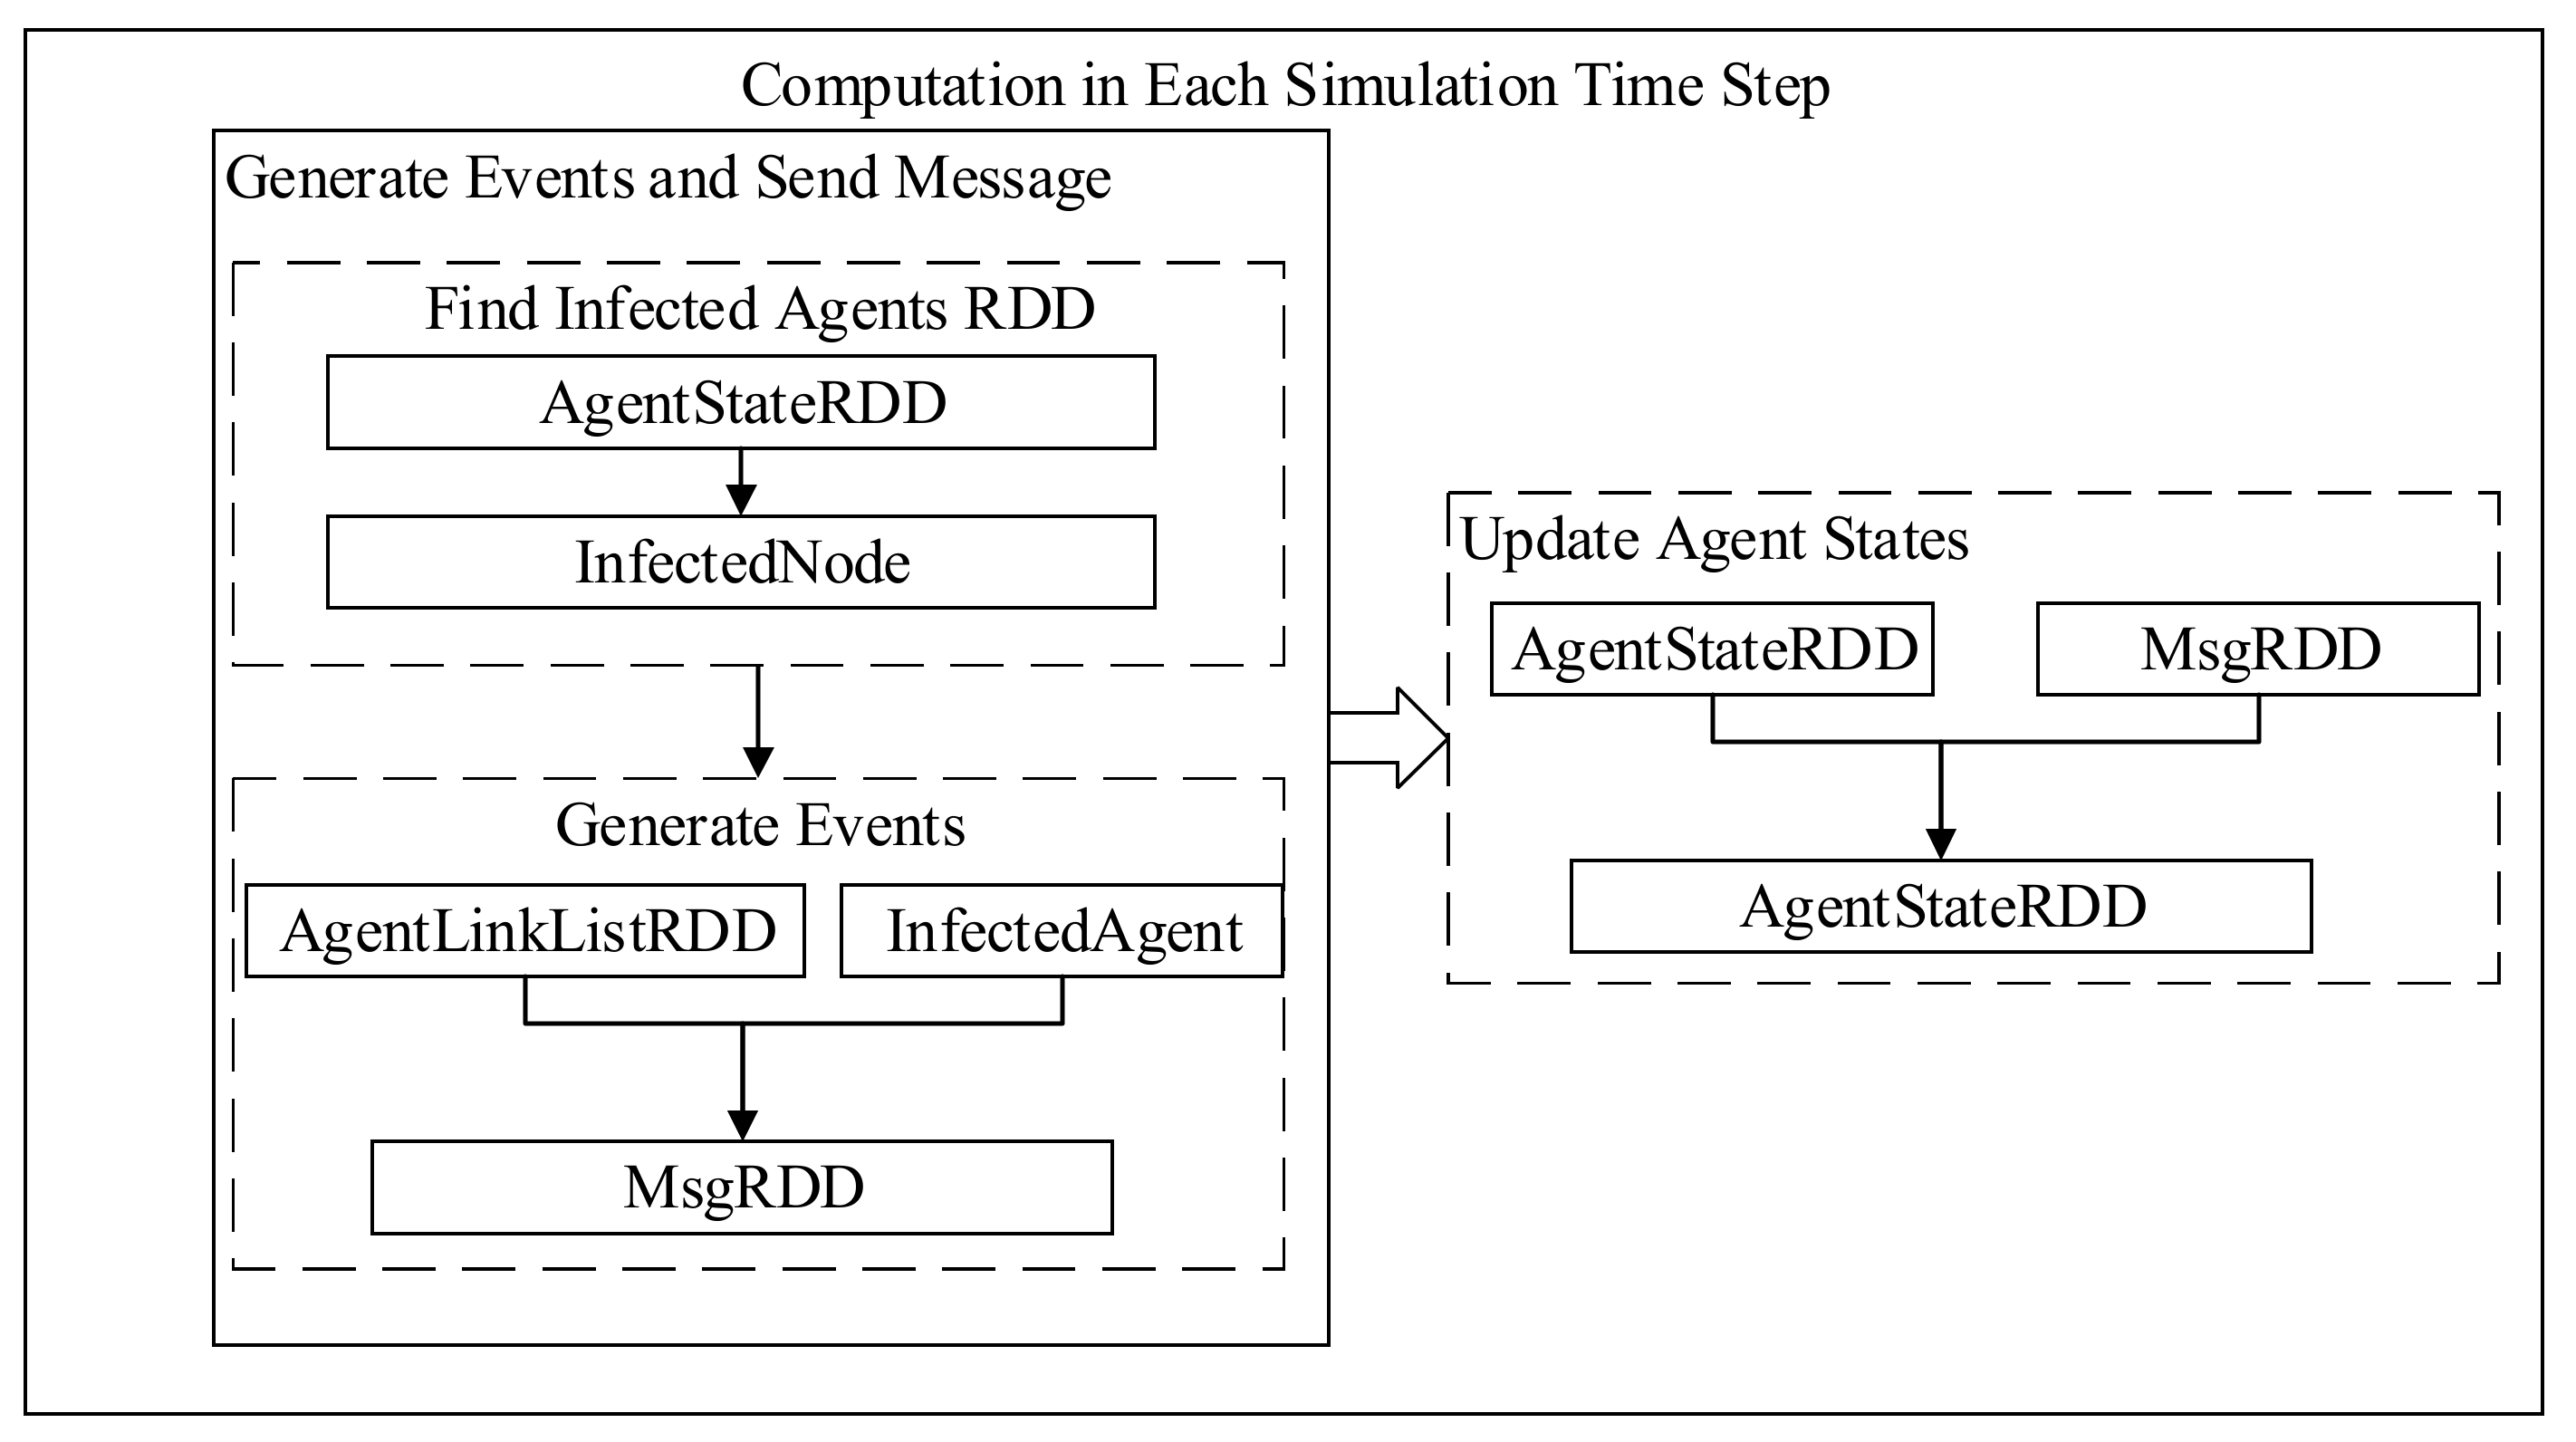
3.3.1. The Design of Data Structure

Data in Spark is stored, transformed, and calculated in the form of RDD. The broadcast variables and accumulators to process global data are also designed to optimize the simulation performance. Therefore, in the design of the data structure of the simulation kernel, it is necessary to consider the design of the RDD involved in the simulation process firstly, then broadcast variables and accumulators are considered too.
RDD is divided into two types: <Key> and <Key, Value>, which are used to organize different types of data. In a large-scale social network simulation, the data includes nodes and edges in the network, messages generated during the simulation, and temporary variables involved in the calculation process of the model. The main data structures of the simulation kernel and their descriptions are shown in Table 1.
The descriptions of the data structures are detailed below.
(1) AgentStateRDD
AgentStateRDD records the state information of Agents. The RDD is in the form of <Key, Value>. Key is the agent number, and value is the state of the agent. As mentioned in Section 3.2, the agent state includes three types—S, I, and R—in the SIR model.
(2) AgentLinkListRDD
AgentLinkListRDD records the list of neighboring agents. The key of AgentLinkListRDD is the agent number, and value is the list of neighboring agents. In the existing large-scale social network research, the links in the network are mostly stored in the form of edges. However, the storage of edges has certain problems. In large-scale social networks, agents have many connected edges, and each node corresponds to many neighboring agents. For example, young users of WeChat have an average of 128 friends. The edges corresponding to each user have an average of 128 pieces of data, and the start number will be recorded 128 times. In Sina Weibo, some verified influencers may have tens of millions of fans. Managing edge information in this form will inevitably bring data redundancy. In addition, in the simulation agents will send information to neighboring agents as needed, which requires frequent iterative access to the agent edge information.
Based on the above problems, the links between agents are stored in the form of the neighboring agents list of the agent, AgentLinkListRDD. All neighboring agents can be easily obtained by the start number in AgentLinkListRDD, which can greatly improve the efficiency of the simulation operation.
(3) MsgRDD
MsgRDD records all messages generated during the simulation. Each message represents an infection event between two agents. In the event, the target agent is the agent that receives the message, and the message needs to be passed to the target agent to update the state of the target agent. Therefore, set the key as the target agent number, and the content of the message and other information are recorded in the value.
(4) InfectedAgentBroadcast and InfectedAgentRDD
Both InfectedAgentBroadcast and InfectedAgentRDD are the data structures used to record infected agents during the simulation. In the SIR model, each infected agent sends messages to its neighboring agents to infect them. This operation needs to link the infected agent and AgentLinkListRDD. The linking is really time-consuming when the scale of information diffusion is large. At first, the InfectedAgentRDD is designed in the form of <Key, Value>, where key is the agent number. In Spark, the InfectedAgentRDD and the AgentLinkListRDD are connected through the same key to obtain MsgRDD. However, it was actually found that in the Spark programming model, the join operation needed to cache a large amount of data and the operation efficiency was low. Furthermore, it was found that in the initial stage of information diffusion on social networks, the number of infected agents was small. Performing a join operation, in this case, led to unnecessary computation, so the two data structures, InfectedAgentBroadcast and InfectedAgentRDD, were designed to manage the infected Agents together. When a large number of agents were infected, InfectedAgentRDD was used to connect with AgentLinkListRDD, and when the number of agents was not large, the broadcast variable InfectedAgentBroadcast was set in each computing node. Thus, the communications were reduced greatly during the simulation.

3.3.2. Scheduling Mechanism

The design of the data structure basically includes the management of data and variables involved in the simulation process. However, for a large-scale social network simulation based on Spark, the scheduling mechanism needs to be converted into the operations of RDD. In the diffusion of information in large-scale social networks, messages are sent and received very frequently. The topology of large-scale social networks is also changing rapidly. Therefore, it is more efficient to use a time step-based method to schedule the simulation, and the changes of the network are observed within a certain time interval. The workflow of scheduling is shown in Figure 3. Because data is organized and managed in the form of RDD in Spark, an RDD operation task is allocated to computing nodes first, and the next operation is performed when the tasks on all computing nodes are completed. This mode implements the time synchronization of the agents in the simulation. On this basis, the large-scale social network simulation process can be divided according to time steps. In a simulation step, information is diffused based on the message passing and state updating of agents, which are actually the generations of MsgRDD and the update operations of AgentStateRDD.
The simulation flow in each simulation step is represented as the RDD conversion flow frame shown in Figure 4.
The corresponding simulation logic inside the dotted box in the figure is implemented in RDD operator, which is the core module in Spark programming. The reasonable design of the RDD operator can greatly reduce the execution time of the work and improve the performance of the simulation. The message-passing mechanism and state-updating mechanism in the RDD operator are detailed below.

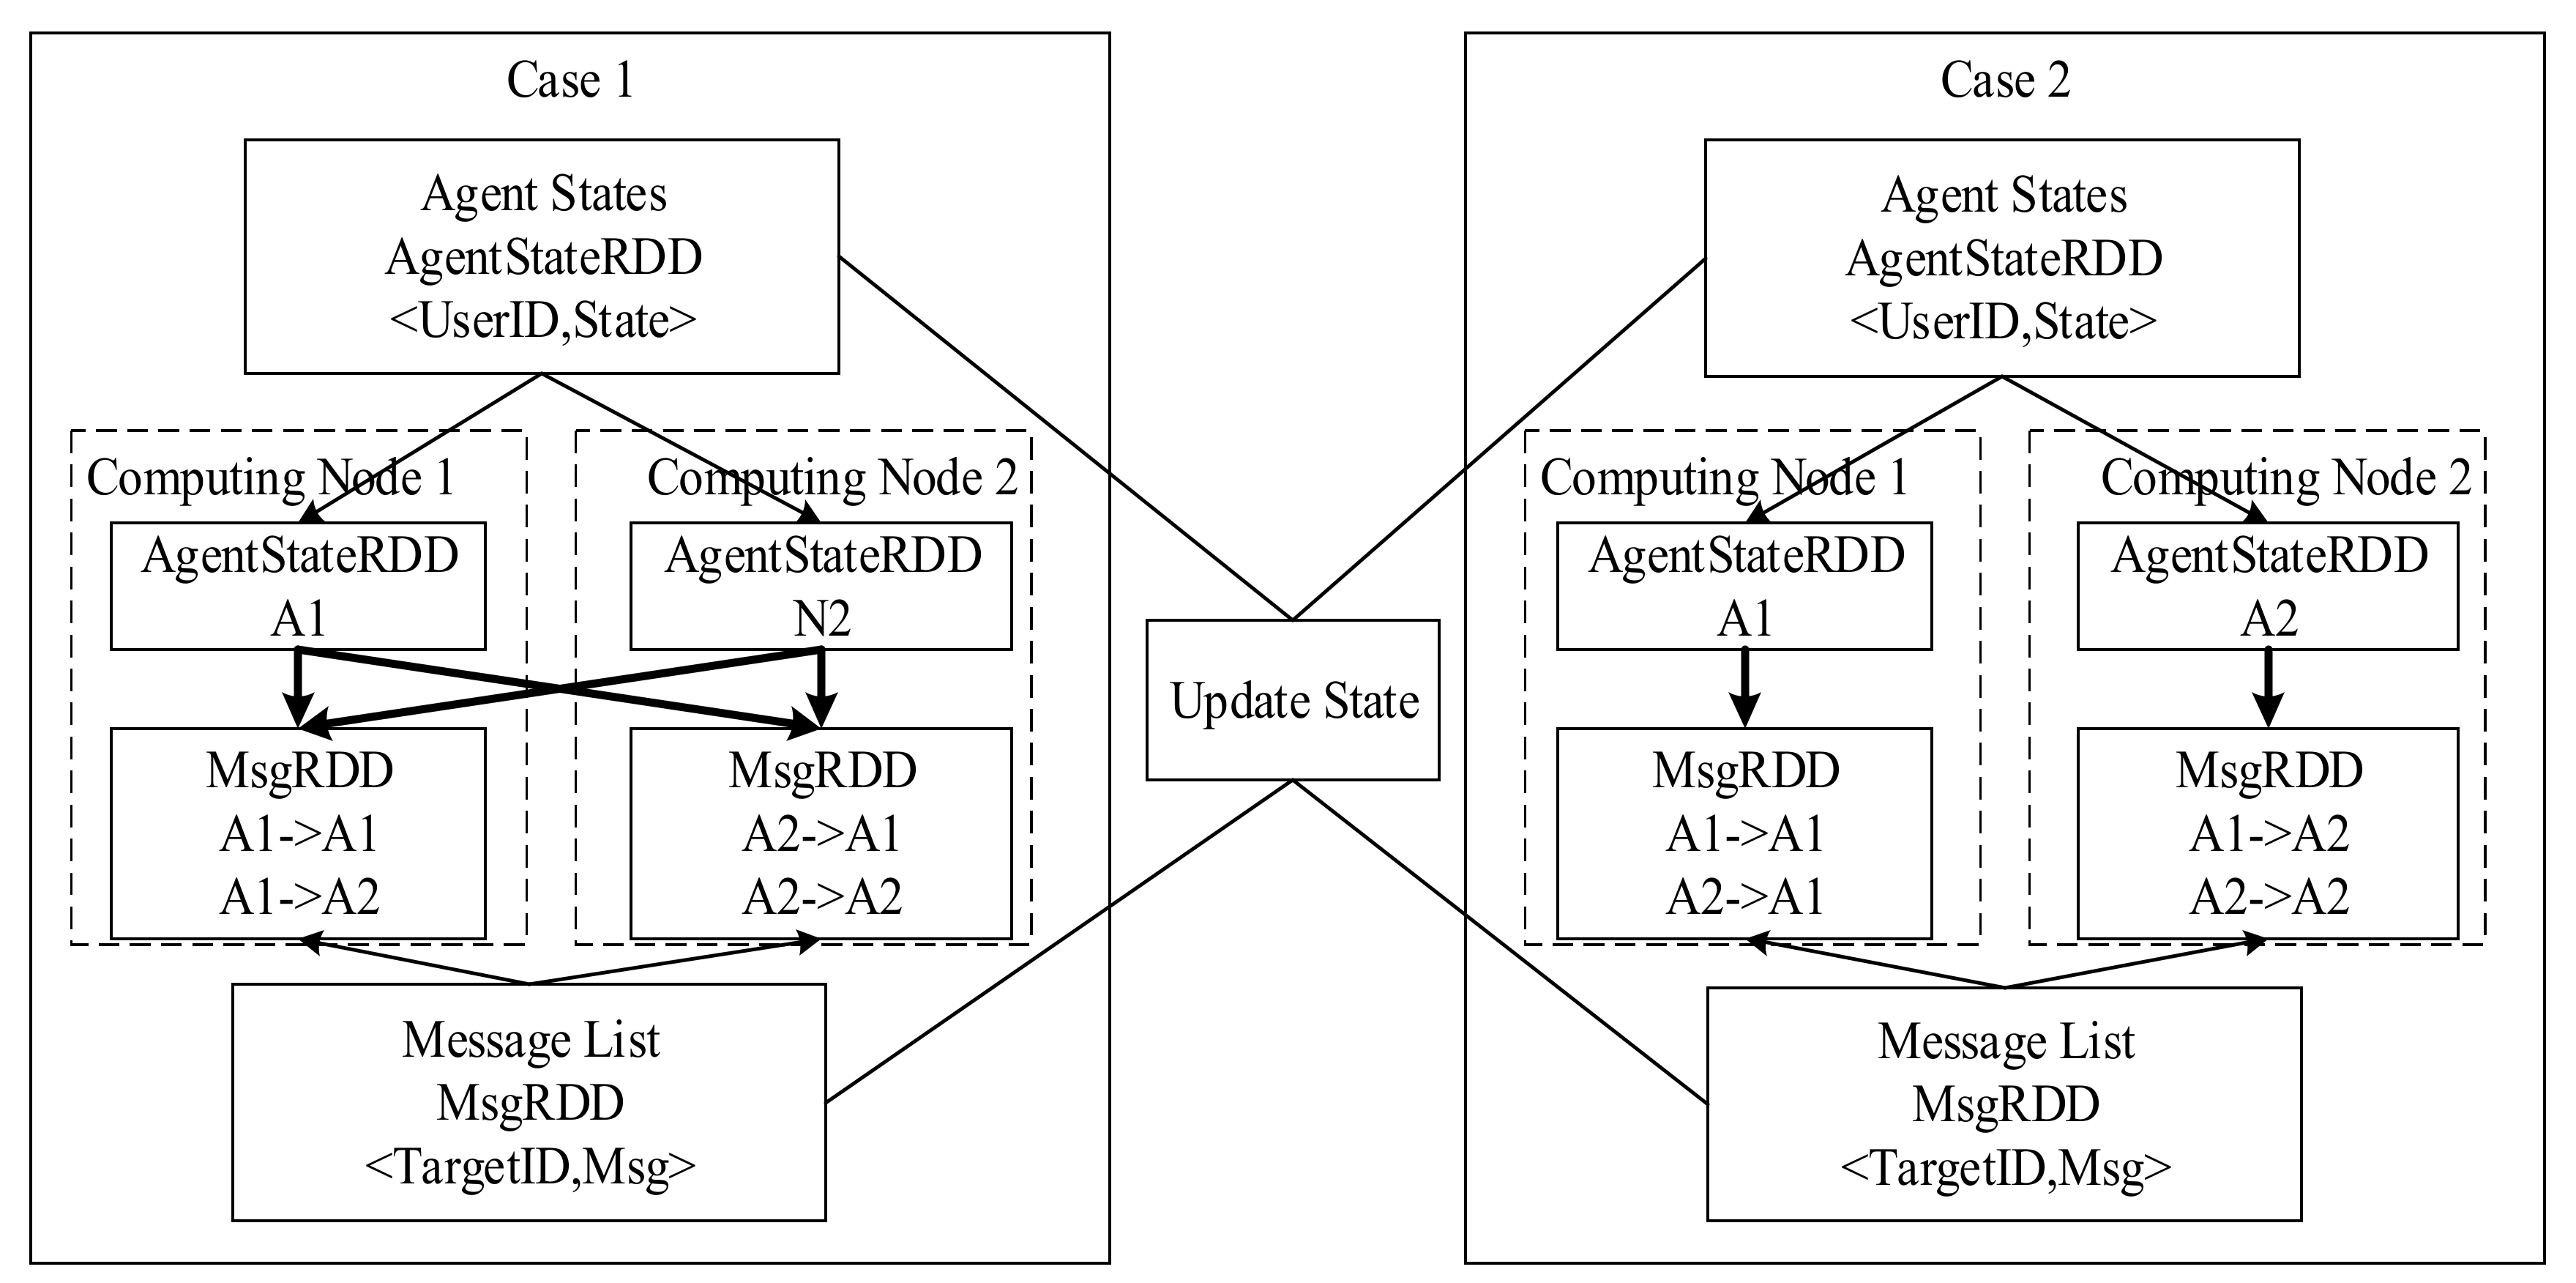
The Design of the Message Passing Mechanism

Within each simulation step, each infected agent sends a message to its neighboring agent with a certain rate according to the parameter settings. This message-passing mechanism is implemented by the two RDDs: AgentStateRDD and AgentLinkListRDD. In addition, MsgRDD is generated by these two RDDs.
First, the filter operator is used to find the infected agents from AgentStateRDD according to the node state, then the infected agent is obtained. Then, the usage of the broadcast solution is determined by the number of nodes in the infected agent mentioned in Section 3.3.1. If necessary, broadcast the InfectedAgentBroadcast to each computing node. Next, each computing node obtains the local InfectedAgentBroadcast list and processes the AgentLinkListRDD through the filter operator according to the list and filters out all possible message source agents and their neighboring agents. If the broadcast is not required, connect InfectedAgentRDD and AgentLinkListRDD to obtain the possible message source agents and their neighboring agents. Then, according to the model parameters initially set, select the target agents and then generate MsgRDD through the FlatMap operation in Spark. Finally, the join operator is used to connect MsgRDD with AgentStateRDD, which means that the agent has received the messages. Then, merge the current state of all agents with the received messages; the messages are processed and the states of the agents are updated accordingly.

The Design of the State Update Mechanism

It can be seen from Figure 4 that the state switching in the agent model is to update the next state based on the current state with the received messages. The join operator in Spark is used to connect MsgRDD with AgentStateRDD, which means that the agents receive messages. Because the entire RDD is processed at the same time in Spark, the updating of the agent state is not operated during the message-receiving stage. Then, the ReduceByKey operator is used to aggregate all the messages received by a single agent and process messages according to the different agent state stored in AgentStateRDD. Agents with state I and R drop the messages. Agents with state I determine whether it is necessary to update the node state to R themselves. Agents with state S process the messages (infection events) and set the latest state according to the model parameters. Finally, all agents return the latest updated state to RDD. During the state update stage of the model, Spark’s join operator is used to connect MsgRDD to AgentStateRDD for calculation. The join operator is a time-consuming operator because it involves matching the key values between different RDDs. The key values are matched one by one and then calculated. During the matching process, the partition of the RDDs also has a great impact on the calculation time.
When the connected agents are partitioned in the same computing node, the join operator is relatively simple, which means that the network communication and data passing are not necessary. When the connected agents are partitioned in different computing nodes, a large amount of communication is required. Data corresponding to the same key are should be transmitted together before calculation. According to the derived relationship of RDD, the parent RDD of MsgRDD is AgentLinkListRDD. Thus, the MsgRDD also follows the partitioning of AgentLinkListRDD—that is, the message data sent by the same computing node is processed in the same partition. MsgRDD is connected to AgentStateRDD in the message-passing mechanism. The partition of AgentStateRDD is determined by the agent number corresponding to the agent state. Obviously, MsgRDD and AgentStateRDD are not always partitioned together. Figure 5 uses two computing nodes as examples to illustrate the impact of whether MsgRDD and AgentStateRDD are partitioned together or not.
In the example shown in Figure 5, the cluster is composed of two computing nodes, which are represented by dashed boxes. The network involved in the calculation contains only two agents (A1, A2). The RDDs are allocated to the two computing nodes for calculation according to the different key values.
MsgRDD should be connected to AgentStateRDD in order to update AgentStateRDD. In these two cases, AgentStateRDD follows the partition of AgentLinkListRDD. Case 1 on the left indicates that MsgRDD follows the partition of AgentStateRDD according to the message sender. For example, MsgRDD (A1 > A2) is located in the same computing node with AgentStateRDD (A1). Case 2 on the right indicates that MsgRDD is re-partitioned according to the message receiver. For example, by being re-partitioned, MsgRDD(A1- > A2) is located in the same computing node as AgentStateRDD (A2). MsgRDD (A1- > A2) and AgentStateRDD (A2) can be combined together to update the AgentStateRDD of A2. In case 1, MsgRDD (A1- > A2) needs to combine with AgentStateRDD (A2) by communication, while this is not needed in case 2. Thus, when the states of the agents are updated, the data communications (indicated by bold arrows in the figure) for the two cases are quite different.
In case 1, since the message received by A1 is distributed to two computing nodes respectively, in addition to the local calculation, the message received by A1 on computing node 2 needs to be passed to computing node 1 to perform the calculation. Similarly, the message received by A2 on computing node 1 needs to be passed to computing node 2. When the number of agents and computing nodes are not large, the data communications are acceptable. However, when the size of the network reaches 1 billion and the number of computing nodes is hundreds, a large number of communications among different computing nodes in the cluster are needed and it becomes time-consuming. In case 2, because the state and the received messages of the same agent can be assigned to the same computing node, no other data passing is required at this step. Thus, compared to case 1, the performance of the simulation is improved. As a result, MsgRDD is re-partitioned before connecting MsgRDD and AgentStateRDD in the state update mechanism of agents in order to improve the performance of the simulation.
As mentioned before, the partition is a key factor in the performance of the large-scale social network simulation. The performance differs greatly in the different partitions. As a result, the two-tier optimization based on the network structure is described in detail in the next section.

4. Optimization

Compared with the large data analysis, the large number of interactions between agents will inevitably bring huge communication consumption between computing nodes in a large-scale social network simulation. Spark is a memory-based distributed computing framework, and the performance of Spark is closely related to the usage efficiency of the distributed clusters. The cost of network communication and the load balance of computing nodes are the two key points in the performance of the simulation. Minimizing communication consumption while ensuring load balance can greatly improve the performance.

4.1. Figures, Tables, and Schemes

According to the partitioning strategy, the simulation kernel designed in this paper improves the performance of simulation by distributing the social network to different computing nodes in the cluster. As mentioned before, almost all the calculation of the simulation kernel is composed of message passing and agent state updating in each simulation step. During the message passing, the interconnected network agents produce message transmissions. The message passing becomes the communication among computing nodes if the source agent and target agent are partitioned in different computing nodes. The scale of communication changes greatly in different partition strategies. An example of nine agents is used in Figure 6 to illustrate how communications are determined by the partition strategy. The social network in Figure 6 contains nine network agents, A0 to A8. The directional arrows between the nodes represent the connection relationship between the agents (friend relationship in the social network). The agents are partitioned in two RDDs, and Hash partitioning is used based on the agent number.
Assuming that all agents in the network can send messages to their next Aaent, Figure 7 gives the data flow diagram in the message passing.
According to the partitioning strategy, Partition0 processes agent A0, A2, A4, A6, and A8, and Partition2 processes Agent A1, A3, A5, and A7. Then, this process is divided into the map stage and the reduce stage. The map stage traverses the AgentLinkList to generate the <Key, Value> of the target and source agents. Then, the output of the map is sorted by key after shuffle and sent to the computing nodes of reduce. The reduce side also partitions according to the same partitioning strategy, combines the data transmitted by shuffle, and generates a list of messages received by each target agent in MsgRDD. The arrows in the shuffle stage in the figure represent the data-passing route. It can be seen that, according to the current partitioning strategy, in this case it will generate a maximum of 16 cross-partition communications during a simulation step. When the network scale increases greatly, the number of edges in the network may reach tens of billions. The communication consumption caused by an unreasonable partitioning strategy may make the simulation impossible. This is because the characteristics of the social network were not taken into account in the partitioning, and the closely connected agents were divided into different partitions.
If the partition strategy is modified and the closely connected network nodes are allocated to the same partition, the data flow diagram shown in Figure 8 is obtained. Compared with the Hash partition in Figure 7, it can be seen that the message passing during the simulation is concentrated inside the partition in the changed partition. Thus, in the social network simulation, as many messages as possible should be passed inside the same computing node. In a cluster or cloud environment, different computing nodes may be deployed in different physical locations and network environments. Therefore, the cost of communication across partitions is much higher than the cost of communication within a partition. Using the partitioning strategy of Figure 8 to concentrate communication within the partition will reduce the communication consumption greatly.
However, the actual social network structure is complex, and it is not easy to assign all the connected agents to the same partition. Therefore, the core goal of the partition algorithm is to allocate the closely related agents to the same partition, if possible. At the same time, load balance should also be considered for the reasonable calculation of partitions in the cluster. The partition based on network structure is detailed in the next section.

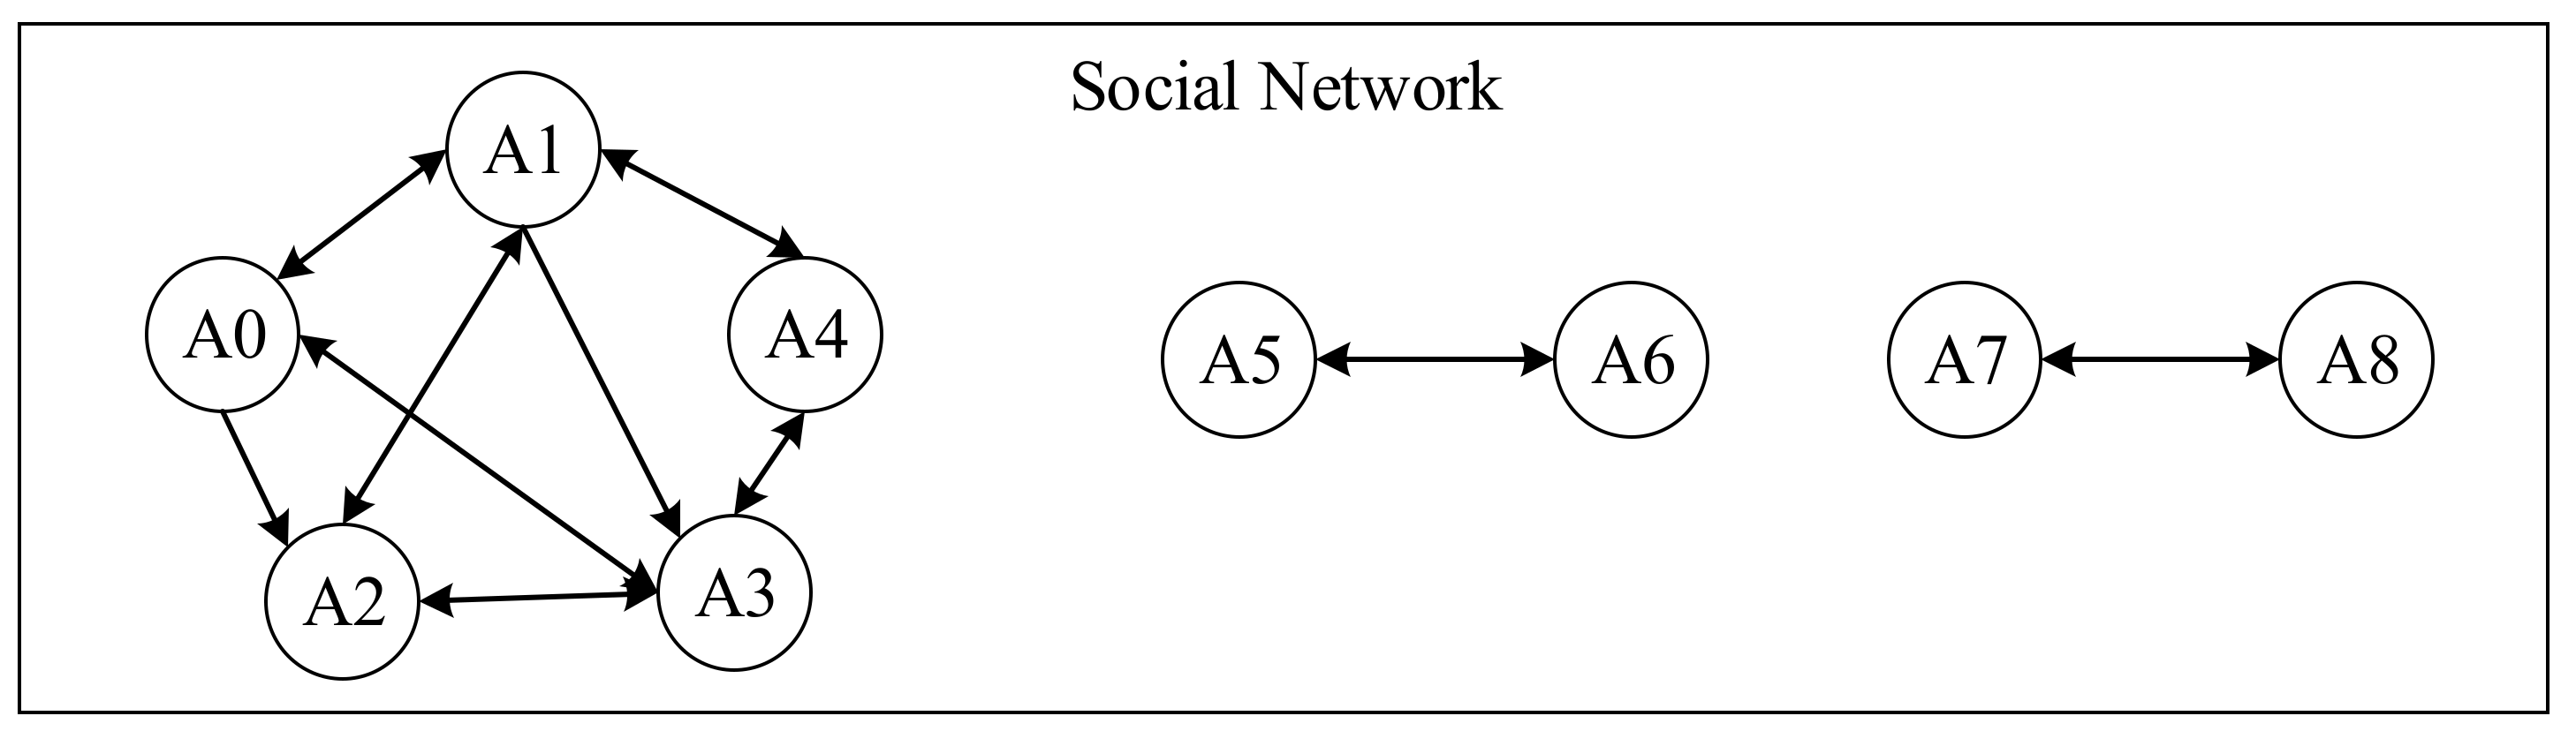
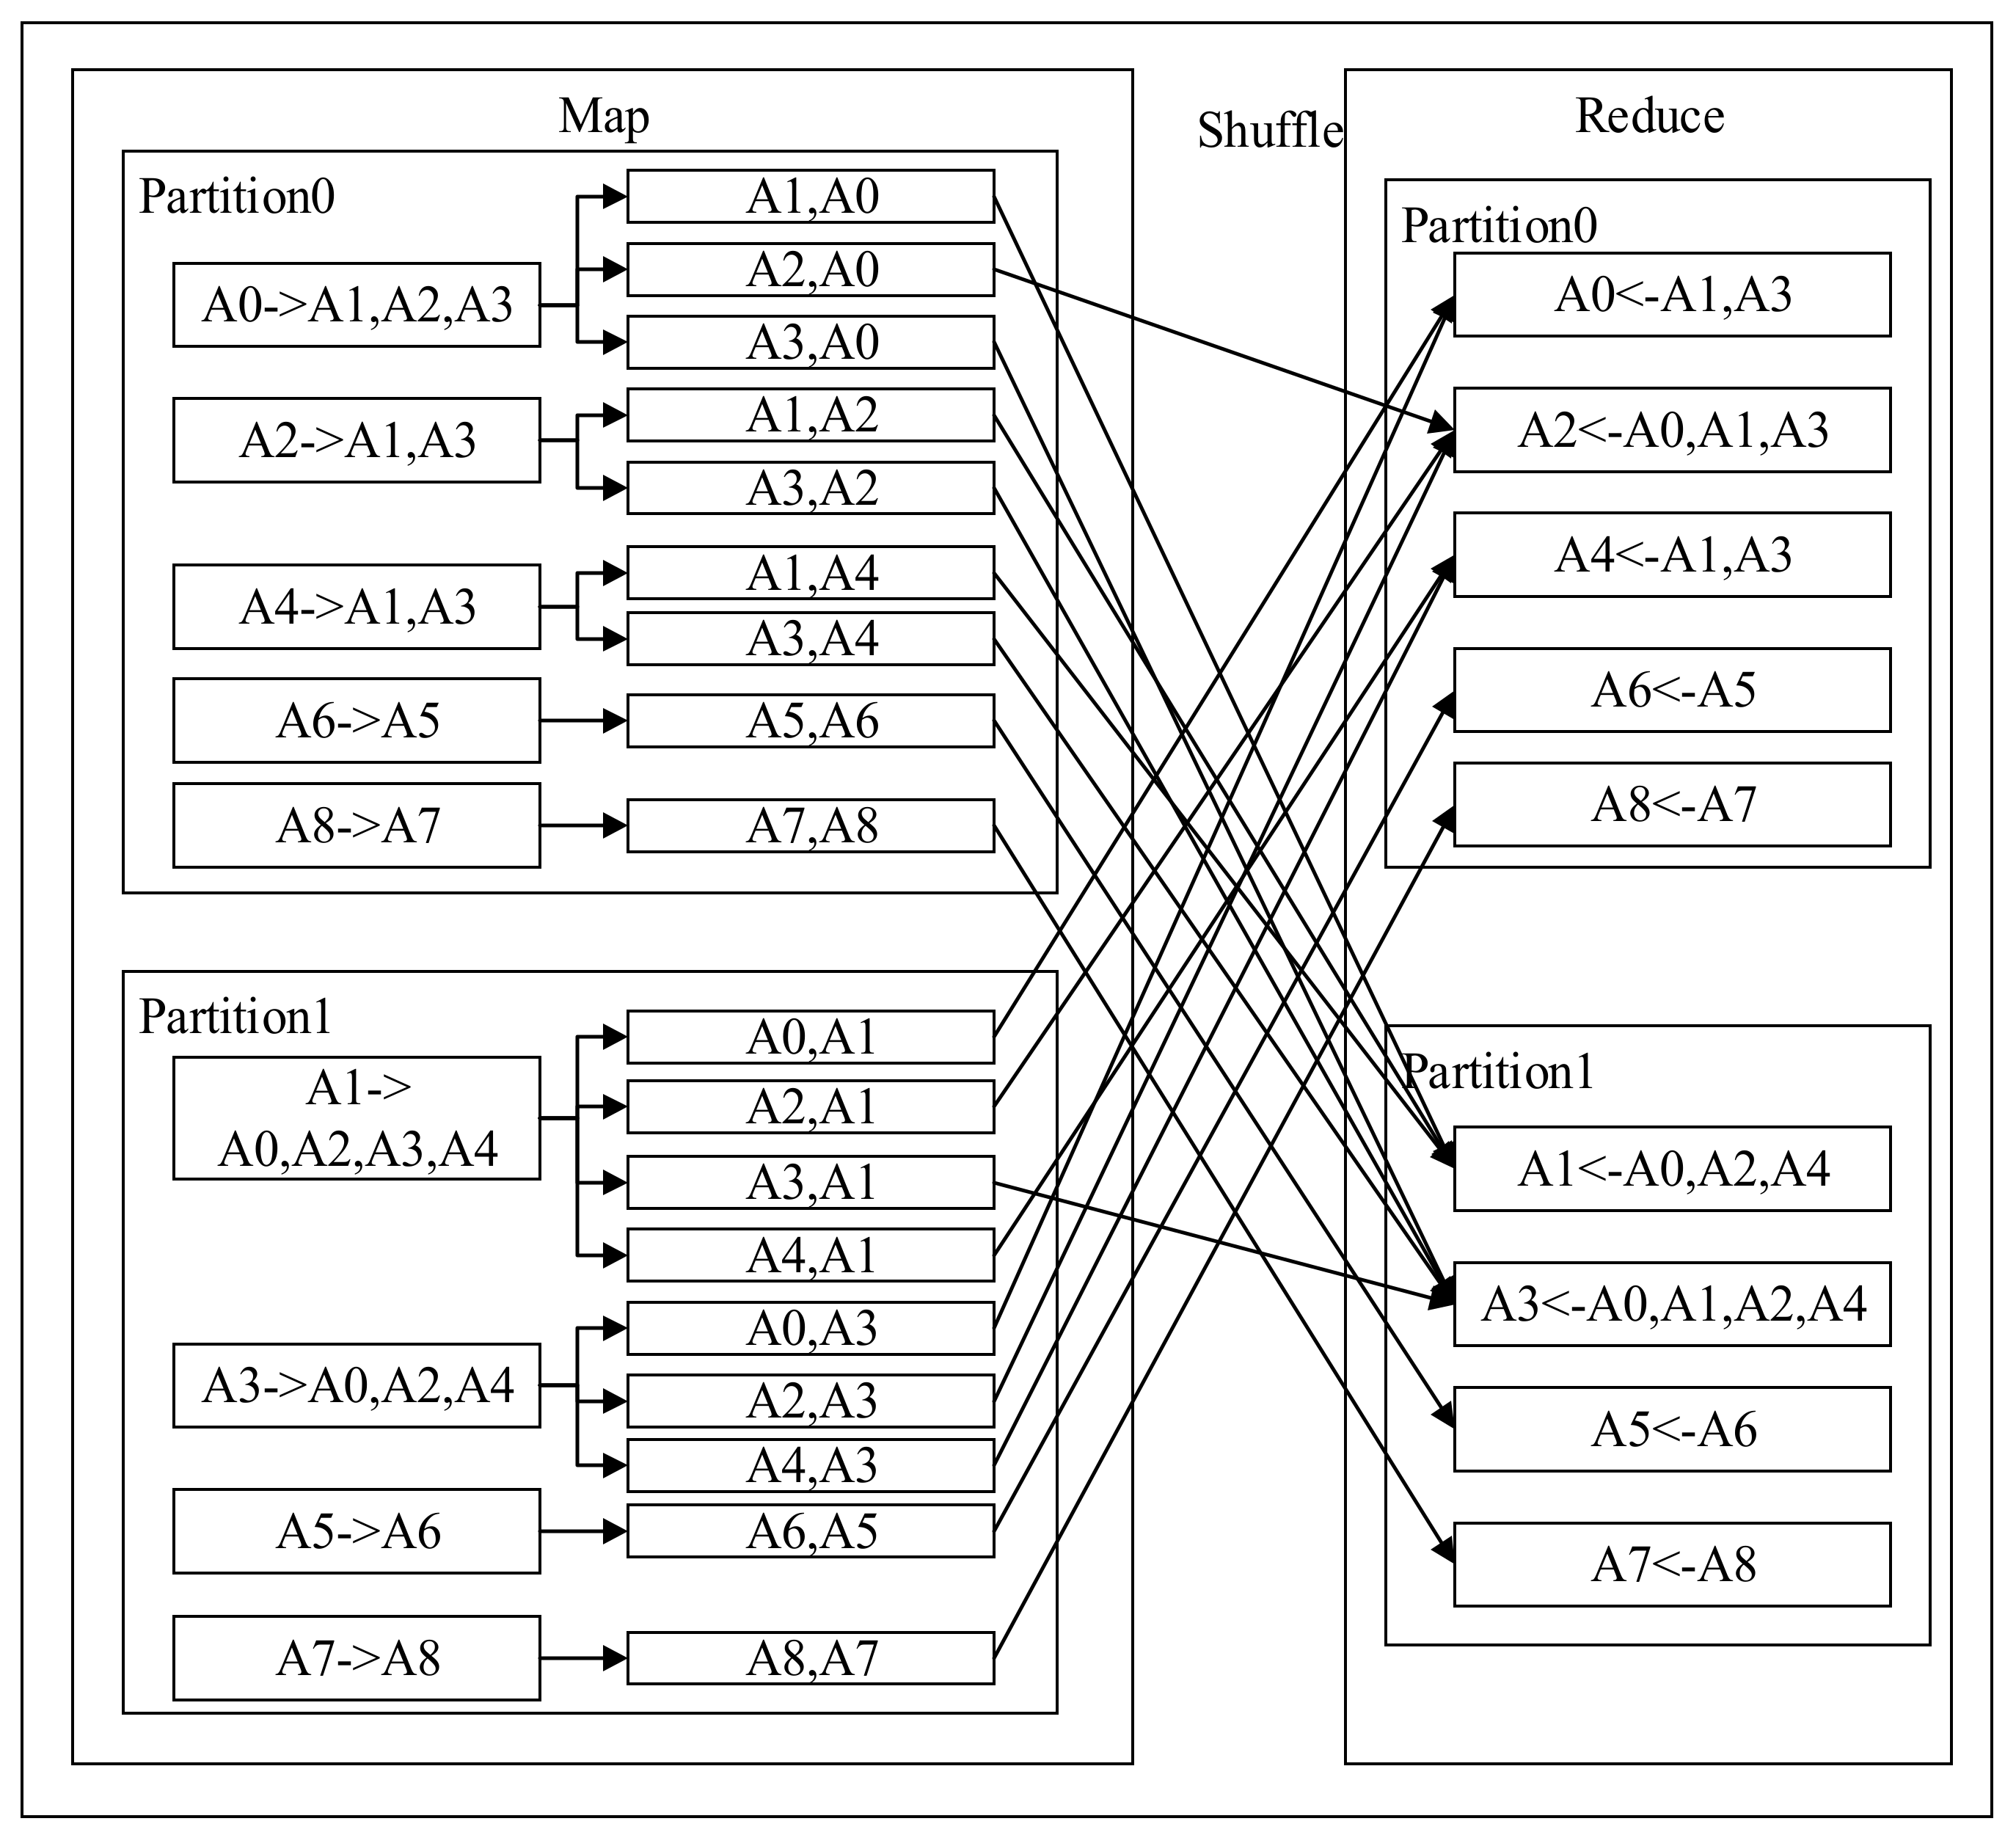
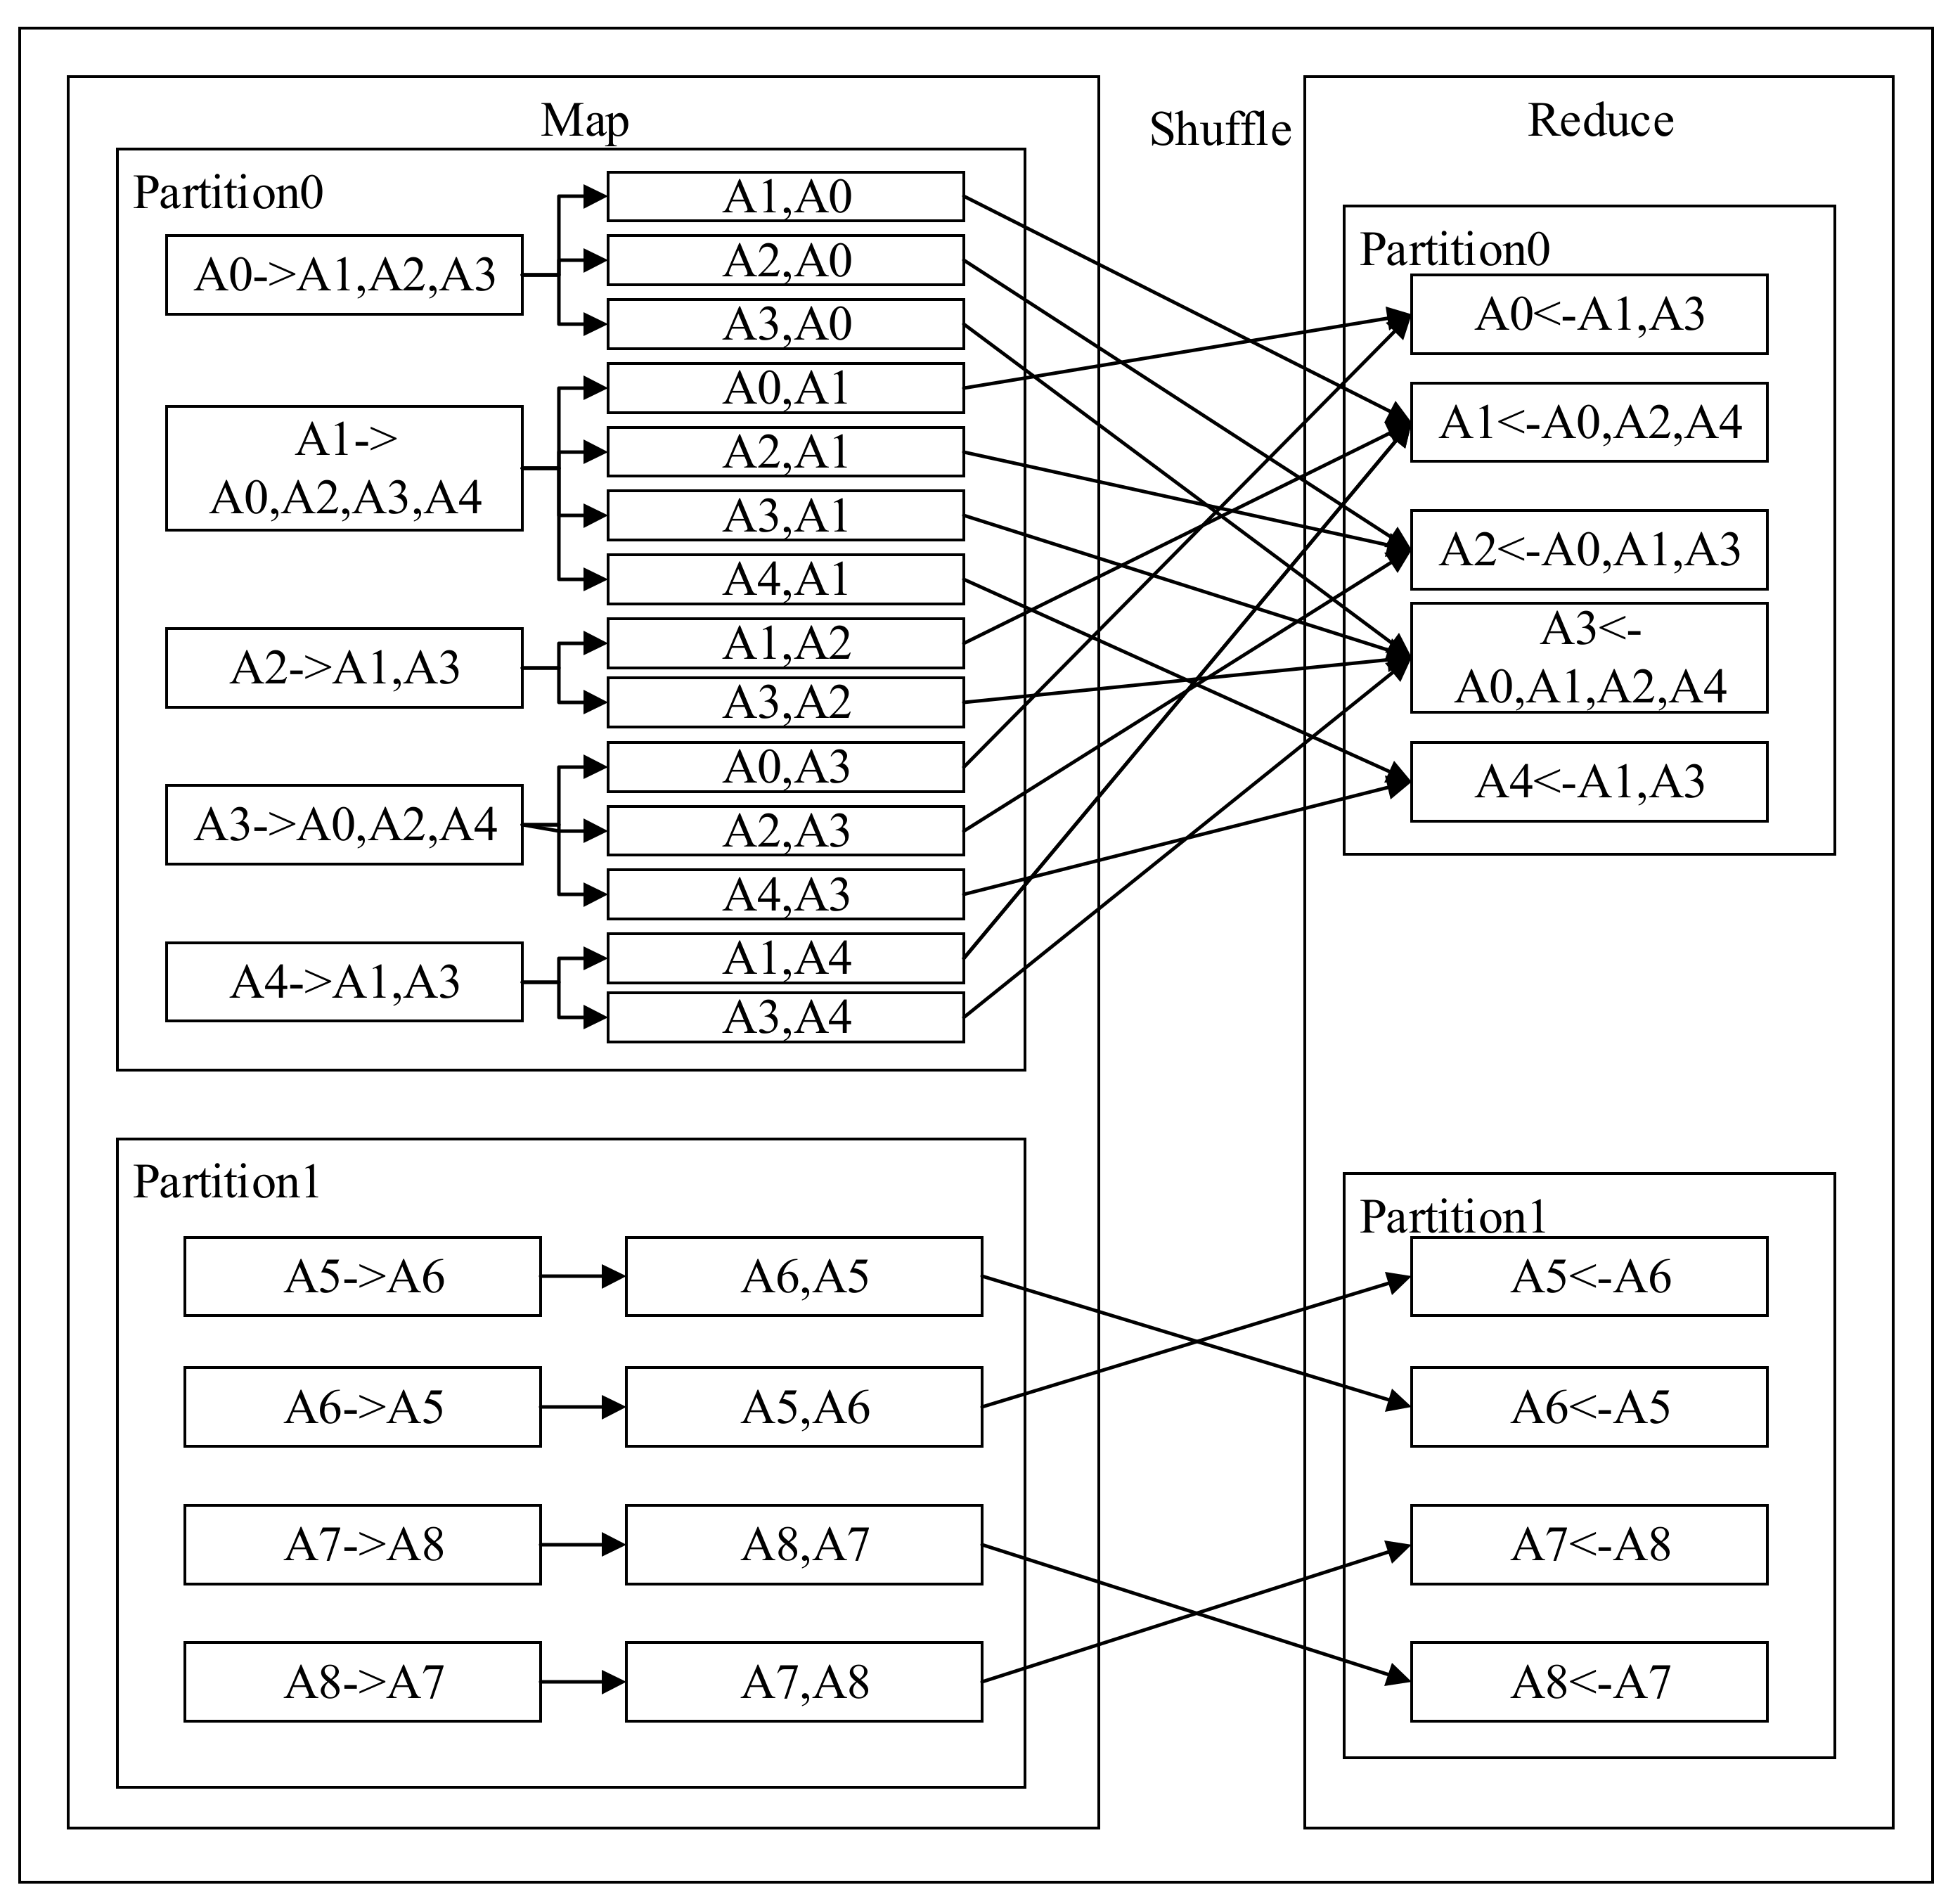
4.2. The Partition Based on Network Structure

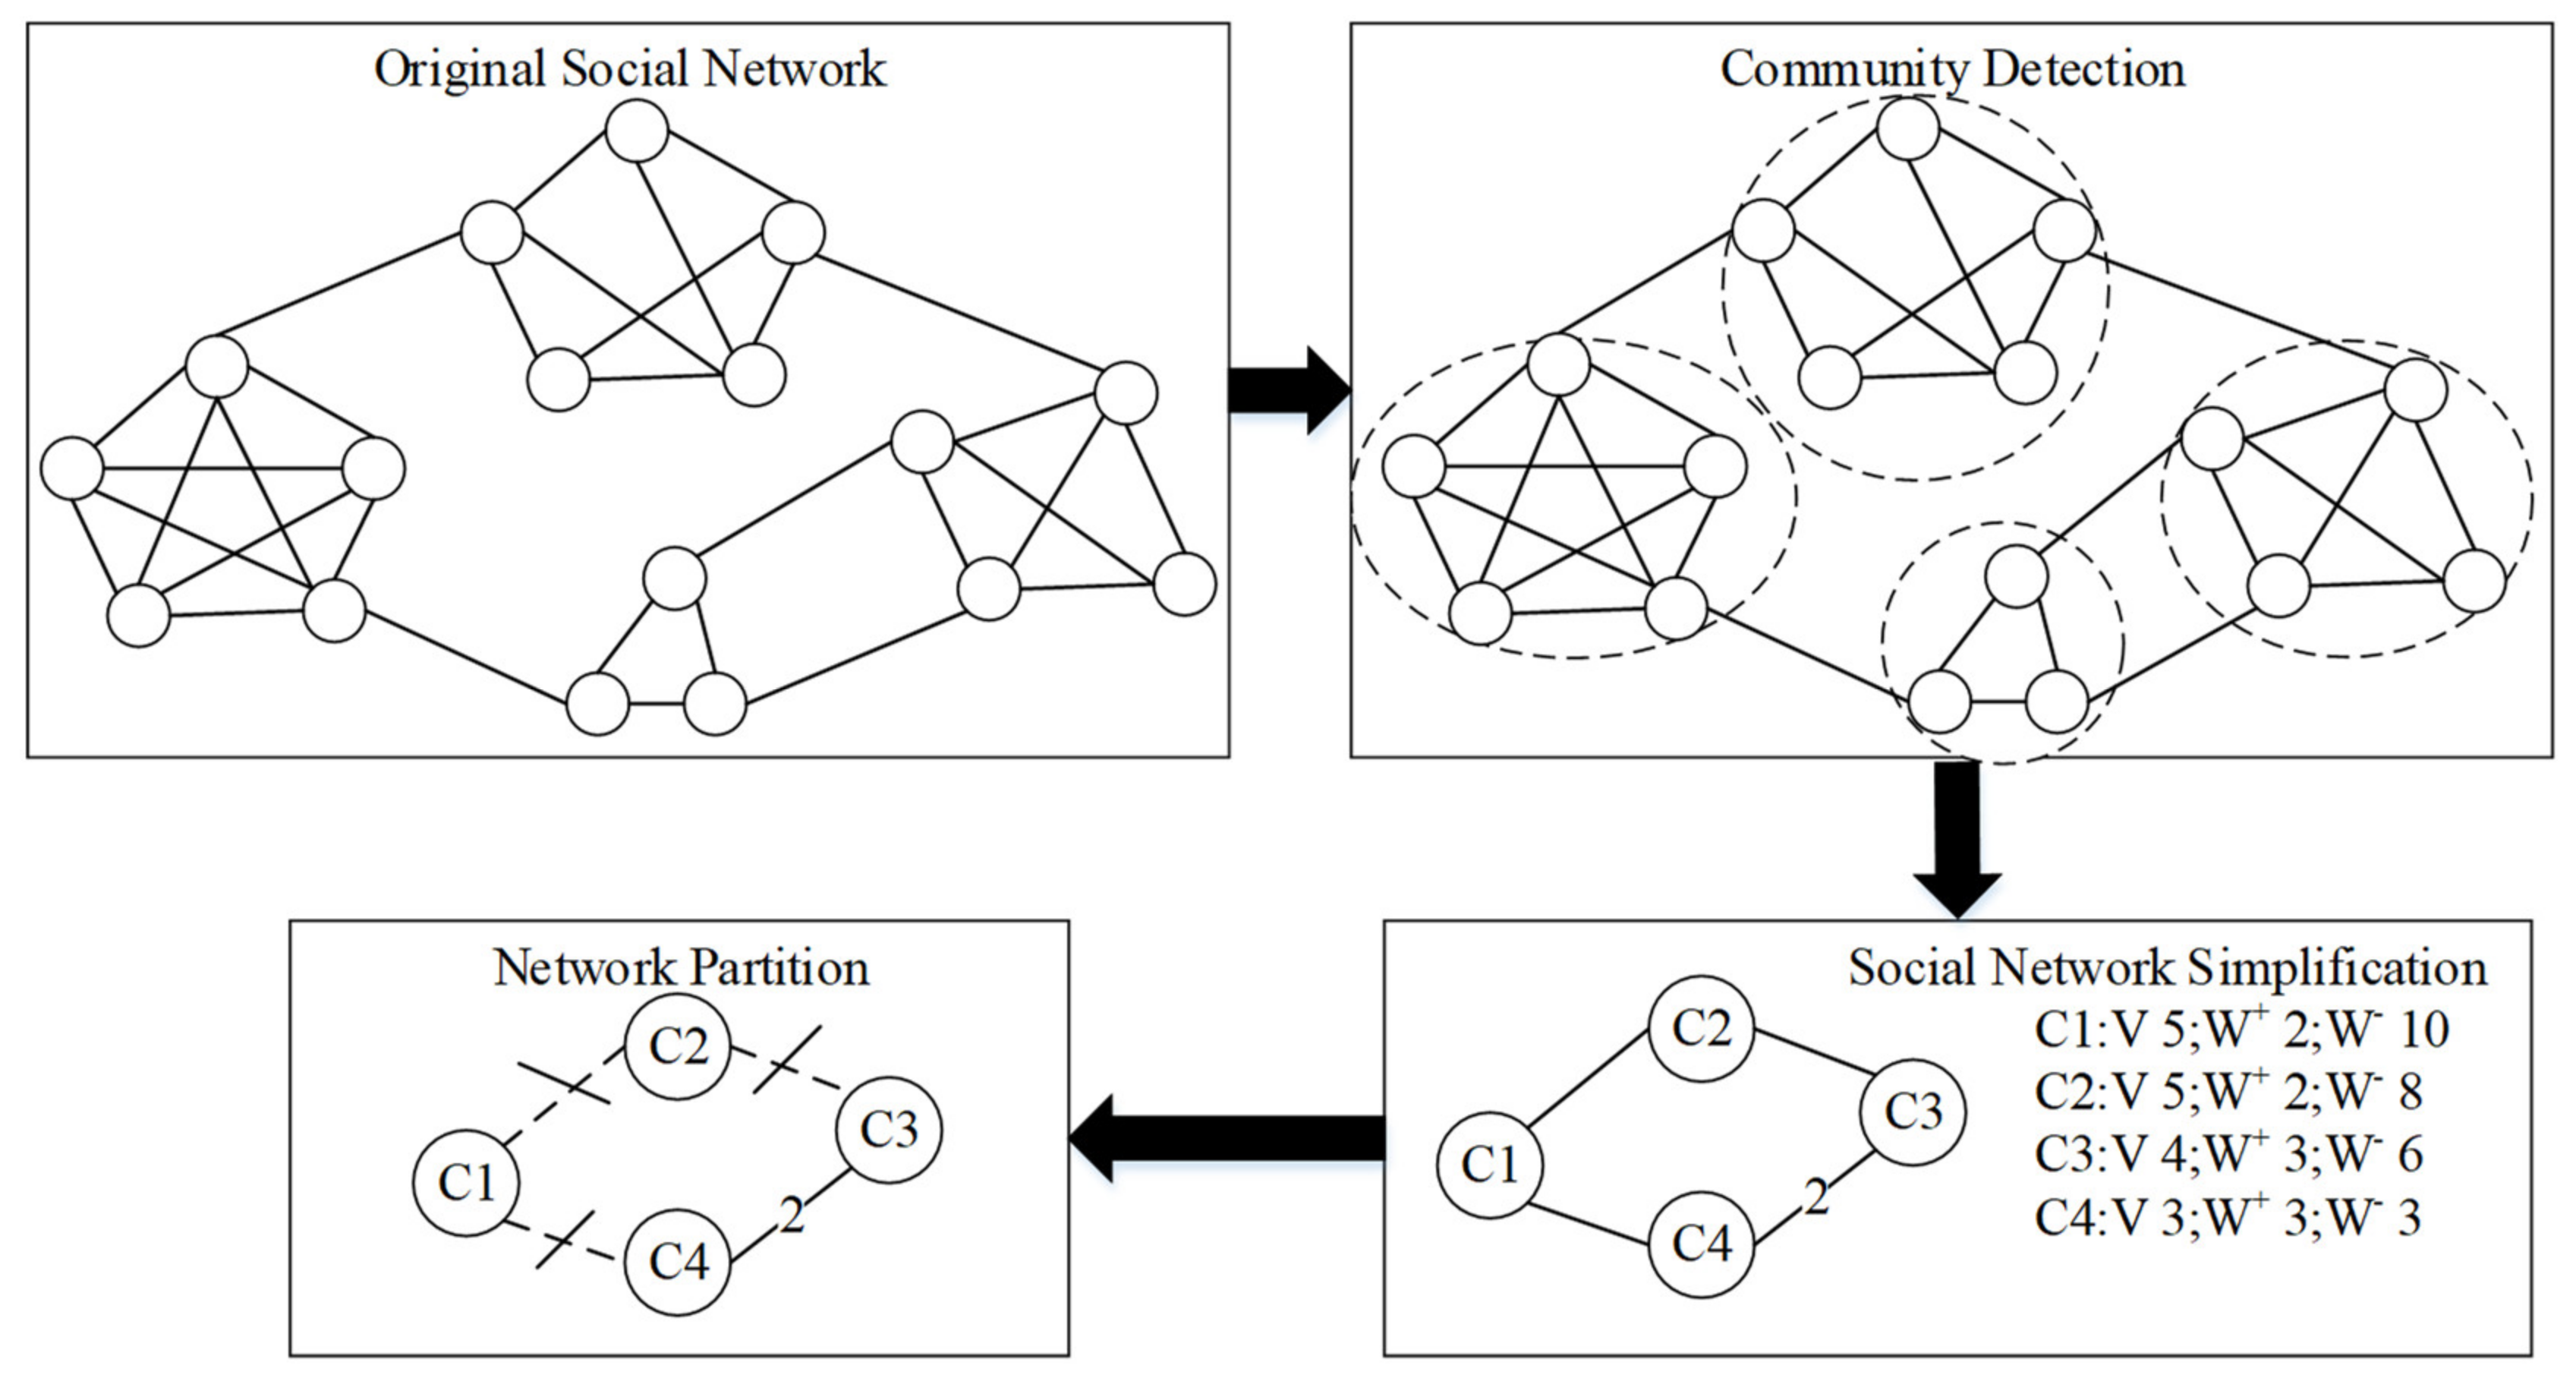
4.2.1. The Principle of the Two-Tier Partition

An agent in a social network is the smallest calculating unit in a large-scale social network simulation. The calculation includes checking the agent state, sending messages to neighboring agents, and updating the agent state. Assume that the network is divided into K partitions, P 1 , P 2 , P K . Each partition, P i , needs to manage N i agents v i 1 , v i 2 , v i j , , v i N i . Each agent v i j has w i j neighbors. The neighbors of an agent can be divided into the same partition as v i j and a different partition from v i j , and their sizes are represented by w i j - and w i j + , respectively.
For a large-scale social network simulation, the behavior of agents in the network is very simple. It can be considered that the computing load of each node when processing a message is the same, and the number of messages received by an agent is determined by the state and number of its neighboring agents. The state of the neighboring agents changes with simulation time, while the number of neighboring agents is always constant during the simulation. Statistically speaking, the number of messages received by a node is positively related to the number of its neighbors. Therefore, in each simulation step, the computational load L P i to be processed on a partition Pi is positively related to the sum of the neighboring agents of all agents in the partition. The communication between partitions is determined by the relationship and state of agents in different partitions. When an infected agent sends messages to its neighboring agents, a message communication between different partitions will be generated if the target agents are allocated in a different partition. Therefore, the total communication, C, between different partitions at a certain time is closely related to the current state of each agent in the partition and the state of its neighboring agents. C cannot be predicted in advance, but statistically, C is proportional to the number of connected edges across the different partitions. As a result, a partition algorithm for large-scale social networks is proposed in this paper to reduce the amount of communication, C, between partitions, based on ensuring the load, L P i , is balanced for all the partitions. In other words, under the constraint of load balance, an optimal network-cutting algorithm is found to minimize the network communication among computing nodes, and the network size of segmentation is N .
Consider the social network as a graph, the agents in the social network as the nodes in the graph, and the relationships between the nodes in the social network as the edges. The social network graph is divided into K sub-graphs of the same size; minimizing the number of the edges that are cut during the segmentation process is a typical application of the graph-cut algorithm [25]. However, the graph-cut problem is an NP(Non-deterministic Polynomial) problem. Although there have been many studies on graph cut, the current online social networks with a scale of over a billion is still a difficult problem. Partitioning directly based on the graph-cut algorithm is obviously time consuming, and cannot meet the requirements of performance improvement. At the same time, the goal of the graph-cut algorithm is to divide a given network into several parts of almost equal scale, while ignoring the structural characteristics of the graph and the similarity between nodes. It is not reasonable to directly use graph cut in the partition of the simulation of large-scale social networks.
Additionally, the community-detection algorithm is used to find nodes of similar structures in the network and then aggregate the nodes into communities. At the same time, in social networks the community shows the characteristics of close internal connection and sparse external connection [26,27]. Social networks can be divided into several independent sub-networks. The division of the network based on the community can not only preserve the characteristics of the network structure but also reduce communication in the network. However, the result of the divisions in the community cannot guarantee load balance among the various communities.
Taking the advantages and disadvantages of the graph-cut algorithm and community-detection algorithm into consideration, a two-tier partition algorithm is proposed in this paper. The principle of the partition algorithm is shown in Figure 9. Through community detection, the large-scale social network is simplified into a network composed of several communities, which reduces the scale of the network. In addition, it ensures a reduction in communication while maintaining the characteristics of the network structure. Then, the graph-cut algorithm is used to partition based on the simplified network to ensure load balance among the partitions. Since the input of the graph cut is the simplified network, the efficiency of the graph cut will be greatly improved. Finally, a partition case can be obtained that ensures load balance while preserving the network structure characteristics and reducing network communications to a certain extent. The community detection and graph cut are detailed next, then the implementation of the two-tier partition algorithm is also illustrated in the following subsections.

4.2.2. Community Detection

Community is one of the most important characteristics of a complex network. Communities can be regarded as equal and independent sub-parts of the network [28], which represent user organizations with close internal connections and sparse external connections in a social network. In the process of network simplification, communities can be used to represent nodes in the simplified network. The community-detection algorithm is used to segment a large-scale social network into several communities, which ensures that the result of the segmentation is tightly connected internally and sparsely externally connected. Therefore, a relatively smaller number of edges are cut during the network simplification.
The community detection algorithms can be divided into non-overlapping community-discovery algorithms and overlapping community-discovery algorithms, which are used to detect whether there are overlapping nodes in the community in the network. The purpose of our work is to distribute the nodes into different partitions; each node only exists in one computing partition. Thus, non-overlapping community-discovery algorithms are selected in our work. The research on non-overlapping community discovery includes an optimization algorithm based on modularity, a community-discovery algorithm based on spectral analysis, a community-discovery algorithm based on label propagation, and so on. Girvan and Newman et al. proposed the GN(Girvan Newman) algorithm [29]. In order to improve the GN algorithm, Newman proposed a fast algorithm which greatly reduced the time complexity of the GN algorithm [30]. Based on Newman’s fast algorithm, Clauset et al. proposed the CNM (Clauset–Newman–Moore) algorithm [31], which used a heap data structure to store and calculate the modularity of the updated network. The above algorithms are community-discovery algorithms based on modularity which have a high computational complexity and cannot solve the problem of different community sizes in large-scale social networks. A community-discovery algorithm based on spectral analysis [32] uses the Laplace transformation to represent the graph and then uses the eigenvector of its Laplacian matrix on clusters to get communities. This algorithm also has the problem of high computational complexity when dealing with large-scale social networks. The label-propagation algorithm updates the state of nodes in the network through the propagation of several tags in the network and divides the communities according to the final state value of the nodes [33]. This algorithm is suitable for community detection in large-scale complex networks, and the computational complexity is low.
In the label-propagation algorithm, each node in the network is given a label value during initialization, and the label values are propagated continuously in the network according to the network structure. In each iteration, the label value of the node is updated by the largest number of label value owned by its neighboring nodes. In the iteration process, the nodes that are closely related will finally converge into groups with the same label value. According to the label value of the nodes, the network can be divided into corresponding communities. In the initialization stage, the label-propagation algorithm needs O ( n ) time, where n is the number of nodes in the network. In the iterative process of label propagation, each step takes O ( m ) time, where m is the number of nodes connected to this node. Compared with other community detection algorithms, the time complexity of the Fast-Newman algorithm is O ( ( m + n ) n ) , while that of the CNM algorithm is O ( n log 2 n ) . The performance of the label-propagation algorithm is excellent in the community detection of large-scale networks.
In this paper, the label-propagation algorithm is selected as the community-detection algorithm in the simplified network. M communities are obtained, C 1 , C 2 , , C i , , C M , and each community C i contains N i nodes. Then, a simplified large-scale social network is constructed based on the M communities. The simplified network consists of M nodes, C 1 , C 2 , , C i , , C M . The size of the node W i is defined as the number of edges of all nodes within the community, and the edge between nodes e i j is defined as the connection between the node C i and node C j .
W i = j = 1 N i w j
e i j = ( v a , v b ) | v a , v b , v a C i , v b C j

4.2.3. Graph Cut

The graph-cut algorithm is a common method to deal with load balance. The algorithm cuts a graph into sub-graphs of the same size with the specified number and minimizes the number of edges removed in cutting. For load balance, the multi-path cut algorithm [34] proposed by Kernighan and Lin is a kind of graph-cut algorithm. In the multi-path cut algorithm, a graph G with n nodes is defined; the size of each node in the graph is represented by w i . For the given parameter K , the graph G is cut into K parts of the same size. The size of each part is the sum of the sizes of the nodes contained in the part. Based on the large-scale social network simplified by community detection, the goal of this paper is to cut the network into K partitions with the same load, ensuring that the communications among the partitions are as small as possible.
In the classical multi-path cut algorithm, a node with the size of p is regarded as a community composed of p nodes with size 1, and edges with high weight are added to this community to ensure that the community will not be split in the cutting. However, it cannot guarantee that the communities are not cut in the case of communities with many kinds of sizes in this paper. At the same time, the classical multi-path cut algorithm needs to iterate many times to find the global optimal solution when K 3 and the time complexity of the algorithm is far greater than O ( N 2 log 2 N ) . Considering the above problems, Cheol H. Lee et al. proposed an efficient multi-path cut algorithm. In this algorithm, the problems are transformed into the problem of seeking the maximum K times cutting of the graph. Then, the generic algorithm is used to solve the problem. The complexity of the improved algorithm is O ( k V 2 ) , where V is the number of nodes in the subpart of the graph.
In the two-tier partition algorithm proposed in this paper, the multi-path cut algorithm is used to cut the simplified network graph composed of communities. The simplified network G contains M nodes, C 1 , C 2 , , C i , , C M . Each node represents a community, and the community contains n i nodes, v i 1 , v i 2 , , v i j , , v i n i . The size of the nodes corresponds to the load of the nodes, L C i . The simplified network is divided into K partitions, P 1 , P 2 , P K . Each partition P i contains S i communities, and the corresponding partition load, L P i , is the sum of all the community loads in the partition.
L C i i = 1 n i w i j
L P i = j = 1 s i L C i j
According to Equations (3)–(5) can be obtained—that is, the load on each partition is directly proportional to the number of neighboring nodes of all the nodes in the communities distributed in the partition. L C i is defined as the size of the node in the simplified network, and the goal of the multi-path cut algorithm of the simplified network is to ensure that L P i is the same for each partition.
The edge in the simplified network is defined as e i j , and the simplified network is cut into K partitions with a similar load by cutting edges with the least cost. E i and E i + are used to represent the inner edges of partition, P i , and the edges out of the P i . The corresponding communication consumption C after cutting is as shown in Equation (8):
E i = e a b | C a P i , C b P i
E i + = e a b | C a P i , C b P i
C = β · i = 1 K E i + .
As mentioned before, the graph cut is transformed into the finding of an optimal network partition algorithm under the constraint of load balance (Equation (10)) so as to minimize the communications between computing nodes (Equation (9)). The problem of cutting an original N agents social network is transformed into the problem of cutting a simplified M nodes network, and M < < N .
min N C = β · i = 1 K E i +
s . t . i 1 K , L P i B max : = ( 1 + ε ) i = 1 K L P i K
As a result, the two-tier partition algorithm of the large-scale social network is divided into two stages. The first stage is the community detection based on the label-propagation algorithm, and the second stage is the graph cut of the simplified network. Finally, the partition results are obtained. The details of the implementation of the two-tier partition algorithm are illustrated in the next section.

4.2.4. The Flow of Two-Tier Partition

The flow of the algorithm consists of three steps: community detection, network simplification, and network cutting. The pseudocode is shown in Table 2.
First, communities are obtained by the label-propagation algorithm. Second, the load on each community and the connections between the communities are calculated, and a simplified network is obtained. Third, the multi-path cut algorithm is used to cut the simplified network, then the partitions of the social network are output.
The time complexity of the label propagation algorithm is O ( m + n ) , where m is the number of edges and n is the number of agents. The time complexity of the simplification is O ( m M ) . The time complexity of the cutting is O ( K M 2 ) , where M < < n . Compared with the time complexity of direct graph cut O ( K n 2 ) , the calculation of the two-tier partition algorithm is reduced greatly.

5. Experiments

In this section, two groups of experiments are designed to testify the improvement of the optimization of the simulation kernel based on the two-tier partition algorithm.

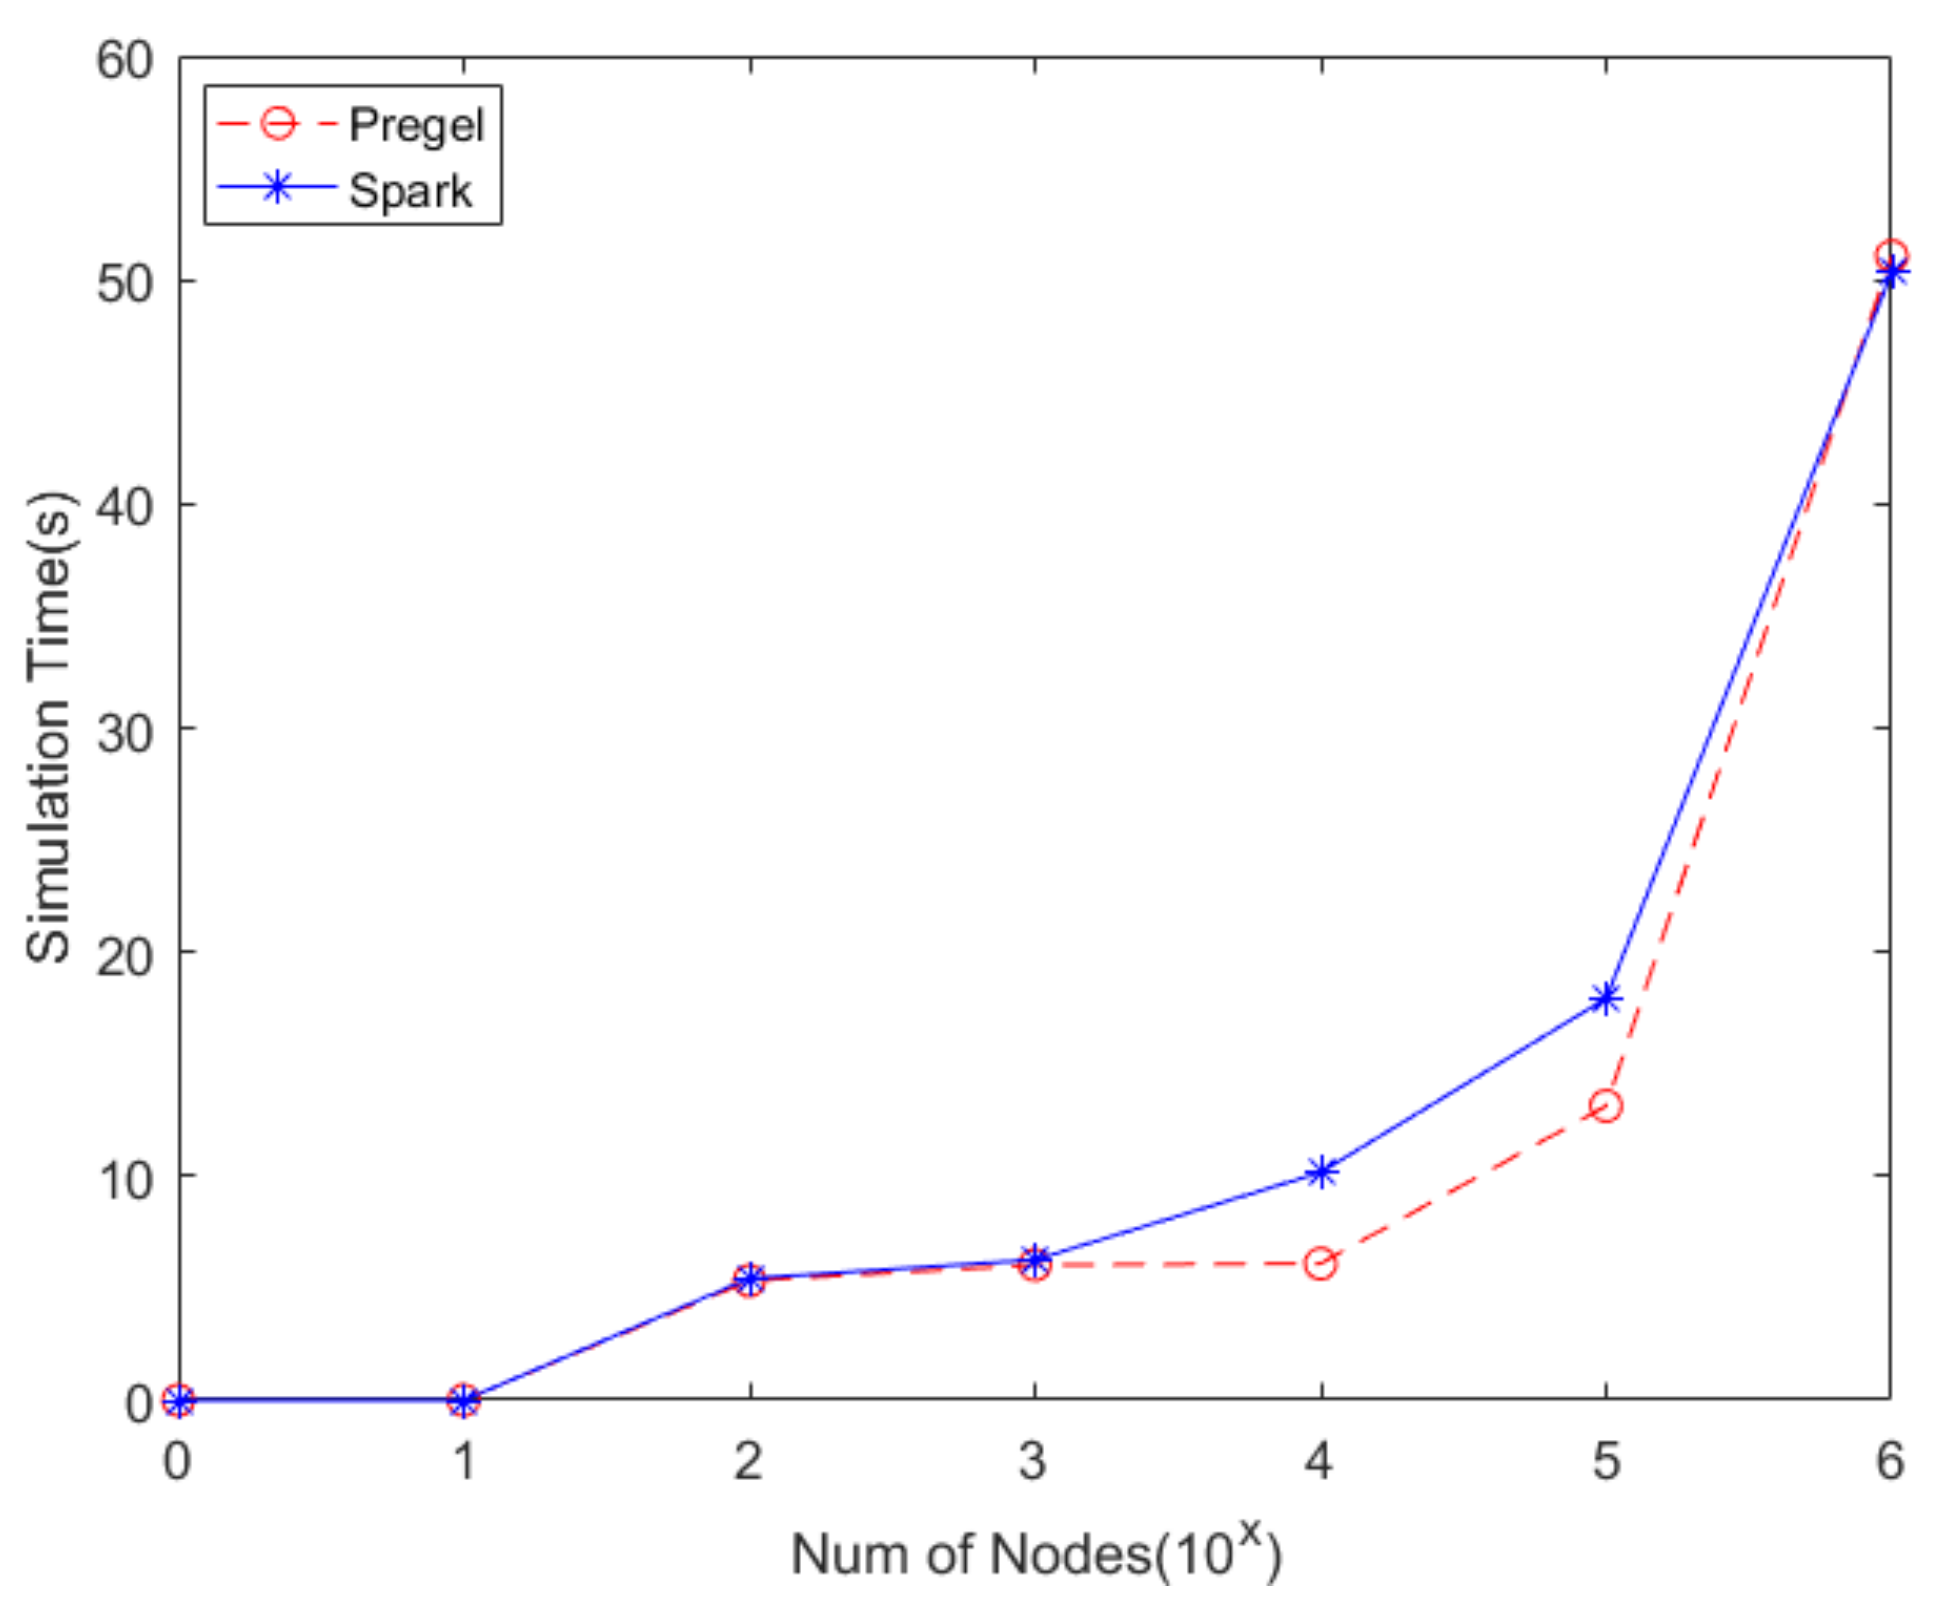
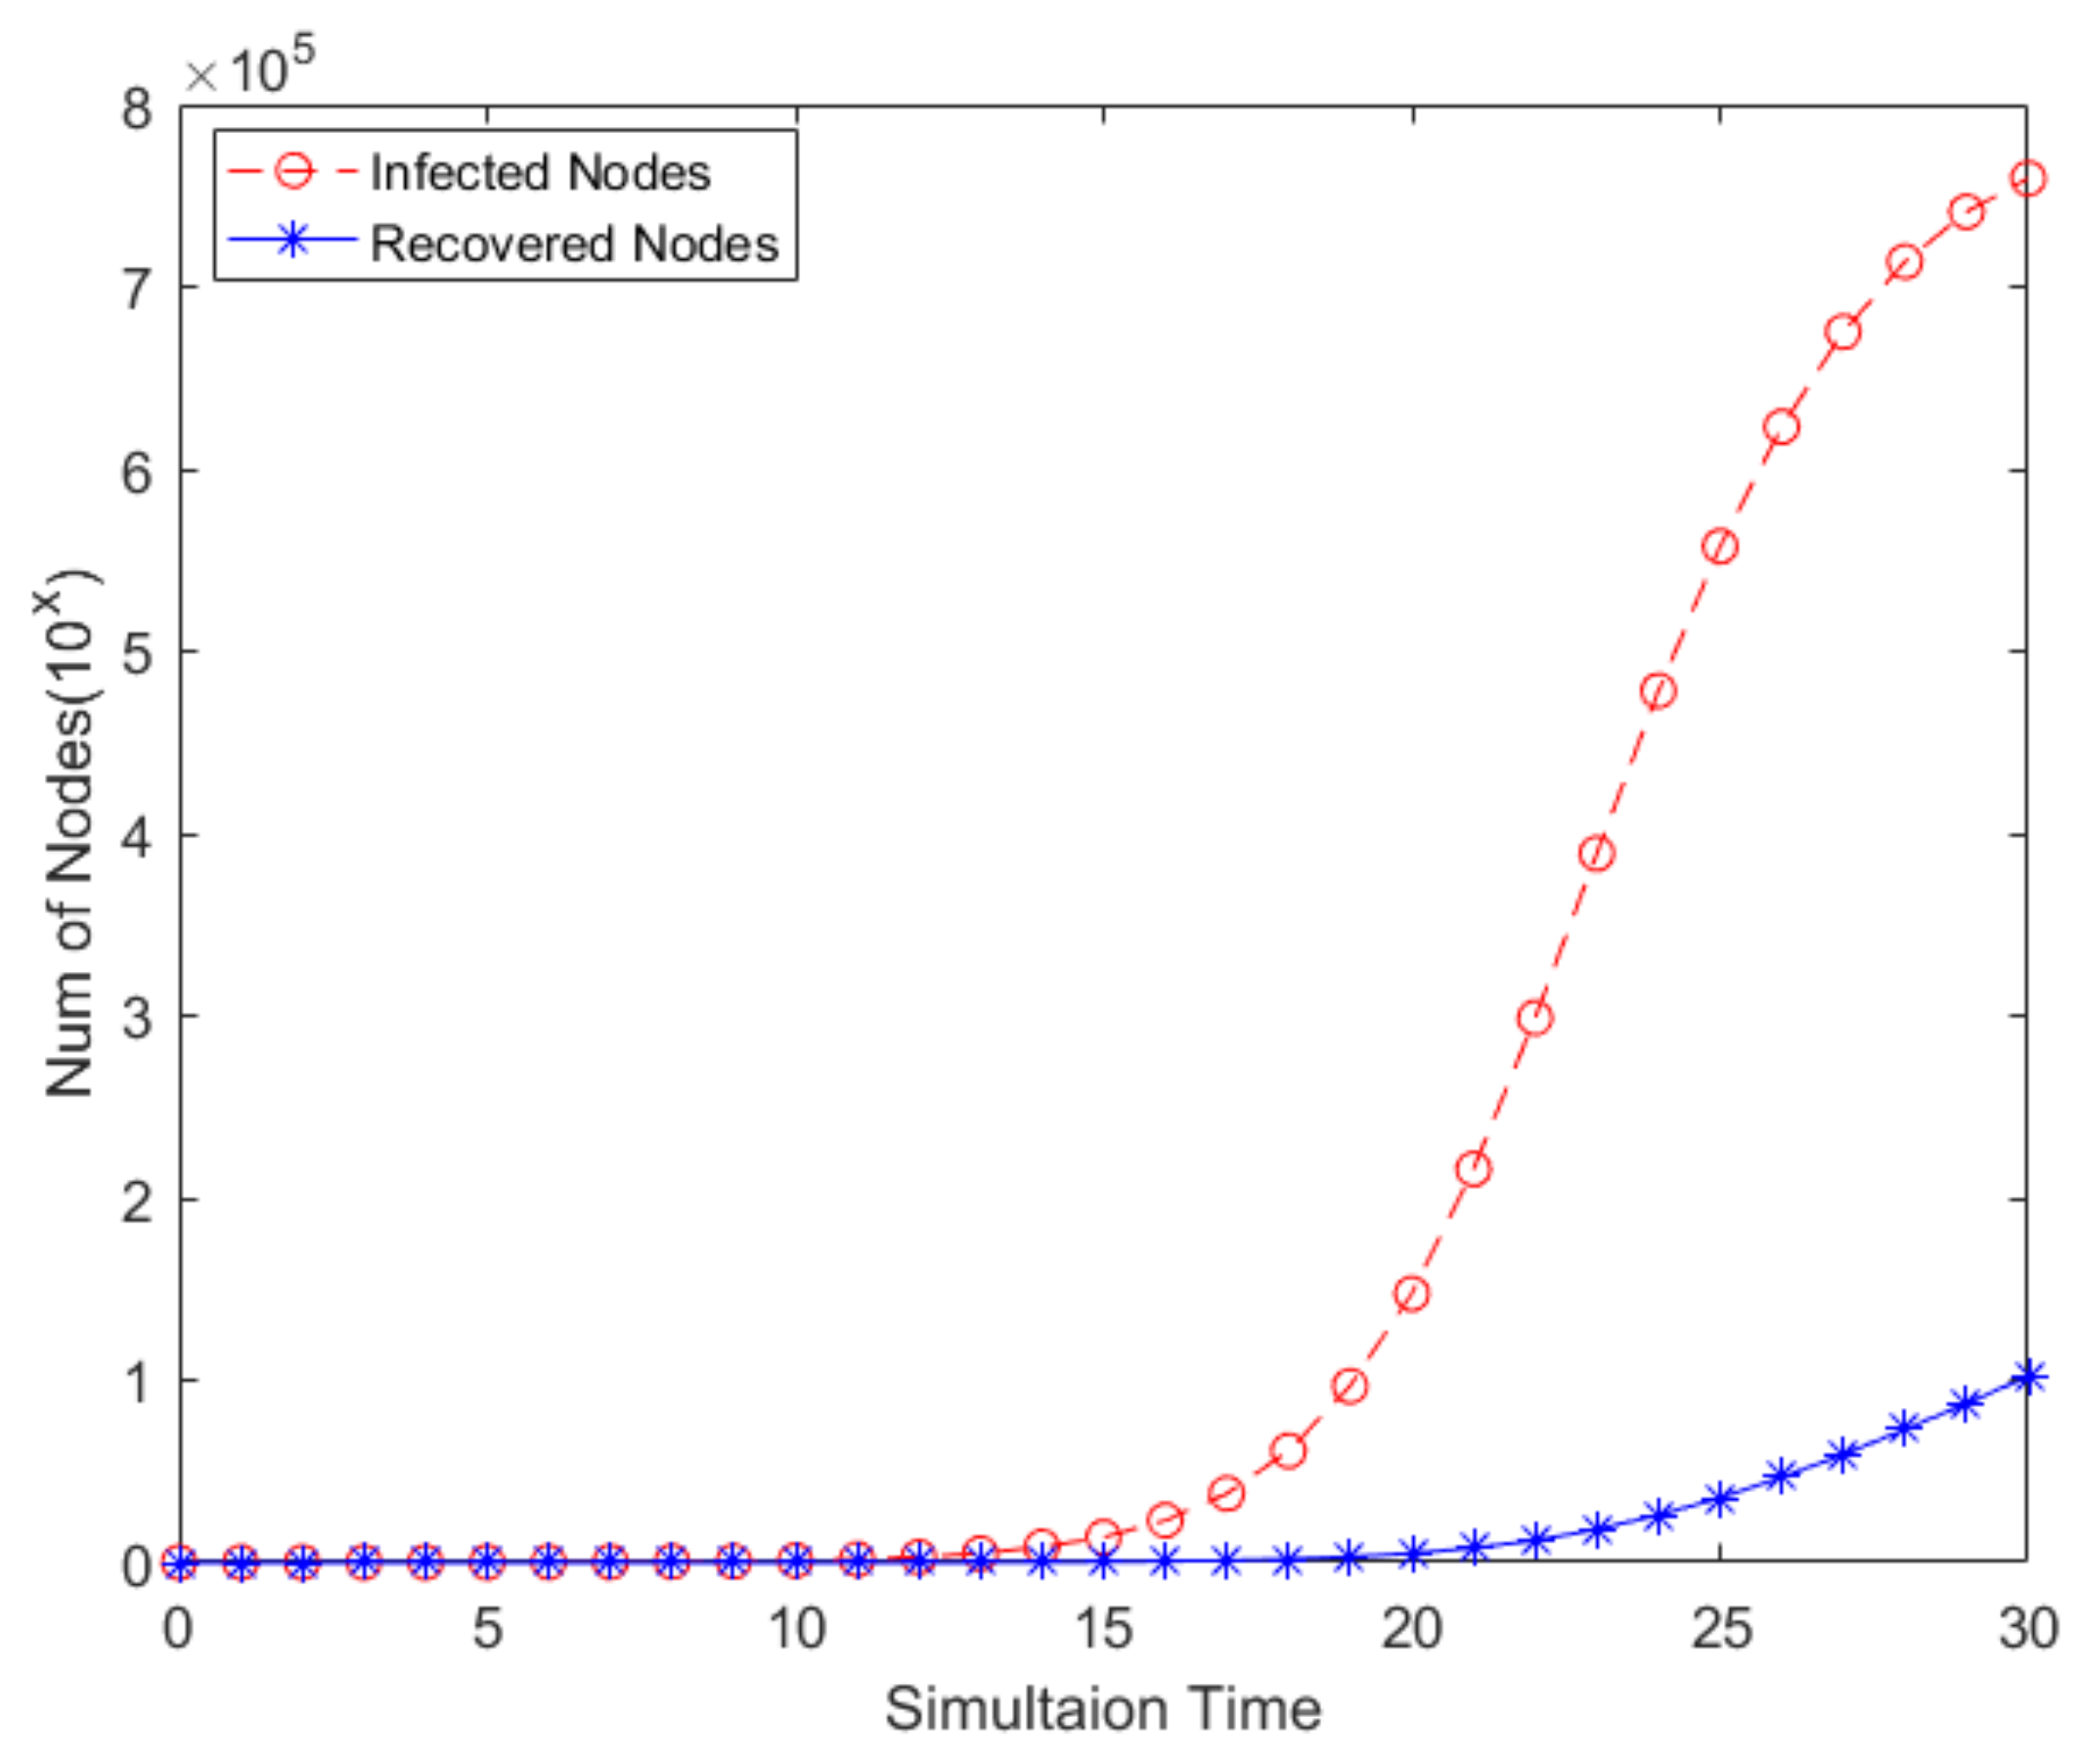
5.1. Experiments of Performance in Different Scales

In order to analyze the performance of the simulation kernel, a network following the power-law distribution is generated to test the proposed algorithm. The size of the network increases from 1000 to 1,000,000, and the minimum degree of the node is 100, while the minimum degree of the 100-node network is 99. The size of the nodes and the number of edges in the networks are listed in Table 3. The experiments are executed in a workstation with a CPU of Intel Xeon 24 core processor; the frequency of each core is 2.60 G and the size of the memory is 128 G.
Due to the limited network scale that traditional simulation tools and platforms can support, the large-scale social network information diffusion simulation framework based on Pregel designed by Chuan Ai et al. [18] is selected for the comparison with the simulation kernel implemented in this paper. As described before, the SIR model is used as an example in the experiments. The initial infection number is set as 10, the infection probability is set as 0.05, and the recovery probability is set as 0.02. The experiments under two simulation frameworks are executed 50 times and the mean values are shown in Figure 10.
As can be seen from Figure 10, there are almost no differences in performance between the two simulation frameworks. However, because of the tight encapsulation of Pregel, the simulation framework based on Pregel cannot perform statistical analysis of the temporary data generated by each simulation step in the simulation process. Actually, in order to analyze the mechanism of the diffusion process, the changes of all agents and edges should be recorded. Although the time consumption for the recording of temporary data is counted, the simulation kernel based on Spark designed in this paper still achieves the same level of computing performance as Pregel. In each simulation step, the infections of agents are recorded and output along with the simulation.
The simulation time recorded in the experiment includes the statistics of the time of the number of infected and recovered agents in each step. Figure 11 shows a sample of the statistical results of the number of infected and recovered agents in the experiments. In the case of similar performance, the simulation kernel proposed in this paper is flexible in programming and the real-time data statistics are supported, so time is saved in the results analysis.
In the large-scale social network simulation application, the real-time statistics of the data in the simulation process is of great significance. For example, when the information diffusion simulation in the large-scale social network is used to support decisions about rumor management, different rumor management strategies could be simulated in a short time. Through the real-time data statistics, the effect of rumor management policies can be observed clearly during the simulation. The most optimal policy can be selected for decision-making as soon as possible.

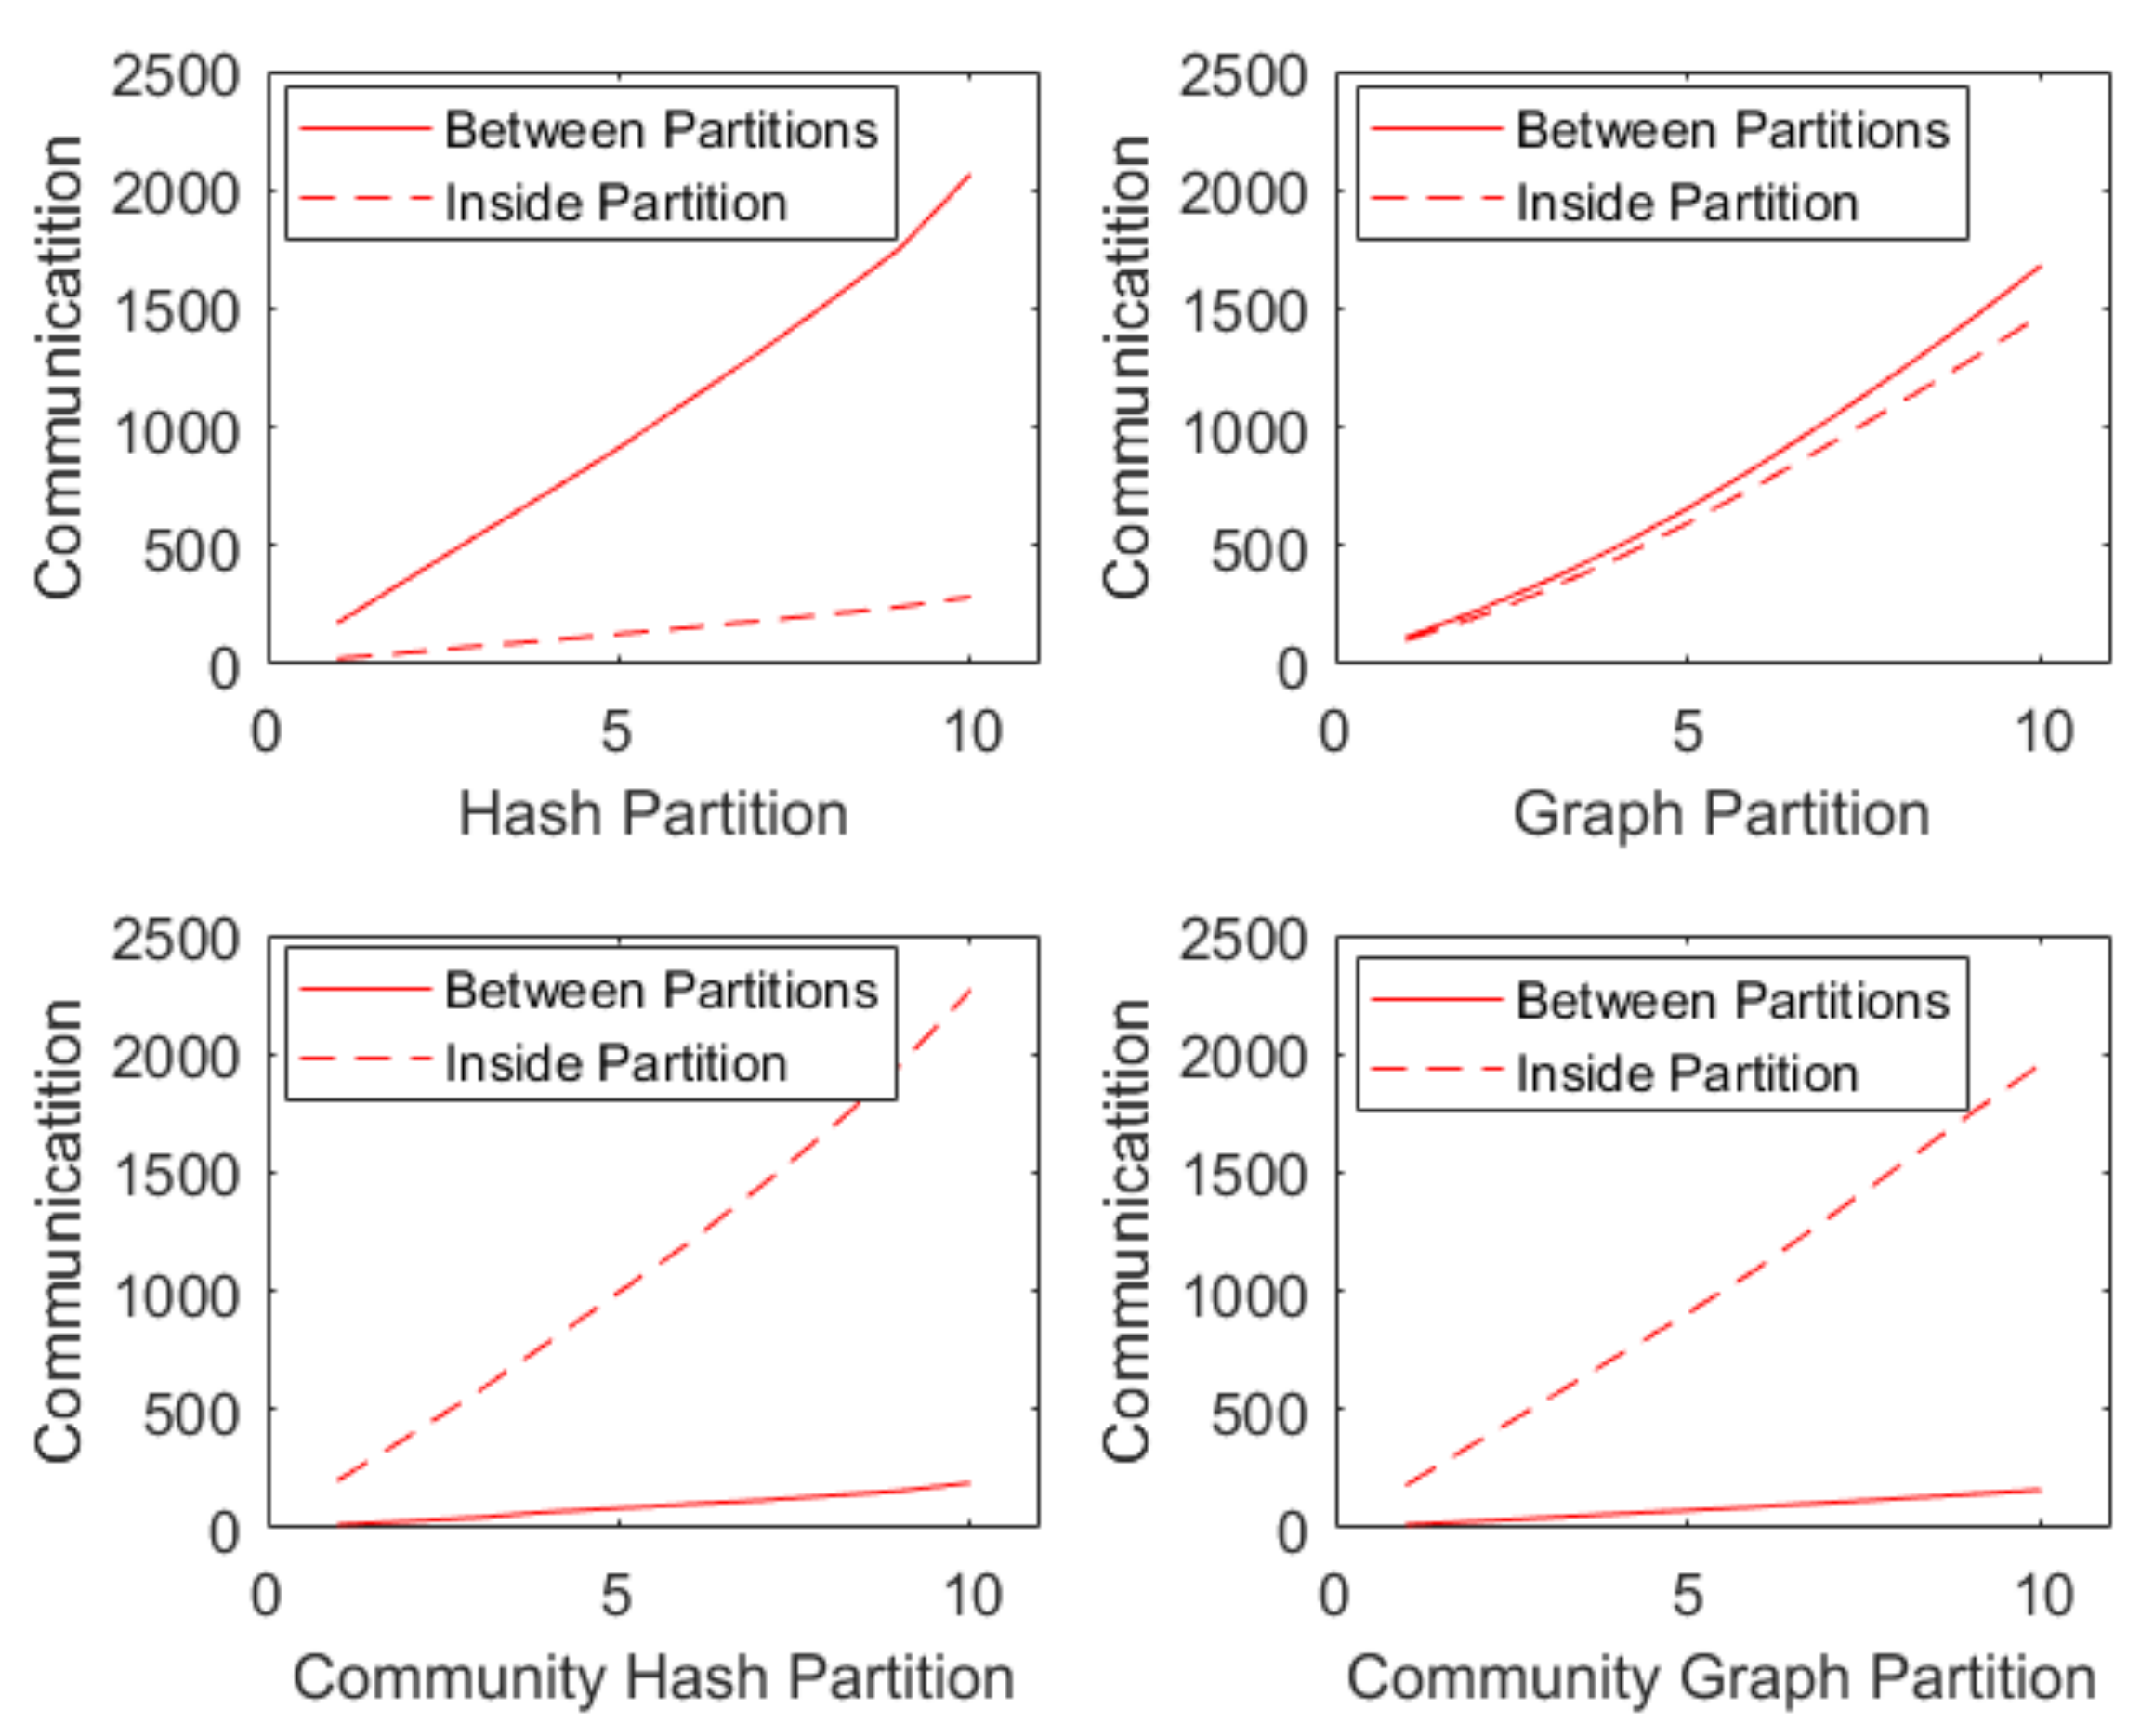
5.2. Experiments of Two-Tier Partition

In order to verify the performance improvement of the two-tier partition algorithm, the empirical data from SNAP (Stanford Network Analysis Project) are used to design a series of experiments. The dataset from Twitter records a large-scale social network which has 81,306 users and 1,768,149 directed edges. Four different partition algorithms are designed to test the performance of the algorithms: (1) partition with Hash algorithm (Hash Partition); (2) partition with multi-path cut algorithm (Graph Partition); (3) simplify the network with the label propagation algorithm, and then partition the simplified network with the Hash algorithm (Community Hash); (4) simplify the network with the label propagation algorithm, and then partition the simplified network with a = the multi-path cut algorithm (Community Graph).
The parameters of the SIR model in agents are set in the experiments. The infection rate is set as 0.001, while the recovery probability is set as 0.01. A group of 10 agents is randomly selected as the initial infection sources to simulate the information diffusion in the social network from Twitter. Fifty simulation experiments are carried out for each partition algorithm, and the communications and loads of the partitions in the simulation are compared.
Figure 12 shows the comparison between the cross-partition communications and inter-partition communications of four different partition algorithms. In the figure, the solid line represents the cross-partition communication, the dotted line represents inter-partition communication, and the top left to bottom right corresponds the Hash Partition, Graph Partition, Community Hash, and Community Graph. It can be seen from the figure that in the partition mode of Hash Partition and Graph Partition, the cross-partition communications exceed the inter partition communications. However, when the community-detection algorithm is used to simplify the network, the inter-partition communications are obviously more numerous than cross-partition communications. This shows that community detection reduces communication across partitions greatly.
Figure 13 shows the comparisons of the communications of four different partition algorithms. The number of cross-partition communications is given at the top of the figure, while the number of communications between the partitions is given at the bottom. It can be seen that in the Hash Partition, the amount of cross-partition communications is the most, the amount of inter-partition communications is the least, and the communication consumptions are also the largest. Compared with the Hash Partition, the cross-partition communications of Graph Partition are reduced, but it still accounts for a higher proportion in the total communication. Although the Graph Partition cuts as few edges as possible, due to the need for the load balance of partitions, the consumptions are still large. It can be seen that the simplification of the network by using the community-detection algorithm significantly reduces cross-partition communications. In the latter two partition algorithms, the inner-partition communications are far greater than the cross-partition communications.
Due to the influences of random factors in the simulation, the amount of communication in various partition algorithms is different. For further comparison, the proportion of cross-partition communications in the total communication of various partition algorithms is listed in Table 4. It can be seen that the Graph Partition reduces the proportion of cross-partition communication by about 35% compared with the Hash Partition. However, the load balance should be considered in the Graph Partition. After using the community-detection algorithm, the community Hash and community both perform well in reducing cross-partition communications, which are less than 10% of the total communications. Because community detections are usually achieved before the simulation, the performance of latter partition algorithms is influenced.
The load of different partitions, LP, is recorded in the simulation. Figure 14 shows the comparisons of the partition loads of four different algorithms. It can be seen that the number of agents allocated to each partition after the Hash Partition is almost the same. Although the number of the neighboring agents of each agent is different, when the scale of the network is large, the Hash Partition can still acquire a good load balance. The Graph Partition can achieve better results by considering the load balance while reducing communications. When community detection is applied, the sizes of the communities located in different partitions are different. This is not good for the load balance of partitions. The Community Hash of the simplified network brings an obviously unbalanced load. The Community Graph improves this to a certain extent.
Figure 15 shows the load imbalance of the partitions of the four partition algorithms. It can be seen that the Hash Partition is the best in terms of load balance. The Community Graph gives a relatively better performance compared to Graph Partition and Community Hash.
Based on the analysis of the experimental results of the four partition algorithms, their features can be concluded below. Hash Partition is easy to use because the algorithm is embedded inside Spark. The load balance of this partition is good, but the network communications are huge in the simulation. Agents with frequent interactions in the social network are randomly assigned to different partitions. The cross-partition communications are much larger than the inter-partition communications. When different computing nodes in the cluster are located in different network locations, the communication consumption cannot be afforded.
Graph Partition reduces cross-partition communications to a certain extent, and the performance is not bad in load balance. However, when the scale of the social network is large, the graph-cut algorithm has a high time complexity, and the time computation of cutting cannot be accepted.
The application of community-detection algorithms reduces the cross-partition communications significantly. Almost 90% of the communication is within the partitions in the simulation, which reduces the communication consumption greatly. However, how the simplified network is allocated to different partitions has a great influence on the load balance. Due to the various sizes of the communities, Hash Partition brings a great imbalance, followed by large quantities of waiting time in the calculation. The proposed two-tier partition algorithm of low time complexity not only effectively reduces the cross-partition communications, but also guarantees load balance between the partitions. In addition, according to the characteristics of the network, the calculation of edge weights in the graph-cut algorithm can be customized to achieve load balance in different social networks.

6. Conclusions and Future Work

The large-scale social network simulation is an important means to study the topology characteristics, evolution rules, and information diffusion characteristics of large-scale social networks. ABMS is a “bottom-up” modeling and simulation paradigm. Using ABMS to simulate large-scale social networks can model individuals to evolve the overall characteristics of social networks through the interaction between individuals. However, with the continuous development of the Internet, the scale of social networks has become larger and larger. Mainstream large-scale social networks even contain hundreds of millions of network nodes, and each node has hundreds of neighboring nodes. In the process of ABMS, a large number of agents need to be modeled and simulated, and the interactions between agents are very complex. There exist many difficulties in data access, data processing, and simulation. However, if the whole social network is replaced by the sampled network or synthesized network, the accuracy of simulation cannot be guaranteed. Therefore, this paper proposes a large-scale social network simulation framework based on Spark, which improves the performance of simulation using two aspects. First, through the Spark programming model, a large-scale social network simulation kernel based on Spark is implemented, which greatly expands the processing capacity and computing performance. Second, according to the characteristics of huge communications in large-scale social network simulation and based on the structure of social networks, a two-tier partition algorithm is designed. This optimizes the distribution of large-scale social networks in the computing cluster and reduces cross-partition communications during the simulation, thus reducing the network communication consumption. Finally, the performance of the two-tier partition algorithm is verified by the experiments of the empirical dataset from Twitter.

Author Contributions

Conceptualization, B.C., H.C., and D.N.; methodology, B.C. and H.C.; software, H.C., C.A., and D.N.; validation, B.C., M.Z., X.Q., and W.D.; formal analysis, B.C. and D.N.; investigation, D.N. and C.A.; writing—original draft preparation, B.C. and H.C.; writing—review and editing, B.C. and D.N.; visualization, D.N. and H.C.; supervision, B.C.; project administration, B.C.; funding acquisition, B.C. B.C. and H.C. contributed to the work equally and should be regarded as co-first authors. All authors have read and agreed to the published version of the manuscript.

Funding

This study is supported by the National Key Research and Development (R&D) Plan [grant numbers 2018YFC0806900]; the National Natural Science Foundation of China [grant number 71673292, 21808181, 61673388, 71673294]; and the National Social Science Foundation of China [grant number 17CGL047].

Conflicts of Interest

The authors declare no conflict of interest.

References

  1. Wechat 2018. In Wechat Data Report 2018; Wechat: Singapore, 2019; Available online: https://support.weixin.qq.com/cgi-bin/mmsupport-bin/getopendays (accessed on 19 May 2020).
  2. Fang, B.; Jia, Y.; Han, Y. Core scientific issues of social network analysis. research status and future prospects. CAS Bull. 2015, 2, 187–199. [Google Scholar]
  3. Liu, W.; Sidhu, A.; Beacom, A.M.; Valente, T. Social Network Theory. In The International Encyclopedia of Media Effects; John Wiley & Sons, Inc.: Hoboken, NJ, USA, 2017. [Google Scholar]
  4. Fang, B. Online Social Network Analysis; Electronic Industry Press: Beijing, China, 2014. [Google Scholar]
  5. Zhang, J.; Li, X. Artificial society -sociological simulation based on Agent. Syst. Eng. 2005, 23, 13–20. [Google Scholar]
  6. Sklar, E. Software Review: NetLogo, a Multi-Agent Simulation Environment. Artif. Life 2007, 13, 303–311. [Google Scholar] [CrossRef]
  7. Minar, N.; Burkhart, R.; Langton, C.; Askenazy, M. The Swarm Simulation System–A Toolkit for Building Multi-agent Simulations; Santa Fe Institute: Santa Fe, NM, USA, 1996. [Google Scholar]
  8. North, M.J.; Collier, N.; Vos, J.R. Experiences creating three implementations of the repast agent modeling toolkit. ACM Trans. Model. Comput. Simul. 2006, 16, 1–25. [Google Scholar] [CrossRef]
  9. Railsback, S.F.; Lytinen, S.; Jackson, S.K. Agent-based Simulation Platforms: Review and Development Recommendations. Simulation 2006, 82, 609–623. [Google Scholar] [CrossRef]
  10. Zhen, L.; Gang, G.; Bin, C.; Xiaogang, Q. Accelerating Large Scale Artificial Society Simulation with CPU/GPU Based Heterogeneous Parallel Method. In Proceedings of the IEEE/ACM International Symposium on Distributed Simulation & Real Time Applications, London, UK, 21–23 September 2016. [Google Scholar]
  11. Walker, S.J. Big Data: A Revolution That Will Transform How We Live, Work, and Think. Int. J. Advert. 2014, 33, 181–183. [Google Scholar] [CrossRef]
  12. Google. Sorting 1 PB with MapReduce. Available online: http://googleblog.blogspot.com/2008/11/sorting-1pb-with-mapreduce.html,20081111 (accessed on 21 November 2019).
  13. Matei, Z.; Mosharaf, C.; Franklin, J.; Shenker, M.; Ion, S. Spark: Cluster Computing with Working Sets. In Proceedings of the 2nd USENIX Conference on Hot Topics in Cloud Computing, Berkeley, CA, USA, 22–25 June 2010. [Google Scholar]
  14. Charlse, M.; Michael, J. agent-based modeling and simulation. In Proceedings of the 2009 Winter Simulation Conference, Austin, TX, USA, 13 December 2009; pp. 86–98. [Google Scholar]
  15. Allan, R. Survey of Agent Based Modelling and Simulation Tools; Science and Technology Facilities Council: Washington, DC, USA, 2010. [Google Scholar]
  16. Mittal, A.; Krejci, C.C.; Dorneich, M.C. An agent-based approach to designing residential renewable energy systems. Renew. Sustain. Energy Rev. 2019, 112, 1008–1020. [Google Scholar] [CrossRef]
  17. Griffin, F.A.; Stanish, C. An Agent-Based Model of Prehistoric Settlement Patterns and Political Consolidation in the Lake Titicaca Basin of Peru and Bolivia. Struct. Dyn. 2007, 2, 2. [Google Scholar]
  18. Testa, J.W.; Mock, K.J.; Taylor, C.; Koyuk, H.; Coyle, J.R.; Waggoner, R. Agent-based modeling of the dynamics of mammal-eating killer whales and their prey. Mar. Ecol. Prog. Ser. 2012, 466, 275–291. [Google Scholar] [CrossRef] [Green Version]
  19. Lee, K.; Park, J. A Hadoop-Based Output Analyzer for Large-Scale Simulation Data. In Proceedings of the The Fourth IEEE International Conference on Big Data & Cloud Computing, Sydney, Australia, 3 December 2014. [Google Scholar]
  20. Sethia, P.; Karlapalem, K. A multi-agent simulation framework on small Hadoop cluster. Eng. Appl. Artif. Intell. 2011, 24, 1120–1127. [Google Scholar] [CrossRef]
  21. Kärger, J.; Ruthven, D.M.; Theodorou, D.N. Molecular Dynamics Simulations. In Diffusion in Nanoporous Materials; Wiley: Hoboken, NJ, USA, 2012; pp. 227–273. [Google Scholar]
  22. Youbo, L.; Yang, L.; Junyong, L.; Yong, L.; Jianting, L.; Su, D. Hadoop Based Distributed Computing Framework for Large-scale Cascading Failure Simulation and Analysis of Power System. Autom. Electr. Power Syst. 2016, 40, 90–97. [Google Scholar]
  23. He, L.; Fen, D.; Wang, R.; Su, P.-R.; Ying, L.-Y. Worm simulation of large-scale online social network based on MapReduce. J. Softw. 2013, 7, 1666–1682. [Google Scholar] [CrossRef]
  24. Chuan, A.; Bin, C.; Liang, L.; Jian, J.; He, L.; Lai, K.; Qiu, X. Design and implementation of large-scale network propagation simulation method inspired by Pregel mechanism. Sci. Sin. Inf. 2018, 48, 932–946. [Google Scholar]
  25. Kang, L.; Zhang, X.; Li, F.; Tian, Y. Graph partitioning method for social networks based on communication load balancing. Comput. Eng. Appl. 2018, 54, 66–71. [Google Scholar]
  26. Clauset, A.; Newman, M.E.; Moore, C. Finding community structure in very large networks. Phys. Rev. E 2004, 70, 066111. [Google Scholar] [CrossRef] [Green Version]
  27. Watts, D.J.; Strogatz, S.H. Collective dynamics of ‘small-world’ networks. Nature 1998, 393, 440–442. [Google Scholar] [CrossRef]
  28. Fortunato, S. Community detection in graphs. Phys. Rep. 2009, 486, 75–174. [Google Scholar] [CrossRef] [Green Version]
  29. Girvan, M.; Newman, M.E.J. Community structure in social and biological networks. Proc. Natl. Acad. Sci. USA 2002, 99, 7821–7826. [Google Scholar] [CrossRef] [Green Version]
  30. Newman, M.E.J. Fast algorithm for detecting community structure in networks. Phys. Rev. E 2004, 69, 066133. [Google Scholar] [CrossRef] [Green Version]
  31. Clauset, A. Finding local community structure in network. Phys. Rev. E 2005, 72, 1–7. [Google Scholar] [CrossRef] [Green Version]
  32. Fieldler, M. Algebraic connectivity of graphs. Czechoslov. Math. J. 1973, 23, 298–305. [Google Scholar]
  33. Raghavan, U.N.; Albert, R.; Kumara, S. Near linear time algorithm to detect community structures in large-scale networks. Phys. Rev. E 2007, 76, 036106. [Google Scholar] [CrossRef] [PubMed] [Green Version]
  34. Kernighan, B.W.; Lin, S. An Efficient Heuristic Procedure for Partitioning Graphs. Bell Syst. Tech. J. 1970, 49, 291–307. [Google Scholar] [CrossRef]
Figure 1. The infrastructure of a Spark-based large-scale simulation of information diffusion in a social network.
Symmetry 12 00843 g001
Figure 2. The state switch of the SIR model.
Symmetry 12 00843 g002
Figure 3. Simulation flow chart.
Symmetry 12 00843 g003
Figure 4. The computation in each simulation time step.
Symmetry 12 00843 g004
Figure 5. The sifferences in communication cost caused by the different partitions of MsgRDD and AgentStateRDD.
Symmetry 12 00843 g005
Figure 6. The structure of the social network.
Symmetry 12 00843 g006
Figure 7. The data flow in Hash partition.
Symmetry 12 00843 g007
Figure 8. The data flow in community-based partition.
Symmetry 12 00843 g008
Figure 9. The principle of the two-tier partition algorithm.
Symmetry 12 00843 g009
Figure 10. The comparison of results between the Spark-based simulation of information siffusion and the Pregel-based simulation.
Symmetry 12 00843 g010
Figure 11. The count of infected and recovered agents.
Symmetry 12 00843 g011
Figure 12. The communications in four partitions.
Symmetry 12 00843 g012
Figure 13. The comparisons of the communication of four partitions.
Symmetry 12 00843 g013
Figure 14. The comparisons of load in four partitions.
Symmetry 12 00843 g014
Figure 15. The imbalances of load in four partitions.
Symmetry 12 00843 g015
Table 1. The sesign of the data structure.
NameStored InformationData TypeDescription
AgentStateRDDAgent state<Key,Value>RDDRecord the state change of agent
AgentLinkListRDDNeighboring Agents of Agent<Key,Value>RDDRecord the neighboring agents list of agent
MsgRDDMessage<Key,Value>RDDRecord the messages list received by agent
InfectedAgentBroadcastInfected AgentBroadcastRecord infected agents
InfectedAgentRDDInfected Agent<Key,Value>RDDRecord infected agents
Table 2. The pseudocode of the two-tier partition algorithm.
Algorithm the Two-tier Partition
Input:  Adjacent set N = { n 1 , n 2 , , n n } ; n i represents the neighbor list of vertex i.
K , K represents the number of partitions.
Output: P = { p 1 , p 2 , , p n } , p i represents the index of located partition for vertex i.
1. C = { C 1 , C 2 , C n } ← find community of all vertexes with LPA( N )
2. for each community do
3.  statistic compute load of all vertexes in this community as c l i
4. end
5. C L = { c l 1 , c l 2 , c l M }
6. for each edge in N do
7.  construct community relation of source community and target community from C L
8. end
9. C R ← statistic community relations
10. S N ( V C , E C ) ← construct simplify network with C L and C R
11. P ←GraphPartition( S N , K )
Table 3. The scale of the synthesized social network.
Order of Magnitude of Network SizeHundredThousandTen ThousandHundred ThousandMillion
The number of nodes100100010,000100,0001,000,000
The number of edges114310,739111,392112,083711,183,970
Table 4. The communications in four partitions.
Partition AlgorithmHash PartitionGraph PartitionCommunity HashCommunity Graph
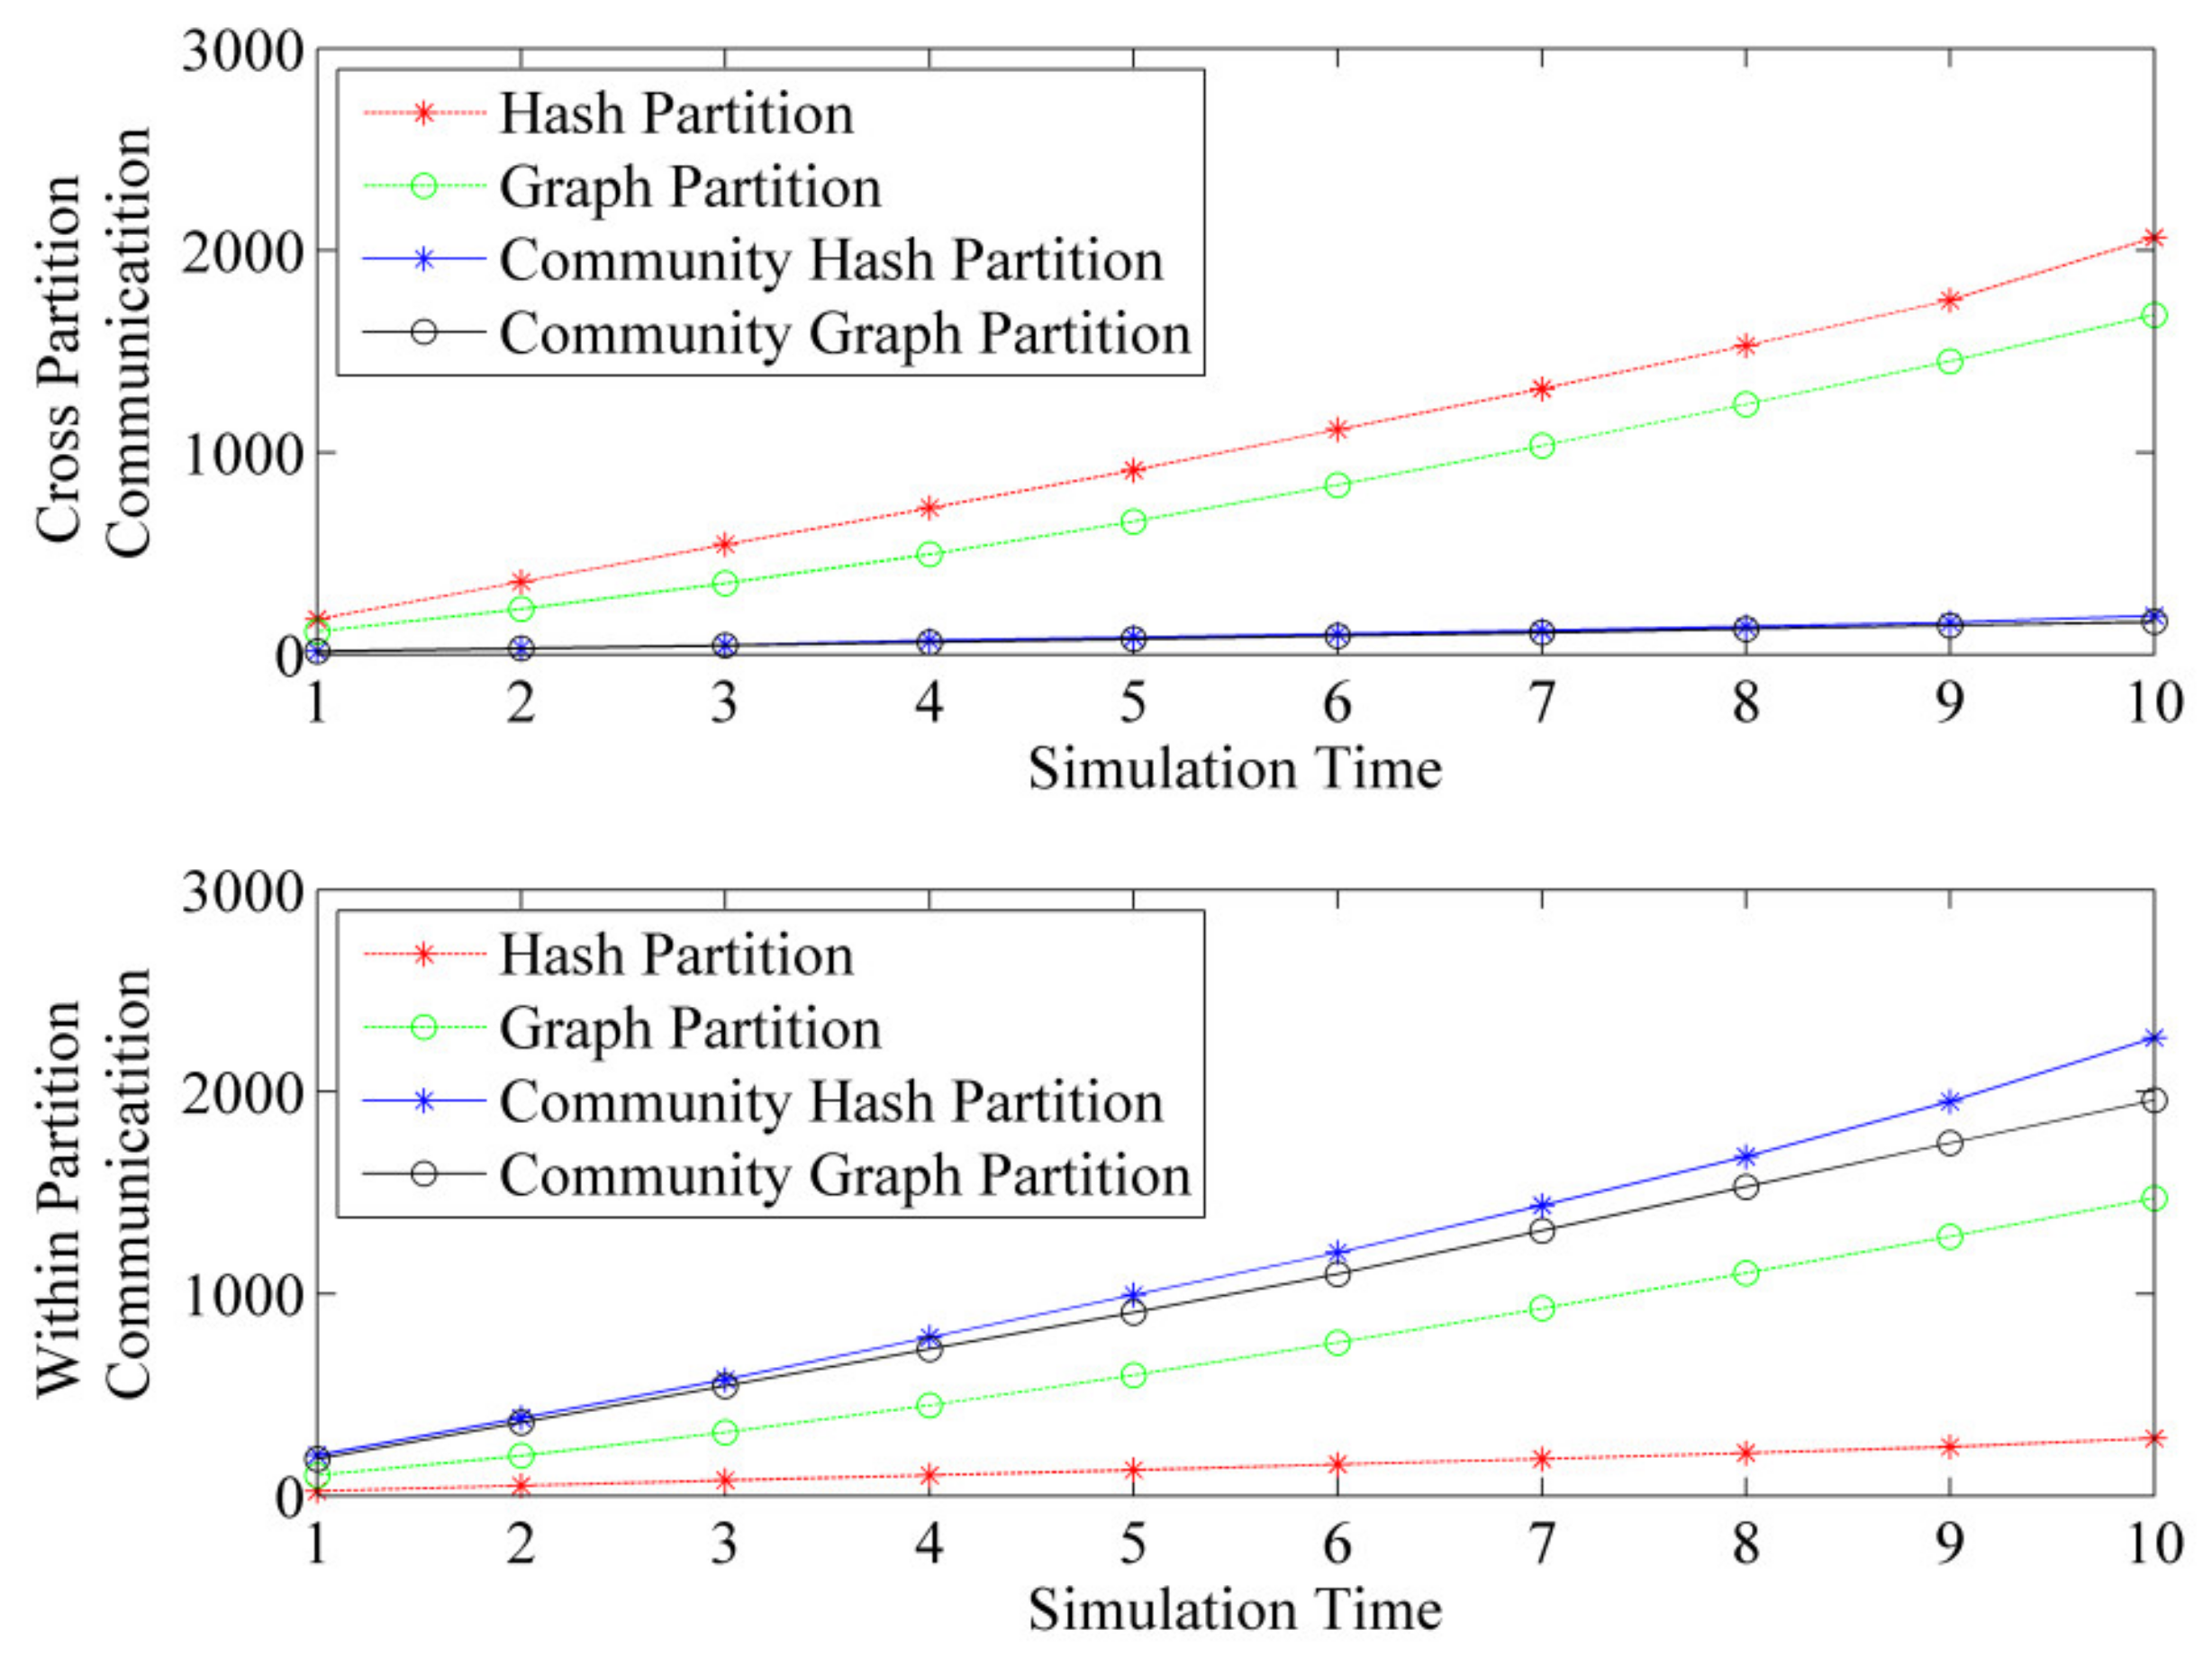
The proportion of cross-partition communication87.9%53.3%7.8%7.6%
The proportion of inter-partition communication12.1%46.7%92.2%92.4%

