1. Introduction
Sudden failures of different parts of engineering systems are everyday occurrences in the mining industry, and they often lead to negative consequences that can have an impact on machines, employees, or the working environment. Such incidents are called risky events. In general, it can be said that an event that can influence the outcome of a defined objective (preventing, disabling, or slowing down the realization of a goal) can be considered a risky event. Managing, controlling, and monitoring the risk of mining machine failure is a highly complex task. In order to be able to incorporate risk management, it is necessary to adopt extensive systematic and organizational measures that provide insight into all of the possible negative and destructive factors that may affect the operation of an engineering system. Only thorough knowledge of the way a system operates and its correlation with other systems (in both a technical and technological sense) can lead to a first-rate risk assessment of an individual component’s failure. Meticulous attention should be directed toward the factors that can cause a risky event, as well as toward the consequences and negative effects that can manifest after a failure. The consequences of a failure can have a negative impact on the structure of machines, employees, and the environment. The negative impact of an individual component failure can be reflected in reduced operational capacity or total breakdown. A failure can adversely affect employees by decreasing workplace safety or causing injuries or harmful health effects. An accident due to a failure often has negative effects on the environment in the vicinity of a mining complex: noise, vibrations, gases, liquid, and polluted water leakage are the most common adverse effects on the environment.
According to standard ISO31000, risk is defined as the “effect of uncertainty on objectives”, which is a structured approach to Enterprise Risk Management (ERM) [
1]. This effect may be positive, negative, or simply a variation from the expected. Risk is often described by an event, a change in circumstances, or a consequence. In this definition, uncertainty includes both events (which may or may not happen) and uncertainty caused by ambiguity or a lack of information. It also includes both negative and positive impacts on objectives. Many definitions of risk exist in common usage; however, the definition above was developed by an international committee representing over 30 countries and is based on the input of several thousand subject matter experts. Here, risk is measured in terms of a combination of the consequences of an event and their likelihood: the probability of the occurrence of harm and the severity of that harm.
In general, risk levels are usually expressed through a Risk Priority Number (RPN) calculation and a Failure Mode and Effects Analysis (FMEA). RPN methodology is a technique for analyzing the risk associated with any potential problems identified during an FMEA. However, there is a great deal of debate among FMEA practitioners as to the correct analysis procedure, and some analyses may include alternative calculation methods. An FMEA can be performed to identify the potential failure modes for a product or process. The RPN method then requires the analysis team to use past experience and engineering judgment to rate each potential problem according to three rating scales:
Severity (S), which rates the severity of the potential effect of the failure in terms of harmful effects on operation. This includes the extent of the damage that is caused. Damage can be financial, technological, structural, or related to work or environmental conditions;
Occurrence (O), which rates the likelihood that the failure will occur. Occurrence is related to reliability and how often a machine breaks down;
Detection (D), which rates the likelihood that the problem will be detected before it reaches the end user or customer. This involves the ability to prevent failure (online monitoring, etc.).
The most important aspect of a risk assessment process is recognizing potential hazards, weak points, and failure modes, i.e., finding critical points in the system and establishing the risk level of failure of a single part or the entire engineering system. The measures taken to reduce the risk of critical parts also depend on this.
Risk management should consider and study risk from both an economic perspective and in terms of employee protection from hazards [
2]. The most important risk assessment activity is the task of assessing the level of risk, but, despite its importance, neither national nor international standards and regulations have defined a standard procedure for assessing risk, leaving companies free to adopt approaches that are acceptable to them [
3]. Radosavljević et al. [
4] have pointed to the need for risk management in mining, including analytical and methodological approaches to risk treatment in order to identify, reduce, and constantly monitor the parameters of risk.
It can be concluded that the risk management process is unavoidable and has to be organized simultaneously with other company activities. Depending on the type of business, the company has to develop a set of procedures that are in accordance with the existing standards for the field in question, as these standards form part of a risk management algorithm. From this point of view, mining is one of the most complex industries in terms of technology, the machinery used, the cost of unplanned breakdowns, and the work environment where the technology operates.
The distinctiveness of working conditions in the mining industry and the correlations between machines, the work environment, and the environment in general, as well as the impact of unwanted failures on the operation of machines and the entire technical system, impose the need for constant monitoring and risk management.
The smooth efficient operation of mining machines without failures requires extensive research, analysis, and scheduled adequate regular maintenance so that a machine can maintain its operational state for an extended period. The time taken to repair one element or subsystem of a machine usually leads to a production delay. It is well known that complex mining machines can experience element failure, which leads to negative effects on the machine, employees, and environment, even with proper monitoring and maintenance systems.
Previous research in the field of risk and reliability has offered different approaches and various models, but there have been some common goals: the identification of critical elements in the system, subsystems, and assemblies; the assessment of regular failure occurrences; the evaluation of the level of risk and measures that should be taken for a system to retain its designed functional characteristics.
The initial idea for this paper was to create a model that comprehensively analyzes risk elements and synergistically integrates them under one umbrella term. The motivation for this work came from actual problems in the mining industry with regard to hazards, weak points, and failure modes. There is no systematic approach for addressing these issues, and the consequences are often catastrophic. The aim of this research was to improve machine maintenance and reduce the consequences of unexpected failures.
We developed an algorithm for the implementation of risk effects, that is, the probability of a negative occurrence that impacts the structure of a machine, the production process in which it participates, the work environment, or the environment in general due to an unexpected shutdown, failure, or breakdown of the machine. We incorporated this into a comprehensive model for risk level assessment for a certain machine used in the mining industry.
The example of risk assessment model developed in this research is for a mobile crushing machine, the Lokotrack LT 1213S. The developed model presents a new methodological approach for risk assessments of mining machinery failure based on fuzzy logic conclusion and min–max composition. The main advantage of the developed model is that it evaluates the risk levels of higher hierarchical structures based on an elemental risk assessment. The presented model can be generally used for other machines as well.
The rest of the paper is organized as follows: The applicability of fuzzy sets and fuzzy logic in risk assessments is presented in
Section 2. The procedures, algorithm, and methodology are described in
Section 3.
Section 4 presents the Case Study, and the Results and Discussion are given in
Section 5. Finally, Conclusions are given in
Section 6.
2. Fuzzy Set and Fuzzy Logic Theories for Risk Assessments
Fuzzy set theory represents a mathematical approach that is suitable for the analysis of processes in which uncertainty, ambiguity, subjectivity, and indeterminacy are prevalent. It was developed to treat insufficiently precise phenomena that cannot be modeled solely using probability theory or interval mathematics. Ambiguity, as a term, can be considered through the following three categories, depending on the phenomenon being modeled:
Probability theory, when the given conditions that characterize the term do not determine a unique expected result;
Interval mathematics, when it is not possible (or necessary) to precisely determine the observed values; or
Fuzzy set theory, when the ambiguity arises from imprecision in communication (e.g., high or low reliability, good or poor maintenance).
An analytical approach based on fuzzy set theory relies on both qualitative (linguistic) and quantitative (numeric) variables simultaneously, and the output is presented in a continuous form, which cannot be said for the other conventional models of decision-making theory [
5]. This particularly applies to partial risk indicators: reliability, as an input variable, most often represents a mathematically defined quantity, but not always, and the severity of a consequence is of a qualitative nature and is based on expert judgment. The essential comparative advantage of the fuzzy model is that the qualitative meaning of variables is not lost, whether in the performance analysis or in the synthesis of a specific machine’s structure (that is, the result remains in a linguistic form that is defined by the membership function) [
5].
The use of fuzzy sets and fuzzy logic could be explained as an expert or qualitative skill, or simply as a calculation performed with words [
6]. The application of fuzzy set theory and fuzzy logic to system failures in engineering has been analyzed by Cai [
7]. The author offered a wide range of possibilities for applying fuzzy methodologies, among which the most prominent were the possibilities of applying fuzzy set theory and fuzzy logic to failure diagnoses, the reliability of machines, risk assessments, occupational safety, etc. Chen [
8] has suggested applying fuzzy sets and fuzzy arithmetic to system reliability determinations.
Fuzzy logic has been of great use in risk assessments in various fields. It is also possible to combine fuzzy logic with other decision-making methods. Fuzzy logic has been used to analyze occupational health and safety [
9,
10,
11], for risk assessments of various equipment failures [
12], for a pipeline risk assessment [
13], for a deepwater drilling riser [
14], and in mining equipment [
15]. It has also been used in Risk Based Maintenance (RBM) [
16,
17,
18].
In addition, fuzzy logic is a good tool in the decision-making process, especially in terms of equipment selection. Risk assessment can be used in terms of project management [
19]. Ataei et al. have used fuzzy logic theory and fuzzy rules in the selection of machinery in underground coal mines [
20].
Kabir and Papadopoulos [
21] have analyzed methodologies based on fuzzy set theory that have been applied to safety and reliability, such as fuzzy FTA, fuzzy FMEA, fuzzy ETA, fuzzy Bayesian networks, fuzzy Markov chains, and fuzzy Petri nets. Similar analyses have been presented by Liu et al. [
22]. Their review showed the potential applicability of fuzzy set theory in addressing uncertainty in safety and reliability engineering. The numerous possibilities for applying fuzzy sets and fuzzy logic theory can be seen in the aforementioned research. The prospect theory is also used for risk assessment. The prospect (PT) theory proposed by Kahneman and Tversky [
23] which is applied to model decision makers’ behavior under risk [
24,
25]. With this method the outcomes group around the S curve. The model that we are proposing analyzes all of the risky situations, while PT observes only individual cases. PT is applicable with asymmetric fuzzy sets where the subjectivity of the analyst can be influential.
The technical systems used in mining today are quite complex and sophisticated and, therefore, maintenance is also complex. The most commonly used system has operated for over 20 years, and accurate records on maintenance do not exist. This fact makes it impossible to determine risk and reliability parameters based on the statistical processing of data obtained from machine history, and the only alternative is to use the experiences of employees (given in a linguistic fuzzy form).
3. Procedures and Algorithms for the Application of Risk Assessment Model in Mining Machinery
The establishment of a risk assessment model based on the risk of failure of individual components (and partial risk indicators) enables the formation of a clear picture of the state of a system, which can enable asset and lifetime management. Further, it is important to undertake the necessary measures for adequate risk management and for the creation of a favorable atmosphere for improving the functionality of the entire process of exploiting mineral resources. One of the most important details is that the results of fuzzy logic reasoning can indicate trends in risk management and can unambiguously reveal future developments related to system failure.
A risk-of-failure assessment of technical systems based on fuzzy logic theory consists of several steps:
Gathering and sorting existing data on the performance of the system for which the assessment is being made;
Fuzzifying the data collected for partial risk indicators;
Composition of membership function for partial risk indicators by applying a min–max composition;
Identification of the membership degree of risk assessment results for corresponding fuzzy sets by applying a best-fit method.
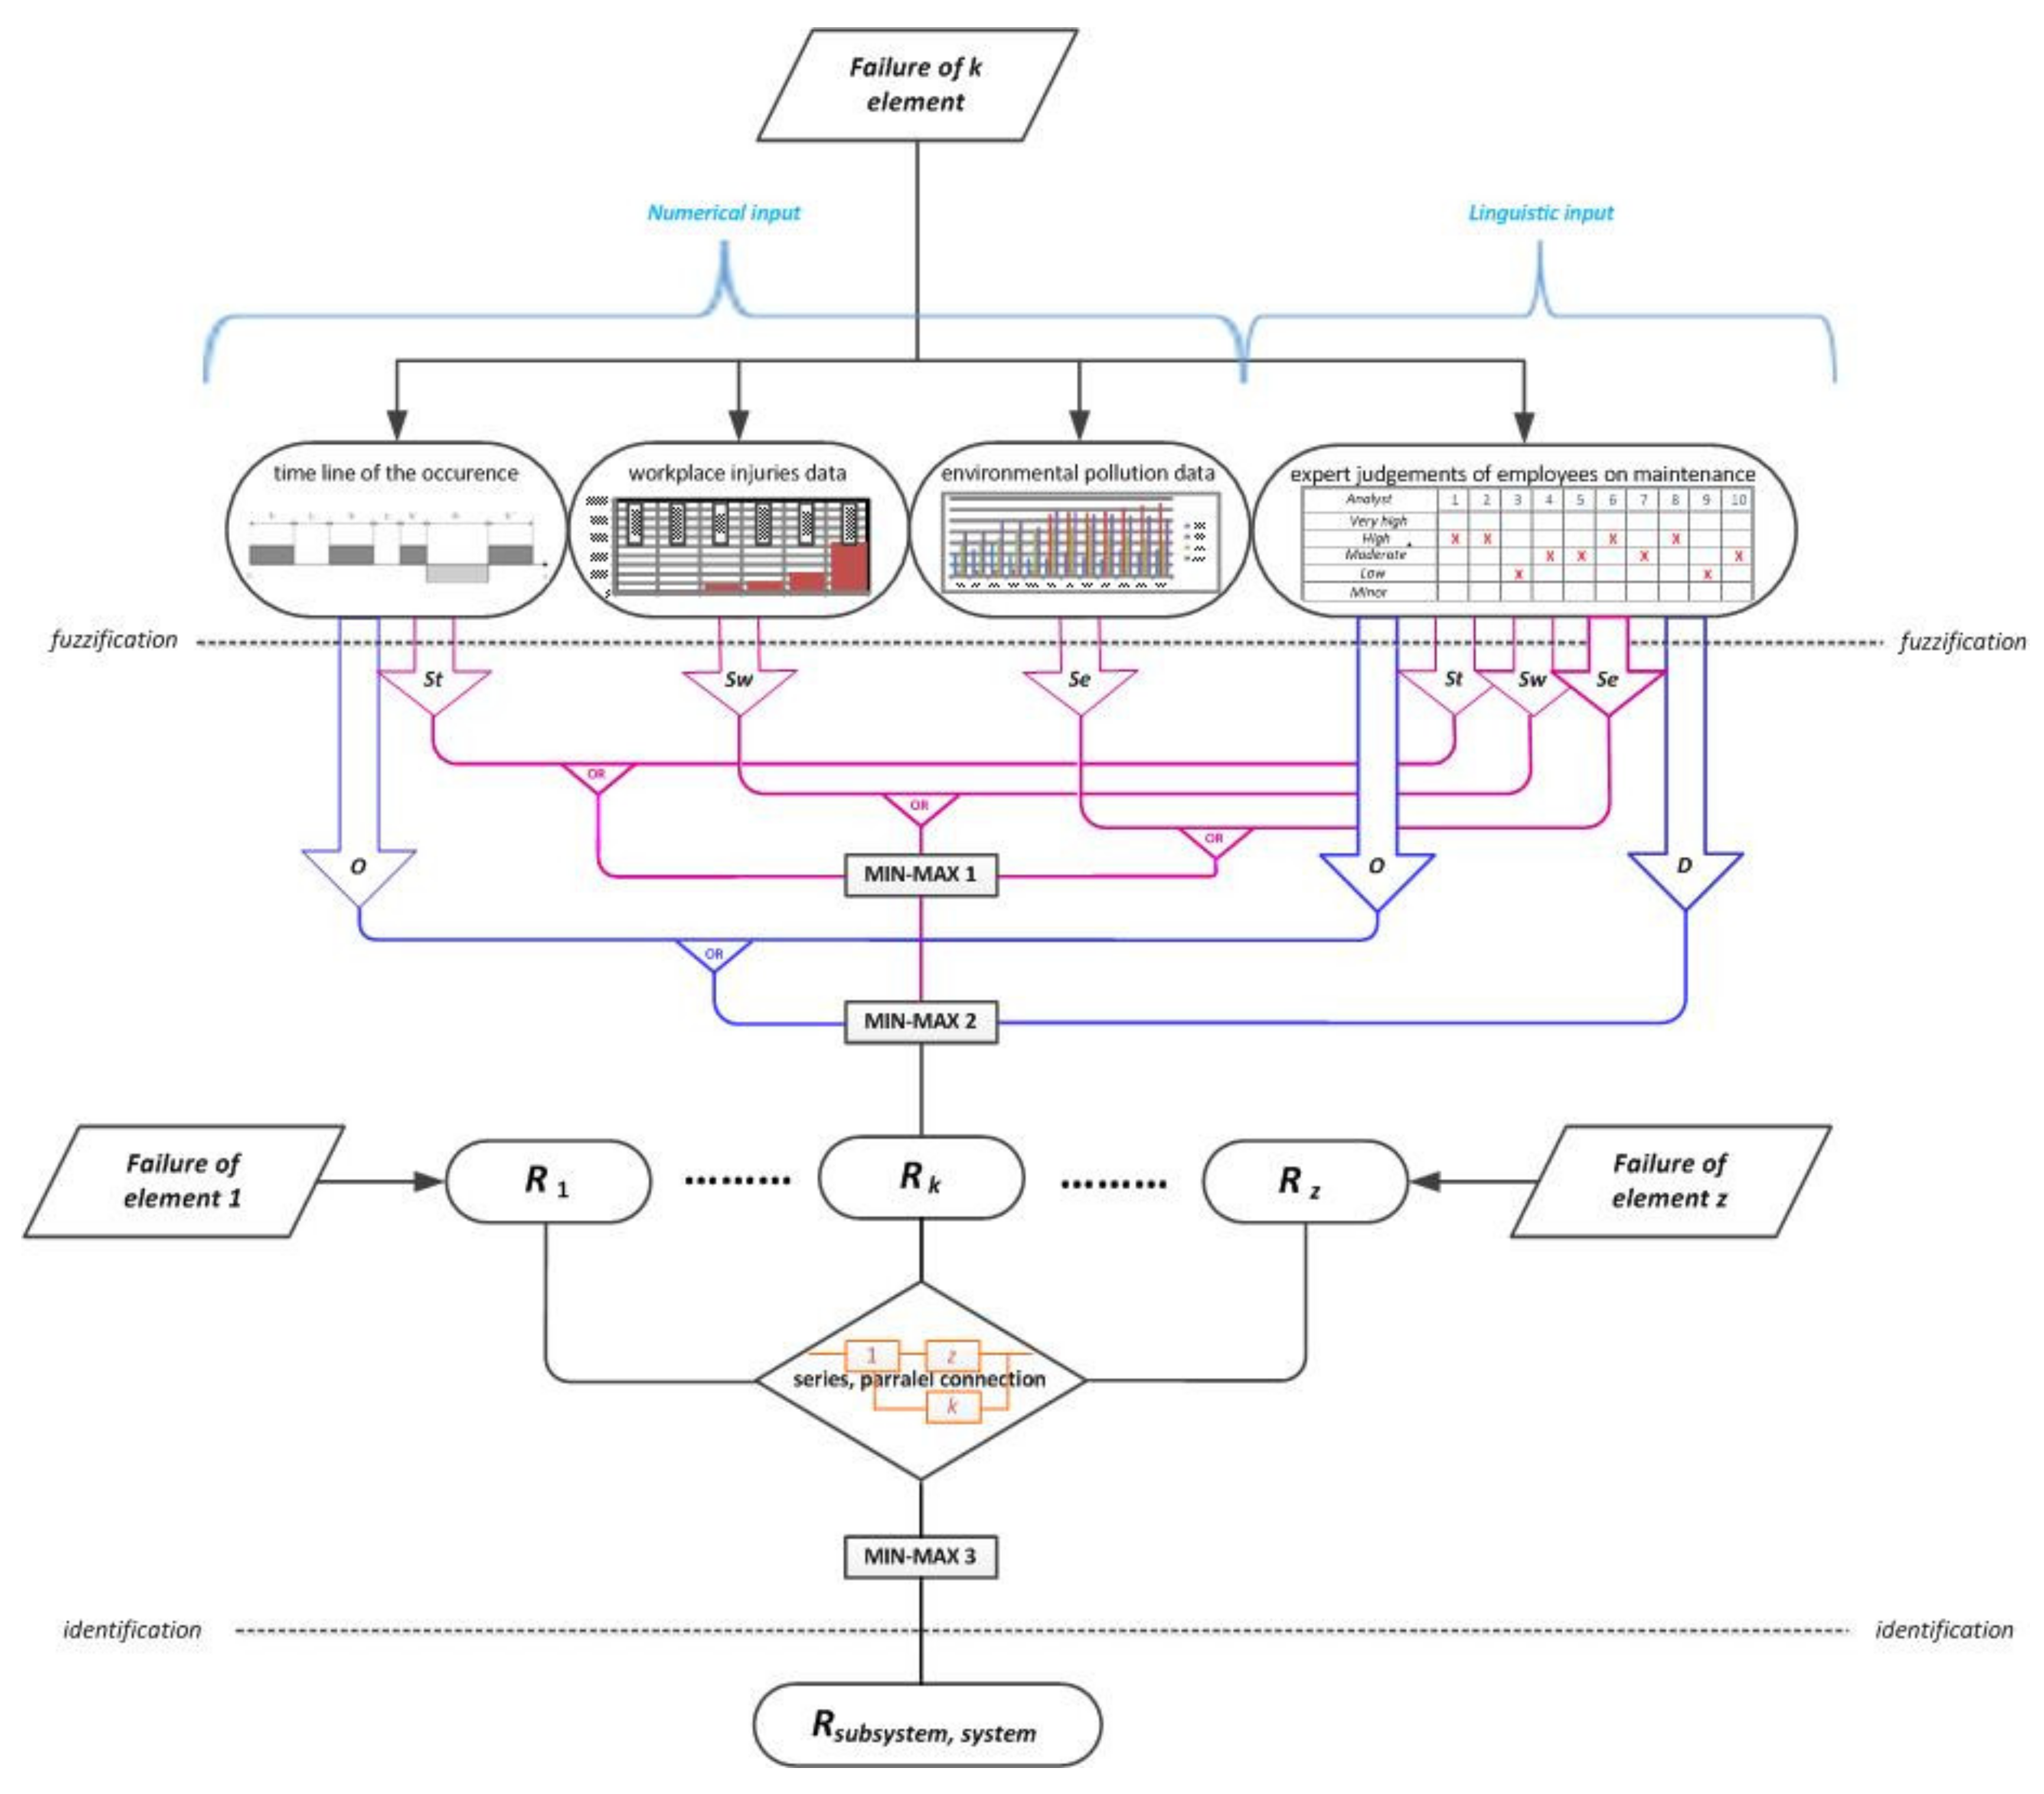
The risk assessment algorithm (
Figure 1) developed for this paper consists of two steps, or stages, in assessing the risk level. The first stage of the risk assessment model is to determine the risk level of failure for the kth component in the technical system, where k = 1, 2, …, n. The level of risk of failure of one component of a mining machine is determined based on the risk indicator for the kth component. The risk indicators for the component include failure severity, failure occurrence probability, and failure detectability.
In the proposed algorithm, failure severity is expressed through the following:
A maintainability function as a measurement for downtime;
Records of workplace injuries as a measurement of a failure’s impact on employees;
Measured levels of pollution as a measurement of a failure’s impact on the environment.
The reliability function is a measurement of the frequency of failure based on a timeline of the state of an engineering system.
Detecting a failure, or detectability, means being able to detect potential failures through regular inspections of an engineering system, offering the possibility of acting in order to prevent or minimize the consequences of a failure.
The second step is to determine the level of risk for higher hierarchical structures on the basis of risk level assessment for the elements (components).
In order to analyze the risk indicators for component failure severity in technical systems, it is necessary to fuzzify the input data. The process of fuzzification is applied based on the data received for a failure (more details on fuzzification can be found in
Section 3.2). Data on the failure of components in an engineering system can be presented as numeric values (e.g., the timeline of the state of the engineering system, the number of recorded workplace injuries, measurements of the pollution level) or linguistic values (e.g., evaluations of employees and of the maintenance of the technical systems or machines). It is important to emphasize that the algorithm enables operations with both types of data, as well as with combinations of data.
After the fuzzification process is done, a min–max composition is used to form a membership function for failure severity indicators, which is then used to obtain a fuzzy set with membership functions for failure severity. This indicator (for the risk of failure), along with the other two indicators (occurrence and detectability), is applied to a min–max composition, which provides an estimate for the level of risk of failure of the kth component of the machine.
An assessment of the risk for hierarchically higher structures (subsystems and systems) is performed based on an assessment of the risk of failure for elements in hierarchically lower structures (using min–max composition).
The outcome is defined as the expected (mean value) grade in the min–max composition. In other words, an RPN number is used, where all partial risk indicators equally impact the risk assessment. In the case of a level three min–max composition, the outcome can be defined using a priori knowledge about the existence of a direct correlation between hierarchically lower structures in terms of reliability (that is, that they equally impact the reliability of the hierarchically higher structures that comprise them). This way, a risk assessment synthesis is presented as the worst among the best with regard to the potential outcomes of risky events. This is the most common for fault tree structures in engineering systems. When the system has a backup or some other connection is used, the outcome is formed as a logical conclusion (if–then form) for any risk situation caused by a failure of the engineering system. For example, if the system consists of two elements, one and two, where element one has a backup that will automatically activate when a breakdown occurs in element one, the outcome for the entire system cannot be the same as the outcome when breakdown occurs for element two, which is why it is necessary to use expert judgment that includes an opinion on the quality of the backup element activation system. If the six relation is used, the outcome will be the same in both cases, which does not work here. Thus, in order to obtain an adequate risk assessment, the incorporation of expert judgment into the model during the assessment contributes to the quality of the obtained results.
Defining the membership degree of the obtained results, i.e., the membership function of a specific fuzzy set (minor, low, moderate, high, or very high), happens through defuzzification. The process of defuzzification can be applied to all hierarchical levels of an engineering system, depending on the assessment requirements.
3.1. Fuzzy Proposition
Fuzzy proposition is a process of defining an observed phenomenon in terms of linguistic variables, i.e., allocating linguistic values to the indicators of the observed phenomenon.
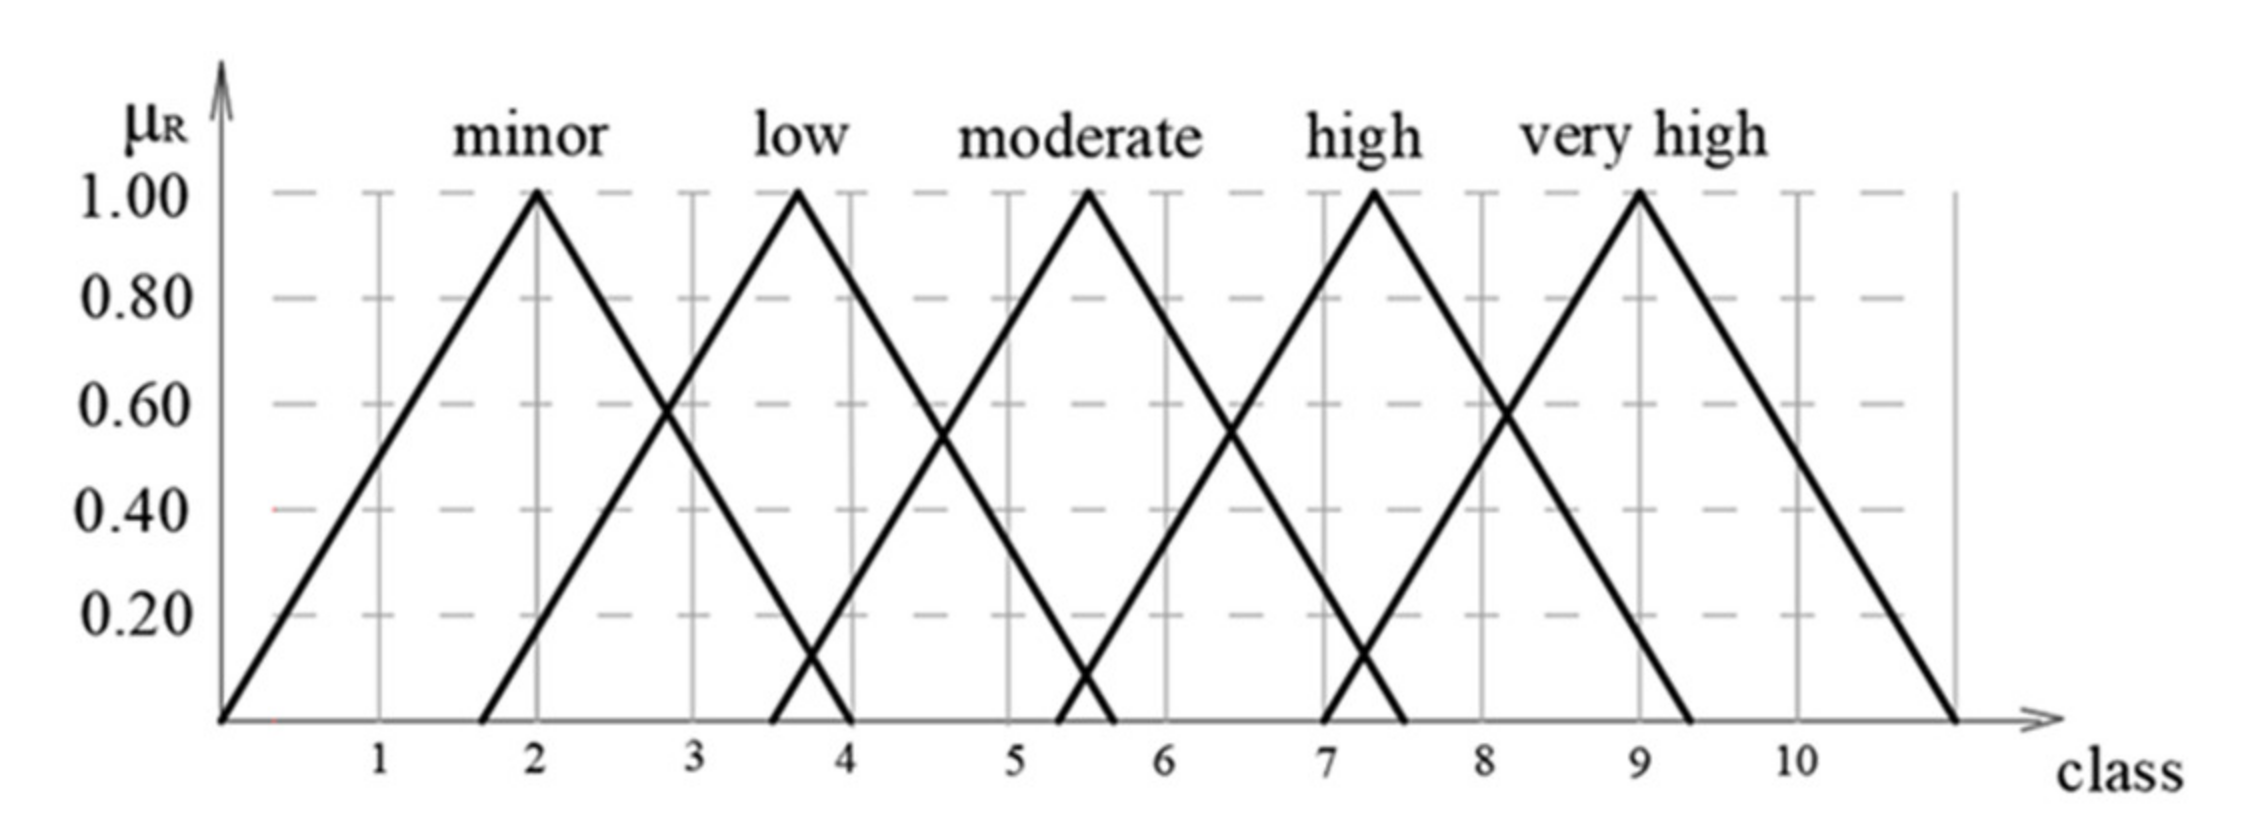
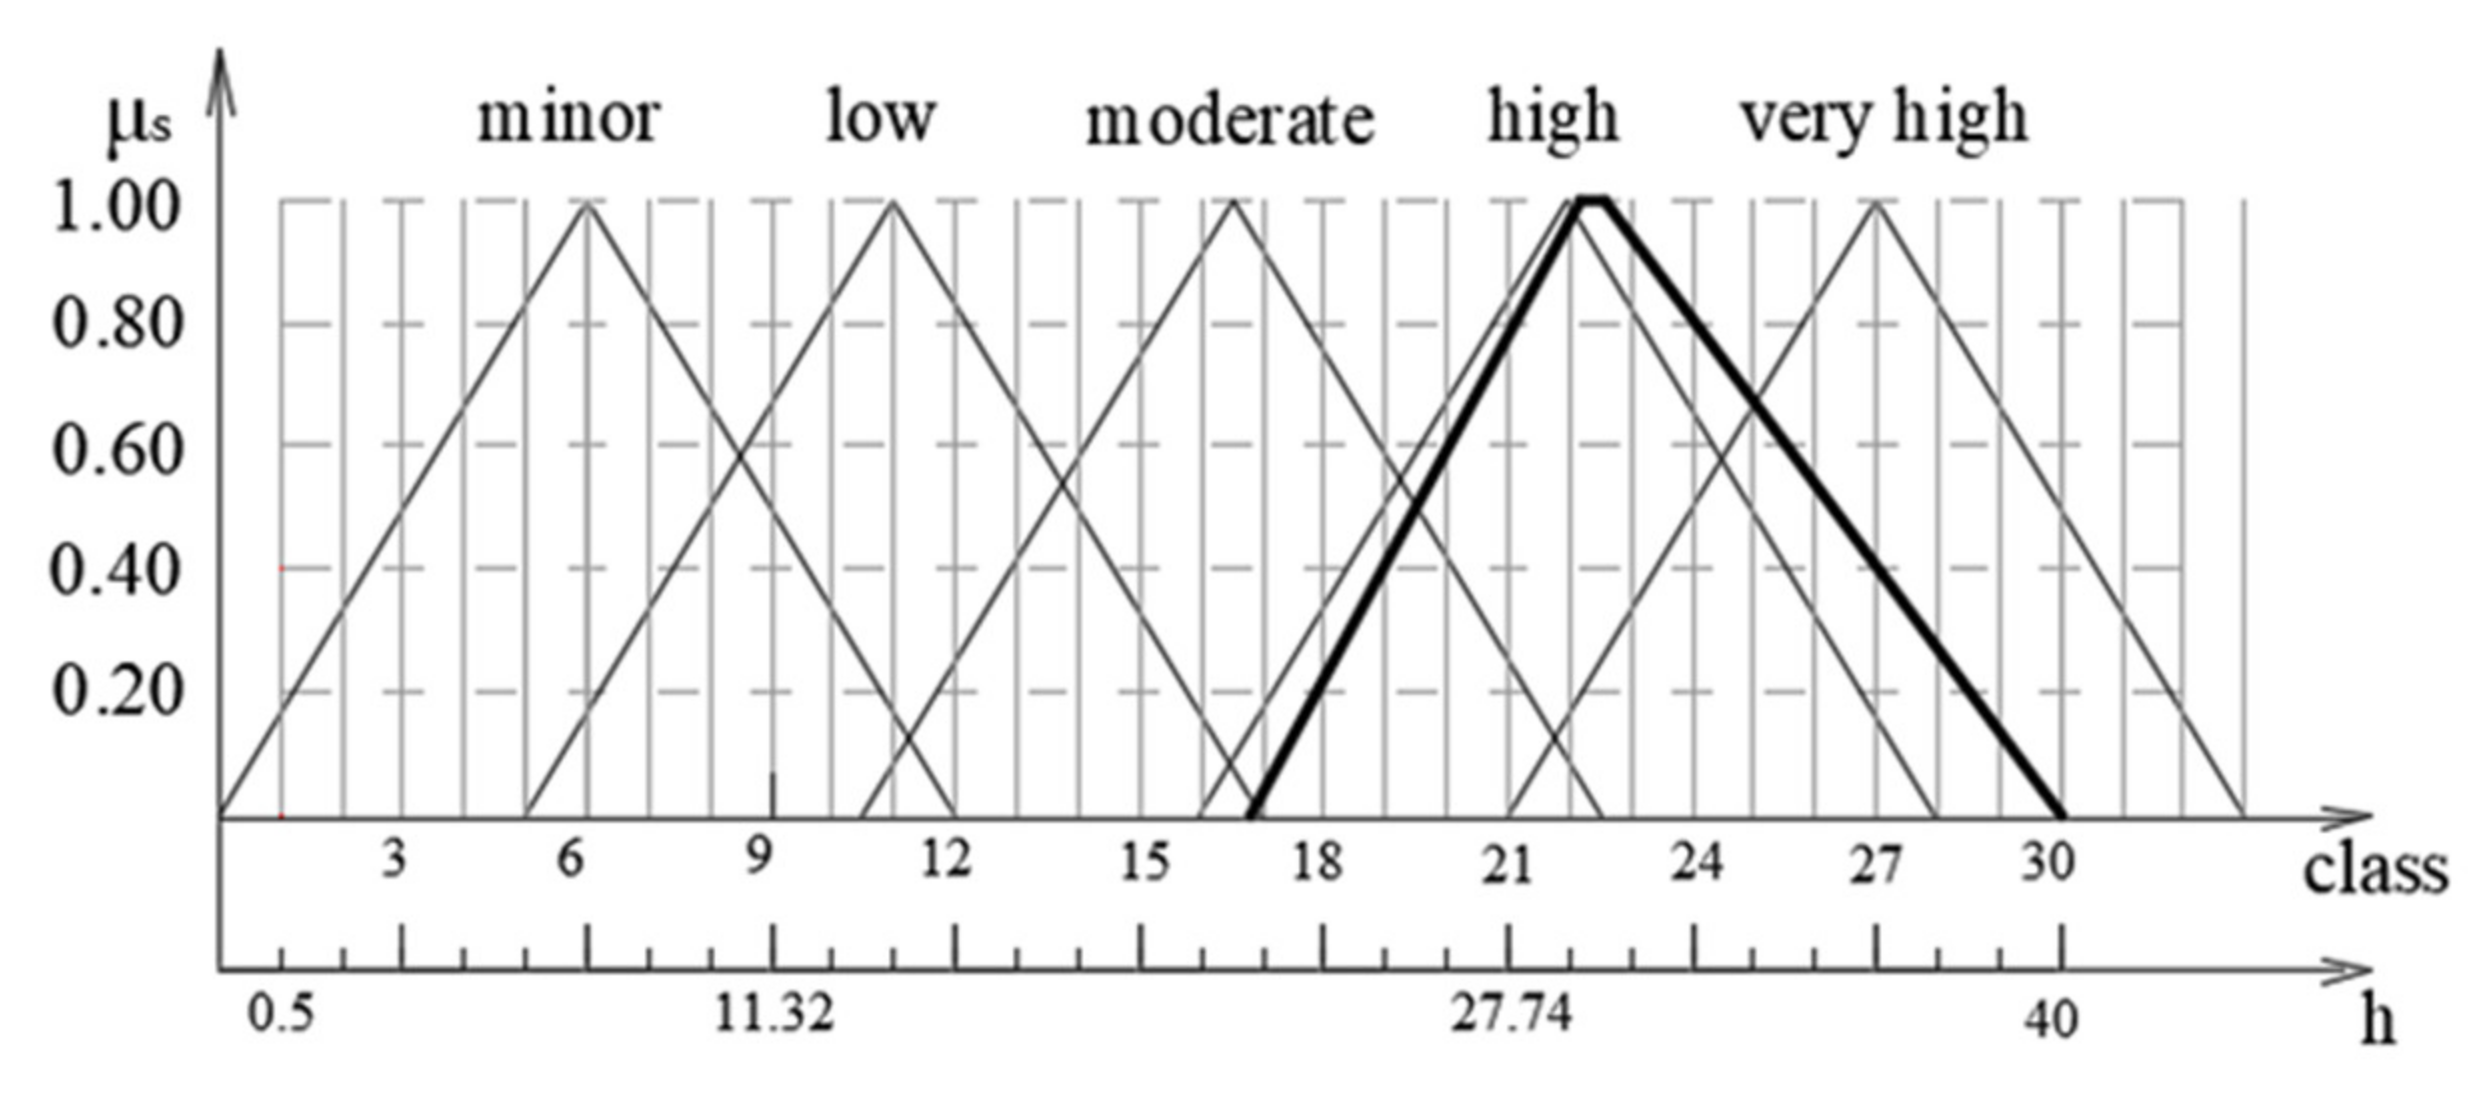
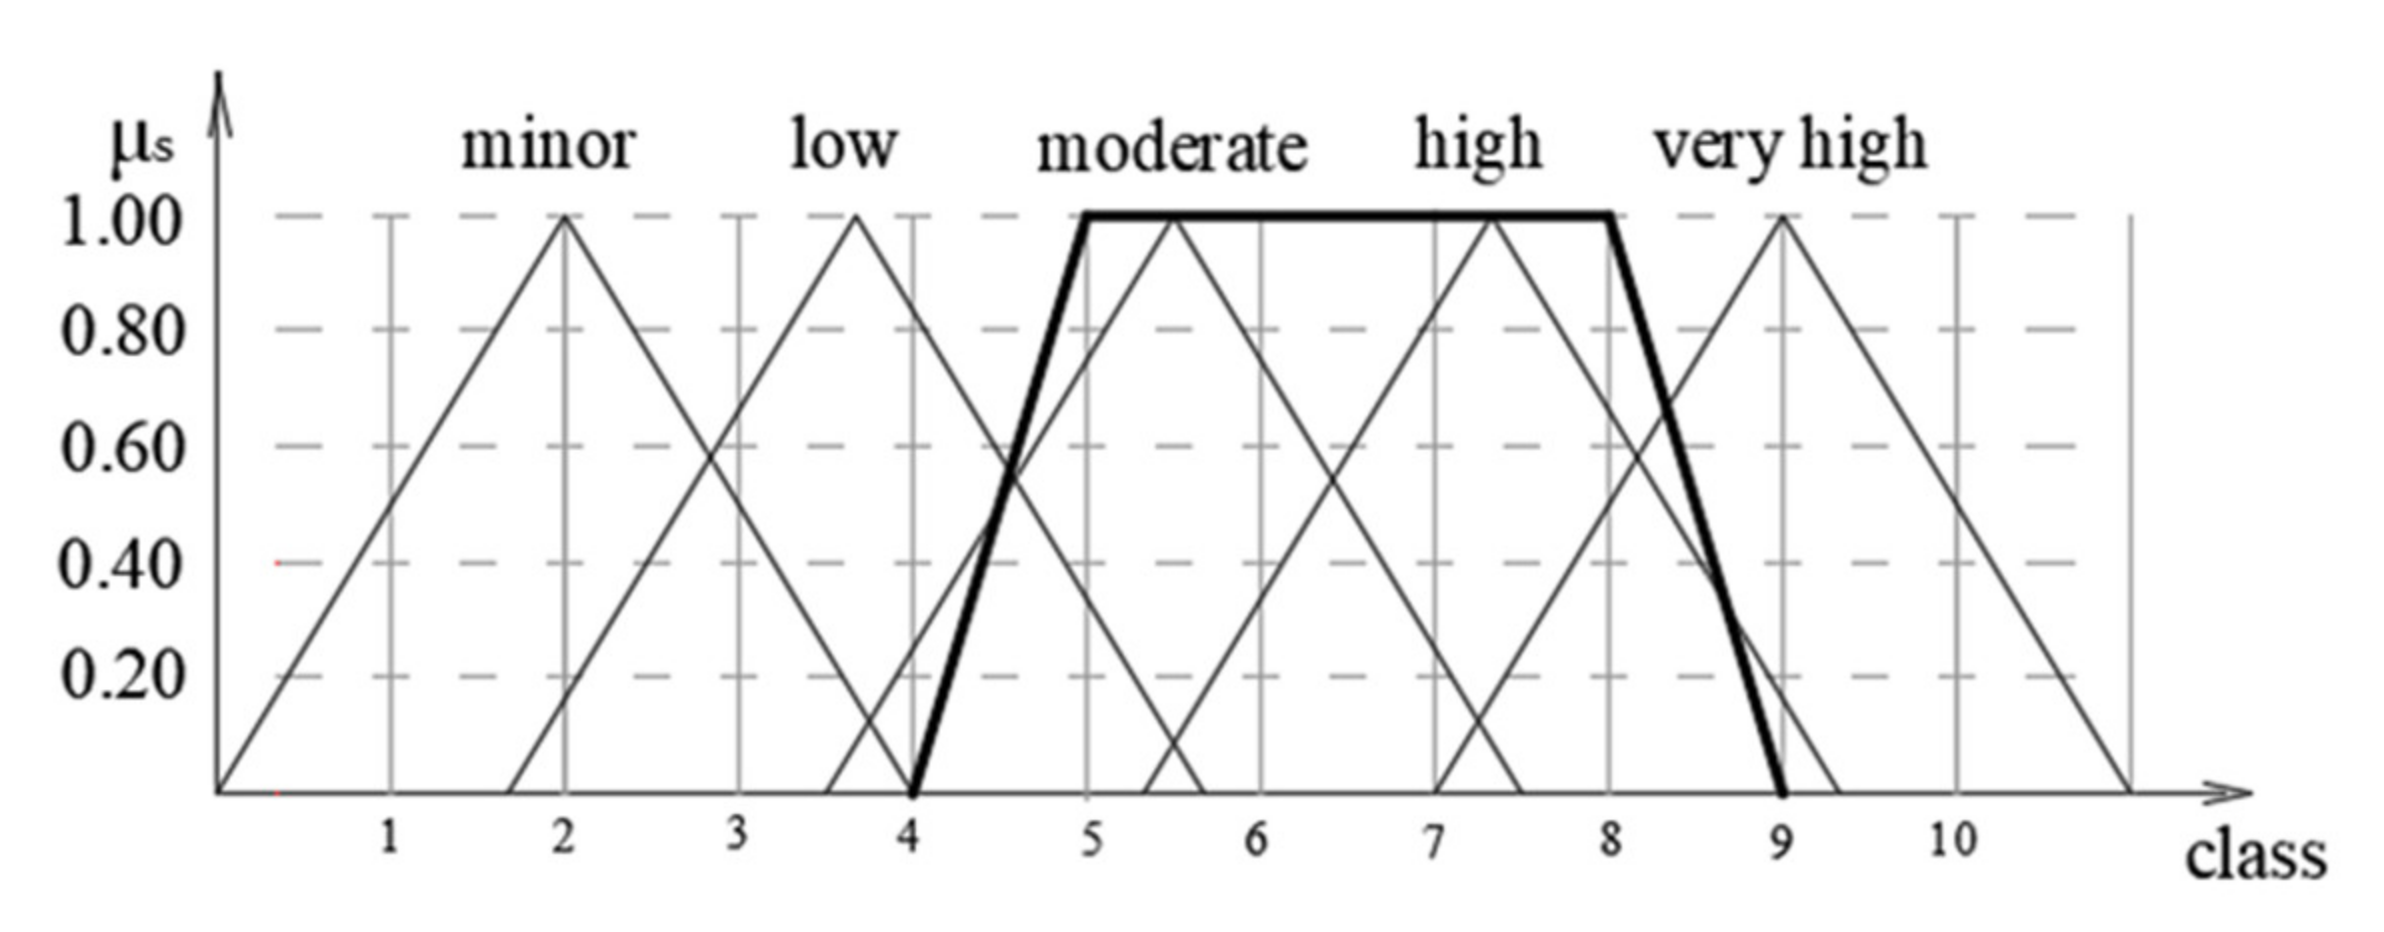
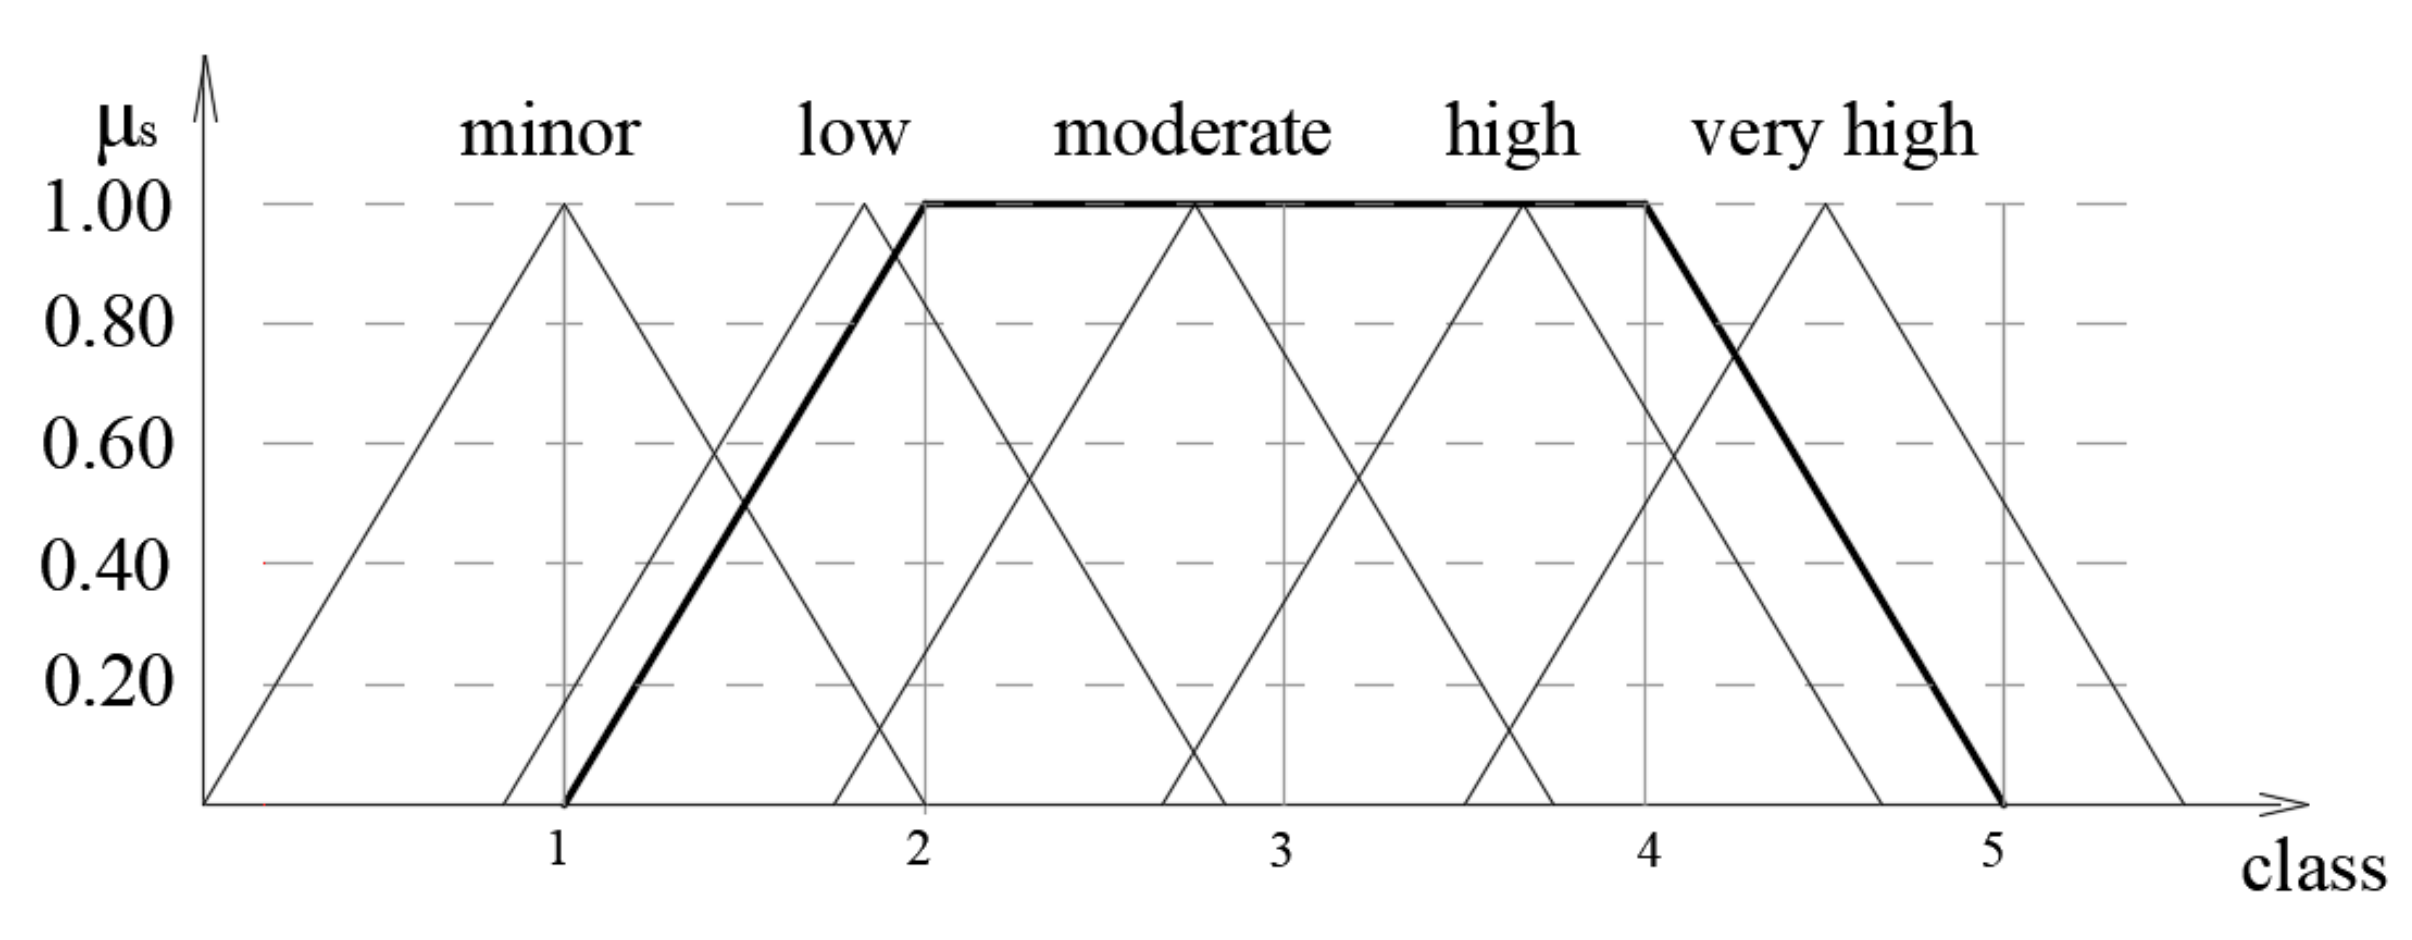
The defined linguistic variables that describe fuzzy sets for risk level indicators are minor, low, moderate, high, and very high. The fuzzy sets used for risk assessment are represented by triangular or trapezoidal membership functions. The shape of the membership function, which is caused by the linguistic variables mentioned, is a triangle in this model (
Figure 2). According to Ivezić et al. [
26], membership functions should have a symmetric, triangular shape for more precise linguistic terms. A fuzzy model uses symmetric fuzzy sets, a symmetric layout, and symmetric inference. A symmetric approach is used in cases where there are no expected deviations in the behavior of the observed phenomenon. In such cases, it is necessary to disturb the symmetry of the particular areas in relation to the size of j. An example of a non-symmetric outcome can be seen in [
27], where the outcomes were ranked.
Fuzzy sets are indicated by the membership function µ for corresponding classes of each linguistic variable, where the term “class” is used as a measurement unit of risk indicators. The class with an assigned value of one represents the lowest risk indicator values for the best state of the system, while class 10 indicates the highest risk indicator values. The concept of class is sufficiently recognizable and defines the level of quality. Here, five linguistic variables and 10 classes were adopted for the proposed model. The fuzzy sets for each linguistic variable are presented in the following form:
3.2. Fuzzification
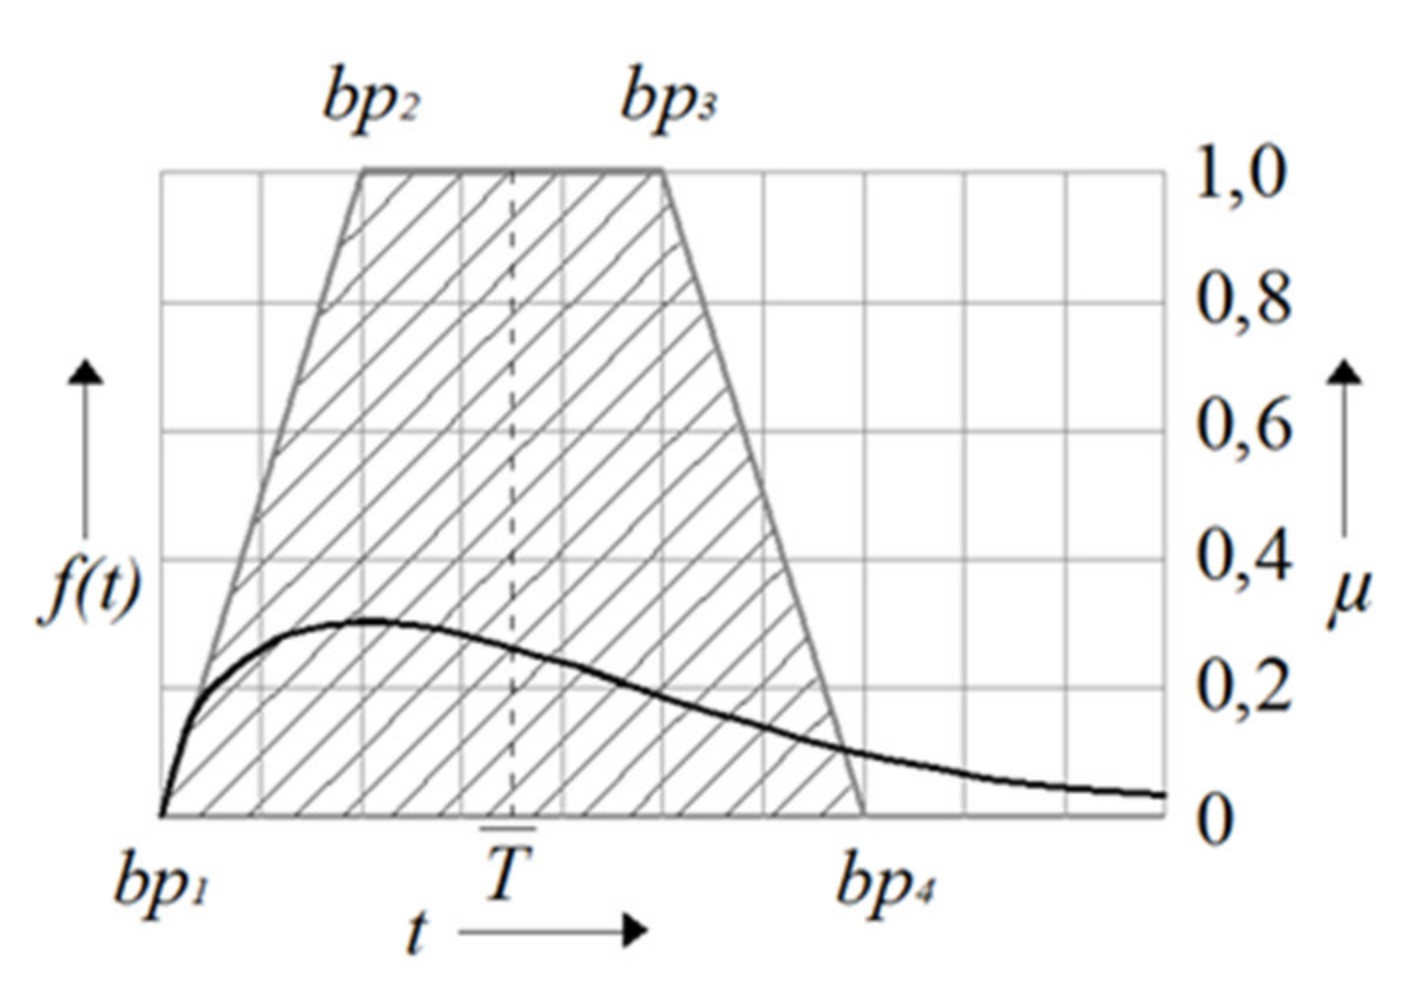
3.2.1. Fuzzification of the Cumulative Function
Here, the input data for machine hours and downtime from machinery failure (obtained based on a timeline of the technical system’s state through the application of Weibull’s two-parameter distribution),
t = t1,
…,
tn, undergo a process of fuzzification into trapezoidal fuzzy numbers with the parameter values 1 < β < 3 (
Figure 3) (it is best to use trapezoidal fuzzy number for the values of 1 < β < 3) [
28].
The trapezoidal fuzzy set is represented by breakpoints in the following form:
Breakpoints bp
1 and bp
4 are assigned using minimum and maximum recorded time values, t. The allocated time for breakpoints bp
2 and bp
3 is calculated based on the mean time (
T), which depends on the shape parameter β in a standard Weibull distribution [
29].
where:
x = 0 for
β = 3 and
x = 1 for
β = 1.
The proportion factor x can be determined based on parameter β through linear interpolation.
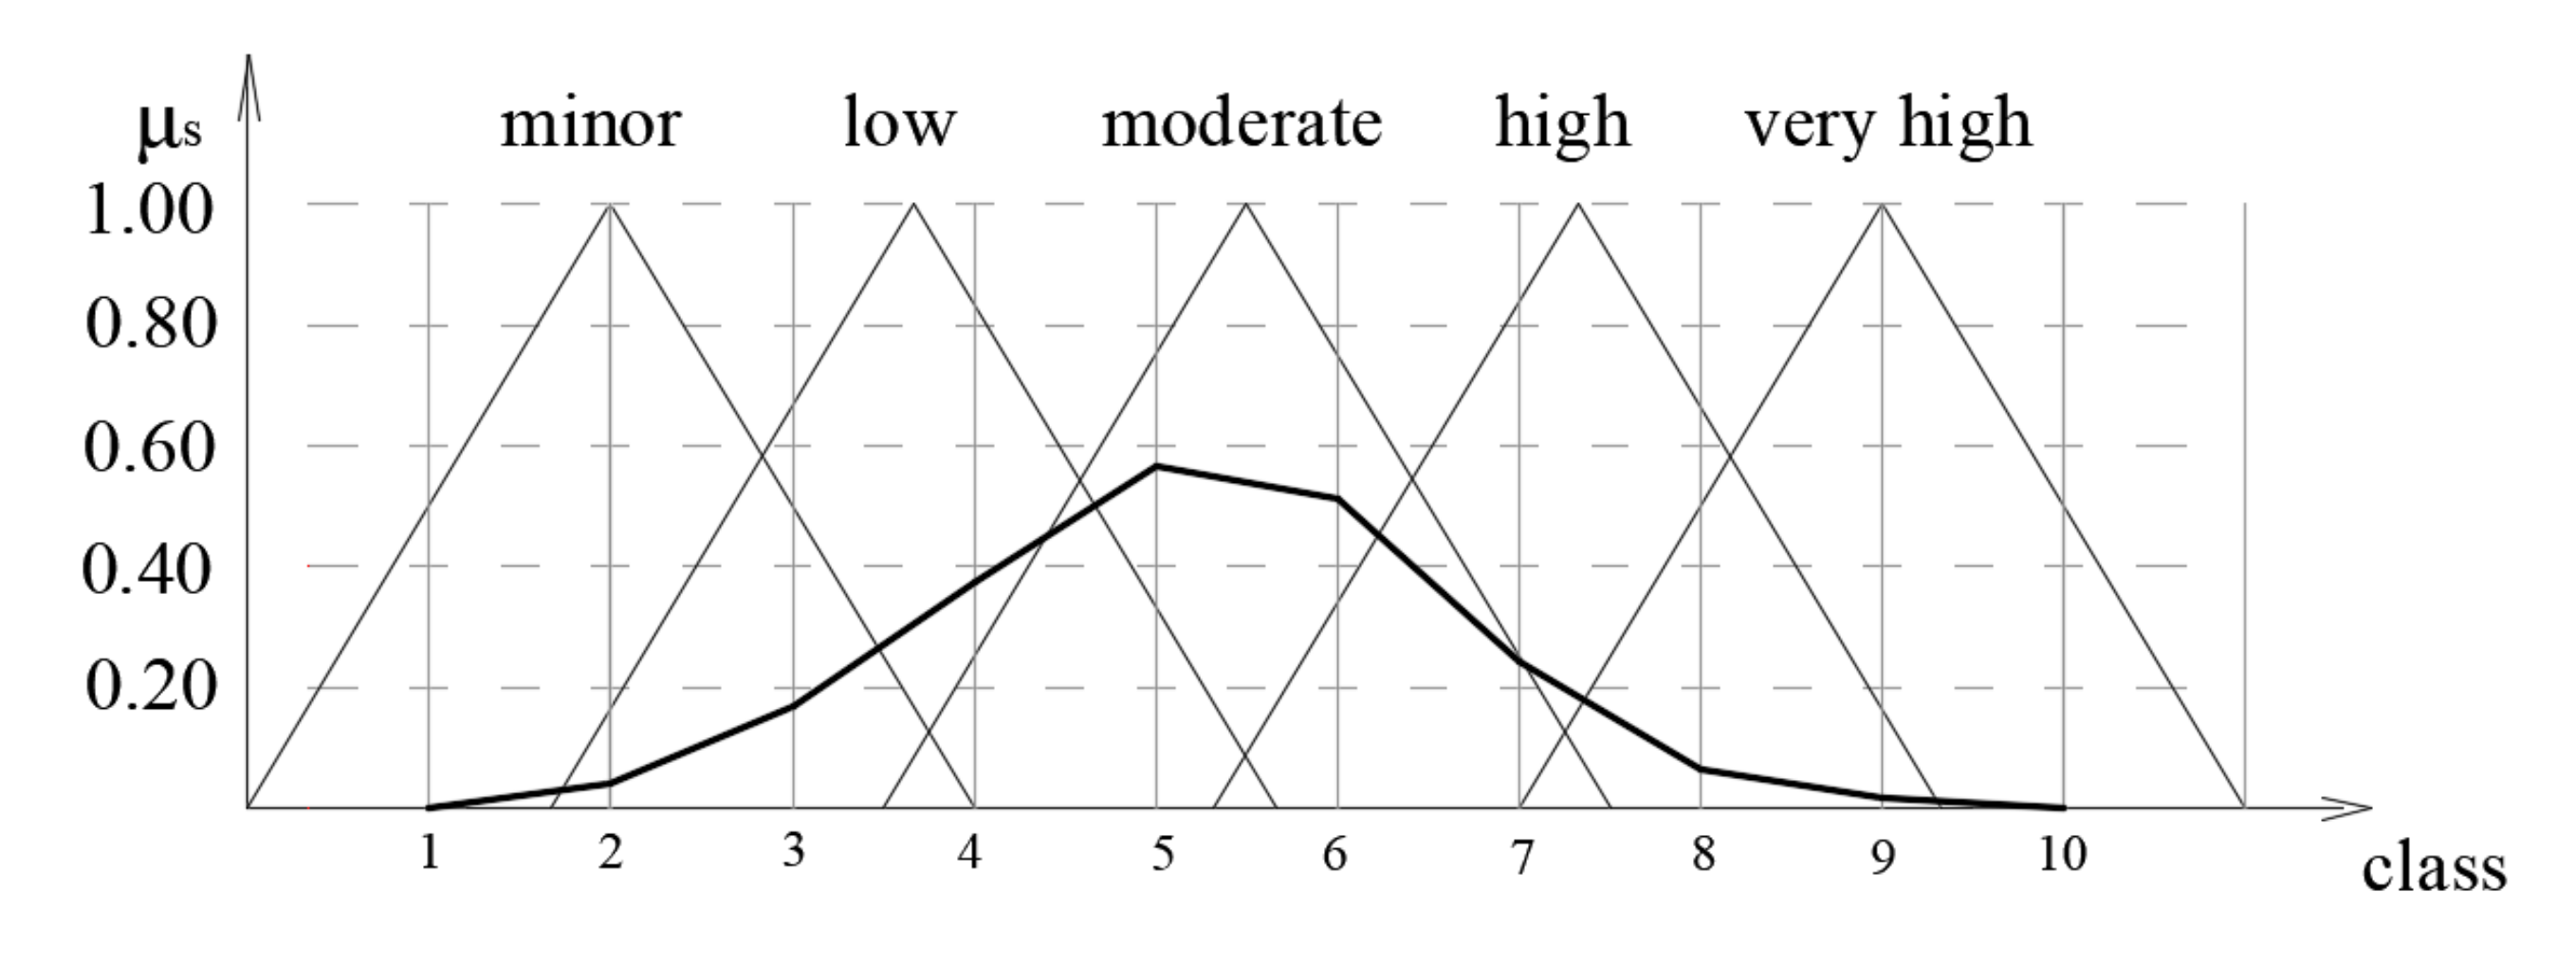
3.2.2. Fuzzification of the Data Obtained Based On Expert Judgment
Fuzzification of the data based on expert judgment was accomplished using the membership degree of the fuzzy sets. The membership degree differs from the membership function, which is identified as µ. Basically, a membership degree shows the percentage of the observed indicator that belongs to the fuzzy set.
A questionnaire was designed for the purpose of fuzzification, where the respondent offered an opinion on the membership degree of a fuzzy set (with the possibility of choosing more than one fuzzy set); however, the total sum of the membership degree had to be one. Respondents were mechanical and electrical engineers and machine operators with more than five years of maintenance work experience.
Table 1 shows the survey results completed by five respondents.
The membership degree of the fuzzy set “moderate” is as follows:
The membership degree of the other fuzzy sets is determined in the same way, which can be seen in
Table 1. The obtained membership degrees should be multiplied by the membership function values. The membership function of the fuzzy set is determined based on
Table 2 and is shown in
Figure 4.
It is possible to start composing risk level indicators with the membership functions obtained for the risk indicators of each corresponding class (in order to assess the risk level).
3.2.3. Fuzzification of Numerical Data
Numerical data on workplace injuries and the environmental pollution caused by failures can be included into the risk indicator assessment model through the fuzzification process.
The impact a failure has on the environment can be ascertained by measuring the amounts of adverse/injurious substances present in the air, soil, and water. The shape of the fuzzy set can be ascertained using the minimal and maximal recorded values and Maximum Permissible Concentrations (MPCs) of harmful substances.
Workplace injuries resulting from the failure of an engineering system or individual components can also be shown by fuzzy sets. Fuzzification can be performed in many ways, depending on the classification.
3.3. Fuzzy Composition upon a Level of Risk Assessment
The synthesis of risk indicators is performed based on appropriate fuzzy composition. According to Kundu [
30], min–max composition is more precise than max–min composition in the sense that there is a concentration of results around the final equivalence when a relation is established.
With a phenomenon that has negative values, such as risk, the resulting concepts that make up the synthesis model represent the worst among the best outcomes. This way, a relatively stronger assessment is obtained, and there will not be a mistake in the risk assessment if necessary precautions are taken. This is the opposite of what happens with phenomena such as safety and reliability, when a max–min composition can be used.
The fuzzy set of risk indicators S, O, and D can be shown via membership function sets in the following way [
31]:
- (i)
The first step in a min–max composition is to determine the maximal number of membership function combinations for the given fuzzy sets. The possible number of combinations for three fuzzy sets is C = j3. If a low number is used for j, problems can occur upon composition because there are gaps in the final result;
- (ii)
Only the combinations whose membership function values are different from zero are taken for further analysis,
µS,O,Dj=1, …, 10≠0, j = 1, …, 10. These combinations are identified as O, where O∈C. The outcomes for such combinations are calculated according to the following formula [
32]:
- (iii)
The maximum values for µS,O,D combination are determined for the obtained combinations:
- (iv)
The combinations are sorted in the end according to the outcome, and minimum is required for each outcome among the predetermined maximums.
The level of risk assessment is finally defined in the form:
3.4. Identification–Defuzzification
After the min–max composition is applied, it is necessary to transform the (nine) obtained fuzzy sets into a form that defines the membership degree, that is, the membership function of the defined fuzzy sets. The best-fit method (Least Squares Method) is the appropriate procedure to determine the membership function of specific fuzzy sets [
33]:
j = 1, ..., 10; H
i = {minor, low, moderate, high, very high}, where H is a set of linguistic variables used to describe the risk level.
In Formula (11), αi represents the relative distance compared to the lowest distance di min (obtained from the given fuzzy sets). Normalization of the relative distances is done in order to acquire the membership degree of the risk assessment of the fuzzy set, whose values are 0 ≤ β ≤ 1.
The normalization of the relative distances is obtained based on the following formula:
The level of risk of failure for elements in engineering systems can be expressed in the following way:
4. Case Study
Completing a risk assessment for component failures in a technical system is based on the state of the machinery at the time it is observed (in this study, we did this in the context of the exploitation of mineral resources and mineral processing). The condition of the machines is examined through an analysis of existing data on the operation of the machine, including failures that have occurred during the observed period of time. Data on recorded accidents, causes, and the consequences due to a failure are the starting point for the establishment of an adequate model for risk assessment.
The proposed model for risk assessment of failures in engineering systems in the mining industry and the impacts of the risky event is based on the rules of fuzzy algebra. The fuzzy model for risk of failure assessment includes the following:
A risk assessment of partial indicators of element failure;
A risk level synthesis assessment of element failure;
A hierarchical synthesis of risk assessments for the technical system.
A risk level assessment of subsystem failure is a synthesis assessment based on a risk assessment of elements using min–max composition. A risk level assessment of an entire system failure is done using risk level assessments of subsystem failures using min–max composition as well.
As an example, we used the model of fuzzy sets and fuzzy logic to determine the risk level of failure of a mobile crushing machine, the “Lokotrack LT 1213S”, which is manufactured by “METSO MINERALS”. The crushing machine is used for the secondary crushing of stone aggregate at the quarry “Ladne vode”, near Petrovac na Mlavi, Serbia. This mobile crushing machine operates in the system “excavator–primary crushing machine–crushing machine (“Lokotrack 1213S”)”, which was one reason we adopted this example to present the proposed model for risk assessment. The downtime period for this crushing machine requires that the process of stone aggregate grinding be stopped. This machine is significant in exploitation and in the processing of stone aggregate, which was another reason it was chosen to depict the developed model for risk assessment. The third reason was that the company maintains excellent and systematic records on machine failures.
4.1. Decomposition of the System
A systematic approach to the risk of machine failure assessment requires expert and systematic decomposition of the system. The omission of one seemingly irrelevant subsystem or machine component can adversely impact the functionality of the risk assessment model, as well as the final results. In order to analyze and evaluate the risk level of failure in an engineering system using this methodology, it is necessary to rationally divide the system into subsystems and the subsystems into elements—that is, into functional units that each affect the risk indicators. The engineering system (the crushing machine) was divided into eight subsystems: the hydraulic, engine, electrical, crushing, screening, transport, construction, and feeder subsystems.
For each crushing machine subsystem, the indicators were analyzed and the level of risk was assessed for five characteristic failures. These characteristic failures were based on data on the types of failures that occur within the subsystems and elements.
4.2. Data Collection
Data related to the type of failure and the time between failures were obtained from a thorough analysis of the documentation acquired from the quarry, and they were classified according to the subsystems of the crushing machine. It was found that there were about 330 failures over the two-year period, which is worrying.
Risk indicators that could not be obtained from the statistical data were procured by surveying the employees who worked in the machine maintenance department at the quarry production system. A questionnaire was prepared for each type of failure that included the following indicators:
The impact of a failure on the health and safety of employees working on the crushing machine;
The impact of a failure on the environment;
The probability of the detection of a failure at an opportune time with regular inspection of the machine.
5. Results and Discussion
The proposed model was used to obtain a risk level assessment of failure of the elements in the subsystems based on three risk indicators of failure. For this, we used min–max composition and fuzzy logic reasoning. The following indicators were analyzed for each individual failure:
Severity (the negative impact of a failure on machine functionality, employee safety and health, and the environment), S;
Occurrence, O;
Detectability, D.
Due to the extensive results acquired using the risk assessment model, the methods and techniques used for the risk assessment of one element, subsystem, and technical system are presented in this paper.
5.1. Failure Risk Assessment of Elements in a Subsystem Using Min–Max Composition
5.1.1. Determination of Failure Severity Indicators
Failure severity represents the negative impact a failure has on the functionality of a system and on the environment. The severity of an accident, i.e., the impact on the entire system from the damage caused by a failure of one part of the system, was examined through three indicators:
The time needed for the repair, St;
The impact of the failure on the employees, e.g., the negative effect on employee health and safety, Sw;
The impact of the failure on the environment, Se.
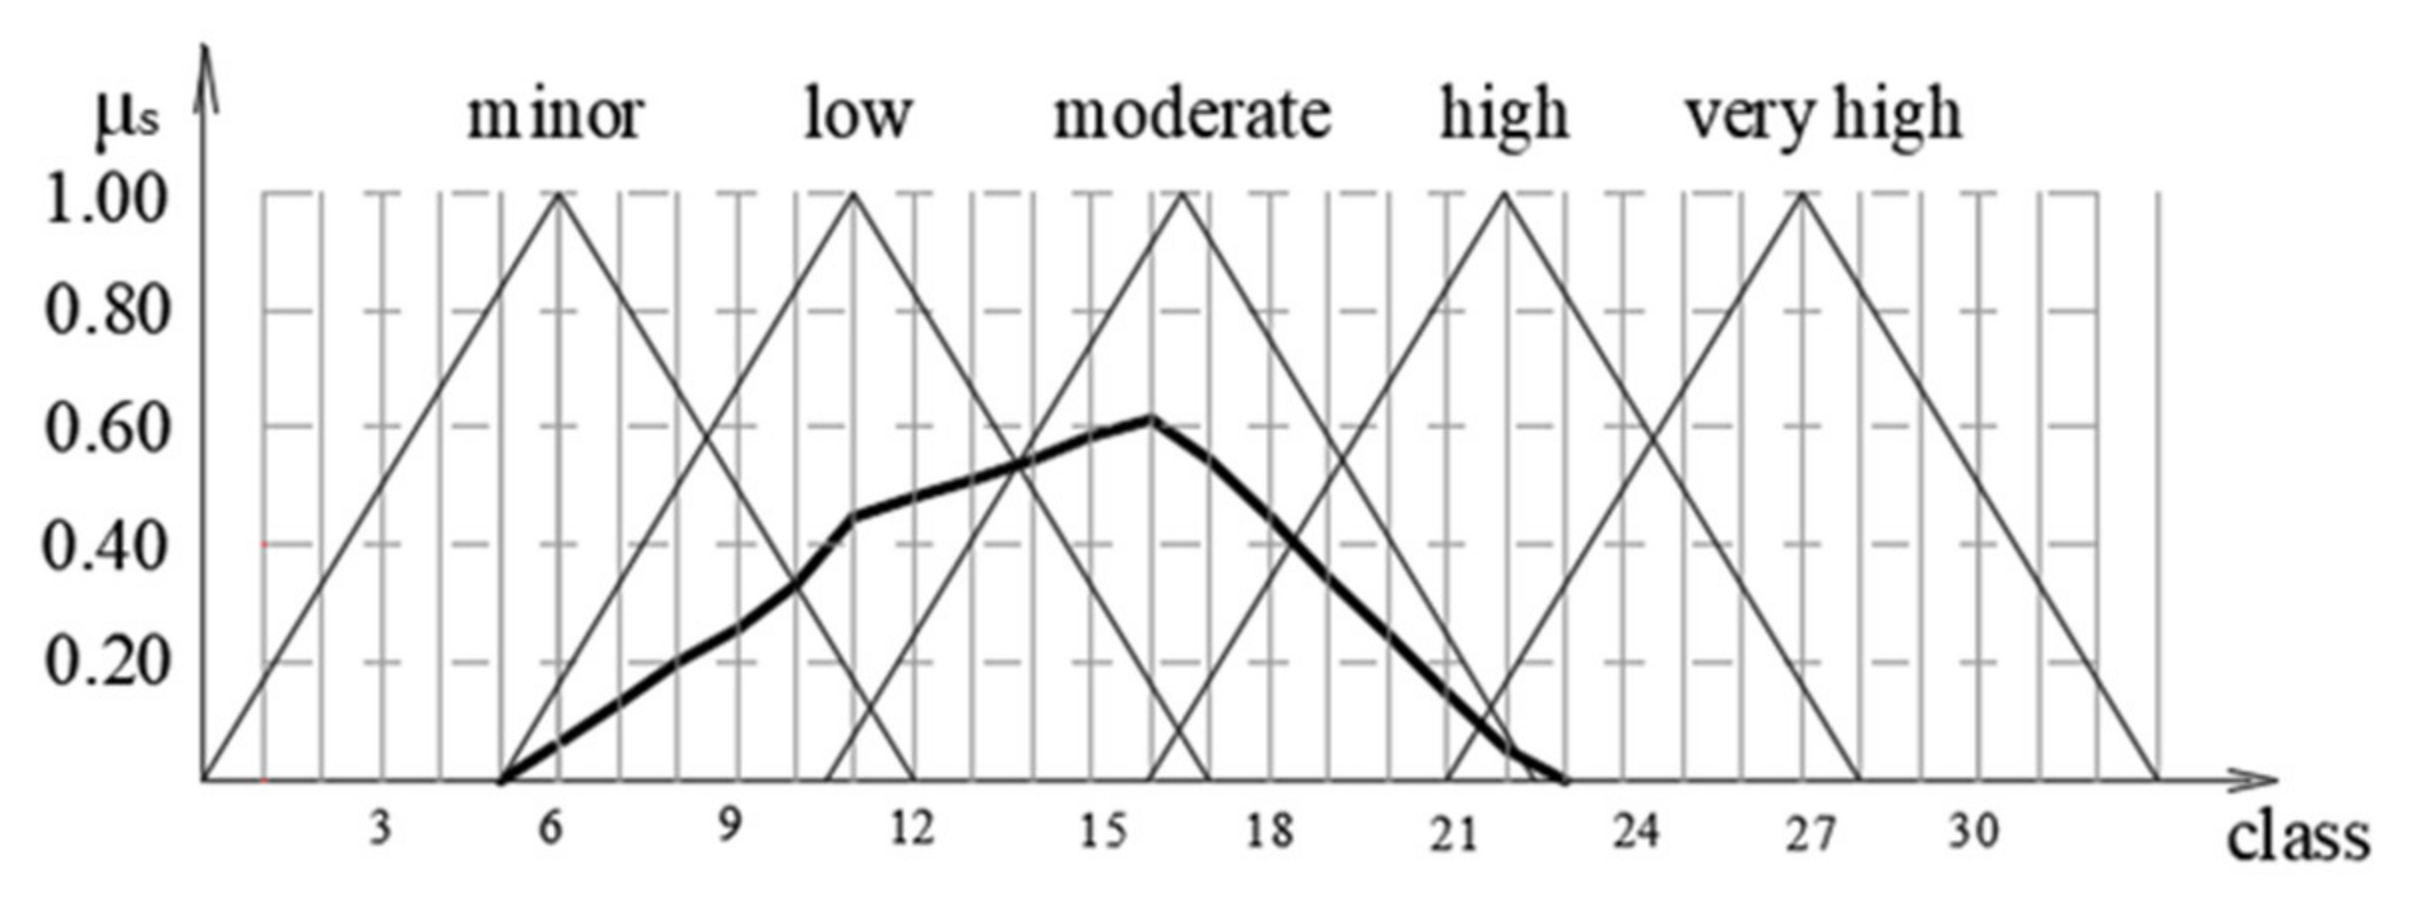
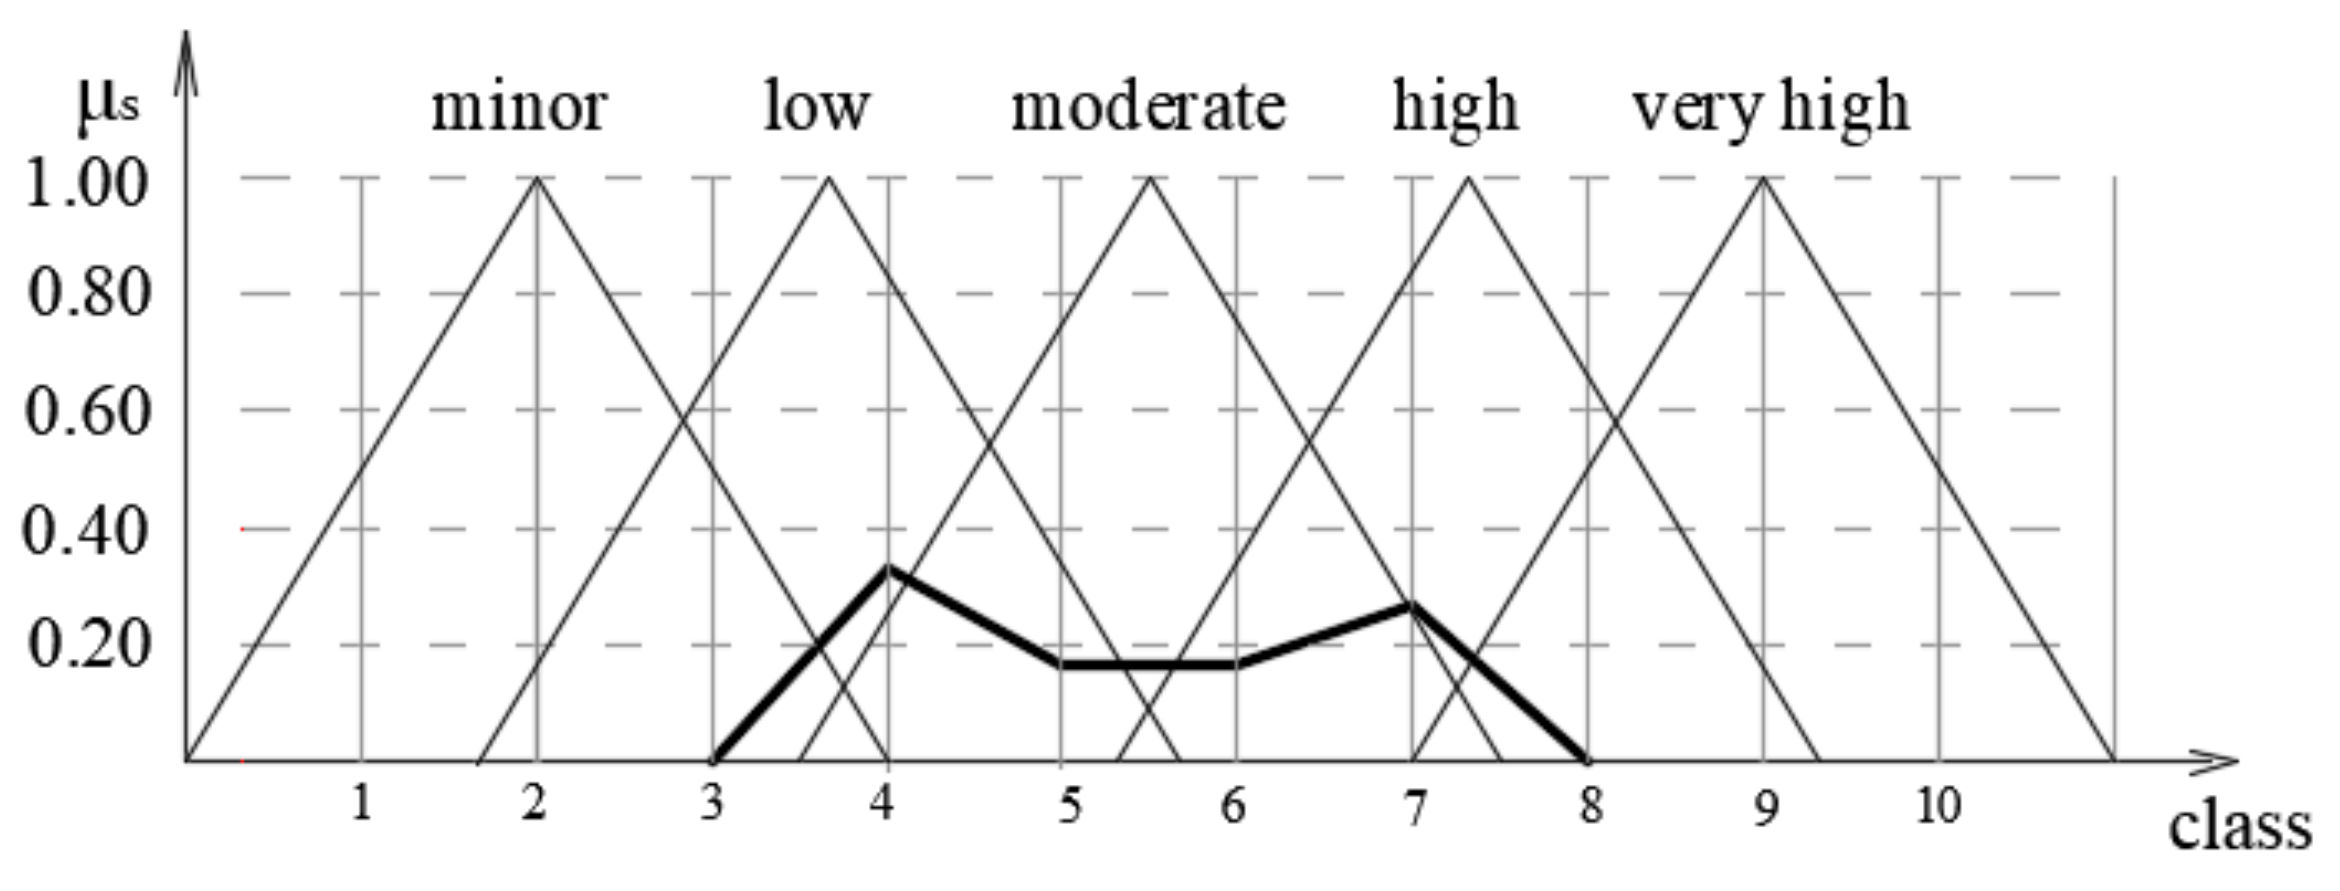
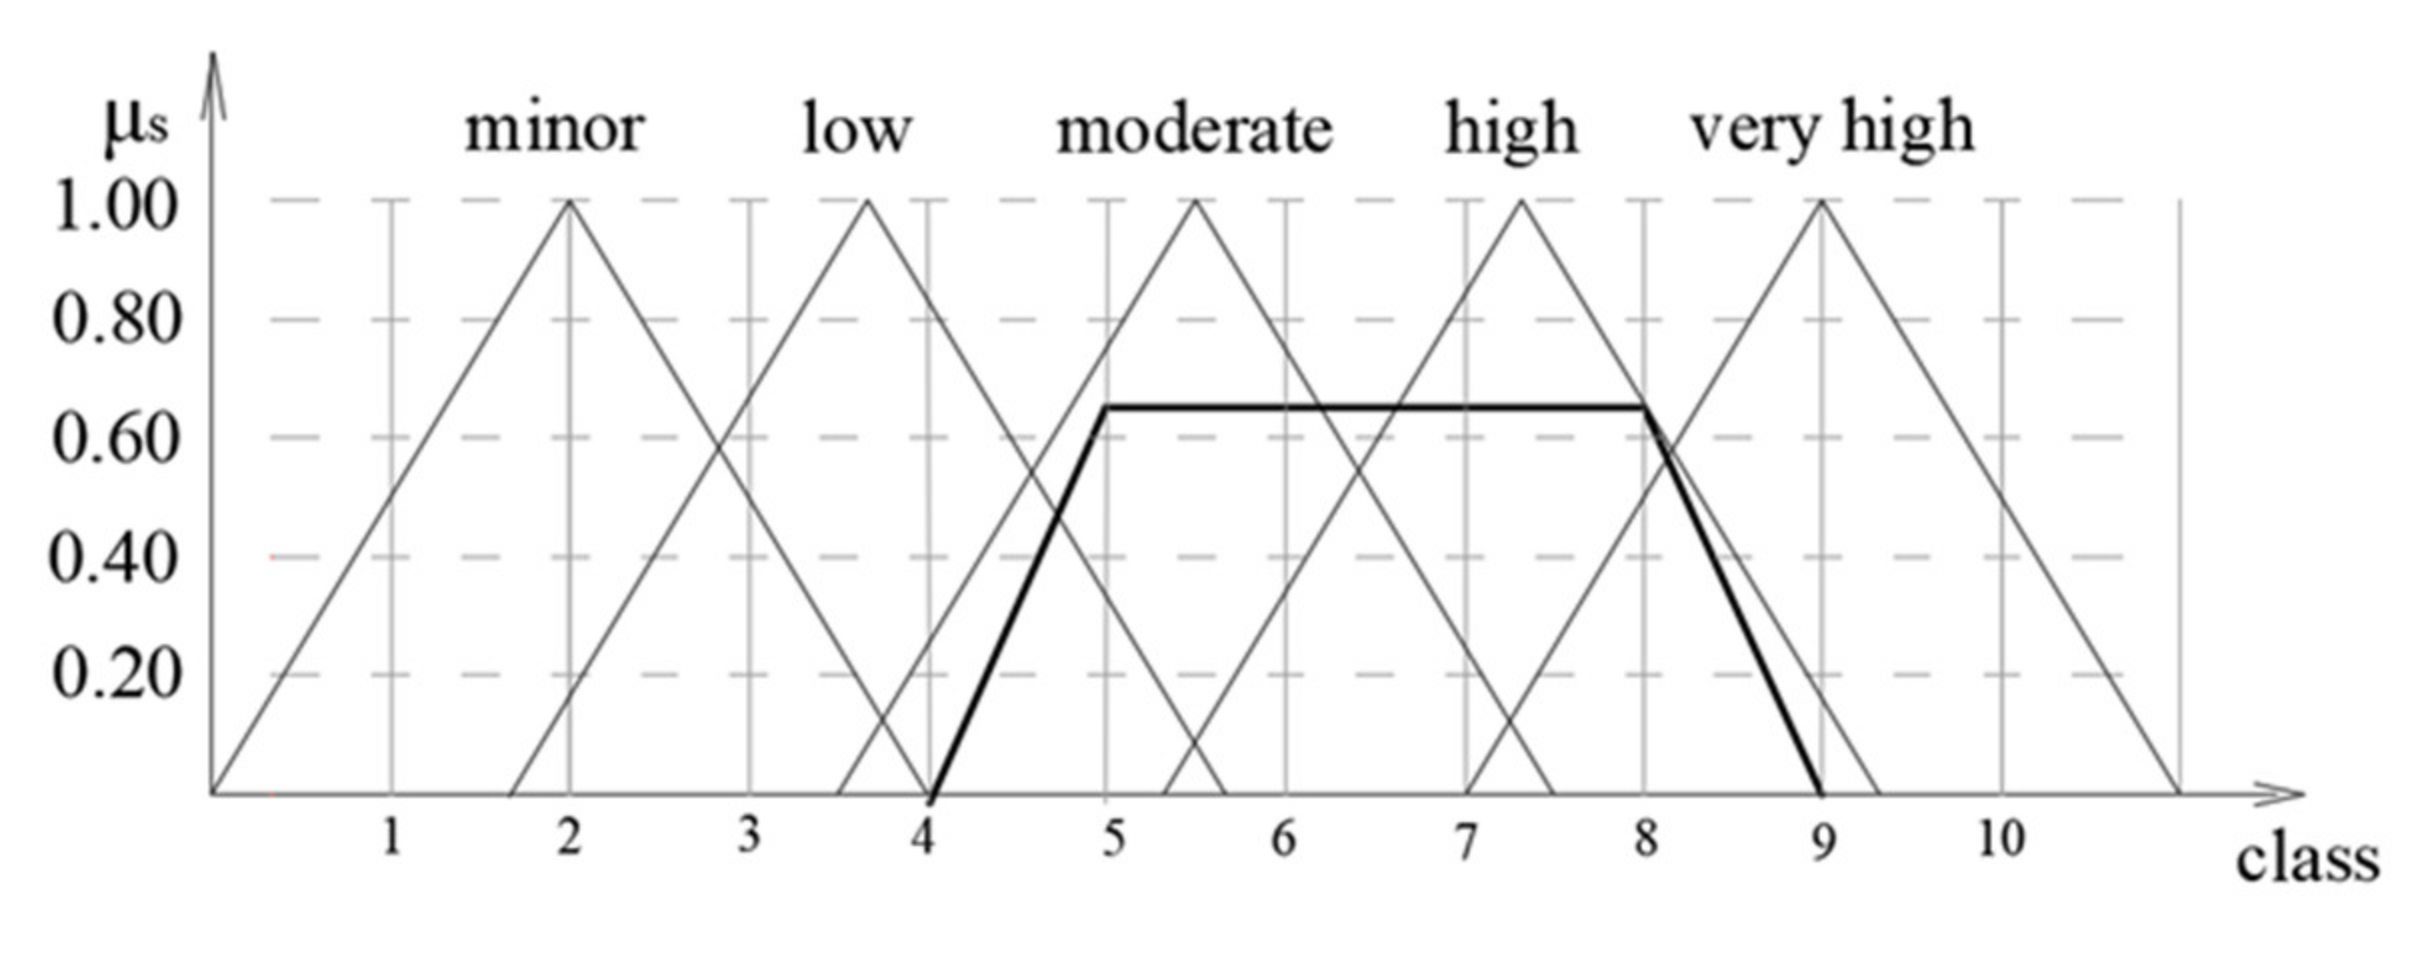
Failure severity is defined by the following fuzzy sets: minor, low, moderate, high, and very high. The term “minor” represents failures that do not have an impact on the operation of a system, while the term “very high” describes failures that cause enormous damage to a system, affecting repair costs and causing production delay. Appropriate classes (from one to 10) were allocated to the fuzzy sets, where classes nine and 10 describe failures that cause extreme damage to the system, the entire process, and the environment, while classes one and two describe failures with minimal impact. The fuzzy sets of failure severity (the impact of damage) are shown in
Figure 4.
Min–Max Composition of Failure Severity Indicators
A min–max composition was done for the three fuzzy sets of the failure severity indicators (St, Sw, and Se) in order to acquire the failure severity fuzzy set.
The membership functions for the fuzzy sets were combined by combining one element from each set. There were j
3 = 30
3 = 27,000 such combinations, where
j represents the number of classes. The number of combinations where at least one membership function was equal to zero was subtracted from the total number. The number of membership function combinations with values that were not zero was 2431. The maximum value and other results for these combinations were obtained according to the procedure described in
Section 3.3. In order to obtain the fuzzy set of failure severity, the lowest value for each result was taken from the maximum obtained. At this point, the composition was complete. The min–max composition provided values for the failure severity of the membership functions (
Figure 8).
For a risk level assessment of the failure of subsystem components, 10 classes were taken. Because of this, it was necessary to map the failure severity assessment, which had 30 classes, into 10 classes. This could be achieved by using the value of every third class, e.g., the value of the membership function of class three was used as a value for class one, and the value of the membership function of class 6 was used for the value for class two.
Using the procedure described above, a failure severity final fuzzy set was obtained, which took the following form:
Figure 9 shows the final form of the failure severity membership functions for the main computer.
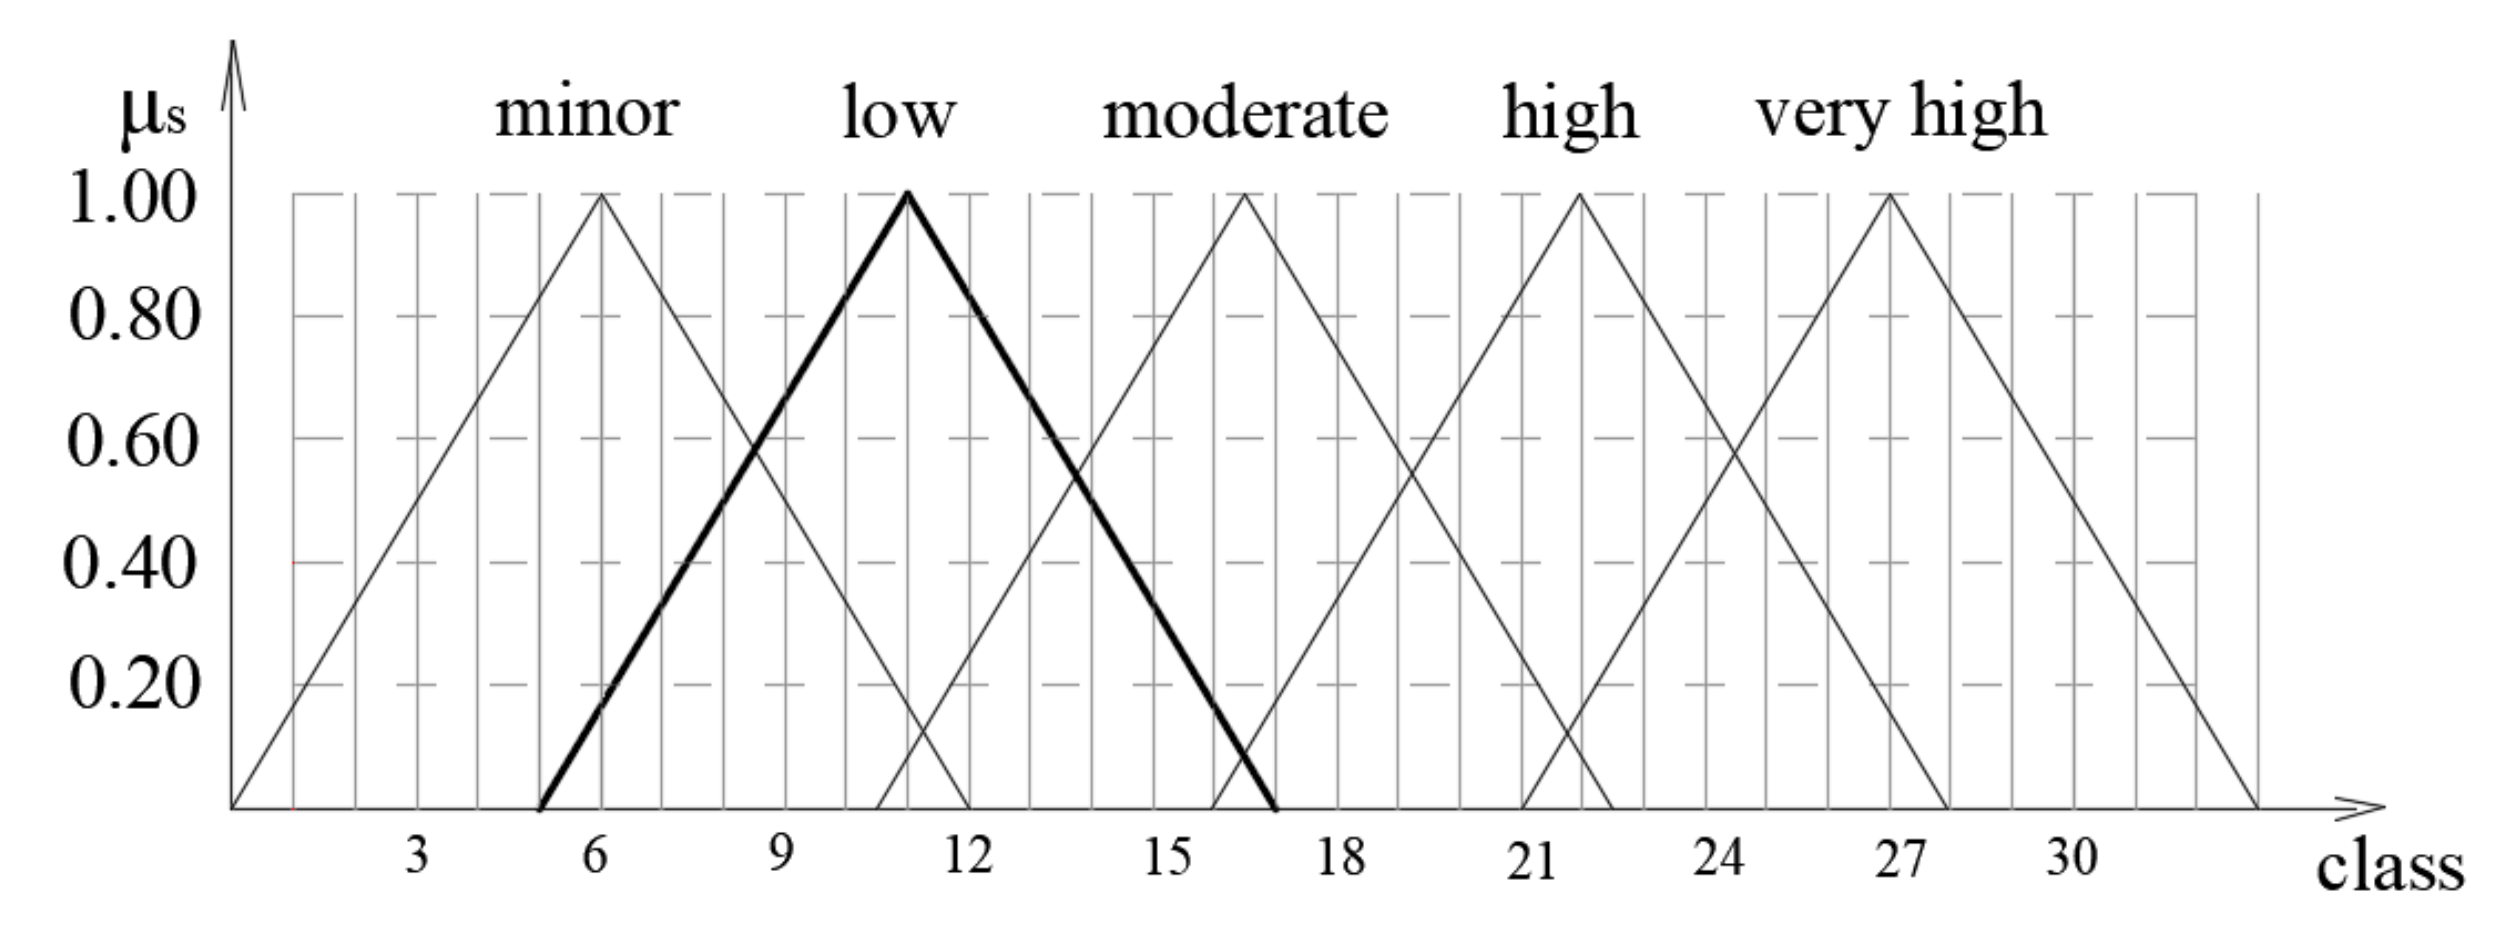
5.1.2. Fuzzification of the Frequency of Failure
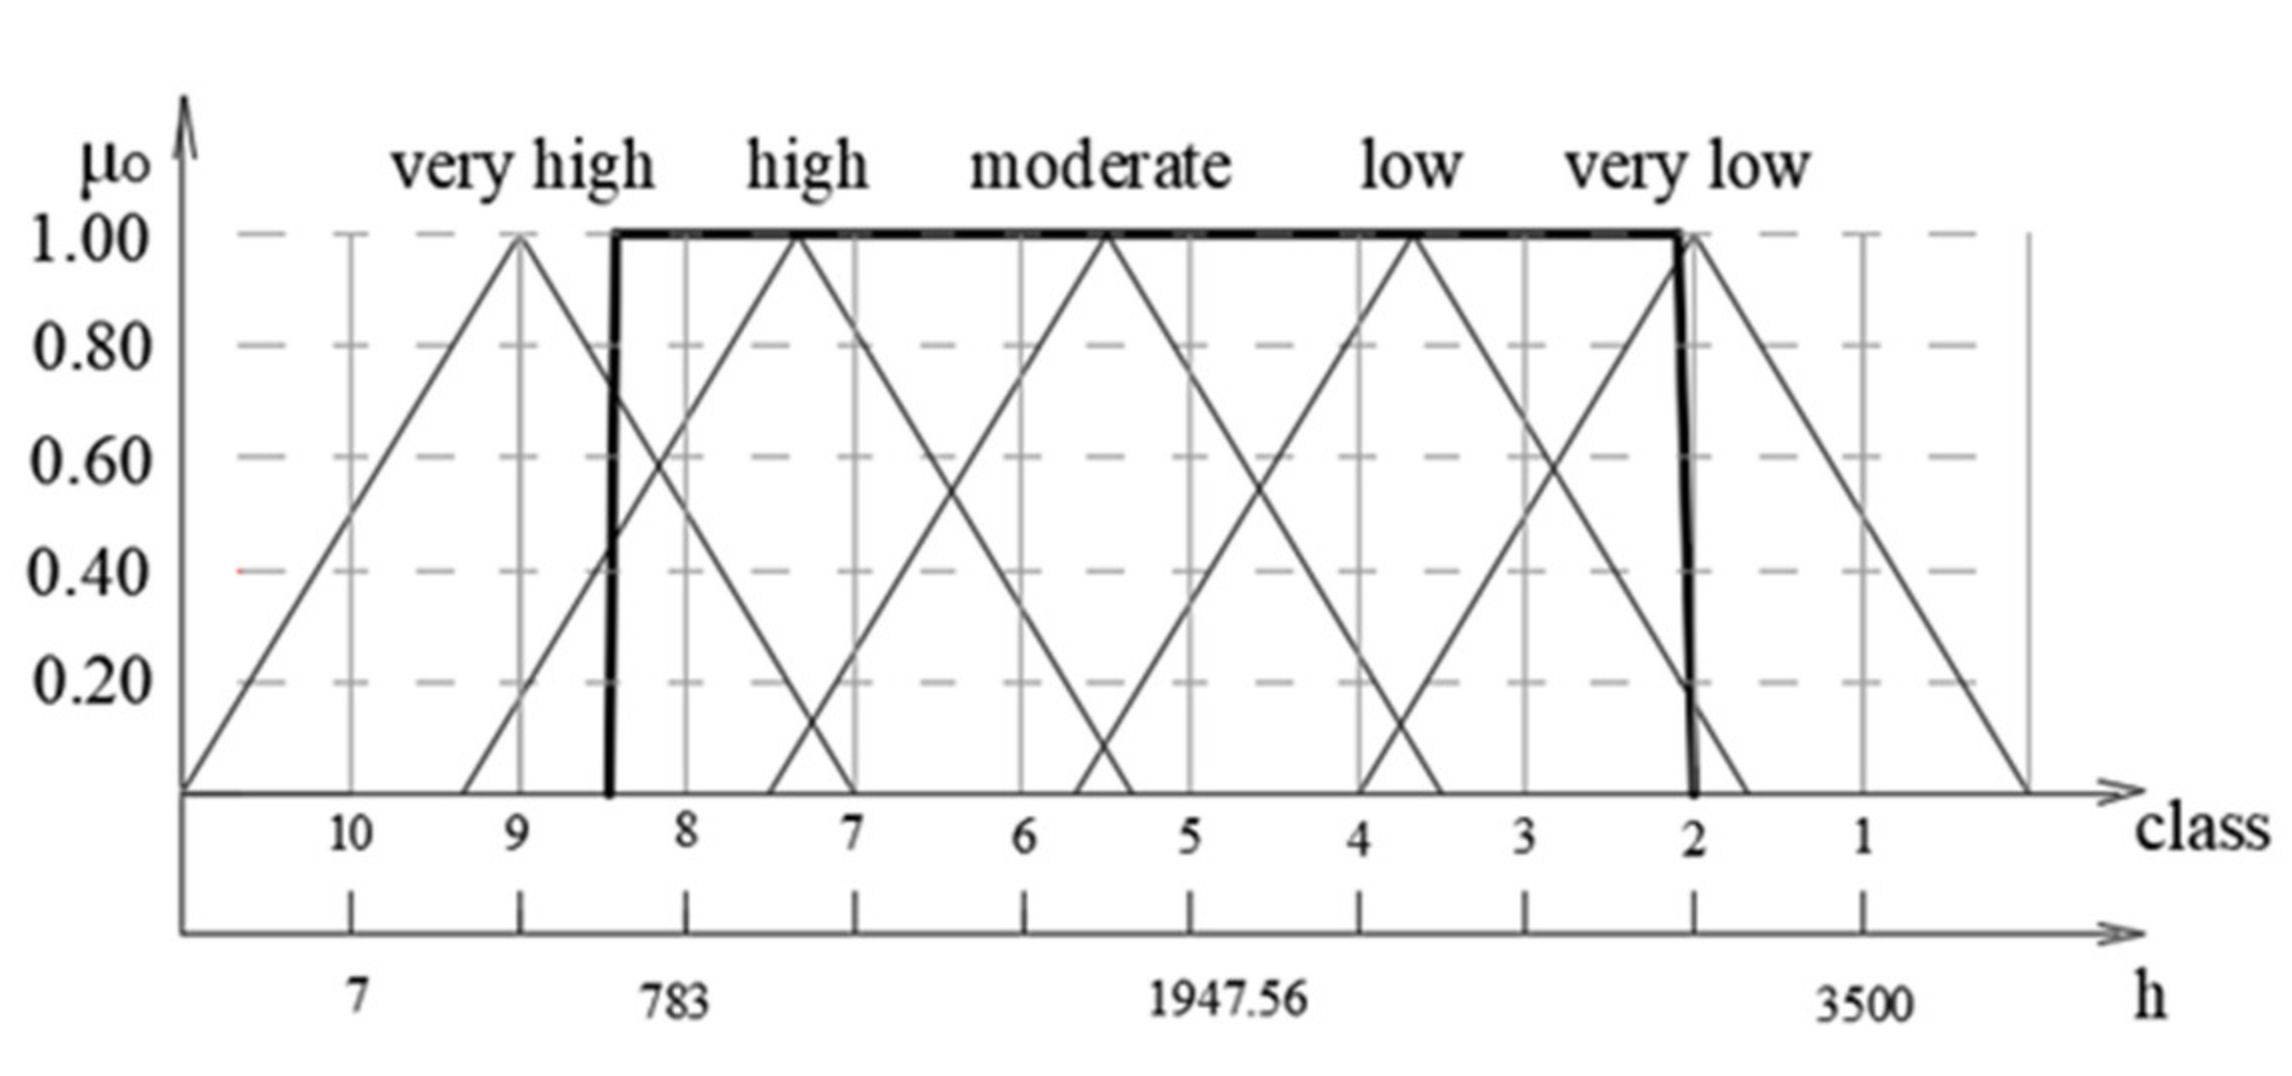
Another risk indicator was the frequency of failure. This could be determined using the recorded failures for the system being analyzed. In addition, five fuzzy sets for the frequency of failure were defined: very low, low, moderate, high, and very high. A “very high” frequency was adopted for an event that occurred almost every day or every day, while failures that happened after 3000 working hours were put into the “very low” frequency class. The values awarded for the classes in the fuzzy sets for this indicator were 10 to one. The order was reversed in order to easily determine the labor hours for each class. class 10 was assigned a time period of 7 h, which was the shortest time the crushing machine system operated between failures, while class one was assigned a time period of 3500 h, which was the longest operating time between two failures of the same type.
The time to repair the machine went through the process of fuzzification according to the procedure given in
Section 3.2.1, and the data for the elements of the subsystem hydraulics are given in
Table 12. The membership function is shown in
Figure 10 (using the data fuzzification).
In
Figure 10, the membership function of the frequency of failure is in the following form:
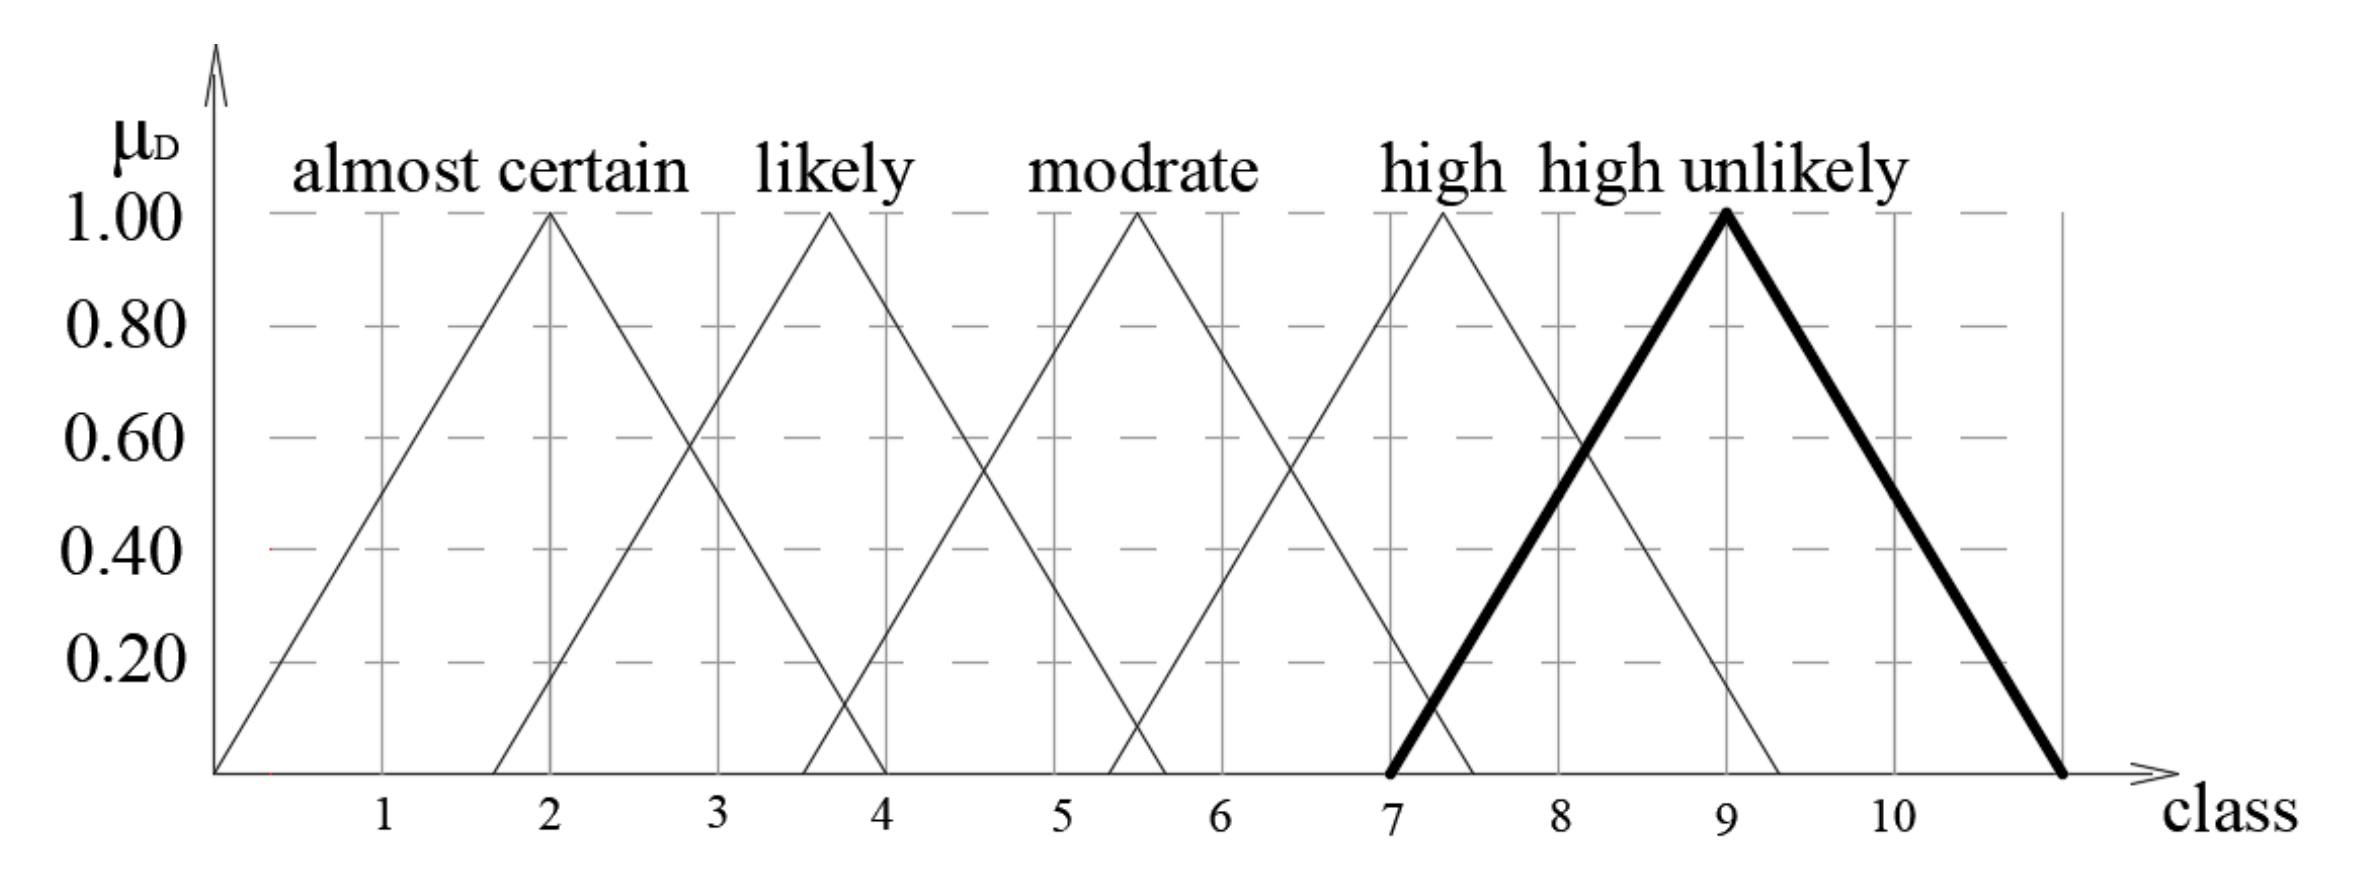
5.1.3. Fuzzification of the Probability of Detecting a Failure
Detecting potential machine failures is only possible with years of work experience in maintaining the analyzed system. Fuzzy sets of the probability of detecting a failure were formed with the following linguistic variables: almost certain, likely, moderate, remote, and impossible. The fuzzy set “almost certain” included failures that could be predicted based on the way the system operated. Events or failures that could not be detected before they occurred were included in the fuzzy set as “impossible”. The classes of probability of detecting a failure were assigned numerical values from one to 10 (
Figure 11).
The possibility of detecting potential failures before they occur is an indicator that can only be determined based on experience. As with the failure severity indicator, a survey was conducted, in which maintenance workers completed the questionnaire described in
Section 3.2.2.
The indicator of the probability of detecting a failure went through the same process of fuzzification as the indicators of the impact of a failure on employees and the environment did. The acquired values for the membership degree were multiplied by the membership functions for each linguistic variable, and by adding the membership functions by class, the fuzzy set of the probability of detecting a failure was obtained.
The acquired membership functions of the fuzzy sets of risk indicators were mapped and are shown in
Figure 11.
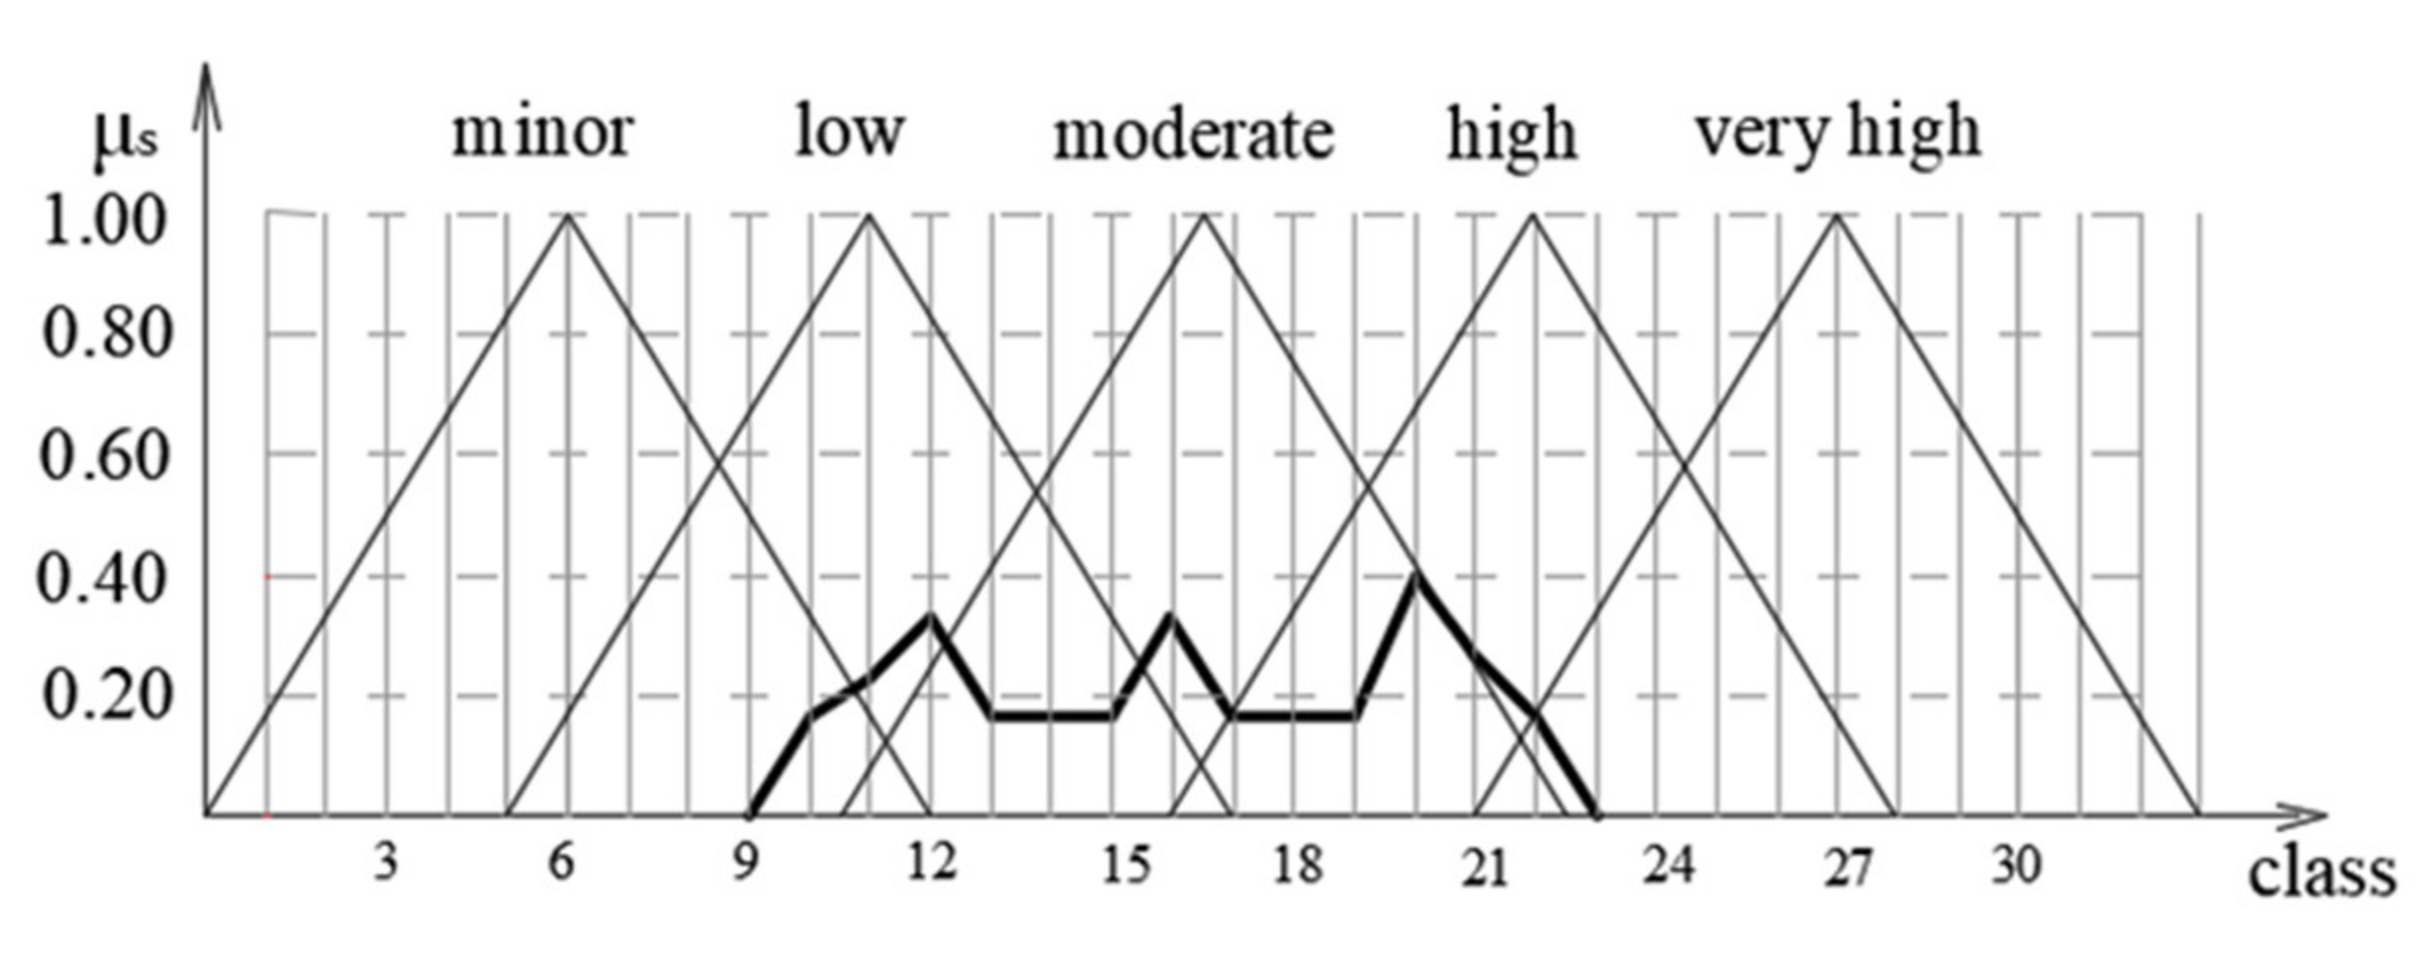
5.1.4. Failure Risk Assessment for Elements in Subsystem Using Min–Max Composition
A risk level assessment for the elements in a subsystem was done based on a symmetric min–max composition of the analyzed risk indicators: failure severity, frequency of occurrence, and the ability to detect a failure. The min–max composition of the fuzzy sets was applied to each of the three obtained membership function sets (S, O, and D). The first step of the composition was to determine the maximum number of membership function combinations, j = 10
3 = 1000, where j is the number of classes. Combinations in which at least one membership function was zero were subtracted (
Figure 9,
Figure 10 and
Figure 11). The number of membership function combinations where the membership functions were not zero was 72. The maximum value and other results for these combinations were obtained according to the procedure described in
Section 3.3. In order to obtain a fuzzy set of the level of risk for the elements in the system, the minimum value of each outcome was taken from among the maximum values. At this point, the composition was complete. The min–max composition provided values for the membership functions of the failure risk of the elements in the system (for the main computer).
Figure 12 shows a graphical representation of the fuzzy sets of the risk level for the main computer.
5.2. Risk Level Assessment of Subsystem Failure
A risk level assessment for subsystem failure was done based on the failure risk assessments of five specific elements. The fuzzification of the input data was not needed in this case because the input data were the fuzzy sets of the risk of failure of the elements in the subsystem, which were obtained from the risk assessments of the elements.
A min–max composition was also applied in this case, because it allowed for the recognition of the worst among the best—that is, a result was obtained for the class with the highest risk level. The risk level assessment for subsystem failure had the following form:
To estimate the risk level of subsystem failure, a min–max composition was performed for five fuzzy sets that were representative of a level-of-risk assessment for the elements in a subsystem. The procedure was the same one used for the previous compositions and was done in MS Excel. The procedure was also the same as the one used for the three fuzzy sets. Of the total possible membership function combinations (100,000), the composition only included those combinations where the membership function was not zero (1200). The risk level assessments for the elements in a subsystem failure (five fuzzy sets) had the following values:
Using the min–max composition, the fuzzy set for a failure risk assessment of the subsystem “electrical subsystem” was acquired (
Figure 13).
By applying a decomposition procedure, which was the same as the procedure used for the risk assessment of elements, the membership degree of risk for a specific fuzzy set was determined. For the “electrical” subsystem, the risk level assessment had the following form:
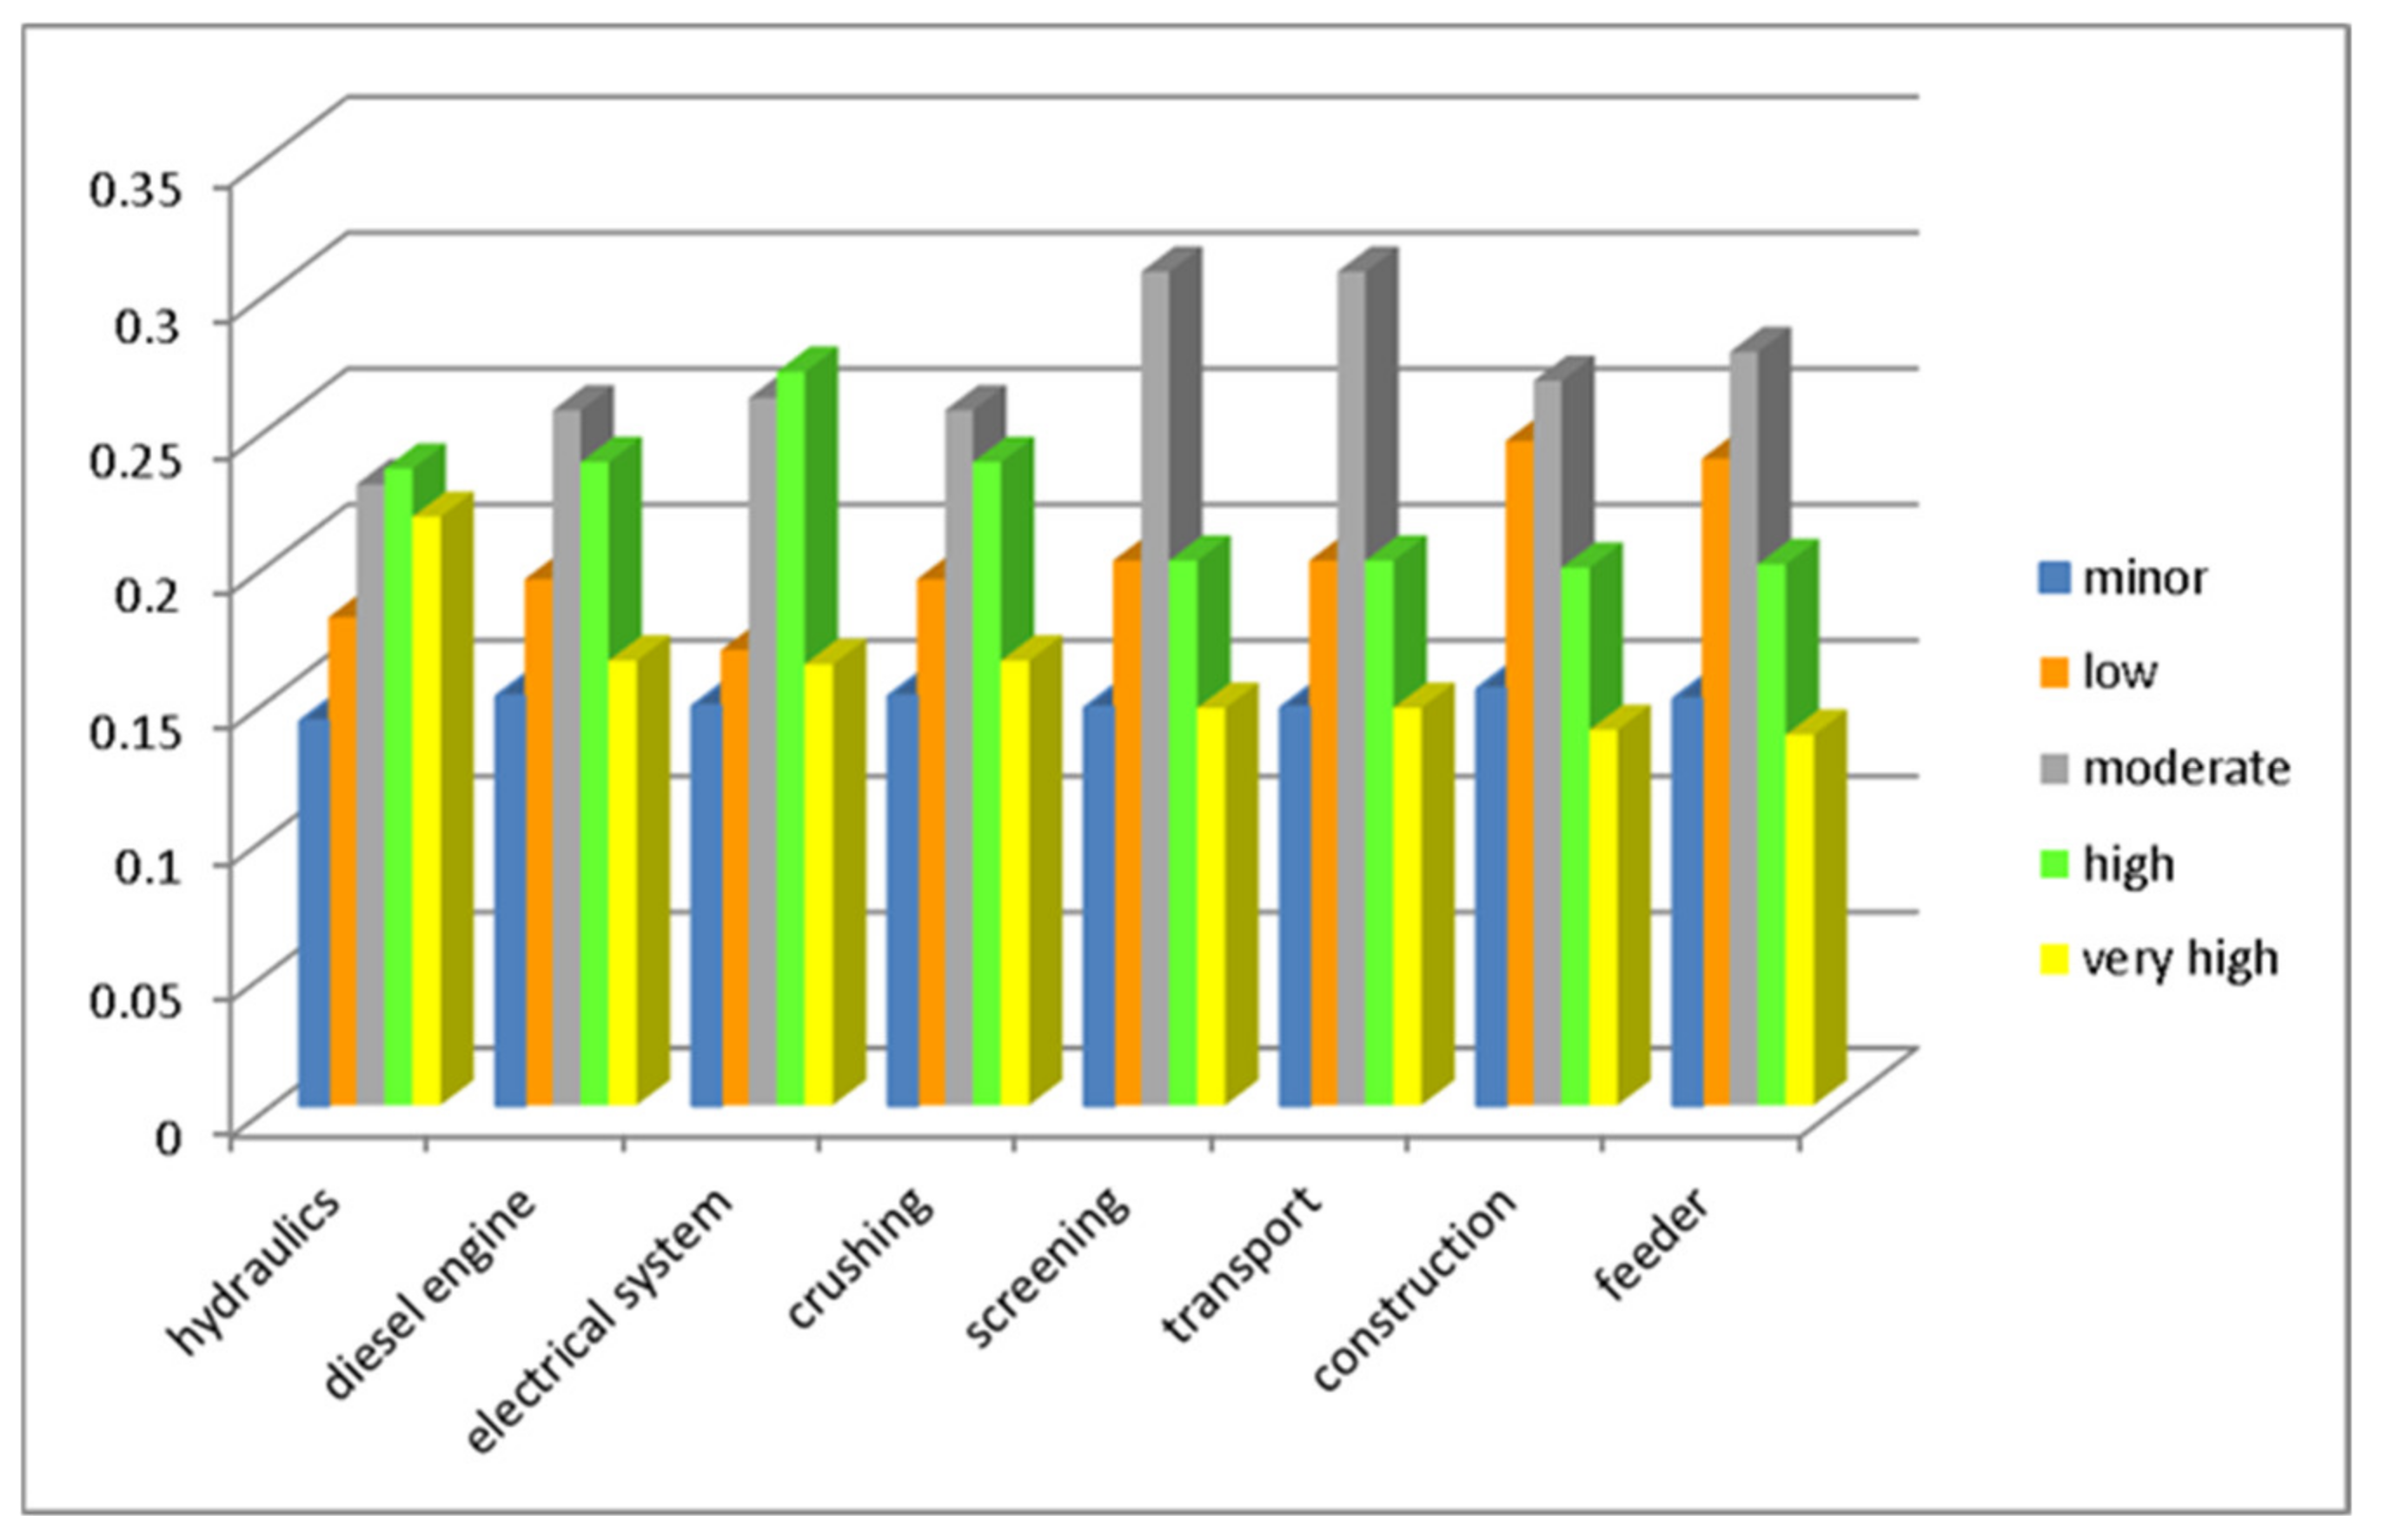
The results for the failure risk assessment for a subsystem of the mobile crushing machine are shown in
Table 13 and
Figure 14, and they represent the results of a comprehensive evaluation based on the failure risk of the elements of each individual subsystem.
The failure risk level of the subsystem was determined on the basis of a risk assessment of elements in the subsystem. The risk level was established for five typical types of failure in each of the eight subsystems.
A comprehensive failure risk assessment for the subsystem was completed using a min–max composition of fuzzy sets (for the risk of failure of a single element). The results were in the “moderate” category, except for the subsystems “hydraulics” and “electrical system”, which were in the “high” category. For the subsystem “engine”, the first lower value for the membership degree was “high”, which was a sufficient indicator of the risk trend. The subsystems for crushing and transport had the same failure risk level, with the same membership degree of 0.30672, or 30.67%.
5.3. Risk Level Assessment of System Failure
5.3.1. Fuzzy Composition for Risk Level Assessment of System Failure
A risk level assessment for system failure within the crushing machine was performed as a synthesis assessment of the risk level of subsystem failures. The input data used for this risk assessment were the fuzzy sets from the failure risk assessments for the subsystems, so fuzzification of the input data was not needed in this case. A min–max composition was also applied in the synthesis assessment of the risk level of system failure. The reason for this was given at the beginning of this section. Due to the high number of membership function combinations for the eight subsystems of the crushing machine C = j8, where j = 10 (100,000,000 combinations in total), a reduction in the number of classes in the fuzzy sets of the failure risk assessments of the subsystems was required. The fuzzy sets of the failure risk assessments of the subsystems were mapped from j = 10 to j = 5 by using the value of every second membership function, e.g., the value of the membership function of class two was used as the value for class one, and the value of the membership function of class four was used as the value for class two.
Fuzzy sets of failure risk assessment of subsystems:
redefined as the following fuzzy sets:
A min–max composition was done for such redefined fuzzy set of the failure risk assessments of the subsystems for which the total number of combinations was C = j8 (that is, 390,625 combinations, where j = 5. Of this number, 864 membership function combinations whose value was not zero were taken for the assessment.
The order in which fuzzy sets of indicators will appear during an assessment is not important when the risk indicators have the same impact on the risk level. Using a min–max composition, the fuzzy set for the failure risk of the entire engineering system of the mobile crushing machine was obtained:
A graphical representation of the fuzzy set of the failure risk of the mobile crushing machine is shown in
Figure 15.
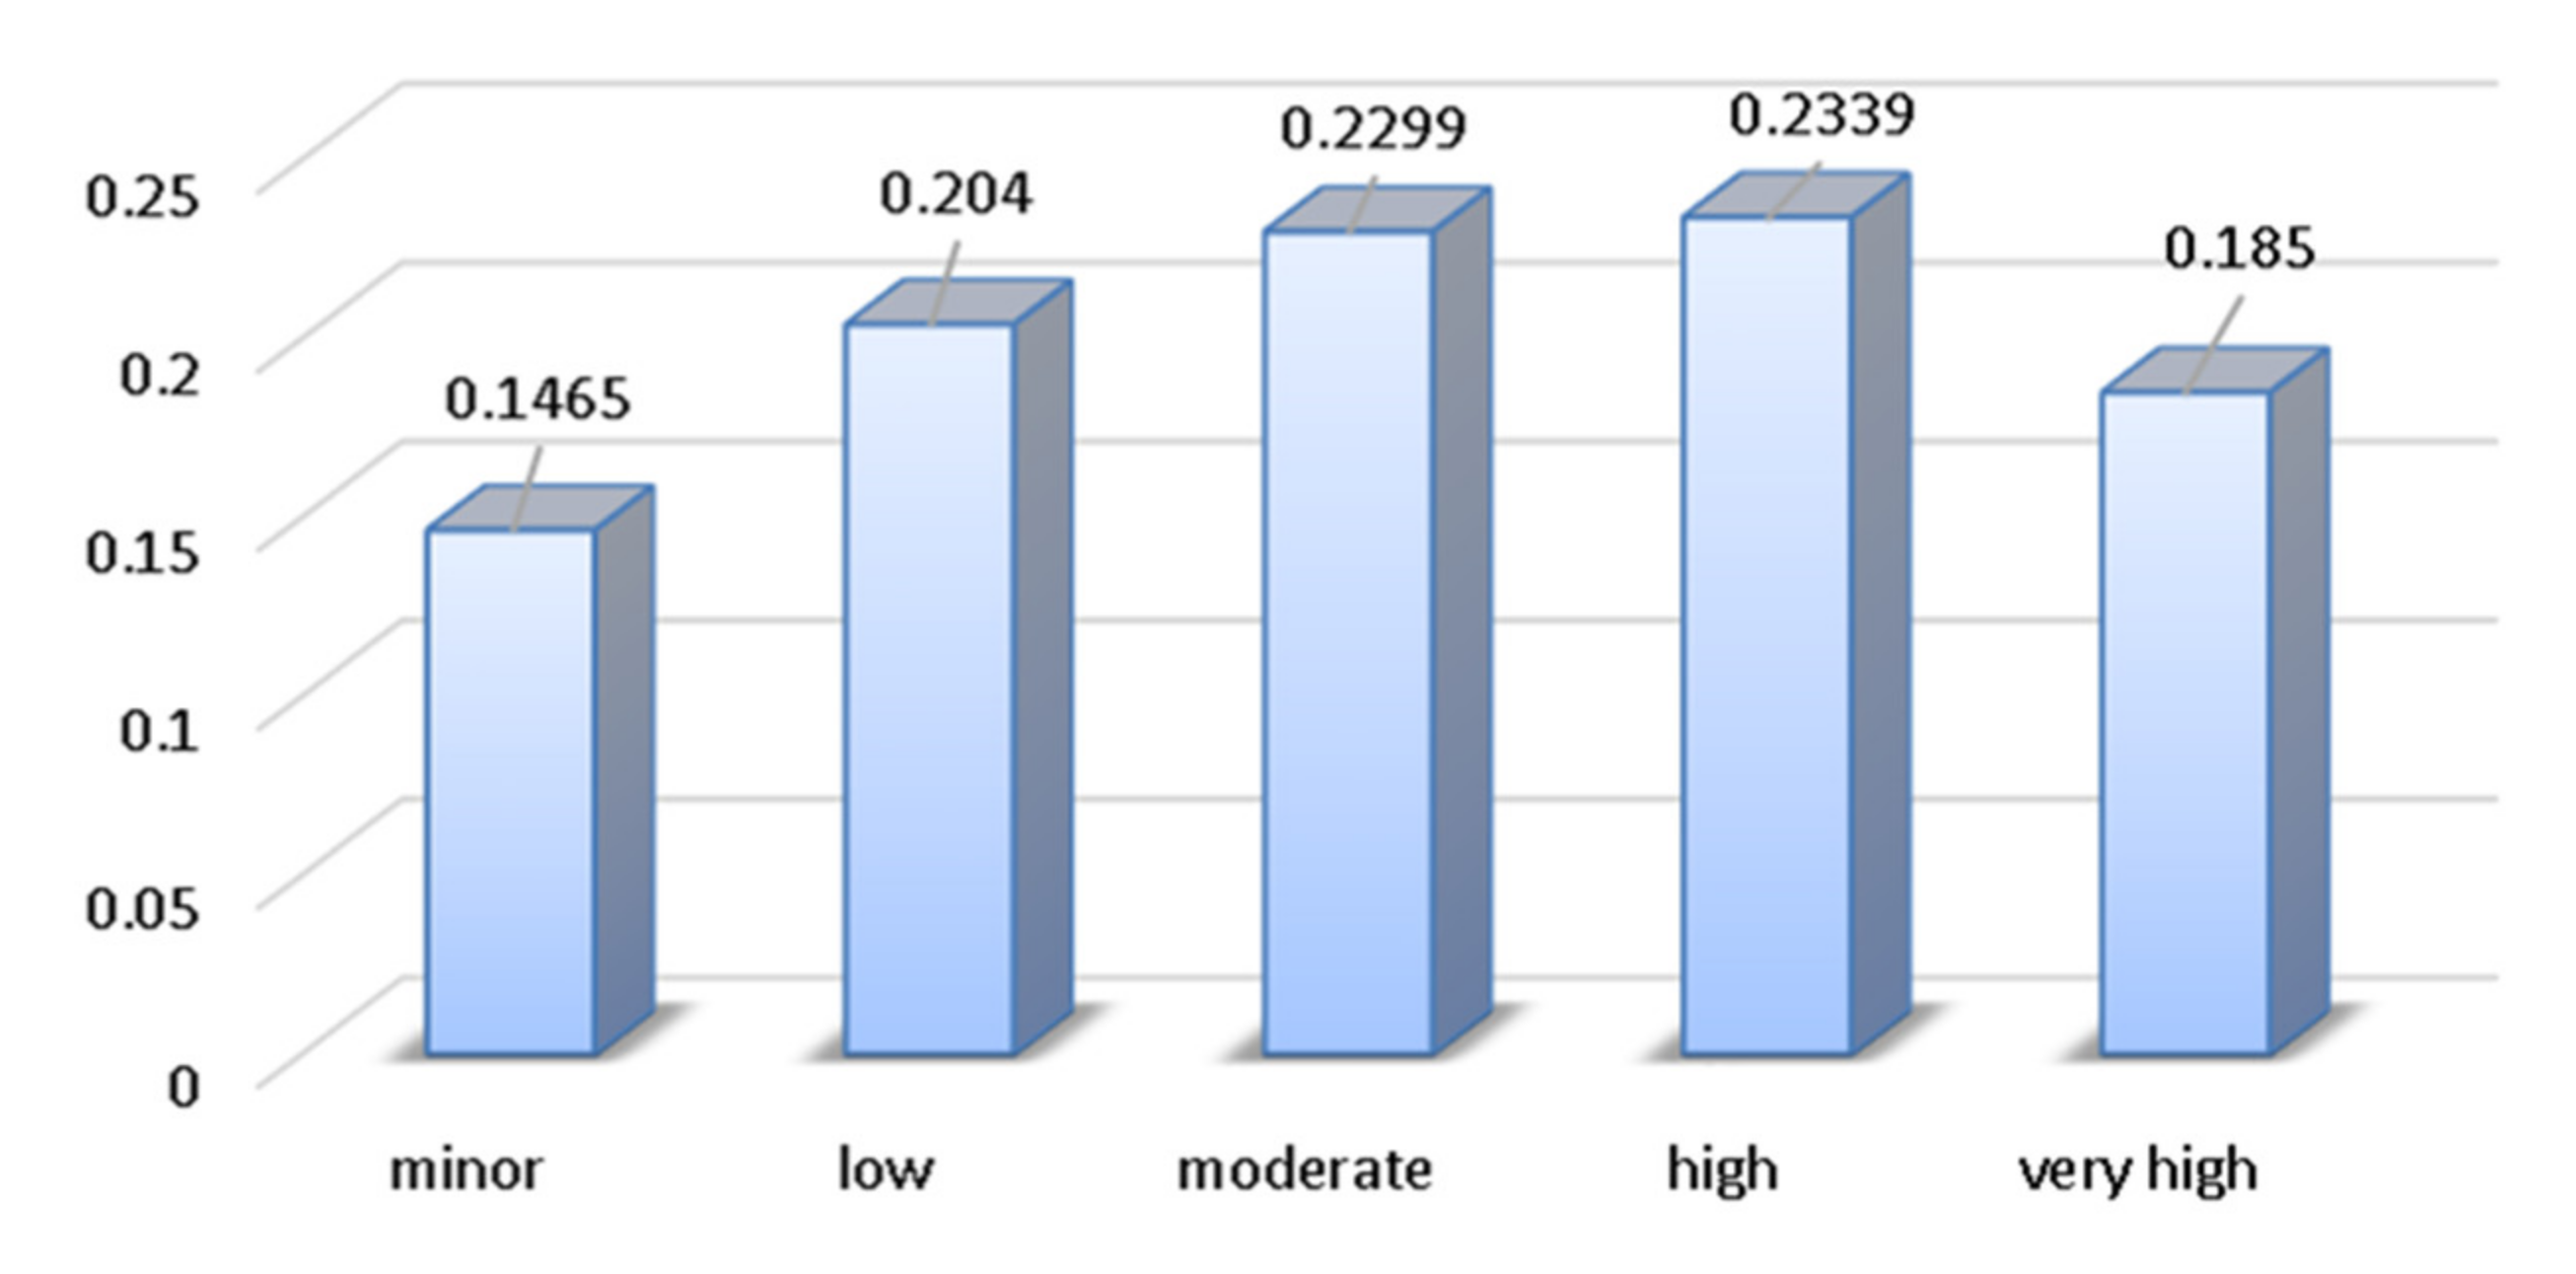
5.3.2. Identification/Decomposition of the Risk Level of System Failure
By applying the “best-fit” method, the fuzzy set of the level of risk of technical system failure could be transformed into the form presented in
Figure 16.
This procedure defines the membership degree of the acquired risk level assessment for the system by applying a min–max composition to a specific fuzzy set (minor, low, moderate, high, or very high).
Finally, the level of risk of technical system failure can be expressed in the following form:
Five risk categories were adopted for the risk level assessment: minor, low, moderate, high, and very high. The membership degree β, which classifies the obtained risk assessment into a risk level category, was determined for each category. The membership degree defines the risk category and, therefore, it was found that the risk was “high” for the crushing machine in question with a membership degree of 0.2339, or 23.39%. The first lower value for the membership degree was for the risk category “moderate”, and the difference was less than 1%. According to the results of the assessment, the risk of failure for the crushing machine was “high”, but it tended toward the “moderate” category because this is where the first lower value for the membership degree was.
5.4. Discussion of the Results of the Failure Risk Assessment for the Crushing Machine
The results obtained using the proposed model for a failure risk assessment of the mobile crushing machine are significant for the establishment of a machine maintenance strategy aimed at reducing the risk level. Risk-based maintenance of the crushing machine could produce positive results in terms of predicting the number and type of failures and, therefore, the negative effects could be reduced as well. The analysis of the results obtained using the proposed model suggests that individual parts of the crushing machine have high failure risk levels (e.g., the interruption of the fuel supply to the diesel engine). This is a seemingly innocuous problem, but it can cause massive problems in the processes of crushing and screening rock mass. The risk of this type of failure can be easily reduced by installing an additional fuel filter. A similar situation can occur from a broken screw in the mill lining. The purchase and installation of screws of adequate strength would certainly contribute to reducing the negative effects from this type of failure, which is a minimal investment that could reduce the effects of the risky event (the breakdown of the lining of the crushing machine, failure of the crushing machine’s rotor, rupture of a belt gear in the crushing machine, etc.). It should be noted that four out of the five types of failure analyzed in the electrical subsystem had a “high” risk of failure. It is necessary to develop a maintenance strategy for this subsystem, to take necessary measures for preventive maintenance, and to regularly check all of the possible causes that can lead to this type of failure in order to avoid or mitigate the negative effects of that failure. The impact of the crushing machine on the work environment (dust, precipitation, etc.) cannot be controlled; however, enhanced maintenance measures (regular cleaning to prevent dust and oxidation) can be carried out. For instance, in a crushed rock mass transportation system, it is possible to replace rubber belts on time in order to reduce the number of breakdowns, because the time it takes for the system to return to operation after a failure is 20 h or more, which can have a serious impact on the planned production process. These are only some of the ways to respond quickly and effectively to failures.
The assessments of the failure risk level for individual elements, subsystems, and the technical system of the crushing machine as a whole indicated that it is necessary to design a detailed plan and strategy for timely action in terms of machinery maintenance in order to reduce the level of failure risk to an acceptable level, especially for the types of failure whose risk level is high.
The proposed risk assessment model (based on fuzzy logic) enables an overview of the existing factors that can lead to negative effects from a risky event (assessed through partial risk indicators). The assessment model was used in a mining technical system in this paper, representing a new way of looking at risk indicators. In addition, the proposed model is an original solution that allows for a comprehensive assessment of the failure risks within technical systems in mining (the risk levels of the elements of a mining machine system). The evaluation of risk levels, which is based on assessments of the failure risk levels of individual elements, provides clear guidelines for creating risk maintenance policies for mining machinery.
The difference of the proposed model in comparison to other models is in the fact that the result of risk level assessment indicates risk trend and gives deviation from average assessment. Risk assessment by FMEA and RPN calculations gives a numerical outcome. This way of risk assessment can result in difficulties in maintenance prioritizing because different values of risk indicators can lead to the same RPN value. [
22,
31]. The proposed method avoids this. The second advantage of the proposed model is in maximized objectivity (or avoidance of subjectivity) in proposition and composition. Fuzzy models which use AHP method (Analytic Hierarchy Process) in combination with fuzzy logic to rank indicators of overall phenomena [
34] have a higher probability that the outcome of risk assessment will be influenced by the subjectivity of experts.
5.5. Possibility of Implementation of Propose Model
The risk assessment model presented here is applicable to any production system or individual machine. It is easy and simple to calculate and does not require any specific software tools.
A problem which is frequent in practice, regarding the proposed model, is the absence of empirical data. Some companies did not develop the data acquisition system for the time picture state of the equipment in use. In such conditions, this model is impossible to apply in its present form and it is necessary to implement the data as expert opinions. A system with real-time online condition monitoring and data acquisition provides the possibility of timely (or real-time) risk level assessment. Such systems are expensive, and the price is proportional to the complexity of the technological process. As opposed, the prediction of accident situations is highly beneficial and cost saving. From that point of view the cost of a system for risk prediction is acceptable or can be considered as low.
If there are no available data on the mechanical condition of a machine which are time-based (time between failures, time to repair, pollution level, injuries, setback costs, spare parts and replacement costs, delivery to customer delay costs etc.) they have to be acquired in the field. In addition, if data are not classified, or are of low quality, those data have to be extracted from daily reports (as in case of example given here). Field work can be time consuming and last for even a couple of weeks, depending of the system complexity. In that case, the implementation of the risk assessment model can be expensive.
It can be concluded that implementation of a system for monitoring and supervising of risk, or for maintenance centered to risk can be initially expensive. However, the model presented here is not more demanding or costly than any other model for risk monitoring and assessment.
6. Conclusions
In this paper, a risk assessment algorithm was developed that can help with system monitoring with regard to the following:
Functionality and the further ability of an engineering system to perform the designed function;
Occupational safety and health;
The work environment and the environment in general.
The proposed model presents a hierarchical composition of partial risk indicators for the elements of a system failure based on the following:
The severity of the failure;
The frequency of failure, which is identified through functions for reliability and the failure rate;
The ability to detect a failure on time, i.e., detectability.
Failure severity, one of the risk indicators, is analyzed through three important factors in terms of the negative effects of a risky event:
Impact on the functionality of the machine, which is identified through the time needed for repair (that is, the maintainability function);
Impact on the health and safety of employees, which is identified through the number and types of injuries to workers who work with the machine;
Impact on the work environment and the environment in general, which is identified through a contamination of the same.
The proposed model for determining the level of risk caused by the failure of an element in a technical system offers the possibility of considering the risk from individual elements, subsystems, or the system as a whole. It allows for an analysis of their interactions, for the discovery of weaknesses in the system, and for receiving feedback with regard to risk reduction priorities (from the standpoint of reliability, maintainability, the number of injuries, pollution levels, and detectability). Moreover, this type of risk assessment is an excellent starting point for the establishment of preventive machine maintenance policies.
The basic features of the proposed model for risk assessment are based on an original conceptual approach to introducing risk indicators for the occurrence of failure into a risk assessment. The risk assessment algorithm is an upgraded standard risk assessment model (RPN) that provides more information on the parameters that have an impact on risk. For instance, it allows for the introduction of indicators that have not been used in risk assessments on machinery and presents a comprehensive model for complex technical systems. It also offers the possibility of working with hybrid data. The final risk level assessment is presented in a continuous form.
The proposed model minimizes the potential for analysts to influence the outcome of an assessment.
The proposed model offers the possibility of reducing the number of iterations when the number of combinations is defined in the process of determining possible outcomes. This method significantly expedites the process of calculating the symmetric “min–max” composition.
The proposed model can be used for risk assessments of failures in any machine used in industry and mining. Here, we tested it on the secondary mobile crushing machine “METSO MINERALS”, type “Lokotrack LT 1213S”, which is used in the open pit “Ladne vode”, near Petrovac na Mlavi, Serbia. The results indicated that there are numerous high-risk potential failures. These risks are influenced by low investment in human and financial resources that could reduce the number of failures or mitigate the negative effects of a failure. Such investment may be useful: the maintenance system can be modified, achieving considerable savings.
In spite the fact that proposed model minimizes the influence of subjectivity of the analyst to the analysis outcome, this potential is still existent. Therefore, further research should be directed toward the verification of the proposed model using a comparison with some methodology that involves expert evaluation and numerical data aiming to assess the level of subjectivity incorporated within the proposed model.

 ,
, 


