Abstract
Existing methods employed for combining temporal and spatial evidence derived from multiple sources into a single coherent description of objects and their environments lack versatility in various applications such as multi-sensor target recognition. This is addressed in the present study by proposing an adaptive evidence fusion method based on the power pignistic probability distance. This method classifies evidence sets into non-conflicting and conflicting evidence sets based on the maximum power pignistic probability distance obtained between evidence pairs in the evidence set. Non-conflicting evidence sets are fused using Dempster’s rule, while conflicting evidence sets are fused using a weighted average combination method based on the power pignistic probability distance. The superior evidence fusion performance of the proposed method is demonstrated by comparisons with the performances of seven other fusion methods based on numerical examples with four different evidence conflict scenarios. The results show that the method proposed in this paper not only can properly fuse different types of evidence, but also provides an excellent focus on the components of evidence sets with high confidence, which is conducive to timely and accurate decisions.
1. Introduction
Dempster-Shafer evidence theory, shorten as evidence theory or D-S theory [1], has been proposed for decades. Because of its advantage in dealing with uncertainty, evidence theory has attracted considering attention from researchers [2,3,4,5,6,7]. Evidence theory has been applied in many areas including target recognition systems based on information fusion. The comprehensive target recognition process seeks to obtain a coherent description of objects and their environments based on a fusion of limited temporal and spatial information derived from multiple sensors.
However, the fusion process is complicated by the fact that temporal information is derived from a single location over time while spatial information is derived from multiple locations at the same time. Here, most evidence fusion methods are applicable to temporal-domain evidence because the nature of this evidence provides a fixed order of fusion with respect to time. However, spatial-domain evidence cannot be fused in any non-arbitrary sequence based on time. As a result, fusion methods, such as the Yager method [8] and the Dubois and Prade (DP) rule [9], are not suitable for spatial-domain evidence because different results are obtained when the fusion order is changed.
The problem of tempora-spatial evidence combination was addressed by Hong and Lynch [10] by proposing three tempora-spatial evidence fusion models based on evidence theory, which included a recursive centralized fusion model, a recursive distributed feedback-free fusion model, and a recursive distributed feedback fusion model. These three models classify evidence into spatial-domain evidence and temporal-domain evidence, and fuse them either in the order of spatial-domain evidence first and temporal-domain evidence second; or temporal-domain evidence first and spatial-domain evidence second. It seems that the fusion order of temporal-spatial and spatial-temporal satisfy the concept of symmetry. However, the fusion result of different orders may be different in most cases due to the selection of a combination method.
In addition, the data derived from multiple sensors at different locations may provide conflicting information, which can have a considerable impact on the target recognition results. In this regard, Dempster’s rule has been demonstrated to provide superior results when used for fusing temporal-spatial evidence with a low level of conflict 1. However, the results obtained when fusing evidence with a high level of conflict are often counter-intuitive, as pointed out by Zadeh [11]. This issue has been addressed from the perspective of two different approaches. The first kind of approach [8,9,12,13,14,15,16] replaces Dempster’s rule with a new evidence combination rule. These methods are developed by modifying the normalization way in Dempster’s rule. However, none of these rules, with the exception of the transferable belief model (TBM) rule [12], satisfies the associative law like Dempster’s rule, which is significant to the combination of special evidence sources without consideration on the order of combination. So these methods cannot be applied generally to spatial-domain evidence without an established order or sequence. As such, no single rule has been developed that provides good fusion performance for evidence with both low and high levels of conflict. The second kind of approach applies some modification including evidence discounting [17,18,19,20,21,22] and weighted averaging [23,24] to the evidence sources to reduce the level of conflict, and then employs Dempster’s rule to fuse the modified evidence. These methods inherit the properties of Dempster’ rule, although the modification on evidence sources may cause information loss.
In the application of information fusion, we usually seek an optimal method to get the most reasonable results. So it seems important to design a self-adaptive method which can be tuned automatically according to the collected information. For the method based on evidence combination, the combination of evidence sources must depend on the levels of conflict to obtain the best results. This has been addressed by the development of adaptive evidence fusion methods. Existing methods usually define the conflict criteria first, classify all the evidence, select conflict evidence for correction, and then conduct evidence fusion using a method selected according to the level of conflict in the evidence. Most existing methods adopt Dempster’s rule for fusing evidence with a low degree of conflict owing to its very high performance. However, the high sensitivity of the fusion results obtained by this method to conflicting evidence indicates that the measures adopted for determining the level of conflict within an evidence set are crucial to the fusion results obtained by an adaptive fusion method. Jousselme [25] introduced these measures (metrics) comprehensively and classified them according to their fundamental characteristics. The more representative measures included the Jousselme distance [26], which was classified as a standard metric, the pignistic probability distance [27], which was classified as a pseudo-metric, and the angular similarity measure [13], which was classified as a semi-pseudo-metric. Among these, the Jousselme distance has been demonstrated to possess the best properties, and produces basically reasonable results. Both the pseudo-metric and the semi-pseudo-metric are subject to limitations that may lead to counter-intuitive results in some special cases when used alone as a similarity/dissimilarity measure. New metrics have also been developed in recent years. For example, Yu [20] proposed a support probability distance, and Bi [21] combined the pignistic probability distance and the Tanimoto coefficient to propose a new similarity measure. Zhu [28] proposed the power pignistic probability distance metric, which was proven to be a standard metric like the Jousselme distance through mathematical derivation, and the advantages of this metric over other metrics were demonstrated through numerical calculations.
A number of adaptive evidence fusion methods have been developed in recent years. For example, Liu et al. [29] proposed a temporal-domain adaptive evidence fusion method that gauges the degree of conflict in a body of evidence comprehensively based on a conflict coefficient and the Jousselme distance, and adaptively conducts evidence fusion using Dempster’s rule, the DP rule, or evidence discounting depending on the degree of evidence conflict. However, the method cannot be applied to spatial-domain evidence. An adaptive conflict evidence inspection and synthesis method suitable for use with temporal-spatial evidence was proposed by Liu and Chen [30], which first classifies the evidence using a conflict evidence inspection factor, and then adopts Dempster’s rule for fusing non-conflicting evidence, while the local or global correction is adopted for the conflicting evidence. This method was demonstrated to produce good fusion results for evidence that contains only monadic sets of focus elements. However, the computation involved with the method is too intensive for evidence that contains non-monadic sets of focus elements. In addition, the method is hampered by excessive cyclic corrections that are not conducive to fast and precise evidence fusion. Wang [31] proposed an evidence fusion method based on selection criteria and closeness. The evidence is divided into non-conflicting and conflicting types, and evidence fusion is performed by adaptively selecting either Dempster’s rule or an improved algorithm. However, while this method was demonstrated to be suitable for temporal-spatial evidence, it can consider basically two kinds of evidence only when quantifying the conflict between evidence components.
The above analysis indicates that existing adaptive combination methods are developed based on complicated measures of evidence conflict. These measures are constructed by combining several distance or closeness measures, which lack clear practical significance. Moreover, some methods may not be suitable for combining evidence sources regardless of the combination order. So new self-adaptive combination methods are important to information fusion in the framework of evidence theory.
The above-discussed issues are addressed in this paper by proposing an adaptive evidence fusion method that takes advantage of the superior performance of the power pignistic probability distance for conflict evaluation. The proposed method employs the maximum value of the conflict between evidence pairs in an evidence set based on the power pignistic probability distance to quantify its degree of conflict, and accordingly classifies evidence sets into non-conflicting and conflicting evidence sets. Non-conflicting evidence sets are fused using Dempster’s rule, while conflicting evidence sets are fused using the weighted average combination method based on the power pignistic probability distance. The superior evidence fusion performance of the proposed method is demonstrated by comparisons with the performances of seven other fusion methods based on numerical examples with four different evidence conflict scenarios.
The rest of this paper is arranged as follows. Some basic knowledge of evidence theory is introduced in Section 2 to facilitate subsequent exposition. In Section 3, the self-adaptive method is developed based on evidence classification and combination method selection. Experimental examples are proposed in Section 4 to show the performance of the proposed method. The conclusion of this paper is presented in the last section.
2. Preliminaries
In evidence theory 1, represents an identification frame, which is a non-empty set that contains elements that are exhaustive and independent, and represents the power set of .
Definition 1.
Let A be a subset of, and. If a functionsatisfies the following two conditions,
then m(·) is denoted as a basic probability assignment function (BPA) of. For, if, then A is denoted as a focus element of, andis a basic statistical characteristic of A that reflects the degree of confidence of the evidence in A.
Definition 2.
Letandbe two independent BPAs of. Assigningas the result of combiningandusing Dempster’s rule yields the following.
here,
which is denoted as the conflict coefficient. When, the evidences B and C are in complete conflict and cannot be combined using Dempster’s rule.
3. Classification of Evidence Sets and Adaptive Fusion
3.1. Classification Criteria for Non-Conflict/Conflict Evidence Sets
The conflict coefficient k given in Definition 2 is the simplest means of measuring the conflict in the evidence, and is applicable to two or more evidences. However, Liu [32] demonstrated with examples that a large value of k does not indicate necessarily that the level of conflict in an evidence set is large. Therefore, we also introduce the maximum power pignistic probability distance between two evidences to quantify the conflict in an evidence set. The related definition of the power pignistic probability distance is given as follows.
Definition 3.
Let A and B be subsets of,, and m be a BPA of. Then, the power set distribution pignistic probability functioncorresponding to m may be defined as
whererepresents the potential of set A.
The function in (4) can be employed to construct a power pignistic probability distance as follows.
Definition 4.
Letandbe two independent BPAs of, withandbeing their respective power set distribution pignistic probability functions. Then, the power pignistic probability distance between m1 and m2 is defined as
For ease of description, is denoted as in the following discussion.
Evidence sets are then classified as non-conflicting or conflicting evidence sets as defined below.
Definition 5.
Letbe an evidence set of,represent the maximumvalue between a pair of evidences in M, andrepresent a threshold. If, then M is judged as a non-conflicting evidence set; otherwise, M is judged as a conflicting evidence set.
Here, the setting of the value ofis critically important to the adaptive evidence fusion results, and is generally set according to the specific conditions of the evidence set being evaluated. In this paper, the value of μ is set following the work of Liu 32, which is described in detail below.
In the cases including only two items of evidence, a binary measure is constructed based on k with its corresponding threshold, and with its corresponding threshold . The evidence set is then divided into four classifications of conflict based on these values, from which we determine whether to use Dempster’s rule. If we consider only and its threshold , these four cases can be reduced to two cases, where Dempster’s rule may be applied to evidence for which ; otherwise, Dempster’s rule should not be applied, or at least applied with caution. Because is an improvement over , the value of could not be any smaller than the established value of . Therefore, the value of could be used as a reference for setting the value of . In this respect, a value of 0.3 has been established for 32, so we set = 0.3 in this work. In addition, we stipulate that Dempster’s rule must not be used under any circumstances when , which reduces the risk of conflict affecting the fusion results, and also reduces the complexity of the method.
3.2. Selection of Fusion Rules
If M is determined to be a conflicting evidence set, then an evidence correction method must be applied to M to reduce the impact of less reliable evidence on the fusion result by applying smaller weights to conflicting evidence. We apply a weighted average combination method based on the power pignistic probability distance in the present work. The detailed steps are as follows.
Let include n (n ≥2) independent BPAs, and let mi and mj be any two of these BPAs.
Step 1: Calculate the distance between mi and mj, and define the corresponding similarity measure as
where when i = j. For ease of expression, we denote as in the following discussion.
Step 2: Establish the following similarity matrix using all values obtained.
Step 3: Calculate the support of mi as follows:
Step 4: Calculate the reliability of mi as follows:
which is employed as the weight of mi.
Step 5: Perform a weighted average of M according to the values of to obtain the revised evidence set m’, and then apply Dempster’s rule to combine m’ by n − 1 times to obtain the final result .
The functionality of the adaptive fusion method based on the power pignistic probability distance proposed in this paper is illustrated by the flow chart shown in Figure 1.
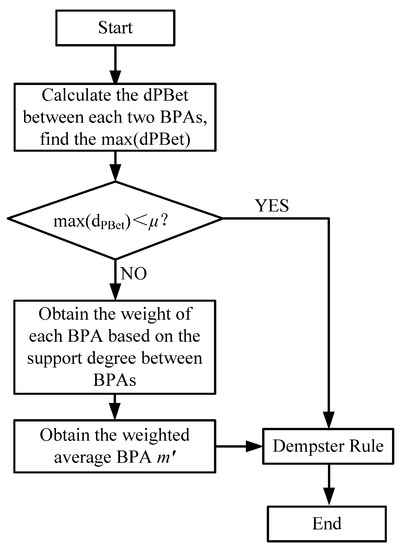
Figure 1.
Flow chart of the proposed adaptive evidence fusion algorithm based on the power pignistic probability distance.
4. Experimental Examples and Analysis
The effectiveness and superiority of the proposed evidence fusion method are demonstrated by comparing the fusion results obtained by this method for four representative examples with the corresponding results obtained using seven existing methods, including the Yu’s method [20], Wen’s method [19], Bi’s method [21], Hu’s method [22], Luo’s method [18], Murphy’s method [23], and Deng’s method [24]. The first five methods are implemented based on evidence discounting, and the last two are evidence weighted average methods.
All four representative examples are based on a comprehensive ballistic target identification system. In the ballistic target identification system, five sensors are applied to detect and identify targets. These five sensors include radar and electro-optical sensors. Suppose that five sensors are expressed by S1, S2, S3, S4 and S5, where S1, S2, S3 are radars, and the other two sensors are electro-optical sensors. Based on the information collecting by each sensor, the type of the target can be evaluated initially. The evaluation results can be transformed into BPA in evidence theory, which can reflect the probability of the target belonging to each type. In these examples, the type of the target to be recognized will be one of three types, i.e., warhead, decoy, and debris. So the discernment frame of this problem is Ω = {A (warhead), B (decoy), C (debris)}. The BPA obtained based on the information of each sensor is expressed as mi, . The BPA indicates the probability to which the target is recognized as each type. For example, m1(A) = 0.6 says that based on the information collected by S1, the target is recognized as a warhead with probability 0.6; m1(AC) = 0.2 indicated that based on the information collected by S1, the target is recognized as a warhead or debris following probability 0.2. The evidence set formed by the information acquired by each sensor is .
Each of the four representative examples represents different evidence of conflict scenarios, which are defined as follows. Example 1 represents a case where the evidence set is classified as a non-conflicting evidence set. Example 2 represents a case where the evidence set is classified as a conflicting evidence set, where most of the evidence is assigned the highest degree of confidence on the same focus element, and the remaining few evidences are in high conflict with them. Example 3 represents a case where the evidence set is classified as a conflicting evidence set, where the conflicts are between evidences in pairs. Example 4 is an extension of example 3 that can more clearly reflect the advantages and disadvantages of the various methods. The details of each of these examples and a discussion of their evidence fusion results are presented individually as follows.
Example 1. The details regarding the five BPAs {mi}, i = 1, 2, …, 5, are listed in Table 1. As can be seen from Table 1, all five BPAs assign a greater level of confidence to A, and reasonable fusion results should likewise assign the greatest confidence to A. The method proposed in this paper yields a value of for this evidence set. The evidence set is therefore determined to be a non-conflicting evidence set, and Dempster’s rule should be applicable for conducting the fusion process. The results obtained by the proposed method and the seven other methods are listed in Table 2.

Table 1.
Evidence set obtained by the five sensors of the target identification system (example 1).

Table 2.
Fusion results of the various methods (example 1).
It can be seen from Table 2 that the fusion results of the eight methods all assign a maximum level of confidence to A, which is consistent with the intuitive analysis. These eight methods can, therefore, obtain reasonable results when processing non-conflicting evidence sets. The confidence level assigned to A by the proposed method is 0.99918, which is greater than the corresponding levels assigned by the other methods. This indicates that the proposed method not only can obtain reasonable fusion results, but also provides better focus on the components of evidence sets with high confidence than the other methods when applied to non-conflicting evidence sets.
Example 2. The details regarding the five BPAs {mi}, i = 1, 2, 3, 4, 5, are listed in Table 3. It can be seen from Table 3 that m1, m3, m4, and m5 assign the greatest degree of confidence to A, and only m2 has assigned the greatest degree of confidence to B, in conflict with the other sensors. After comprehensive consideration of the information provided by the five BPAs, the final reasonable fusion result should assign the maximum confidence level to A. The method proposed in this paper yields a value of for this evidence set. The evidence set is therefore determined to be a conflict evidence set, and the fusion process should be conducted using the weighted average combination method based on the power pignistic probability distance. The results obtained by this method and the seven other methods are listed in Table 4.

Table 3.
Evidence set obtained by the five sensors of the target identification system (example 2).

Table 4.
Fusion results of the various methods (example 2).
It can be seen from Table 4 that the fusion results of all eight methods assign the highest degree of confidence to A, which is consistent with the intuitive analysis. Therefore, all eight methods can obtain reasonable results when the same focus element has the greatest degree of confidence based on most of the evidence in the conflict evidence set. The confidence level assigned to A by this method is 0.9849, which is greater than the levels given by the other methods. Accordingly, the proposed method of not only can obtain reasonable fusion results, but also provides better focus than the other methods when applied to evidence sets with minor conflict.
Example 3. In this example, two sensors failed due to the complexities of the battlefield environment, while the remaining three sensors functioned normally. Accordingly, the evidence set formed by the information acquired by each sensor is , and the details regarding the three BPAs are listed in Table 5. It can be seen from this table that the focus elements of m1 are A, B, and AB, the focus elements of m2 are B, C, and BC, and the focus elements of m3 are A, C, and AC. The greatest confidence of 0.8 is respectively assigned to A, B, and C, and the low confidence of 0.1 is assigned to the two remaining focus elements in conjunction with relatively high pair-wise conflicts. Because the BPAs have very similar focus element compositions and confidence distributions, and the degree of pair-wise conflicts are also the same, it is impossible to determine which of these has a lower reliability. Therefore, a reasonable fusion result should assign the same confidence level to A, B, and C. The method proposed in this paper yields a value of for this evidence set. The evidence set is therefore determined to be a conflicting evidence set, and fusion should be conducted using the weighted average combination method based on the power pignistic probability distance. The results obtained by this method and the seven other methods are listed in Table 6.

Table 5.
Evidence set obtained by the three sensors of the target identification system (example 3).

Table 6.
Fusion results of the various methods (example 3).
It can be seen from Table 6 that all of the five evidence discounting methods (i.e., the Yu, Wen, Bi, Hu, and Luo methods) failed to produce a fusion result. This is because the conflict metrics adopted by these methods all determined that the pair-wise conflicts in , , and are equal in magnitude. As a result, the discount factors of all BPAs were set to 1, which is equivalent to not modifying the BPAs at all during fusion. Consequently, the direct application of Dempster’s rule cannot yield a fusion result under this condition of k = 1. In contrast, the two evidence weighted average methods (i.e., the Murphy and Deng methods) and the method proposed in this paper assigned A, B, and C with the same confidence level. This is consistent with the intuitive analysis, such that reasonable results were obtained by these methods. Therefore, we can conclude that the evidence discounting methods fail to provide fusion results under this level of conflict in evidence set, while reasonable results can be obtained using the weighted average method.
Example 4. This example is essentially equivalent to Example 3, except that m1 is gradually changed by adding a small value θ that varies over the range [−0.1, 0.1] in increments of 0.02. Ideally, we would wish to apply all eight methods to calculate the fusion results for , , and and plot the variation curve of the fusion results with respect to θ. However, we note that Example 4 is equivalent to Example 3 when θ = 0, and the five evidence discounting methods fail to provide a fusion result. In this case, fusion results are obtained for and as a supplement to ensure the continuity of the trends. Accordingly, the evidence set formed by the information acquired by each of the sensors is , and the details regarding the three BPAs are listed in Table 7.

Table 7.
Evidence set obtained by the three sensors of the target identification system (example 4).
It can be seen from Table 7 that the highest confidence levels are assigned by , , and to the three monadic set focus elements A, B, and C, while very little confidence is assigned to the three non-monadic set focus elements AB, BC, and AC. In addition, the degree of confidence assigned to focus elements A and B by m1 changes when θ changes, but the degree of confidence assigned to these elements by and remain constant. Under normal circumstances, the fusion results obtained from , , and will vary in accordance with the value of θ. However, the degree of confidence given to each focus element by the fusion result should change only gradually because the change in θ is small.
The method proposed in this paper yields a value of for this evidence set over the full range of . As such, the evidence set is always determined to be a conflicting evidence set, and the weighted average combination method based on the power-based pignistic probability distance should be adopted for conducting the fusion process. Figure 2, Figure 3, Figure 4, Figure 5, Figure 6, Figure 7, Figure 8 and Figure 9 present the fusion results obtained by the eight methods with respect to . Because the highest confidence levels are assigned to A, B, and C, only the values of , , and are plotted with respect to .
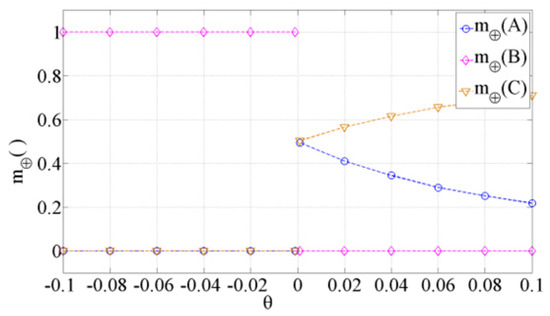
Figure 2.
Variation in the fusion result with respect to θ for the Yu’s method.
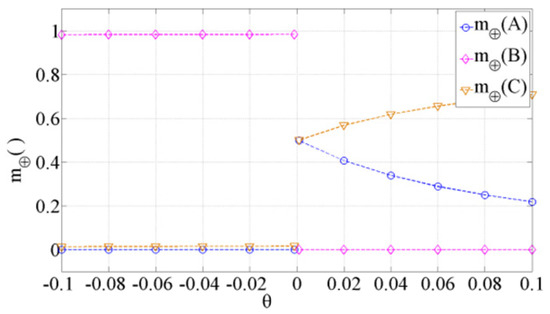
Figure 3.
Variation in the fusion result with respect to θ for the Wen’s method.
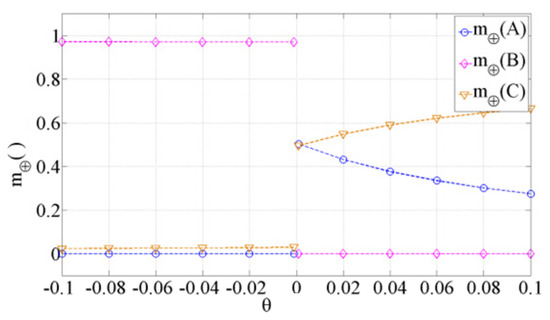
Figure 4.
Variation in the fusion result with respect to θ for the Bi’s method.
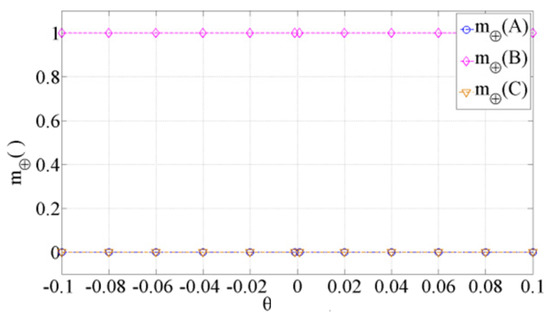
Figure 5.
Variation in the fusion result with respect to θ for the Hu’s method.
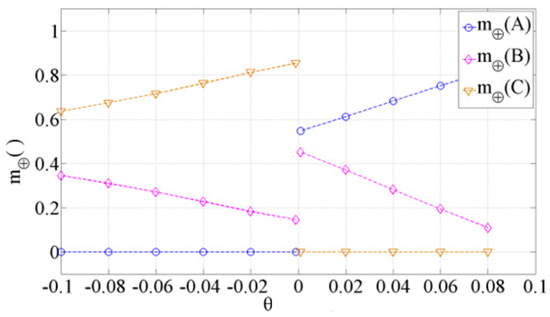
Figure 6.
Variation in the fusion result with respect to θ for the Luo’s method.
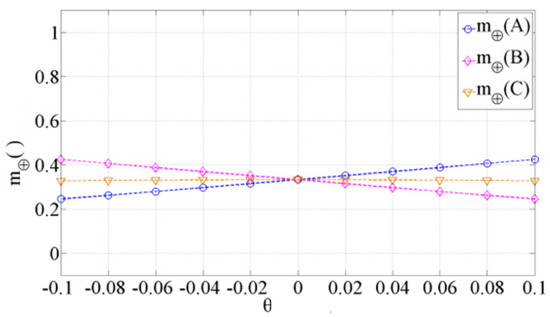
Figure 7.
Variation in the fusion result with respect to θ for the Murphy’s method.
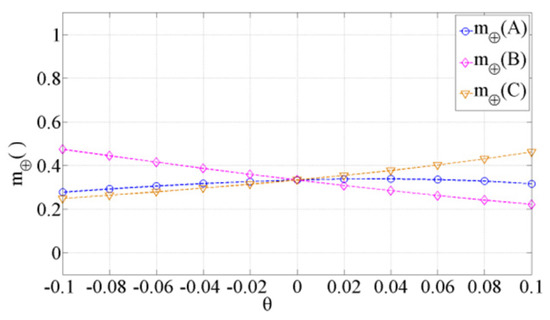
Figure 8.
Variation in the fusion result with respect to θ for the Deng’s method.
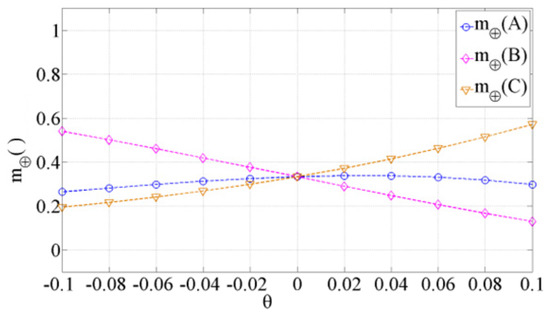
Figure 9.
Variation in the fusion result with respect to θ for the proposed method.
The results in Figure 2, Figure 3, Figure 4, Figure 5, Figure 6, Figure 7, Figure 8 and Figure 9 show that, when , all eight methods, except for the Luo method, assigned the maximum confidence of the fusion result to B. When , the Yu, Wen, Bi, and Deng methods, and the proposed method assigned the maximum confidence of the fusion result to C. In contrast, the Hu method assigned the maximum confidence of the fusion result to B under this condition, and the Luo and Murphy methods assigned the maximum confidence of the fusion result to A. The Luo method differed from all other methods in that it assessed an absence of conflicting evidence in , , and over the entire range of θ. Naturally, this is inconsistent with the actual conditions. As a result, the fusion results obtained by the Luo method are not credible. Similarly, the Hu method assigned a confidence level of 1 to B over the entire range of θ, which does not reflect the fact that the fusion results change with changing , and the obtained fusion results are therefore unreasonable. The Murphy method applies a simple averaging method to modify the evidence set without considering the reliability of each BPA, and this detracts from the reliability of its results relative to that of the other methods. Taking the differences in the reliability of the evidence into account, the analysis shows that the maximum confidence of the fusion result should be given to B when , and the maximum confidence of the fusion result should be given to C when . Accordingly, the fusion results of the Yu, Wen, Bi, and Deng methods, and those of the proposed method are reasonable.
The results obtained for the five evidence discounting methods in Figure 2 through 6 demonstrate several general irregularities, which are given as follows.
(1) No fusion result could be obtained when = 0.
(2) When , the fusion result of the Luo method was not credible, and the fusion results of the other four methods were insensitive to , where the confidence levels assigned to A, B, and C were constant, which is inconsistent with the intuitive analysis.
(3) The confidence levels assigned to A, B, and C by all five of the evidence discount methods changed abruptly when the value of was changed slightly from −0.001 to +0.001. However, this change is quite small, and the change in m1 is also very small. Therefore, the change in the fusion result should also be very small. This demonstrates that the evidence discounting methods lack robustness when applied to conflict conditions like those adopted in Example 4.
It can be seen from the fusion results of the Murphy and Deng methods, and the proposed method in Figure 7, Figure 8 and Figure 9 that the trends of change in the fusion results as a function of are consistent, and they are all gradual. This agrees with the intuitive analysis, and is therefore reasonable. Accordingly, the Murphy method is applicable when the differences in the reliability of the evidence need not be taken into consideration, and the Deng method or the proposed method is applicable when the differences in the reliability of the evidence must be considered. Finally, we note that the proposed method assigns higher confidence levels to the appropriate focus elements than the Murphy and Deng methods as changes, which is beneficial to the targeting outcome.
According to the analysis of the above examples, we can conclude that the adaptive evidence fusion method proposed in this paper not only can obtain reasonable results, but also has excellent focusing performance when fusing evidence under a wide variety of conflict scenarios, which is conducive to making timely and accurate targeting decisions.
5. Conclusions
This paper proposed a new adaptive evidence fusion method for temporal-spatial evidence. The power pignistic probability distance is used to quantify the level of conflict in the evidence set, and the sets are classified as non-conflicting or conflicting evidence sets according to a threshold value. Evidence fusion is then conducted using Dempster’s rule for non-conflicting evidence sets and the weighted average combination method based on the power pignistic probability distance for conflicting evidence sets. The advantages of the two fusion methods were fully exploited to ensure good focus on the components of evidence sets with high confidence, while avoiding counter-intuitive fusion results. The effectiveness of the proposed method was demonstrated in comparison with seven existing fusion methods based on numerical examples employing four different evidence conflict scenarios.
Author Contributions
Conceptualization, J.W. and J.-w.Z.; methodology, Y.S.; data curation, Y.S.; writing—original draft preparation, J.W.; writing—review and editing, J.-w.Z. All authors have read and agreed to the published version of the manuscript.
Funding
This work was supported by the National Natural Science Foundation of China under Grant No. 61703426, by China Post-Doctoral Science Foundation under Grant No. 2018M633680, and by Young Talent fund of University Association for Science and Technology in Shaanxi, China, under Grant No. 20190108.
Conflicts of Interest
The authors declare no conflict of interest.
References
- Dempster, A.P. Upper and lower probabilities induced by a multi-valued mapping. Ann. Math. Stat. 1967, 38, 325–339. [Google Scholar] [CrossRef]
- Song, Y.; Fu, Q.; Wang Yi Wang, X. Divergence-based cross entropy and uncertainty measures of Atanassov’s intuitionistic fuzzy sets with their application in decision making. Appl. Soft Comput. J. 2019, 84, 105703. [Google Scholar] [CrossRef]
- Zhang, B.; Zhang, M.; Song, Y.; Zhang, L. Combing evidence sources in time domain with decision maker’s preference on time sequence. IEEE Access 2019, 7, 174210–174218. [Google Scholar] [CrossRef]
- Song, Y.; Wang, X.; Quan, W.; Huang, W. A new approach to construct similarity measure for intuitionistic fuzzy sets. Soft Comput. 2019, 23, 1985–1998. [Google Scholar] [CrossRef]
- Song, Y.; Wang, X.; Zhu, J.; Lei, L. Sensor dynamic reliability evaluation based on evidence and intuitionistic fuzzy sets. Appl. Intell. 2018, 48, 3950–3962. [Google Scholar] [CrossRef]
- Song, Y.; Wang, X.; Lei, L.; Xue, A. A novel similarity measure on intuitionistic fuzzy sets with its applications. Appl. Intell. 2015, 42, 252–261. [Google Scholar] [CrossRef]
- Lei, L.; Song, Y.; Luo, X. A New Re-encoding ECOC Using a Reject Option. Appl. Intell. 2019. [Google Scholar] [CrossRef]
- Yager, R.R. On the Dempster-Shafer framework and new combination rules. Inf. Sci. 1989, 41, 93–137. [Google Scholar] [CrossRef]
- Dubois, D.; Prade, H. Representation and combination of uncertainty with belief functions and possibility measures. Comput. Intell. 1988, 4, 244–264. [Google Scholar] [CrossRef]
- Hong, L.; Lynch, A. Recursive temporal-spatial information fusion with applications to target identification. IEEE Trans. Aerosp. Electron. Syst. 1993, 29, 435–445. [Google Scholar] [CrossRef]
- Zadeh, L. A simple view of the Dempster-Shafer theory of evidence and its implication for the rule of combination. AI Mag. 1986, 7, 85–90. [Google Scholar]
- Smets, P. The combination of evidence in the transferable belief model. IEEE Trans. Pattern Anal. Mach. Intell. 1990, 12, 447–458. [Google Scholar] [CrossRef]
- Sun, Q.; Ye, X.; Gu, W. A new combination rule of evidence. Acta Electron. Sin. 2000, 28, 117–119. (In Chinese) [Google Scholar]
- Lefevre, E.; Colot, O.; Vannoorenberghe, P. Belief functions combination and conflict management. Inf. Fusion 2002, 3, 149–162. [Google Scholar] [CrossRef]
- Fu, Y.; Yang, W. Combination rule based on proportional redistribution of generalized conflict for evidence theory. Chin. J. Electron. 2014, 23, 533–538. [Google Scholar]
- Quan, W.; Wang, X.; Wang, J.; Zhang, Y. New combination rule of DST based on local conflict distribution strategy. Acta Electron. Sin. 2012, 40, 1880–1884. (In Chinese) [Google Scholar]
- Chen, Y.; Xa, X.; Hu, D.; An, Y. Evidence combination based on tentative discount of evidences. Acta Electron. Sin. 2014, 42, 756–765. (In Chinese) [Google Scholar]
- Luo, H.; Yin, Y.; Hu, X.; Qin, Y. Method to modify evidence source based on trustworthy factors. Syst. Eng. Electron. 2015, 37, 1459–1464. (In Chinese) [Google Scholar]
- Wen, C.; Wang, Y.; Xu, X. Fuzzy information fusion algorithm of fault diagnosis based on similarity measure of evidence. In Advances in Neural Networks Lecture Notes in Computer Science; Springer: Berlin/Heidelberg, Germany, 2008; Volume 5264, pp. 506–515. [Google Scholar]
- Yu, C.; Yang, J.; Yang, D.; Ma, X.; Min, H. An improved conflicting evidence combination approach based on a new supporting probability distance. Expert Syst. Appl. 2015, 42, 5139–5149. [Google Scholar] [CrossRef]
- Bi, W.; Zhang, A.; Li, C. Weighted evidence combination method based on new evidence conflict measurement approach. Control Decis. 2016, 31, 73–78. (In Chinese) [Google Scholar]
- Hu, C.; Si, X.; Zhou, Z.; Wang, P. An improved D-S algorithm under the new measure criteria of evidence conflict. Acta Electron. Sin. 2009, 37, 1578–1583. (In Chinese) [Google Scholar]
- Murphy, C.K. Combining belief functions when evidence conflicts. Decis. Support Syst. 2000, 29, 1–9. [Google Scholar] [CrossRef]
- Deng, Y.; Shi, W.; Zhu, Z. Efficient combination approach of conflict evidence. J. Infrared Millim. Waves 2004, 23, 27–32. (In Chinese) [Google Scholar]
- Jousselme, A.L.; Maupin, P. Distances in evidence theory: Comprehensive survey and generalizations. Int. J. Approx. Reason. 2012, 53, 118–145. [Google Scholar] [CrossRef]
- Jousselme, A.L.; Grenier, D.; Bosse, E. A new distance between two bodies of evidence. Inf. Fusion 2001, 2, 91–101. [Google Scholar] [CrossRef]
- Tessem, B. Approximations for efficient computation in the theory of evidence. Artif. Intell. 1993, 61, 315–329. [Google Scholar] [CrossRef]
- Zhu, J.W.; Wang, X.D.; Song, Y.F. A new distance between BPAs based on the power-set-distribution pignistic probability function. Appl. Intell. 2018, 48, 1506–1518. [Google Scholar] [CrossRef]
- Liu, Z.; Cheng, Y.; Pan, Q.; Miao, Z. Target identification by adaptive combination of conflicting evidence. Acta Aeronaut. ET Astronaut. Sin. 2010, 31, 1426–1432. (In Chinese) [Google Scholar]
- Liu, X.; Chen, G. A self-adaptive conflicting evidence test and combination approach. Control Decis. 2014, 29, 929–932. (In Chinese) [Google Scholar]
- Wang, A.; Zhang, L. Power grid fault diagnosis algorithm based on the selection standard and closeness. Control Decis. 2016, 31, 155–159. (In Chinese) [Google Scholar]
- Liu, W. Analyzing the degree of conflict among belief functions. Artif. Intell. 2006, 170, 909–924. [Google Scholar] [CrossRef]
© 2020 by the authors. Licensee MDPI, Basel, Switzerland. This article is an open access article distributed under the terms and conditions of the Creative Commons Attribution (CC BY) license (http://creativecommons.org/licenses/by/4.0/).