Abstract
The drawback of several metaheuristic algorithms is the dropped local optimal trap in the solution to complicated problems. The diversity team is one of the promising ways to enhance the exploration of searching solutions in algorithm to avoid the local optimum trap. This paper proposes a diversity-team soccer league competition algorithm (DSLC) based on updating team member strategies for global optimization and its applied optimization of Wireless sensor network (WSN) deployment. The updating team consists of trading, drafting, and combining strategies. The trading strategy considers player transactions between groups after the ending season. The drafting strategy takes advantage of draft principles in real leagues to bring new players to the association. The combining strategy is a hybrid policy of trading and drafting one. Twenty-one benchmark functions of CEC2017 are used to test the performance of the proposed algorithm. The experimental results of the proposed algorithm compared with the other algorithms in the literature show that the proposed algorithm outperforms the competitors in terms of having an excellent ability to achieve global optimization. Moreover, the proposed DSLC algorithm is applied to solve the problem of WSN deployment and achieved excellent results.
1. Introduction
Optimization is one of the most common problems found in life, e.g., engineering design, business planning, or even military applications. Optimization techniques are used to solve problems intelligently by choosing the optimal solution from a large number of solutions [1]. The meta-heuristic algorithm is viral for solving optimization problems as it is robust and straightforward [2,3,4], for example, reactive power planning problem in power systems [5], capacitated vehicle routing problem [6], and route planning of part process in flexible manufacturing systems [7]. Meta-heuristic algorithms have developed rapidly over the past few decades [8]. Metaheuristic algorithms are developed by taking inspiration from the natural phenomenon, e.g., physical, biological, or swarms moving as an advance seeks to generate or choose promising approximate solutions [9,10]. Examples of population-based algorithms of popular metaheuristics are as follows: genetic algorithm (GA) [11], firefly algorithms (FA) [12], adaptive differential evolution (JADE) [13], Cat swarm optimization algorithm [14]. The optimization process of these meta-heuristic algorithms is usually used to generate a set of randomly initialized agents and to execute operations, e.g., selection, combination, and evaluation. The agents are iterated by a certain number of times through operations such as migration or evolution [15,16,17].
Soccer league competition (SLC) algorithm is a new metaheuristic algorithm that was inspired by the soccer league [18]. The competitive mechanism of football leagues is inspirited to model the algorithm for global optimization. The players in the football league are mimicked to simulate candidate solutions in the search space for the optimization algorithm. Improving the fitness of these players gradually as solutions in the algorithm is evaluated according to the objective function through iteration for optimization problems. The best fitness player is selected in the league as the optimal solution for a given optimization problem. Since it was proposed in 2014, in a short time, the SLC algorithm has been successfully applied to solve problems in several areas, e.g., the design of urban water supply networks [19,20], knapsack problems [21], and set covering problems [22]. The SLC algorithm has advantages such as fast convergence speed and more accurate results in comparison with the other metaheuristic algorithms [19]. However, the SLC algorithm also has a drawback, i.e., dropping in the optimal local trap when solving the complicated combinatorial problems.
This paper considers the improvement of the diversity teams to avoid the mentioned issue. We propose a novel improvement version of the SLC algorithm to enhance the diversity team’s soccer league competition (namely DSLC) based on updating strategies. The strategies consist of trading transactions of the player between teams after ending each season, taking advantage of draft principles in real leagues to bring new players to the association, and combining the policies. Beside tested with the benchmark functions, we also apply the proposed method to solve the practical problem of deployment in Wireless Sensor Network (WSN).
Moreover, scholars has paid more attention to WSN because it is a network of many wireless sensors placed in the target space to monitor or capture environmental data, then transfer it to the base station. WSN has been widely applied in fields such as health care monitoring [23] and industrial monitoring [24]. However, its sensor nodes are limited in computation capability and storage capacity of the computing unit, in communication range and radio quality of communication unit, and the available energy of power units [25]. The implementation of WSN has faced many challenges related to determining node positions to ensure a trade-off between different metrics. Due to the differential density of WSN, finding an optimal deployment becomes an NP-Hard task [26,27]. To tackle this NP-Hardness of the deployment problem, meta-heuristic algorithms offer a good alternative method. The proposed method of enhanced diversity team to improve the metaheuristic SLC is a promising way for optimizing the design and deployment of WSN successfully. The reasonably arrange positioning nodes are modeled to maximize the coverage range in WSN as the optimization problem that would be solved by applying the proposed algorithm.
The paper structure is organized as follows. Section 2 reviews the related work, e.g., the original SLC algorithm, and the problem statement of the WSN deployment. Section 3 introduces a new proposed method of DSLC. Section 4 presents the simulation results of the proposed algorithm for selected testing functions. Section 5 applies the proposed algorithm to the coverage problems in WSN deployment. Finally, there is a concluding Section.
2. Related Work
2.1. Soccer League Competition Algorithm
Soccer league competition (SLC) [18] algorithm takes its inspiration from a soccer league that contains many teams. The teams are classified with two levels of strong and weak sides. The stronger teams will occupy the forefront of the league for a long time. The weaker teams will worry about relegation to the second league. During each season, there will be matches between teams. The number of matches in a season depends on the number of teams. In a season, a number of matches are held for the league in competitions. After the end of each season, the worst record in the first league will be eliminated. The vacant seat is replaced by the two best teams in the second league. Assuming the league has several teams and the number of matches is calculated as follows.
where and are the number of matches and teams, respectively. For each team, they play times per season. The players of a team are divided into leading players and reserve players. The fitness of the players determines the competence of the organization. The stronger is the club in the competition between groups, the higher is its probability of winning the game. For the internal competition of each side, the improvement of the team’s fitness comes from the match between players. Each unit has the best player called Star Player (SP). For the league, there is one best player every season, named Super Star Player (SSP). Each team will make different adjustments after each game. The SP in each group will learn from the SSP in the league. SP wants to become an SSP by improving its fitness. The other players on the team learn from the SPs in each unit to enhance their fitness. At the end of each season, the team’s fitness will increase. This strategy makes teams more competitive in the new season.
The player in the league considered a solution in the vector for optimization in which the locally optimal solution vectors and global optimal solution vectors are regarded as the star players in each team and superstar players in the league, respectively. The evaluation rate of the objective function for optimizing the problem is figured out based on the fitness of the player in the team.
where is the objective function; and are the power of the th player in and the power of respectively; are the number of the i-th team and the number of the -th player on the team is the number of players in a team. The high-power teams have a high probability of winning the game. The probability for two teams to win is as follows:
where , are the probabilities for team1 and team2 to win. The sum of and equals to 1. and are the fitness of team1 and team2, respectively. The fitness of the players on the team (leading players and substitutes) is changed to improve forwarding to promising areas of searching space according to the fitness values of the players and the competitiveness of the team.
2.2. Deployment Problem for Wireless Sensor Networks
WSN deployment problem is to place sensor nodes in an accurate way that ensures high network performance [28]. Several terms can name this issue: placement, coverage, or deployment problem. Node deployment techniques are classified according to different criteria [29]. Depending on the application environment, deployment can be outdoor or indoor implementation. Based on the placement strategy, deployment can be random, deterministic, or scheduled. Random deployment, where nodes are placed randomly, is generally adopted in hostile environments or large-scale outdoor deployment areas [30]. Deterministic strategies are used for small-scale situations where we have a precise knowledge of the environment. In scheduled deployment, sensors are placed with higher density in areas where events are concentrated [31]. In indoor environments, random implementation and scheduled deployment are infeasible due to existing of obstacles. The deterministic placement is the only option because it takes into account environmental characteristics [32]. The implementation must consider not only the environment characteristics but also should guarantee a high quality of services [33].
The optimization of WSN implementation has been facing many challenges related to determining node positions to ensure a trade-off between different metrics due to the differential density of WSN. Thus, to find an optimal deployment becomes an NP-Hard task [26]. For this optimization, the intelligent deterministic deployment algorithm is needed by applied metaheuristics [27]. The meta-heuristic offers an excellent alternative method to tackle the NP-Hardness of the deployment problem. These methods have received much attention in the literature. The deployment problem aims to optimize metrics simultaneously with different constraints of the optimization problem of deployment that have been introduced in several papers [34,35]. The mathematical techniques with assumptions, goals, and models were introduced to deal with deployment in WSN as optimization issues [36].
The coverage of the deployment problem is one of the exciting new studies in WSN, which is to improve the service quality of the network and to reduce the cost of deploying nodes. The node’s deployment was studied in order to reduce power consumption with coverage maximization and is shown to prolong the WSN lifespan [37]. The problem is transformed into the essential question that studies how to maximize the coverage with the same node number. Assumed nodes of WSN deployed in two-dimensional space area can be modeled as a connected graph G(V, E), where V and E are the finite set of vertices and edges, respectively, for sensor nodes. is represented as . The location of the node in the network has coordinate (, ) for . The connecting links of the vertices is a network represented as the set of edges with . The number of nodes and links of the network ( are set to |V| and |E|, respectively. If an event is covered point (x,y) by sensor nodes vi. The probability that the point as the link can be defined as follows.
where denoted an existed link of edge, is a sensing radius of the nodes. A link equals (,) from ϵ V to ϵ V, and vice versa from to , and is a Euclidean distance between the target point and the sensor node. The calculation of Euclidean distance between target point p and a sensor node is expressed as follows.
The joint coverage rate for all nodes to monitor the pixel p in the monitoring area as digital discrete of pixel. The probability coverage in the monitoring area is computed as follows.
where S is the monitoring area, P is the coverage probability, and is the number of nodes in the total size of a certain area. The coverage nodes layout of this deployment problem in WSN would be solved by applying the proposed method of diversity-team soccer league (DSLC) algorithm, as presented in Section 5.
3. Diversity Team Soccer League Competition Algorithm
This section presents a new proposed scheme of diversity-team soccer league competition optimization (DSLC) based on updating strategies to improve the SLC algorithm. The updating strategies are composed of trading, drafting, and combining strategies. The trading strategy considers trading transactions of the player between teams after the ending season. The drafting strategy takes advantage of draft principles in real leagues to bring new players to the association. The combining approach is a combination of the policy of the trading and drafting ones. The principle of the DSLC algorithm is stated as follows.
Trading strategy:
The trading strategy is inspired by the players trading between teams in a real soccer league. While the offseason, the stronger teams are looking for potential star players to supplement the active players. The weaker teams are looking for deals to restructure the organization. This strategy can improve the step of league updating in the algorithm that is described as follows. The power of teams in the league is sorted, and then the top-ranked team is selected to trade with one leading player in a selected randomly team. The power of teams is evaluated according to the fitness rate function of the specific problem. The principle is expressed as equations below.
where is a number of the team in the league, ,
, is a number of players, represent any one of the and , respectively. Then, we immigrate the top-ranked team with star players to a selected team randomly in the league and replace the weakened team with the top-ranked team.
where is a random index number.
Drafting strategy:
This strategy is inspired by the draft strategy of introducing new players in the real soccer league that was invented to bring young players into the league. The purpose of the draft strategy is to improve the inferior records of the competitiveness of teams by adding active players. First, we rank the players (who are about to enter the league) according to their strength from high to low, and then, we rate the teams based on the power from low to high. Here the strength or power is the fitness evaluated value of the local and global result. Second, we add the newly selected player in the team, and we also eliminate the weakest player from the group. The principle of the strategy is shown in Figure 1 below.
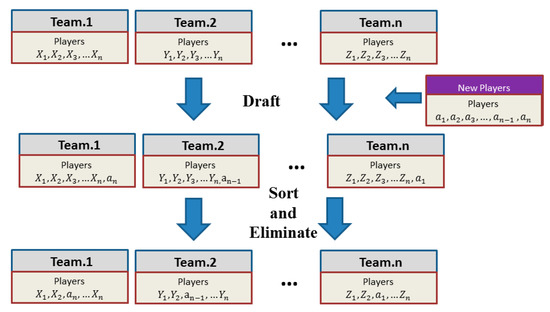
Figure 1.
The principle of drafting strategy.
Figure 1 shows the principle of drafting strategy. The strength of teams is ranked from high to low, and set to 1, 2, …, n. The players on the group may be symbolled as X, Y, Z. Among new players, to represent the rank of the strength of players from high to low. After sorting and eliminating, new players are added to the team, and the weakest players are removed. The advantage of the team could be improved by more diversity.
Combining Strategy
This strategy is a combination of strategies trading and drafting. Parameter random p is used to switch between the trading and drafting strategy. For every season, if is more significant than , the team will conduct (activate) the trading strategy, otherwise enable the drafting strategy, where is a period of running iterations. The advantage of the trading strategy is that the variables of the population can be exchanged with each other, and the diversity of the community can be improved. The power of the drafting strategy can prevent the algorithm from falling into a locally optimal solution prematurely. Figure 2 shows a flowchart of the combining strategy (a combination of the trading and drafting strategy).
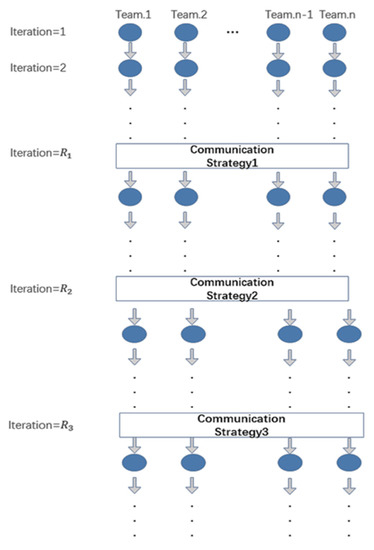
Figure 2.
The combining strategy (a combination of the trading and drafting strategy).
The procedure steps of the proposed DSLC are presented as follows.
Step 1. Initialize: Generate (population size) solutions randomly; calculate fitness function , where the fitness function is assumed to minimize f(x), and the solution vector is . X is the set of values for each variable.
Step 2. Generates sample: New solutions are generated in a league; the following equations, e.g., the number of players, is calculated as follows.
where nT is the number of teams in the league; nMP and nRP are the numbers of main player and reserve players.
The purpose of this step is to generate a random vector for each player as in following equations.
where is a number of teams per league; and and are main players and reserve players per team; k is a number of variables in a team.
Step 3. Team assessment: The strength of each player is calculated and ranked according to the evaluation of the fitness function. If a new solution of objective function value is better than the previous solution, it is replaced with the previous one and added to the team in order of player strength.
Step 4. League competes: The teams start to compete in matches. The operators of imitation and provocation are used to change the strength of the leading players and reserve players for the winner.
For imitation operator, as it is shown in Equation (16), the leading players of the winning team imitate the star player (SP) in their team and the superstar player (SSP) in the league to improve their strength. The following formulas are presented in the SLC algorithm as follows.
In the equation, α and β are parameters for the main players to evolve to Super Player and Super star player, respectively. α and β are random numbers set between 0.7 and 1. For the provocation operator, as it is shown in Equation (17), the reserve players of the winning team imitate the average power of main players and provoke the main players. If the reserve players are better than the main players, the reserve players become the main players, and the main players become reserve players.
In the equation, is the parameter for the reserve players to evolve to the average power of main players. is a random number set between 0.9 and 1.
Step 5. Updating league: Apply the proposed scheme above, updating strategies as communicating activation for enhancing diversity teams in the optimization algorithm.
Step 6. Relegation and promotion: The worst team in the first league is replaced by the best team in the second league.
Step 7. Check the stopping criterion: If the number of iterations is not reached, go to Step 3.
The pseudo-code of the process of the DSLC algorithm is shown in Algorithm 1.
| Algorithm 1: Pseudo-code of the DSLC algorithm |
|
The next sections would present the results of testing the proposed algorithm of DSLC and its application for the node layout of the WSN to find the best node coverage.
4. Experimental Results of Testing Problems
In this section, for meeting test functions’ diversity, twenty-one benchmark functions from the CEC2017 [38,39] are utilized to test the performance of the proposed DSLC. The selected benchmark problems consist of a broad range of test problems, e.g., uni-modal, multi-modal, and fixed-dimension functions. The detail presetting max iteration, dimensions, and boundaries for the function tests are listed in Table 1. The obtained optimal results of the proposed schemes (the DSLC-1, 2 and 3) are compared with the original SLC [18], genetic algorithm (GA) [11], firefly algorithm (FA) [12], and adaptive differential evolution (JADE) [13], respectively.

Table 1.
Twenty-one selected benchmark functions.
Different scenarios for testing the performance of the proposed DSLC are simulated, e.g., DSLC-Trading (DSLC-1), DSLC-Drafting (DSLC-2), and DSLC-Combining (DSLC-3) strategies, respectively, for the benchmark functions. The population size of the four algorithms, e.g., DSLC, SLC, GA, and FA in comparison is the same that set to 80. The switch probability is equal to 0.8. The parameter equals to 10, as communication should be done every ten iterations, and the mutation rate equals to 0.05, crossover constant equals to 0.08 for GA. Because of the strong randomness of the meta-heuristic algorithms, the number of runs is set to 20, and their results are averaged.
The comparison results of the proposed DSLC-1, DSLC-2, and DSLC-3 with the SLC, FA, and GA algorithms are listed in Table 2, Table 3 and Table 4, respectively. In these tables, three symbols: “+”, “-” and “~” are used to indicate the rate (r) of a pair of comparison results of the proposed schemes with other algorithms whose symbols can be “better”, “worse”, or “similar”, respectively.

Table 2.
Comparison of the obtained results of the proposed DSLC-Trading strategy (DSLC-1) with the SLC, FA, and GA algorithms for the test functions.

Table 3.
Comparison of the obtained results of the proposed DSLC-Drafting strategy (DSLC-2) with the SLC, FA, and GA algorithms for the test functions.

Table 4.
Comparison of the obtained results of the proposed DSLC-Combining strategy (DSLC-3) with the SLC, FA, and GA algorithms for the test functions.
Table 2 shows a comparison of the obtained results of the proposed DSLC-Trading strategy (DSLC-1) with the SLC, FA, and GA algorithms for the test functions. As it can be seen in Table 2, the DSLC-Trading procedure (DSLC-1) performs well according to different rates that produce a higher number of “+” symbols than the other competitors, e.g., the SLC, FA, and GA algorithms.
Table 3 and Table 4 show the comparison of the obtained results of the proposed DSLC-drafting strategy (DSLC-2) and DSLC-Combining strategy (DSLC-3) with the SLC, FA, and GA algorithms respectively for the test functions. As can be observed from the tables, the obtained results from the proposed schemes provide a better performance than that of the other competitors. It can be concluded that the proposed DSLC scheme provides a higher number of “winner +” than the FA, GA, and SLC methods for global optimization. It means that the proposed DSLC offers excellent performance in dealing with different test optimization functions.
Table 5 depicts a comparison of the JADE algorithm [13] with the proposed DSLC-strategies (DSLC-1, 2, and 3) for the test functions. As can be seen in the table, the DSLC-procedures also perform well, with a number of winners than the JADE algorithm. That means JADE obtained more “-” symbols than the DSLC scheme.

Table 5.
Comparison of the JADE algorithm with the proposed DSLC-strategies (DSLC-1, 2, and 3) for the test functions.
Figure 3, Figure 4, Figure 5 and Figure 6 show the comparison results of the proposed schemes of DSLC-1, 2, and 3 with the SLC, FA, and GA algorithms listed in (a), (b), and (c), respectively. Panel (d) compares three schemes of strategies with the SLC algorithm for testing function 3.
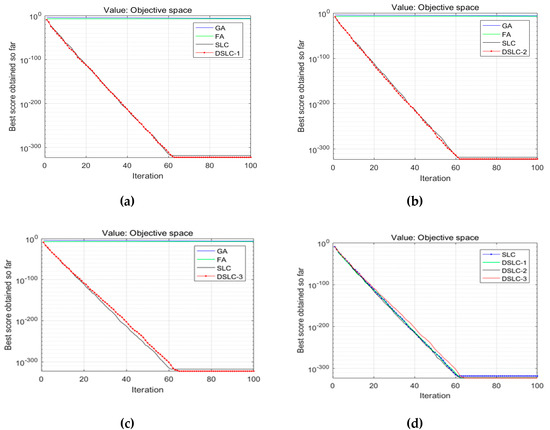
Figure 3.
Comparison results of the proposed DSLC-1, 2, and 3 with the SLC, FA, and GA that listed (a), (b), and (c), respectively; (d) shows three schemes of strategies with the SLC algorithm for testing function 3.
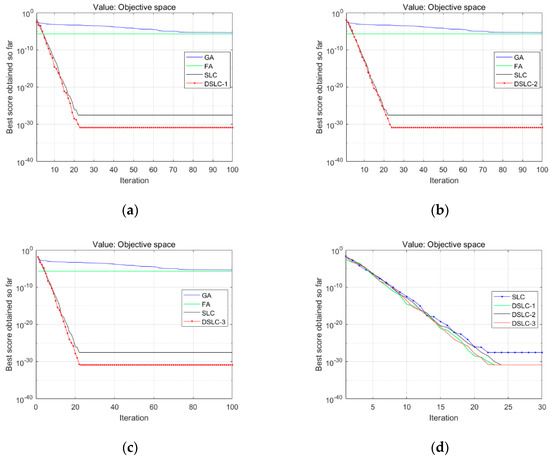
Figure 4.
Comparison results of the proposed DSLC-1, 2, and 3 with the SLC, FA, and GA that listed (a), (b), and (c), respectively; (d) shows three schemes of strategies with the SLC algorithm for testing function 13.
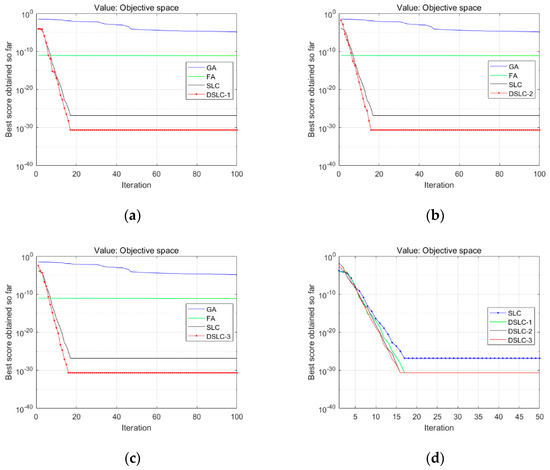
Figure 5.
Comparison results of the proposed DSLC-1, 2, and 3 with the SLC, FA, and GA that listed (a), (b), and (c), respectively; (d) shows three schemes of strategies with the SLC algorithm for testing function 16.
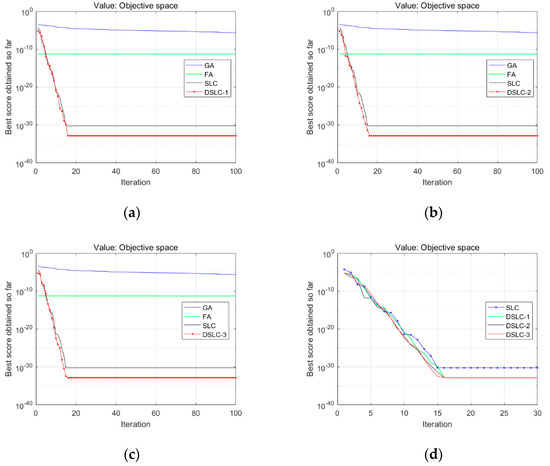
Figure 6.
Comparison results of the proposed DSLC-1, 2, and 3 with the SLC, FA, and GA that listed (a), (b), and (c), respectively; (d) shows three schemes of strategies with the SLC algorithm for testing function 17.
Clearly, the cases of these testing functions on the proposed schemes of DSLC-1, 2, and 3 all provide comparatively faster convergence than other algorithms. It says the accuracy of the performance on testing functions of the proposed method of the DSLC procedures is improved significantly.
5. Applied DSLC for Deployment Optimization in WSN
WSN deployment still faces many challenges that are related to determining node positions to ensure a trade-off between different metrics. Due to the high density of WSN, finding an optimal deployment becomes an NP-Hard task. This section presents the applied DSLC algorithm to the deployment optimization of WSN based on node coverage technique. The experimental results of the DSLC algorithm are compared with the SLC, GA [40], and FA [41] algorithms for the coverage of node layout in the deployment of WSN.
5.1. Objective Function
The problem of determining the optimal spatial node coverage of implementation WSN is studied to model objective function mathematically. The formulation is figured out based on mathematical modeling of the coverage. In the node coverage problem, we assume sensor nodes as and the space node as . Sensor coverage radius is r as . The solution vector is of the position of main players in the team in DSLC algorithm for coverage deployed optimization. It means , where is the coordinate sensor or its location in the network. Because of the existing environmental surrounding noise in WSN, deployment causes decreasing accuracy of the coverage area. In practice, the sensor node covering model as referred to in Equation (6) should be modified the probability model as follows.
where is a measure of detecting uncertainty; (), r is the sensing radius of the node; and are parameters which depend on physical attributes of sensors; and is Euclidean distance point p to the sensor . Two input parameters are and that are presented as follows.
The coverage probability ratio of the deploying area is constructed as the objective function of the entire network coverage optimization.
where is a testing coverage point that has coordinate , α is an event covered checking point and whether covered or not, the node is replaced. The formula of α is expressed as follows:
The node coverage in WSN deploying outline is processed as follows. The probability of coverage for each node is computed by applying DSLC for fitness function as in the Equation (20) to point pixels. The pixel points coverage is summarized as in the Equation (8) to join coverage of all pixels in the region for the entire network.
5.2. Parameter Setting
In the experiment, assumed N-nodes WSN was deployed in scattering the area of M × M randomly. N is a number of nodes that can be set to 100, 200, 300; is a length measurement of the deployed area that can be 30, 50, 90 meters. The network has a base station (BS) that operates with an unlimited power supply. The characteristics of WSN operation were assumed to behave like scheduling periods of packet transmission time. The parameters are set for the metaheuristic algorithms: the DSLC, SLC, FA, and GA methods are the same condition to solve the same problem of the deployment WSN for comparing fairly. Table 6 lists the initial values for setting the parameters of the experiment.

Table 6.
Initial values for setting parameters of the experiment.
5.3. Experimental Results
Figure 7, Figure 8 and Figure 9 show the results of the node distributed visually by optimizing the deployment node position layout of the proposed schemes of DSLC-1, 2, 3 and SLC, FA, GA methods, respectively. Observably, in these figures, it can be seen that the results obtained by the proposed schemes of DSLC produce a better node distributed layout of WSN implementation than the other competitors in the comparison. The obtained results are more realistic and more optimal in terms of deployment space shape.
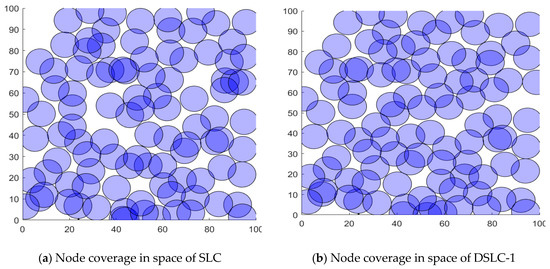
Figure 7.
Node distributed results of the optimized deploying node position layout visually, by the proposed scheme DSLC-1 and the SLC method, respectively.
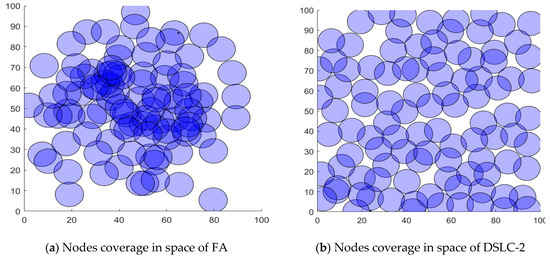
Figure 8.
Node distributed results of the optimized deploying node position layout visually, by the proposed scheme DSLC-2 and the SLC method, respectively.
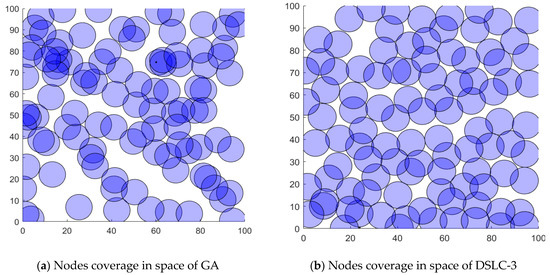
Figure 9.
Node distributed results of the optimized deploying node position layout visually, by the proposed scheme DSLC-1 and the SLC method, respectively.
Table 7 indicates the Comparison of the coverage optimization performance of the proposed schemes of DSLC with SLC, FA, and GA for different deployed regions. As can be seen in Table 7, it can be said that the proposed approach provides an optimal solution to the deployment of WSN in that the nodes are included in connectivity evaluation and fully connected. In the proposed strategies, the combining strategy DSLC-3 offers more diverse groups than the other policies in the study, and it produces a better performance.

Table 7.
Comparison of the coverage optimization performance of the proposed schemes of DSLC with SLC, FA, and GA for different deployed regions.
Figure 10 shows the comparison of the obtained coverage rate of the proposed DSLC-3 with the SLC, FA, and GA methods for the deployment WSN optimization. It can be seen from the figure that the proposed scheme of DSLC-3 can cover the entire deploying area with the best layout of the nodes. It can be concluded from the experimental results that the effect of the DSLC achieves the optimal global solution and generally produces better than the SLC, FA, and GA algorithms.
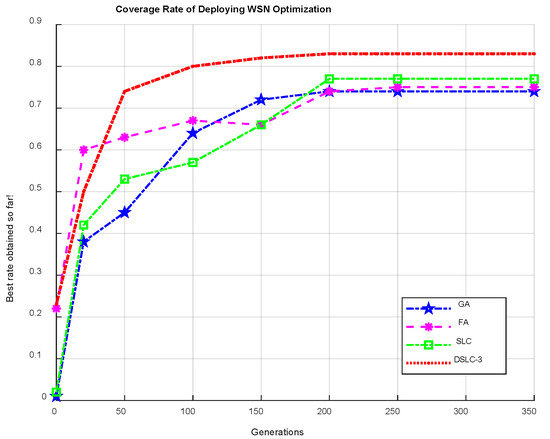
Figure 10.
Comparison of the obtained coverage rate of the proposed DSLC-3 with the SLC. FA, and GA methods for the deployment WSN optimization.
6. Conclusions
In this paper, we proposed an enhanced diversity team soccer league competition (namely DSLC) algorithm based on updating strategies of league team members for global optimization and deployment wireless sensor network (WSN) problems. The proposed approach aims to enhance the exploration of algorithm searching to avoid the local optimum trap in solving complex issues such as the deployment issue of WSN. The updating team strategies consist of trading, drafting, and combining schemes in the soccer league. We used twenty-one selected benchmark functions of CEC2017 and the node coverage problem of WSN deployment to test the performance of the proposed algorithm. The experimental results of the proposed method were compared with the other algorithms in the literature, e.g., soccer league competition (SLC), firefly algorithm (FA), genetic algorithm (GA), and adaptive differential evolution (JADE). The compared results show that the proposed DSLC algorithm provides increased accuracy optimization in dealing with complex optimization problems. In future work, the problem of optimal spatial node location of WSN in the indoor environment will be considered to deal with multi-objective optimization function that combines coverage, connection rate, node energy, and cost by applying the proposed DSLC algorithm.
Author Contributions
Conceptualization, S.-C.C. and J.-S.P.; formal analysis, T.-T.N.; methodology, Y.Q.; software, T.-T.N.; supervision, T.-K.D. and J.-S.P.; writing—original draft Y.Q.; writing —review and editing, K.D. All authors have read and agreed to the published version of the manuscript.
Funding
This research received no external funding.
Conflicts of Interest
The authors declare no conflict.
References
- Hussain, K.; Mohd Salleh, M.N.; Cheng, S.; Shi, Y. Metaheuristic research: A comprehensive survey. Artif. Intell. Rev. 2019, 52, 219102233. [Google Scholar] [CrossRef]
- Sedigheh, M.; Shiri, M.E. Metaheuristics in large-scale global continues optimization: A survey. Inf. Sci. 2015, 295, 407–428. [Google Scholar]
- Nguyen, T.-T.; Pan, J.-S.; Dao, T.-K. A Compact Bat Algorithm for Unequal Clustering in Wireless Sensor Networks. Appl. Sci. 2019, 9, 1973. [Google Scholar] [CrossRef]
- Du, Z.-G.; Pan, J.-S.; Chu, S.-C.; Luo, H.-J.; Hu, P. QUasi-Affine TRansformation Evolutionary Algorithm with Communication Schemes for Application of RSSI in Wireless Sensor Networks. IEEE Access 2020, 8, 8583–8594. [Google Scholar] [CrossRef]
- Shaheen, A.M.; Spea, S.R.; Farrag, S.M.; Abido, M.A. A review of meta-heuristic algorithms for reactive power planning problem. Ain Shams Eng. J. 2018, 9, 215–231. [Google Scholar] [CrossRef]
- Shanmugasundaram, G.; Thilagavathi, N.; Ramya, S.; Kanimozhi, K. An Investigation of Meta Heuristic Algorithms Applied on Capacitated Vehicle Routing Problem. In Proceedings of the 2019 IEEE International Conference on System, Computation, Automation and Networking (ICSCAN), Pondicherry, India, 29–30 March 2019; pp. 1–6. [Google Scholar]
- Souier, M.; Sari, Z.; Hassam, A. Real-time rescheduling metaheuristic algorithms applied to FMS with routing flexibility. Int. J. Adv. Manuf. Technol. 2013, 64, 145–164. [Google Scholar] [CrossRef]
- Chu, S.-C.; Du, Z.-G.; Pan, J.-S. Symbiotic Organism Search Algorithm with Multi-Group Quantum-Behavior Communication Scheme Applied in Wireless Sensor Networks. Appl. Sci. 2020, 10, 930. [Google Scholar] [CrossRef]
- Tian, A.Q.; Chu, S.C.; Pan, J.S.; Cui, H.; Zheng, W.M. A Compact Pigeon-Inspired Optimization for Maximum Short-Term Generation Mode in Cascade Hydroelectric Power Station. Sustainability 2020, 12, 767. [Google Scholar] [CrossRef]
- Sörensen, K.; Sevaux, M.; Glover, F. A history of metaheuristics. In Handbook of Heuristics; Springer: Berlin, Germany, 2018; ISBN 9783319071244. [Google Scholar]
- Holland, J.H. Adaptation in Natural and Artificial Systems: An Introductory Analysis with Applications to Biology, Control, and Artificial Intelligence; MIT Press: Cambridge, MA, USA, 1975; ISBN 978-0-262-08213-6. [Google Scholar]
- Yang, X.-S. Firefly Algorithms for Multimodal Optimization BT—Stochastic Algorithms: Foundations and Applications; Watanabe, O., Zeugmann, T., Eds.; Springer: Berlin, Heidelberg, 2009; pp. 169–178. [Google Scholar]
- Zhang, J.; Sanderson, A.C. JADE: Adaptive differential evolution with optional external archive. IEEE Trans. Evol. Comput. 2009, 13, 945–958. [Google Scholar] [CrossRef]
- Chu, S.A.; Tsai, P.W.; Pan, J.S. Cat swarm optimization. In Proceedings of the Lecture Notes in Computer Science (Including Subseries Lecture Notes in Artificial Intelligence and Lecture Notes in Bioinformatics, Guilin, China, 7–11 August 2006. [Google Scholar]
- Elbeltagi, E.; Hegazy, T.; Grierson, D. Comparison among five evolutionary-based optimization algorithms. Adv. Eng. Informatics 2005, 19, 43–53. [Google Scholar] [CrossRef]
- Nguyen, T.-T.; Dao, T.-K.; Kao, H.-Y.; Horng, M.-F.; Shieh, C.-S. Hybrid Particle Swarm Optimization with Artificial Bee Colony Optimization for Topology Control Scheme in Wireless Sensor Networks. J. Internet Technol. 2017, 18, 743–752. [Google Scholar]
- Dao, T.K.; Pan, T.S.; Nguyen, T.T.; Pan, J.S. Parallel bat algorithm for optimizing makespan in job shop scheduling problems. J. Intell. Manuf. 2018, 29, 451–462. [Google Scholar] [CrossRef]
- Naser Moosavian, B.K.R. Soccer League Competition Algorithm, a New Method for Solving Systems of Nonlinear Equations. Int. J. Intell. Sci. 2014, 4, 7–16. [Google Scholar] [CrossRef]
- Moosavian, N.; Roodsari, B.K. Soccer League Competition Algorithm: A Novel Meta-heuristic Algorithm For Optimal Design of Water Distribution Networks. Swarm Evol. Comput. 2014, 17, 14–24. [Google Scholar] [CrossRef]
- Chagwiza, G.; Jaison, A.; Masamha, T. Parameter Improvement of the Soccer League Competition Algorithm by Introducing Stubborn Players: Application to Water Distribution Network. Math. Probl. Eng. 2016, 2016, 3425374. [Google Scholar] [CrossRef]
- Hedieh Sajedi, S.K. Cognitive Soccer League Competition algorithm for solving knapsack problems. In Proceedings of the 1ST International Conference on Advances Research on Electrical and Computer Engineering, Tehran, Iran, 13 May 2016; p. 10240. [Google Scholar]
- Jaramillo, A.; Gómez, A.; Mansilla, S.; Salas, J.; Crawford, B.; Soto, R.; Olguín, E. Using the Soccer League Competition algorithm to solve the set covering problem. In Proceedings of the 2016 11th Iberian Conference on Information Systems and Technologies (CISTI), Gran Canaria, Spain, 15–18 June 2016; pp. 1–4. [Google Scholar]
- O’Donovan, T.; O’Donoghue, J.; Sreenan, C.; Sammon, D.; O’Reilly, P.; O’Connor, K.A. A context aware wireless Body Area Network (BAN). In Proceedings of the 2009 3rd International Conference on Pervasive Computing Technologies for Healthcare—Pervasive Health 2009, London, UK, 1–3 April 2009. [Google Scholar]
- Anastasi, G.; Farruggia, O.; Re, G.L.; Ortolani, M. Monitoring High-Quality Wine Production using Wireless Sensor Networks. In Proceedings of the 2009 42nd Hawaii International Conference on System Sciences, Waikoloa, HI, USA, 5–8 January 2009; pp. 1–7. [Google Scholar]
- Akyildiz, I.; Su, W.; Sankarasubramaniam, Y.; Cayirci, E. Wireless sensor networks: A survey. Comput. Networks 2002, 38, 393–422. [Google Scholar] [CrossRef]
- Chakrabarty, K.; Iyengar, S.S.; Qi, H.; Cho, E. Grid coverage for surveillance and target location in distributed sensor networks. IEEE Trans. Comput. 2002, 51, 1448–1453. [Google Scholar] [CrossRef]
- Pan, J.-S.; Nguyen, T.-T.; Dao, T.-K.; Pan, T.-S.; Chu, S.-C. Clustering Formation in Wireless Sensor Networks: A Survey. J. Netw. Intell. 2017, 02, 287–309. [Google Scholar]
- Nguyen, T.-T.; Pan, J.-S.; Wu, T.-Y.; Dao, T.-K.; Nguyen, T.-D. Node Coverage Optimization Strategy Based on Ions Motion Optimization. J. Netw. Intell. 2019, 4, 1–9. [Google Scholar]
- García-hernández, C.F.; Ibargüengoytia-gonzález, P.H.; García-hernández, J.; Pérez-díaz, J. A Wireless Sensor Networks and Applications: A Survey. J. Comput. Sci. 2007, 7, 264–273. [Google Scholar]
- Nguyen, T.-T.; Pan, J.-S.; Lin, J.C.-W.; Dao, T.-K.; Nguyen, T.-X.-H. An Optimal Node Coverage in Wireless Sensor Network Based on Whale Optimization Algorithm. Data Sci. Pattern Recognit. 2018, 2, 11–21. [Google Scholar]
- Fei, Z.; Li, B.; Yang, S.; Xing, C.; Chen, H.; Hanzo, L. A Survey of Multi-Objective Optimization in Wireless Sensor Networks: Metrics, Algorithms, and Open Problems. IEEE Commun. Surv. Tutor. 2017, 19, 550–586. [Google Scholar] [CrossRef]
- Jourdan, D.B.; Roy, N. Optimal sensor placement for agent localization. ACM Trans. Sens. Networks 2008, 4, 1–40. [Google Scholar] [CrossRef]
- Chen, Y.; Chuah, C.-N.; Zhao, Q. Sensor placement for maximizing lifetime per unit cost in wireless sensor networks. In Proceedings of the MILCOM 2005—2005 IEEE Military Communications Conference, Atlantic City, NJ, USA, 17–20 October 2005; pp. 1097–1102. [Google Scholar]
- Nguyen, T.-T.; Pan, J.-S.; Dao, T.-K. A Novel Improved Bat Algorithm Based on Hybrid Parallel and Compact for Balancing an Energy Consumption Problem. Information 2019, 10, 194. [Google Scholar] [CrossRef]
- Nguyen, T.T.; Pan, J.S.; Dao, T.K. An Improved Flower Pollination Algorithm for Optimizing Layouts of Nodes in Wireless Sensor Network. IEEE Access 2019, 7, 75985–75998. [Google Scholar] [CrossRef]
- Nguyen, T.-T.; Dao, T.-K.; Horng, M.-F.; Shieh, C.-S. An Energy-based Cluster Head Selection Algorithm to Support Long-lifetime in Wireless Sensor Networks. J. Netw. Intell. 2016, 1, 23–37. [Google Scholar]
- Dao, T.K.; Pan, T.S.; Nguyen, T.T.; Chu, S.C. A compact Articial bee colony optimization for topology control scheme in wireless sensor networks. J. Inf. Hiding Multimed. Signal Process. 2015, 6, 297–310. [Google Scholar]
- Liang, J.J.; Qu, B.Y.; Suganthan, P.N. Problem definitions and evaluation criteria for the CEC 2014 special session and competition on single objective real-parameter numerical optimization. In Computational Intelligence Laboratory, Zhengzhou University, Zhengzhou China and Technical Report, Nanyang Technological University, Singapore; Technical Report: Zhengzhou, China, 2013; p. 635. [Google Scholar]
- Wu, G.; Mallipeddi, R.; Suganthan, P.N. Problem definitions and evaluation criteria for the CEC 2017 competition on constrained real-parameter optimization. In National University of Defense Technology, Changsha, Hunan, PR China and Kyungpook National University, Daegu, South Korea and Nanyang Technological University, Singapore, Technical Report; Technical Report: Zhengzhou, China, 2017. [Google Scholar]
- Kalayci, T.E.; Uğur, A. Genetic algorithm–based sensor deployment with area priority. Cybern. Syst. 2011, 42, 605–620. [Google Scholar] [CrossRef]
- Tuba, E.; Tuba, M.; Beko, M. Mobile wireless sensor networks coverage maximization by firefly algorithm. In Proceedings of the 2017 27th International Conference Radioelektronika (RADIOELEKTRONIKA), Brno, Czech Republic, 19–20 April 2017; pp. 1–5. [Google Scholar]
© 2020 by the authors. Licensee MDPI, Basel, Switzerland. This article is an open access article distributed under the terms and conditions of the Creative Commons Attribution (CC BY) license (http://creativecommons.org/licenses/by/4.0/).