Abstract
Interest in sports predictions as well as the public availability of large amounts of structured and unstructured data are increasing every day. As sporting events are not completely independent events, but characterized by the influence of the human factor, the adequate selection of the analysis process is very important. In this paper, seven different classification machine learning algorithms are used and validated with two validation methods: Train&Test and cross-validation. Validation methods were analyzed and critically reviewed. The obtained results are analyzed and compared. Analyzing the results of the used machine learning algorithms, the best average prediction results were obtained by using the nearest neighbors algorithm and the worst prediction results were obtained by using decision trees. The cross-validation method obtained better results than the Train&Test validation method. The prediction results of the Train&Test validation method by using disjoint datasets and up-to-date data were also compared. Better results were obtained by using up-to-date data. In addition, directions for future research are also explained.
1. Introduction
Predicting outcomes in sport is a challenging and interesting task. Therefore, methodologies that achieve better prediction results currently represent a hot topic for scientific researches. A basic condition for building a good prediction model is a sufficient amount of the relevant data, in a structured or unstructured form. Furthermore, it is important to have a good knowledge of the observed process to understand the predicting process, how past events affect future events, and to know the causes and consequences of particular process actions.
Outcome prediction in sports has been a very favored research area for the last 15 years. The number of outcome prediction scientific papers is related to the popularity of the sport, such as football, basketball, and baseball, but there are also scientific papers related to outcome prediction in tennis, hockey, cricket, etc. In this paper, emphasis will be in predicting basketball games outcomes.
In this research, supervised machine learning was applied for basketball game outcome prediction, and therefore binary classification was used. Seven classification machine learning algorithms were applied, and their results were validated. In this research, two validation methods—Train&Test validation and cross-validation—were applied and compared. One of the purposes of this research was to determine the possibilities and disadvantages of each validation method in predicting basketball games outcomes.
The aim of this paper is, through the comparison of the classification machine learning algorithms in predicting basketball game outcomes, to define which algorithm, validation method, and data preparation method produces better prediction results.
This paper demonstrates what impact the different validation methods have on the prediction accuracy when using different ML algorithms. Moreover, the impact of selecting a validation method on the prediction results when applying ML to the disjoint datasets or the up-to-date data is revealed, thereby enabling the formation of recommendations for the most appropriate combination of the ML algorithm and validation method, depending on the available datasets.
After this introduction and the overview of sport outcome-related researches, the second chapter provides the basic information about classification machine learning algorithms and the validation methods applied in this research. The third chapter describes the data acquisition and data preparation procedures. The research results are presented and discussed in the fourth chapter, and the conclusions are given at the end of paper.
Related Literature Review
The most common algorithm in predicting outcomes in sports are neural networks coupled with the Train&Test validation method. The authors of [1] used a variety of neural networks and Train&Test validation for predicting game outcomes in the National Basketball Association (NBA) league, with the best results of more than 70%. In [2], the authors used 37 algorithms in the Waikato Environment for Knowledge Analysis (WEKA) and Train&Test validation method. The result with the best yield was 72.8%, showing that the best classifiers have 5% better precision than the referent classifier, which favors the team with the better rating. The authors of [3] used logistic regression, Naïve Bayes, Support Vector Machine (SVM), and multilayer perceptron neural network for predicting NBA basketball games by using two approaches: cross-validation and Train & Test validation method. The results achieved a yield of slightly less than 70%, but this result was better with the Train & Test validation method. The authors of [4] used the Train&Test validation method and multilayer perceptron backpropagation neural network, linear regression and MaximumLikelihood Classifier for predicting NBA games outcome and achieved accuracies of nearly 70 %.
In [5], the authors proposed a Mixture Density Network (MDN) model with Train&Test validation method and achieved maximum in-season (internal) accuracy of 86.7% and a maximum out of season (external) accuracy of 82%. The MDN model was trained on 4440 games from 2002–2014 seasons and tested on 500 games from 2002 to 2014 (internal) and 500 games from the held out 2016–2017 season (external). The authors of [6] used the Naïve Bayes for outcome prediction and multivariate linear regression for spread calculation. The database was always up-to-date while previous day data were added to the existing data in the system. Using cross-validation, the authors produced an accuracy of 67% in outcome prediction and 10% in spread prediction. The authors of [7] used various classification and regression-type machine learning methods and the cross-validation method to predict the outcome of NBA games. The best result (more than 65%) yielded Gaussian discriminant analysis (GDA) with accuracy followed by linear regression, SVM coupled with Principal Component Analysis (PCA), random forest, and adaptive boosting method. In [8], the authors used SVM and logistic regression for predicting the outcome of NBA basketball games and yielded best results of 70% using cross-validation. The authors of [9] used logistic regression, adaptive boost, random forest, SVM, and Gaussian Naïve Bayes to predict the outcome of NBA games. The prediction method random forest achieved the best accuracy, thereby using Train&Test validation method.
The Train&Test validation method was also used in the next papers. The authors of [10] proposed a model based on SVM with support of decision tree and using correlation-based feature selection (CFS) feature selection algorithm achieved accuracy of 85.25%. Without feature selection, authors achieved accuracy of 67%. In [11], the authors proposed a model based on k-nearest neighbours (K-NN) for predicting Euroleague games. The authors used several models using different k and number of seasons. The best results, having an accuracy of 83.96%, were achieved by using k = 3 for dataset of three seasons and dataset of one season and k = 5 or k = 7. The authors of [12] used feedforward neural network and the Train& Test validation method for basketball games outcome prediction and achieved an accuracy of 80.96%. In [13], the authors applied the Maximum Entropy principle to a set of features and established the NBA Maximum Entropy model. The authors achieved accuracy of 74.40%. The authors of [14] proposed a matrix factorization prediction model where different season number was used as a training dataset and the 2015/2016 season was used for testing. The best results of 70.95% were achieved by using a single season as a training dataset. The authors of [15] proposed a pioneering modeling approach based on stacked Bayesian regressions and achieved accuracy of 85.28%.
In [16], the authors used ten fuzzy models to predict ACB league results and used the cross-validation method. The author used two datasets. The first dataset, which refers to the last three games, had six features and achieved a best result of 82%. The second, advanced model, used eight feature selection methods results and picked 5 out of 15 features that have been repeatedly selected by algorithms, including whole season results and achieved best accuracy of 71.5%. In [17], the authors proposed a model for predicting college basketball game outcomes by using J48, random forests, Naïve Bayes, and multilayer perceptron neural network. The authors used previous seasons as a training dataset and a single season as a testing dataset. Naïve Bayes algorithm is also applied as an underlying classifier for predictions in [18], whereas in [19], the optimal results of prediction are achieved with random forest classifier. The authors in [20] describe the developed Hybrid Fuzzy Support Vector Machine (HFSVM) model for analyzing the outcomes of basketball competitions.
2. Applied Algorithms and Methods
The types of machine learning differ in their approach, the type of data, and the type of solving problem. Machine learning is usually subcategorized into three types: supervised learning, unsupervised learning, and reinforcement learning. Supervised learning develops a predictive model based on both input and output data. Unsupervised learning groups and interprets data based only on input data, whereas reinforcement learning trains the algorithm by using a system of reward and punishment.
Supervised learning algorithms include classification and regression. Classification algorithms are used when the output is restricted to a limited set of values and regression algorithms are used when the outputs may have any numerical value within a range. Lately, the term of semisupervised learning, a combination of supervised and unsupervised learning, has also been frequently used. Semisupervised learning algorithms include algorithms capable of working with partially labelled data and large amounts of unlabeled data. Sports predictions are usually treated as a classification problem by which one class is predicted [21], and rare cases are predicted by numerical values. The results in [22] also reveal that the classification predictive schemes predict game outcomes better than the regression schemes.
This chapter will provide basic information about seven classification machine learning algorithms and two validation methods applied in this research.
2.1. Supervised Classification Machine Learning Algorithms
A total of seven classification machine learning algorithms were used during this research: logistic regression, Naïve Bayes, decision tree, neural multilayer perceptron network, random forest, k-nearest neighbors, and LogitBoost. The classifiers that are used in the prediction process are implemented in WEKA, freely available software licensed under the GNU General Public License and the companion software to the book “Data mining: Practical Machine Learning Tools and Techniques”. WEKA was developed at the University of Waikato, New Zealand [23,24].
2.1.1. Logistic Regression Algorithm
Logistic regression is a generalization of linear regression [25], and it is used for estimating binary or multi-class dependent variables, and the response variable is discrete. Logistic regression is a statistical model that uses sigmoid functions (2) to model binary dependent variables. Sigmoid (logistic functions) are suitable for statistical analyzes of binary classification problems, because they always position any real number in the interval between 0 and 1. Logistic regression is very similar to linear regression, which calculates output for a given input, using specific coefficients or weights. The only difference is that logistic regression always gives binary outputs 0 or 1.
Logistic regression is used to classify the low-dimensional data having nonlinear boundaries. For the binary classification problem, as explained in [3], the linear function (1) is extended by the logistic function (2) to form the function (3).
Thereby, the parameter z can be defined as
where W, w0, and θ are the parameters of the model.
2.1.2. Naïve Bayes Algorithm
Naive Bayes is a group of simple classification techniques that assume complete independence of all values of feature vectors. The first applications were in the categorization of texts and later began to be used in medical diagnostics and in sports.
The core concept of Naïve Bayes classifier is Bayes theorem with independent assumptions between predictors. The simplest approach of Bayesian network is Naïve Bayes in which all attributes of a dataset are independent to its class variable value. Therefore, Naïve Bayes classifier is a Bayesian network where the class has no parents and each attribute has the class as its sole parent. Naïve Bayes classifiers require a small amount of training data to predict the parameters for classification. For classification, the standard Naïve Bayes algorithm computes the posterior probability P (cj | x) of sample x belonging to class cj according to the Bayes’ rule:
2.1.3. Decision Trees Algorithm
Decision trees is a method for classification by modeling a tree structure model with leaves representing class labels and branches representing conjunctions of features. The decision tree algorithm belongs to a group of supervised learning algorithms used to solve regression and classification problems. The main goal is to create a training model that can predict the target variables based on the learned decision rules. There are two types of Decision Tree algorithms, based on the type of target variables: categorical variable decision tree and continuous variable decision tree.
The output of the learning process is a classification tree where the split at each node of the tree represents an if-then decision rule and each leaf corresponds to one value of the target variable.
2.1.4. Multilayer Perceptron Neural Network Algorithm
A multilayer perceptron neural network is a variant of the original Perceptron model proposed by Rosenblatt in the 1950 [26]. A multilayered perceptron network is a subset of artificial neurons that utilize activation discontinuous step function. Depending on the activation function, they can be used for classification or regression.
The network has one or more hidden layers between, the neurons are organized in layers, the connections are always directed from lower layers to upper layers, and the neurons in the same layer are not interconnected.
2.1.5. Random Forest Algorithm
Random forest consists of a large number of individual decision trees and is a generic name for a group of methods used by tree classifiers (6), where {θk} is a set of uniformly distributed, completely independent vectors and x is input vector pattern.
When training, the random forest algorithm creates many trees, which are each trained on a defined number of samples of the original training set. The idea is to train each tree on different samples to gain lower variance for the entire forest, but not at the cost of increasing the bias; although, each tree might have high variance with respect to a particular set of the training data. The prediction that most often occurs in individual trees becomes the final selection of a random forest.
2.1.6. K-NN Algorithm
The K-NN algorithm is a nonparametric supervised machine learning method that can be used for classification and regression problems. Both methods (classification and regression) assign weights to the contributions of the neighbors, where the nearer neighbors contribute more than the others. The method fundamentally relies on a metric distance value. The most common metric is Euclidean distance (7), although other metrics that can be used as well [11].
2.1.7. LogitBoost Algorithm
LogitBoost is an influential boosting algorithm for classification and represents an application of established logistic regression techniques to the AdaBoost method. Its main objective is to reduce bias and variance in supervised learning, as well as to convert poor (weak) classifiers into classifiers that are well-correlated with the true classification.
2.2. Data Validation Methods
The possibilities and disadvantages of two validation methods—Train&Test validation and cross-validation—applied in predicting basketball games outcomes were explored during this research.
By using the Train&Test model validation method, the input dataset is divided into two or three different, but not necessarily chronologically ordered, datasets: training dataset, validation dataset, and testing dataset. The validation dataset is not always used and is usually used for the parameter tuning of the final model. For the prediction of sporting events, it is recommended to use chronologically ordered datasets, as sporting events are not completely independent events. Historical data can provide very useful information in predicting future events. With the Train&Test method, the model learns on the training dataset, and then it is evaluated on the testing dataset. The Train&Test validation method flow chart is shown in Figure 1.
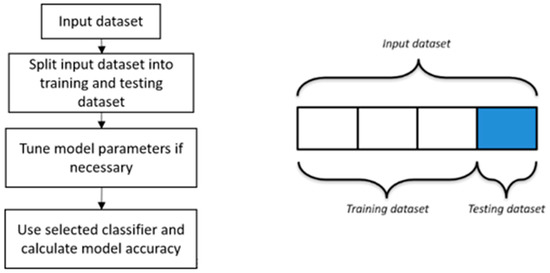
Figure 1.
Train&Test validation method.
In the cross-validation method, the initial dataset is divided into k separate subsets Ti for i = 1,2,…,k. The parameter k is not strictly defined but depends on the situation and the expert’s assessment. With this method, one of the k subsets is used for testing, and the other subsets are used for training. The procedure is repeated k times and the average accuracy of the model is calculated (Figure 2). Cross-validation has an advantage over the Train&Test method because all Ti subsets are used for training as well as for testing.
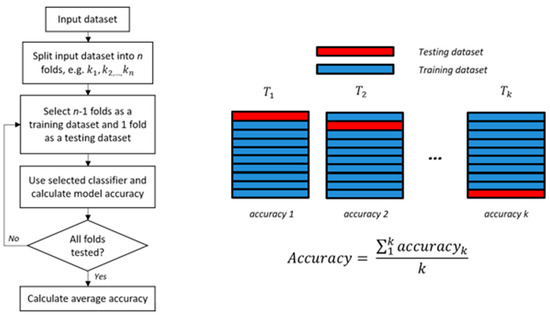
Figure 2.
Cross-validation method.
3. Data Acquisition and Preparation
A sufficient amount of relevant data is a basic condition for building a good prediction model. This chapter will provide information about data acquisition, and two data preparation methods will be presented.
3.1. Data Acquisition
The dataset used for this research was originally downloaded from the Basketball-reference.com website. Publicly available statistics of nine consecutive NBA seasons, from 2009/2010 to 2017/2018, known as Box-score data, are used in this research. This data contains detailed statistics of each analyzed game during all analyzed seasons. The database contains a total of 11,578 games, which provide sufficient data to reveal classification machine learning algorithm possibilities and to present validation methods results. Both the regular and playoff games are included, and a total of basic 13 features per team are used. Table 1 shows used Box-score feature.

Table 1.
List of feature vectors.
Unstructured data from the Basketball-Reference website are extracted, transformed, and loaded (ETL) into a relational database suitable for further analysis by using a web scraping process. Due to the specificity of data retrieval, a web scraper in the scripting programming language PHP is programmed. The web scraper passes through the website Basketball-Reference, extracts data from a page, transforms them into suitable form, and stores them into a relational database (MySQL). Figure 3 shows the prepared single-game data for all players who participated in the game.
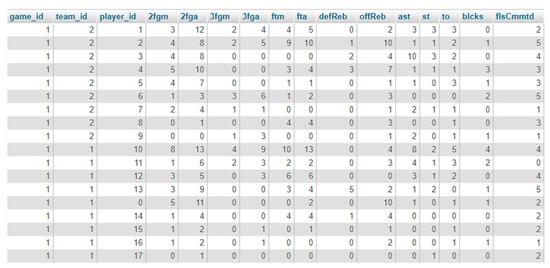
Figure 3.
Single-game data.
3.2. Data Preparation
The training dataset and testing dataset are prepared depending on the used validation method. The Train&Test validation method splits the input dataset into two chronologically ordered datasets: training dataset and testing dataset. In the variant of using disjoint datasets, the training dataset contains actual game statistics, whereas the test dataset contains the average team statistics based on the training dataset. In principle, the training dataset remains unchanged throughout the entire prediction process. The variant of using up-to-date data in later iterations of prediction also uses known test phase data. That means, the training dataset and the testing dataset are no longer disjoint after predicting the first outcome. The testing dataset, as in the previous variant, contains the average team statistics based on the training dataset. Figure 4 shows used Train&Test validation data preparation variants graphically.
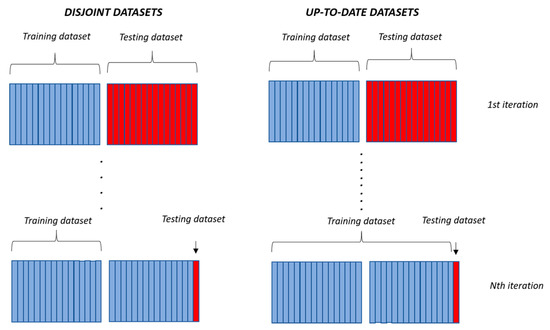
Figure 4.
Train&Test data preparation variants.
In the cross-validation method, the initial dataset is divided into five separate subsets. With this method, one of the subsets is used for testing and the other subsets are for training. Training subsets contain actual game statistics, whereas the test dataset contains the average team statistics based on the other four subsets. The above-mentioned data preparation variants are used for all used machine learning algorithms.
Feature Vector
The feature vector contains 13 basic features related to team’s performance during a particular game. As two teams participate in one game, the feature vector should be prepared according to the defined problem. The feature vector uses a total of 26 features, 13 features for each team listed in Table 1, and a classification feature that defines the game winner. Team-specific features are the average team performance over a defined time period. The input file is prepared according to the needs of the WEKA toolkit and the applied validation method. Equation (8) shows a feature vector for one team, where tm denotes the team and indices present basketball game statistics, as presented in Table 1.
Full input vector, shown in Equation (9), consists of home and guest team statistics and a classification feature that defines the game winner.
The data that the feature vector contains depends on the machine learning phase. The training phase data contains the actual played game data, whereas the test phase data contains average team performance data during the training phase.
4. Results and Discussion
This chapter gives an insight into the results of using the seven aforementioned classification machine learning algorithms in predicting the outcome of NBA games by using team-related features and binary classification. The research was conducted in WEKA toolkit and prediction results were compared. First, the results were compared by using the Train&Test method and the cross-validation method where mutually disjoint datasets were used, and then the datasets with up-to-date data.
The results reveal how accurate the model is when using described classification machine learning algorithms and different data validation methods. That enables to define a validation method for using in later proposed outcome prediction algorithm. The assumption was that cross-validation method and up-to-date data will give better prediction results.
4.1. Prediction Results by Using Disjoint Datasets and Train&Test Validation Method
The algorithms use one to three training seasons and one or two testing seasons, mutually disjoint datasets, and the Train&Test validation method. Datasets are chronologically ordered, more specifically, the training dataset precedes the testing dataset. Table 2 shows the obtained average prediction results by using disjoint datasets and the Train&Test validation method.

Table 2.
Average prediction results by using disjoint datasets and Train&Test validation method.
Analyzing the results in Table 2, the best average prediction result of 57.90% was obtained by using the K-NN algorithm, whereas the worst prediction result was obtained by using decision trees. The best individual prediction result was also obtained by the K-NN algorithm. It is notable that all the best individual results were obtained using a single testing season. Thus, the results of the paper [27], which prove that the best results for predicting basketball games are obtained by using one to three training seasons and one testing season, are confirmed. Likewise, it is also easy to notice that the worst individual results, independent of used algorithm, were obtained by using three training seasons and two testing seasons. It is significant to compare the results of each machine learning algorithm by increasing the dataset; in this case, by increasing the number of seasons. The results in [27] suggest that average prediction results should decrease as the number of training and testing seasons increases. Figure 5 shows a drop in the average prediction results by increasing the number of training and/or testing seasons.
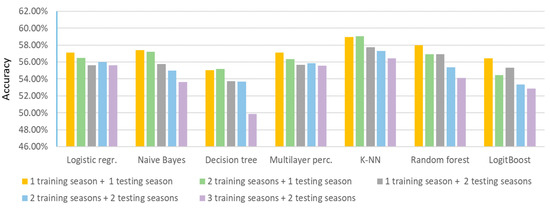
Figure 5.
Average prediction results by increasing the number of training and/or testing seasons.
4.2. Prediction Results by Using Disjoint Datasets and Cross-Validation Method
The results presented here are obtained by using the cross-validation with parameter as the validation method. The cross-validation method uses future events in predicting outcomes, but on the other hand, it does not consider the current state of the team in relation to the future. The assumption was that the cross-validation method gives slightly better results than the Train&Test validation method. The research results are presented in Table 3.

Table 3.
Average prediction results by using disjoint datasets and cross-validation method.
As with the Train&Test validation method, the lowest average prediction results are obtained by using decision trees and the K-NN algorithm gives the best prediction results. The best individual prediction result was also obtained by the K-NN algorithm. It is notable that all of the best individual results, except random forest, were obtained when using two seasons. Also, the results in paper [27] were confirmed when considering the number of seasons used. Figure 6 shows that, as with the Train & Test method, the average prediction accuracy decreases as the number of seasons used increases.

Figure 6.
Average prediction results by increasing the number of seasons.
4.3. Comparison of Prediction Results of Train&Test Validation Method and Cross-Validation Method by Using Disjoint Datasets
In this chapter, the outcome prediction results by using the Train&Test validation method and the cross-validation method will be compared. Figure 7 provides a comparison of the average algorithm accuracy by using the Train&Test method and the cross-validation method regardless of the used dataset length.
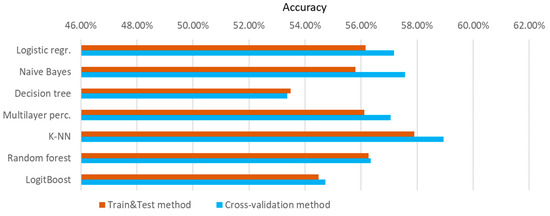
Figure 7.
Comparison of the average algorithm accuracy by validation methods regardless of the used dataset length.
The results presented in Figure 7 show that all used machine learning algorithms except the decision trees produce better average prediction results, independent on the length of the used dataset, by using the cross-validation method. In addition to the overall average prediction results, it is meaningful to compare the results using different datasets length. Figure 8 shows a comparison of validation methods based on disjoint datasets and different datasets lengths, where is clearly evident that better results are obtained by using cross-validation method and initial assumption is confirmed. The use of disjoint datasets gave better results for the cross-validation method; however, the cross-validation method uses future, currently unknown data, and as basketball games are not completely independent events, the use of cross-validation method is suitable only when it is possible to predict the accurate future events data. However, the assumption that the cross-validation method produces better results has been proven.
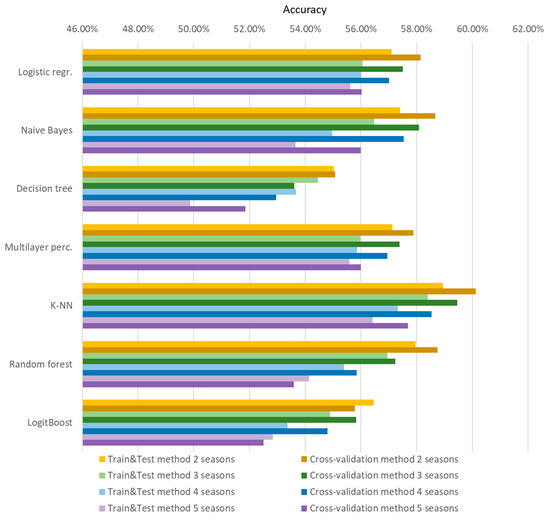
Figure 8.
Validation methods comparison based on two, three, four, and five seasons.
4.4. Prediction Results by Using Up-To-Date Data and Train&Test Validation Method
The previous chapters present the results of using the Train&Test validation method and cross-validation method by using disjoint datasets.
The results presented here were also obtained by use of one to three training seasons and one or two testing seasons; however, up-to-date data were used, instead of future, currently unknown data. These results are compared with results obtained by using mutually disjoint Train&Test validation method datasets. The term up-to-date refers to the use of known test phase data during training phase. The up-to-date data of predicted events were added to the training dataset after each outcome prediction iteration. Datasets can no longer be disjoint after predicting the first testing dataset game outcome. In principle, training is no longer strictly supervised, but also receives elements of reinforcement learning. More specifically, the training dataset is fulfilled with known examples of the testing phase, and the system is able to learn based on using a system of reward and punishment, which is generally reinforcement learning. The assumption was that the results of using up-to-date data give better results compared to results obtained by using mutually disjoint datasets. Table 4 shows the results obtained by using up-to-date data and the Train&Test validation method.

Table 4.
Average prediction results by using up-to-date data and Train&Test validation method.
Table 4 clearly shows that the decision trees algorithm produces the worst prediction results, and the best results are produced by the algorithm K-NN, as well as by the use of disjoint sets of data. The best individual prediction result was also obtained by the K-NN algorithm. Also, all the best individual results, except decision trees, were obtained using a single testing season. Thus, the results in [27], which prove that the best results of predicting basketball games are obtained by using one to three training seasons and one testing season, are confirmed.
To propose a future prediction model, it is essential to compare the results obtained by using disjoint sets and by using up-to-date data during the testing phase. Figure 9 shows the comparison of the average prediction results obtained by using disjoint and up-to-date data.
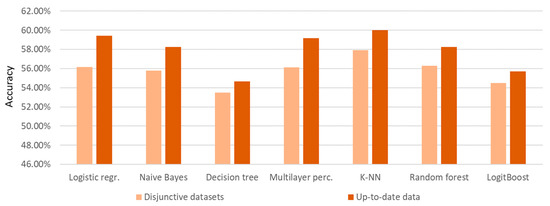
Figure 9.
Comparison of the average results obtained by using Train&Test validation method and disjoint datasets or up-to-date data.
As presented in Figure 9, up-to-date datasets produce better prediction results compared to results obtained by using disjoint datasets. The result is logical given that when using up-to-date data, known test phase data is added to the training dataset. The assumption that the results of using up-to-date data will give better results has been proven.
5. Conclusions
Predicting outcomes in sport is a challenging task. Games are not completely independent events, such as coin tossing, and are largely dependent on previous played games. In addition, analyzing team sports in particular, it is clear that the game outcome depends on a variety of factors. Therefore, it is very important to define under what circumstances the prediction algorithms produce the best results. This paper analyses the model validation methods and capabilities of seven classification machine learning algorithms to determine the best validation methods and what are the initial capabilities of analyzed algorithms in predicting basketball games outcomes. Two validation methods—Train&Test and cross-validation—and seven machine learning classification algorithms were analyzed. Cross-validation has proven to be a better validation method. Problem is that cross-validation uses future, at the moment unpredictable event data. The Train&Test validation method gave satisfactory results. Two methods of data preparation for the Train&Test validation method were analyzed. The first data preparation method involved the use of disjoint datasets for the training and testing phase, whereas the second method involved the use of up-to-date data in the training phase. Logically, better results were obtained by using up-to-date data. Analyzing used machine learning algorithm, generally the best results were obtained by using algorithm nearest neighbors, whereas the worst results were obtained by using decision trees.
In cases where it is not possible to predict accurate future event data, it is recommended to use the Train & Test validation method and up-to-date data. Machine learning algorithms yielded almost similar prediction results, but the best results were obtained by using nearest neighbors algorithm. Considering that there is no universal classifier which is consistently better at any task than others, it is necessary to compare multiple classifiers on different datasets and specific problems. When predicting basketball games, the nearest neighbors algorithm was the best. This paper showed that using different season numbers leads to a change in prediction outcome results. Therefore, in future research, an optimal time window should be examined. The task of that research must be to find the time period that at the given moment best describes the team, and accordingly provides the best outcome prediction results. Furthermore, it is planned to extend the proposed prediction model by adapting the feature vector. Thereby, the impact of feature selection and/or feature extraction will be explored.
In the future, the possibilities of unsupervised learning which includes only input data should be explored. More specifically, the effect of cross-validation on unsupervised learning will need to be explored to determine the aforementioned validation method possibilities. The effect of the Train&Test validation method using timeline ordered data is explored in this article. It is also planned to explore the effect of random order of training data, which will disrupt the chronology, but may find patterns and regularities not possibly found using time-ordered data. Using random order offers the ability to avoid time dependencies reduces the impact of the sporting factor and increases the impact of finding specific patterns or regularities among the retrieved data. Data preparation certainly represents an interesting area related to processes that involve the human factor and therefore requires finding the optimal validation method.
Author Contributions
Conceptualization, T.H. and D.S:; methodology, T.H. and L.H.; software, T.H.; validation, L.H. and D.S.; formal analysis, T.H., L.H.; investigation, T.H.; writing—original draft preparation, T.H. and D.S.; writing—review and editing, D.S. and L.H..; visualization, T.H., L.H., and D.S.; supervision, L.H.; All authors have read and agreed to the published version of the manuscript.
Funding
This research received no external funding. The APC was funded from assets supporting scientific research at University North.
Conflicts of Interest
The authors declare no conflicts of interest.
Table of Notations
Notations used in this article are detailed below:
| y(x) | linear function |
| f(z) | logistic (sigmoid) function |
| W, w0, θ | parameters of the Logistic regression model |
| P (cj | x) | posterior probability in Naïve Bayes algorithm |
| x | sample |
| cj | class according to the Bayes’ rule |
| dEuclidean (x,y) | Euclidean distance in k-NN algorithm |
| 2fgm, 2fga | Number of three pointers made/attempts by the player/team |
| 3fgm, 3fga | Number of two pointers made/attempts by the player/team |
| ftm, fta | Number of free throws made/attempts by the player/team |
| defReb, offReb | Number of defensive/offensive rebounds by the player/team |
| ast | Number of assists by the player/team |
| st | Number of stolen balls by the player/team |
| to | Number of turnovers by the player/team |
| blcks | Number of blocks made by the player/team |
| flsCmmtd | Number of fouls committed by the player/team |
References
- Loeffelholz, B.; Bednar, E.; Bauer, K.W. Predicting NBA Games Using Neural Networks. J. Quant. Anal. Sports 2009, 5, 1–17. [Google Scholar] [CrossRef]
- Zdravevski, E.; Kulakov, A. System for Prediction of the Winner in a Sports Game. ICT Innov. 2010, 55–63. [Google Scholar] [CrossRef]
- Cao, C. Sports Data Mining Technology Used in Basketball Outcome Prediction. Master’s Dissertation, Dublin Institute of Technology, Dublin, Ireland, 2012. [Google Scholar]
- Torres, R.A. Prediction of NBA games based on Machine Learning Methods. In Computer-Aided Engineering; University of Wisconsin: Madison, WI, USA, 2013. [Google Scholar]
- Ganguly, S.; Frank, N. The Problem with Win Probability. In Proceedings of the MIT Sloan Sports Analytics Conference, Boston, MA, USA, 23–24 February 2018; Available online: https://statsweb-wpengine.netdna-ssl.com/wp-content/uploads/2018/09/2011.pdf (accessed on 30 January 2019).
- Miljković, D.; Gajić, L.; Kovačević, A.; Konjović, Z. The use of data mining for basketball matches outcomes prediction. In Proceedings of the IEEE 8th International Symposium on Intelligent and Informatics, Subotica, Serbia, 10–11 September 2010; pp. 309–312. [Google Scholar] [CrossRef]
- Avalon, G.; Balci, B.; Guzman, J. Various Machine Learning Approaches to Predicting NBA Score Margins. In Final Project; Stanford University: Standord, CA, USA, 2016. [Google Scholar]
- Kravanja, A. Napovedanje Zmagovalcev Košarkaških Tekem. Bachelor’s Thesis, University of Ljubljana, Ljubljana, Slovênia, 2013. [Google Scholar]
- Lin, J.; Short, L.; Sundaresan, V. Predicting National Basketball Association Winners. In Final Project; Stanford University: Standord, CA, USA, 2014. [Google Scholar]
- Pai, P.-F.; ChangLiao, L.-H.; Lin, K.-P. Analyzing basketball games by a support vector machines with decision tree model. Neural Comput. Appl. 2017, 28, 4159–4167. [Google Scholar] [CrossRef]
- Horvat, T.; Job, J.; Medved, V. Prediction of Euroleague games based on supervised classification algorithm k-nearest neighbours. In Proceedings of the 6th International Congress on Sport Sciences Research and Technology Support K-BioS, Sevilla, Spain, 20–21 September 2018; pp. 203–207. [Google Scholar]
- Ivanković, Z.; Racković, M.; Markoviski, B. Analysis of basketball games using neural networks. In Proceedings of the 11th International Symposium on Computational Intelligence and Informatics (CINTI), Budapest, Hungary, 18–20 November 2010. [Google Scholar] [CrossRef]
- Cheng, G.; Zhang, Z.; Kyebambe, M.N.; Kimbugwe, N. Predicting the Outcome of NBA Playoffs Based on the Maximum Entropy Principle. Entropy 2016, 18, 450. [Google Scholar] [CrossRef]
- Tran, T. Predicting NBA Games with Matrix Factorization. Master’s Dissertation, Department of Electrical Engineering and Computer Science, Massachuttets Institute of Technology, Cambridge, MA, USA, 2016. [Google Scholar]
- Lam, M.W.Y. One-Match-Ahead Forecasting in Two-Team Sports with Stacked Bayesian Regressions. J. Artif. Intell. Soft Comput. Res. 2018, 8, 159–171. [Google Scholar] [CrossRef]
- Trawinski, K. A fuzzy classification system for prediction of the results of the basketball games. In Proceedings of the International Conference on Fuzzy Systems, Barcelona, Spain, 18–23 July 2010. [Google Scholar] [CrossRef]
- Zimmermann, A.; Moorthy, S.; Shi, Z. Predicting College Basketball Match Outcomes Using Machine Learning Techniques: Some Results and Lessons Learned. 2013. Available online: https://arxiv.org/pdf/1310.3607.pdf (accessed on 30 January 2019).
- Amin, A.; Shah, B.; Khattak, A.M.; Baker, T.; Rahman Durani, H.; Anwar, S. Just-in-time Customer Churn Prediction: With and Without Data Transformation. In Proceedings of the 2018 IEEE Congress on Evolutionary Computation (CEC), Rio de Janeiro, Brazil, 8–13 July 2018; pp. 1–6. [Google Scholar] [CrossRef]
- Khalaf, M.; Hussain, A.J.; Al-Jumeily, D.; Baker, T.; Keight, R.; Lisboa, P.; Fergus, P.; Al Kafri, A.S. A Data Science Methodology Based on Machine Learning Algorithms for Flood Severity Prediction. In Proceedings of the 2018 IEEE Congress on Evolutionary Computation (CEC), Rio de Janeiro, Brazil, 8–13 July 2018; pp. 1–8. [Google Scholar] [CrossRef]
- Jain, S.; Kaur, H. Machine learning approaches to predict basketball game outcome. In Proceedings of the 2017 3rd International Conference on Advances in Computing, Communication & Automation (ICACCA) (Fall), Dehradun, India, 15–16 September 2017; pp. 1–7. [Google Scholar] [CrossRef]
- Prasetio, D.; Harlili, D. Predicting football match results with logistic regression. In Proceedings of the International Conference on Advanced Informatics: Concepts, Theory and Application (ICAICTA), Penang, Malaysia, 16–19 August 2016. [Google Scholar] [CrossRef]
- Soto Valero, C. Predicting Win-Loss outcomes in MLB regular season games–A comparative study using data mining methods. Int. J. Comput. Sci. Sport 2016, 15, 91–112. [Google Scholar] [CrossRef]
- Available online: https://www.cs.waikato.ac.nz/ml/weka/ (accessed on 30 January 2019).
- Available online: https://en.wikipedia.org/wiki/Weka_(machine_learning) (accessed on 30 January 2019).
- De Mantaras, R.L.; Armengol, E. Machine learning from example: Inductive and Lazy methods. Data Knowl. Eng. 1998, 25, 99–123. [Google Scholar] [CrossRef]
- Rosenblatt, F. The Perceptron: A Theory of Statistical Separability in Cognitive Systems; Report No. VG1196-G-1; Cornell Aeronautical Laboratory: Buffalo, NY, USA, 1958. [Google Scholar]
- Horvat, T.; Job, J. Importance of the training dataset length in basketball game outcome prediction by using naïve classification machine learning methods. Elektrotehniški Vestnik 2019, 86, 197–202. [Google Scholar]
© 2020 by the authors. Licensee MDPI, Basel, Switzerland. This article is an open access article distributed under the terms and conditions of the Creative Commons Attribution (CC BY) license (http://creativecommons.org/licenses/by/4.0/).