Article

Multi-Scale Insights on the Threshold Pressure Gradient in Low-Permeability Porous Media

1
State Key Laboratory for Geomechanics and Deep Underground Engineering, China University of Mining and Technology, Xuzhou 221116, China
2
School of Engineering, University of Tasmania, Hobart, Tasmania 7001, Australia
3
School of Mechanics and Civil Engineering, China University of Mining and Technology, Xuzhou 221116, China
*
Authors to whom correspondence should be addressed.
Symmetry 2020, 12(3), 364; https://doi.org/10.3390/sym12030364
Submission received: 5 February 2020 / Revised: 22 February 2020 / Accepted: 28 February 2020 / Published: 2 March 2020
(This article belongs to the Special Issue Symmetry in Newtonian and Non-Newtonian Fluids)

Abstract

:
Low-permeability porous medium usually has asymmetric distributions of pore sizes and pore-throat tortuosity, thus has a non-linear flow behavior with an initial pressure gradient observed in experiments. A threshold pressure gradient (TPG) has been proposed as a crucial parameter to describe this non-linear flow behavior. However, the determination of this TPG is still unclear. This study provides multi-scale insights on the TPG in low-permeability porous media. First, a semi-empirical formula of TPG was proposed based on a macroscopic relationship with permeability, water saturation, and pore pressure, and verified by three sets of experimental data. Second, a fractal model of capillary tubes was developed to link this TPG formula with structural parameters of porous media (pore-size distribution fractal dimension and tortuosity fractal dimension), residual water saturation, and capillary pressure. The effect of pore structure complexity on the TPG is explicitly derived. It is found that the effects of water saturation and pore pressure on the TPG follow an exponential function and the TPG is a linear function of yield stress. These effects are also spatially asymmetric. Complex pore structures significantly affect the TPG only in the range of low porosity, but water saturation and yield stress have effects on a wider range of porosity. These results are meaningful to the understanding of non-linear flow mechanism in low-permeability reservoirs.

1. Introduction

Shale gas reservoirs have received increasing attention due to the depletion of conventional oil and gas resources [1]. According to the roadmap on natural gas development in China, the total production of natural gas will reach 4.5 - 5 × 10¹² m3 in 2020 and the proportion of unconventional gas will then exceed 30% of the total gas production [2]. Due to the low permeability, high water saturation, and complex pore structure of shale gas reservoirs, the gas flow in a low-pressure gradient zone is always slow and non-Darcy [3,4,5,6]. This low-velocity non-Darcy flow has been emphasized in low-permeability reservoirs for the following two issues [3,7,8], which are still unsolved:
(A) Does a threshold pressure gradient (TPG) exist in low-permeability reservoirs?
(B) How is the non-Darcy flow manifested in low-permeability reservoirs?
For the first issue, many experimental results [7,9,10] have shown that there is indeed a resisting force to prevent the fluid from the flow initiation until the pressure difference across the core reaches a critical value. For the second issue, some typical low-velocity non-Darcy flow models have been proposed and evaluated [3,5,7,11]. For example, Cai [3] developed a fractal approach for the low-velocity non-Darcy flow in a low-permeability porous medium. He incorporated the fractal characteristics of complex pore structure into the analysis of the TPG. However, his model did not consider the effect of residual water saturation. Li et al. [5] numerically investigated the effect of the TPG on transient pressure and still missed the mechanism for the determination of the TPG. Zhu et al. [7] conducted an experiment to measure the TPG in water-bearing tight gas reservoirs and their results observed that the TPG increased with water saturation, but their experiment did not consider the effect of pore structure on the TPG. Zhang et al. [11] stated that gas flow was subjected to more non-linear multiphase flow due to water saturation. Their model used a non-Darcy coefficient under constant water saturation that did not vary with the complex pore structure. Among these models, the threshold pressure gradient (TPG) has been formulated in a simple manner and is feasible for characterizing the non-Darcy flow in low-permeability reservoirs. However, the combined effects of pore pressure, water saturation, and complex pore structure on the TPG in low-permeability porous media have not been fully investigated.
Figure 1 shows a typical schematic diagram for the low-velocity non-Darcy flow with TPG, which has been modified after the literature [8,12,13,14]. This curve can be divided into three zones according to its flow mechanism. In zone 1, the viscous force between the fluid and the solid is dominant. The pressure difference applied across the core is not sufficient to drive fluid flow. As the pressure difference continues to increase until the critical point C (defined as zone 2), a highly nonlinear relationship is observed between the fluid flow rate and the pressure difference. In addition, gas slip occurs in zone 2, thus resulting in a decrease of gas effective permeability. This may also be an important contributor to the nonlinear flow. After zone 2, a pseudo-linear flow follows in zone 3. If the straight line on the linear flow is extended to the abscissa, the pseudo threshold pressure gradient is obtained. This value is widely used in the non-Darcy flow model and is called the TPG [15].
Miller and Low [15] discovered the existence of the TPG in the water flow through the soils with rich clay content. Based on the flow experiments in sandstones, Prada and Civan [16] developed the following empirical expression for TPG:
T P G = 16 ( k μ ) 0.8
where k is the permeability of porous medium and μ is the fluid viscosity. This expression indicates that the TPG is related to the ratio of permeability of porous media to fluid viscosity or mobility. Wang et al. [17] proposed another empirical formula for heavy oil flow based on the Kozeny–Carman equation:
T P G = 2 τ 0 ( ϕ 8 k ) 0.5
where τ 0 represents the yield stress and ϕ is the porosity of rock.
There is an approximately linear relationship between the TPG and yield stress, if the ratio of permeability to porosity of porous medium is constant. More TPG correlations are summarized in Table 1. Moreover, Liu et al. [18] derived an analytical solution for one-dimensional flow with the TPG in a semi-infinite porous medium. The results showed that the effect of the TPG on the distribution of the pore pressure was more significant when the boundary condition was a constant pressure instead of a constant flow rate. Zhu et al. [7] experimentally investigated the existence of TPG using cores with different water saturations from the Sichuan gas field in China. Song et al. [4] developed a low-velocity non-Darcy model with the TPG. The results showed that the theoretical model considering the TPG was more accurate in predicting gas production and had better agreement with the experimental data. Ding et al. [9] suggested that permeability, water saturation, and pore pressure were the controlling parameters for the TPG in tight gas reservoirs. Their results showed that the increase in pore pressure caused a significant decrease in the TPG. Tian et al. [6] experimentally revealed that the TPG increased exponentially with a higher water saturation or lower permeability. The above-mentioned laboratory investigations verified the existence of the TPG and some theoretical models with controlling parameters have been proposed. However, the effects of complex pore structure in low-permeability porous media on the TPG were not investigated, although the TPG was very sensitive to these tiny pore-throats. Therefore, the TPG should be carefully studied through the analysis of complex pore structures.
On the other hand, fractal theory is an effective tool to characterize the complex pore geometry and structure [22,23]. Yu and Cheng [24] developed a fractal model to evaluate the permeability for both porous particles and porous fabrics media. However, this model was only applicable to Newtonian fluids and cannot take the effect of the TPG into account. Wang and Yu [25] established a fractal model for Bingham fluids in porous media embedded with a fractal-like tree network. The effect of diameter ratio at different branching lengths on the TPG was investigated, however, this fractal model could not describe the flow non-linearity induced by the existence of water saturation. Cai [3] pointed out that the scaling behavior between the TPG and the permeability of porous medium could be further expressed by the tortuosity fractal dimension DT, T P G ~ k D T / ( 1 + D T ) . Ye et al. [26] proposed a fractal model for the TPG in tight oil reservoirs. In this model, the residual water saturation was treated as connate water by forming a boundary layer fluid, which could hinder the gas flow. Their results indicated that a higher residual water saturation would greatly increase the TPG, especially when the permeability was less than 0.01 mD. Although the above literature presented different TPG models, the coupling of multi-scale geometry and physical mechanisms in the TPG is still unclear. Therefore, it is necessary to investigate the flow mechanism of the TPG with complex pore structure and to explore its application in numerical simulations.
This study aimed to develop a reliable semi-empirical formula for the TPG in a numerical model of non-Darcy flow that can also be used to provide a better understanding of flow mechanism in porous media with complex pore structures. The rest of this paper is organized as follows. First, a semi-empirical formula is proposed considering permeability, water saturation, and pore pressure. Then, this semi-empirical formula is verified using three sets of experimental data. Third, a fractal model of capillary tubes is developed to link the TPG formula with the micro-structural parameters of porous media, residual water saturation, and capillary pressure. Finally, conclusions are drawn in Section 4.

2. A Novel Semi-Empirical Formula for the Threshold Pressure Gradient (TPG)

2.1. Effects of Macroscopic Parameters on TPG

In this section, the effects of key macroscopic parameters on the TPG are analyzed. The direct relationship of the TPG between the permeability, water saturation, and pore pressure is explored and a semi-empirical formula for this relationship is finally obtained. This formula can be easily used to facilitate numerical simulations on non-Darcy flow in low-permeability reservoirs.

2.1.1. Effect of Boundary Layer

The gas flow no longer conforms to the traditional Darcy flow in a low-permeability porous media because of the complexity of the pore structure and fluid properties. It exhibits a distinct non-linear characteristic, which is related to a pseudo threshold pressure gradient. Experimental results [27] indicate that there is a strong molecular force at the solid–gas interface in low-permeability porous media. Abundant tiny pores (from 0.005 μ m to 1 μ m in [27], from 0.001 μ m to 1 μ m in [28], and from 0.001 μ m to 10 μ m in [29]) provide large specific surface area and this increases the surface molecular force between solid–liquid and solid–gas. This phase-to-phase surface physicochemical force generates an additional resistance to the fluid flow. The fluid near the interface stops flowing, but forms a boundary layer. This fluid boundary layer effect is one of the important mechanisms for the TPG.
In low-permeability porous media, the radius of the pores is of the same order of magnitude as the thickness of the fluid boundary layer [30]. Thus, this surface force is strong and should be noted. Many capillary experiments have observed that the driving pressure gradient is inversely proportional to the thickness of this fluid boundary layer. When the driving pressure gradient is higher, the viscous layer on the surface of fracture becomes thinner. This variation usually shows an exponential decay trend. The thickness of boundary layer is expressed by [30]
ω = d c ω 0 · e η | p |
where d c is the radius of capillary tube. ω 0 denotes the ratio of the boundary layer thickness to the capillary radius at the initial state (or the state at zero driving pressure gradient), 0 < ω 0 < 1 . η is the correction parameter of the fluid boundary layer and p is the driving pressure gradient.
Figure 2 shows the variation of boundary layer thickness with pressure gradient. This thickness of the fluid boundary layer decreases drastically when the pressure gradient is less than 2 MPa/m. If the pressure gradient exceeds 2 MPa/m, the effect of boundary layer disappears gradually.
The core permeability in the formula can be further linked to microscopic parameters through the following Gauteng–Kalman formula [31]:
k = ϕ r 2 8 τ 2
where r is the average radius of pores; and τ is the tortuosity of the flow path.
Substituting Equation (4) into Equation (1) obtains
T P G = β ( ϕ μ ) χ ( r τ ) 2 χ
where β and χ are fitting coefficients.
It is obvious that the average radius of rock pores and tortuosity have a greater effect than the porosity and fluid viscosity on the TPG. This means that the complexity of the rock micro-structure is crucial to the TPG. Overall, the TPG is inversely proportional to the porosity of the rock and the average radius of pores. It is proportional to the fluid viscosity and tortuosity. It is noted that the pore structure (radius and tortuosity) will be further described microscopically through fractal dimensions and will be discussed in the following fractal model.

2.1.2. Effect of Capillary Pressure

Gas and water phases often coexist in tight sandstone or shale gas reservoirs. In this displacement process, these two phases interact with each other and cause a variation in the gas–water relative permeability. The reduction of gas permeability leads directly to an increase in the TPG. For a core containing residual water, its TPG tends to be 1–5 times larger than that in a dry core [7]. This difference may be induced by the following two main reasons: (1) the residual water forms a water film that adheres to the surface of fracture, which reduces the gas flow channel; and (2) bubbles change their shapes when they pass through tiny pores. This consumes some energy and is called the Jamin effect [32].
The Leverett J-function is widely used to express the capillary pressure as [33]
p c = σ cos ( θ ) k ϕ J ( S w )
where p c is the capillary pressure between gas and water. θ is the contact angle of gas and water, which is determined by wettability. σ is the interfacial tension between water, gas, and rock. S w is the water saturation. The Leverett J-function J ( S w ) is a dimensionless function of water saturation to describe the capillary pressure.
Thomas et al. [34] proposed the following relationship between the TPG and interfacial tension:
T P G = σ ζ F 1 ϕ k
where ζ is the shape factor coefficient and F is the formation pressure coefficient.
Substituting Equation (6) into Equation (7) obtains the final form of the TPG as
T P G = p c ϕ ζ F 1 J ( S w )
This formula shows that capillary pressure is one of the main contributors to the TPG. A higher capillary pressure often leads to a higher TPG. Meanwhile, the increase in water saturation leads to a decrease in the J function, which also increases the TPG.

2.1.3. Effect of Stress Sensitivity

The TPG is also related to pore parameters such as the average radius of the pores, tortuosity, and capillary pressure. For tight sandstone or shale gas reservoirs, these parameters are of stress sensitivity. The stress sensitivity may significantly affect the TPG. An ideal capillary pressure model should contain the information of both pores and throats as [35]
ϕ = π ( r p 2 L + r t 2 L ) 8 r p 2
Substituting Equation (4) into the above equation obtains the permeability as
k = π r t 2 ( r p 2 + r t 2 ) 64 r p 2 τ 2
where r p and r t represent the radius of the pores and throats, respectively; and L is the length of capillary tubes. In this ideal capillary model, the throats are compressed first, rather than the pores. The tortuosity of this capillary model is assumed to be unity. Therefore, the permeability change coefficient is defined as
C p = 1 k d k d p = ( 2 r t + 2 r t r p 2 + r t 2 ) d r t d p
The above derivation briefly describes the stress sensitivity on permeability and mainly reflects the decrease of the throat radius under compression due to the Jamin effect. An exponential function is used for the relationship between permeability and effective stress [36]:
k = k 0 e α σ e f f
where k 0 is the initial permeability of the rock; α is the rock compressibility; σ e f f is the effective stress; σ e f f = p b p f ; p b is the overburden pressure; and p f is the pore pressure.
Equation (12) establishes a relationship between permeability and pore pressure. That is, the TPG is affected by the permeability of porous media, the capillary pressure between the gas and water phase, and the pore pressure. The following threshold pressure gradient model is proposed for low-permeability gas reservoirs as
T P G = a k b e c · S w e m · p f + n · p f 2
where a and b are the fitting coefficients of permeability; c is the fitting coefficient of water saturation; and m and n are the fitting coefficients of pore pressure. Table 2 lists all of these fitting coefficients.

2.2. Verification of the Proposed TPG Model Using Experimental Data

The TPG formula in Equation (13) was verified using three sets of experimental data from three aspects: permeability, water saturation, and pore pressure.

2.2.1. Case 1: Correlation of the TPG with Permeability and Water Saturation

Huang et al. [10] measured the TPG in typical cores from low-permeability gas reservoirs. The TPG was measured using the bubble method, the test gas was nitrogen, and the cores were saturated with distilled and de-aired water. A total of 80 cores were measured and their properties are presented in Table 3. For the investigation of the relationship between TPG and core permeability, cores were selected with the same water saturation. Similarly, when the relationship between TPG and saturation was studied, cores with the same permeability were selected. Therefore, Equation (13) was used to fit these experimental data and the fitting coefficients are listed in Table 3. Figure 3a is the fitted relationship between the TPG and core permeability. When water saturation and pore pressure remain unchanged, this relationship follows a power law. The TPG changes drastically with permeability when the permeability is less than 0.1 mD. This implies that the TPG is an important parameter for reservoirs with low permeability. Figure 3b shows the variation of the TPG with water saturation. The residual water adheres to the surface of the flow channels and forms a water film. This water film does not only hinder the gas flow, but also enhances the Jamin effect at the throat of the pores. These fitted results show that the variation of TPG with water saturation basically obeys an exponential function.

2.2.2. Case 2: Correlation of the TPG with Water Saturation at Different Permeabilities

This was another test used to investigate the effect of water saturation on the TPG. Unlike Case 1, Zhu et al. [7] tested different kinds of reservoir cores from Sichuan gas fields in China with a maximum permeability of about 10 mD. Water saturation ranged from 0.2 to 0.7, which was greater than that in Case 1. This core was a cylinder with a diameter of 2.5 cm and a length of 5 cm. The specific parameters are listed in Table 3. Table 2 lists the fitting coefficients of Equation (13). A vacuum pump was used to extract the air and other impurities before the experiments. This core was then saturated with water and setup in the core holder. The confining pressure was 5 MPa. Figure 4a shows the variation of the TPG with water saturation when the permeabilities were 0.687, 1.51, and 9.02 mD, respectively. An approximate exponential function was observed for the relationship between the TPG and water saturation. When the permeability was low, the effect of water saturation on the TPG was obvious. Compared to other two types of cores, the TPG with a permeability of 9.02 mD was much lower. In order to better understand this variation of the TPG with high permeability, Figure 4b shows the variation of the TPG with permeability. In the case of a permeability of 9.02 mD and a water saturation of 0.35, the experimental TPG was lower than that calculated by Equation (13). This means that the effect of water saturation on the TPG is less significant and can be ignored if the permeability is greater than a certain value.

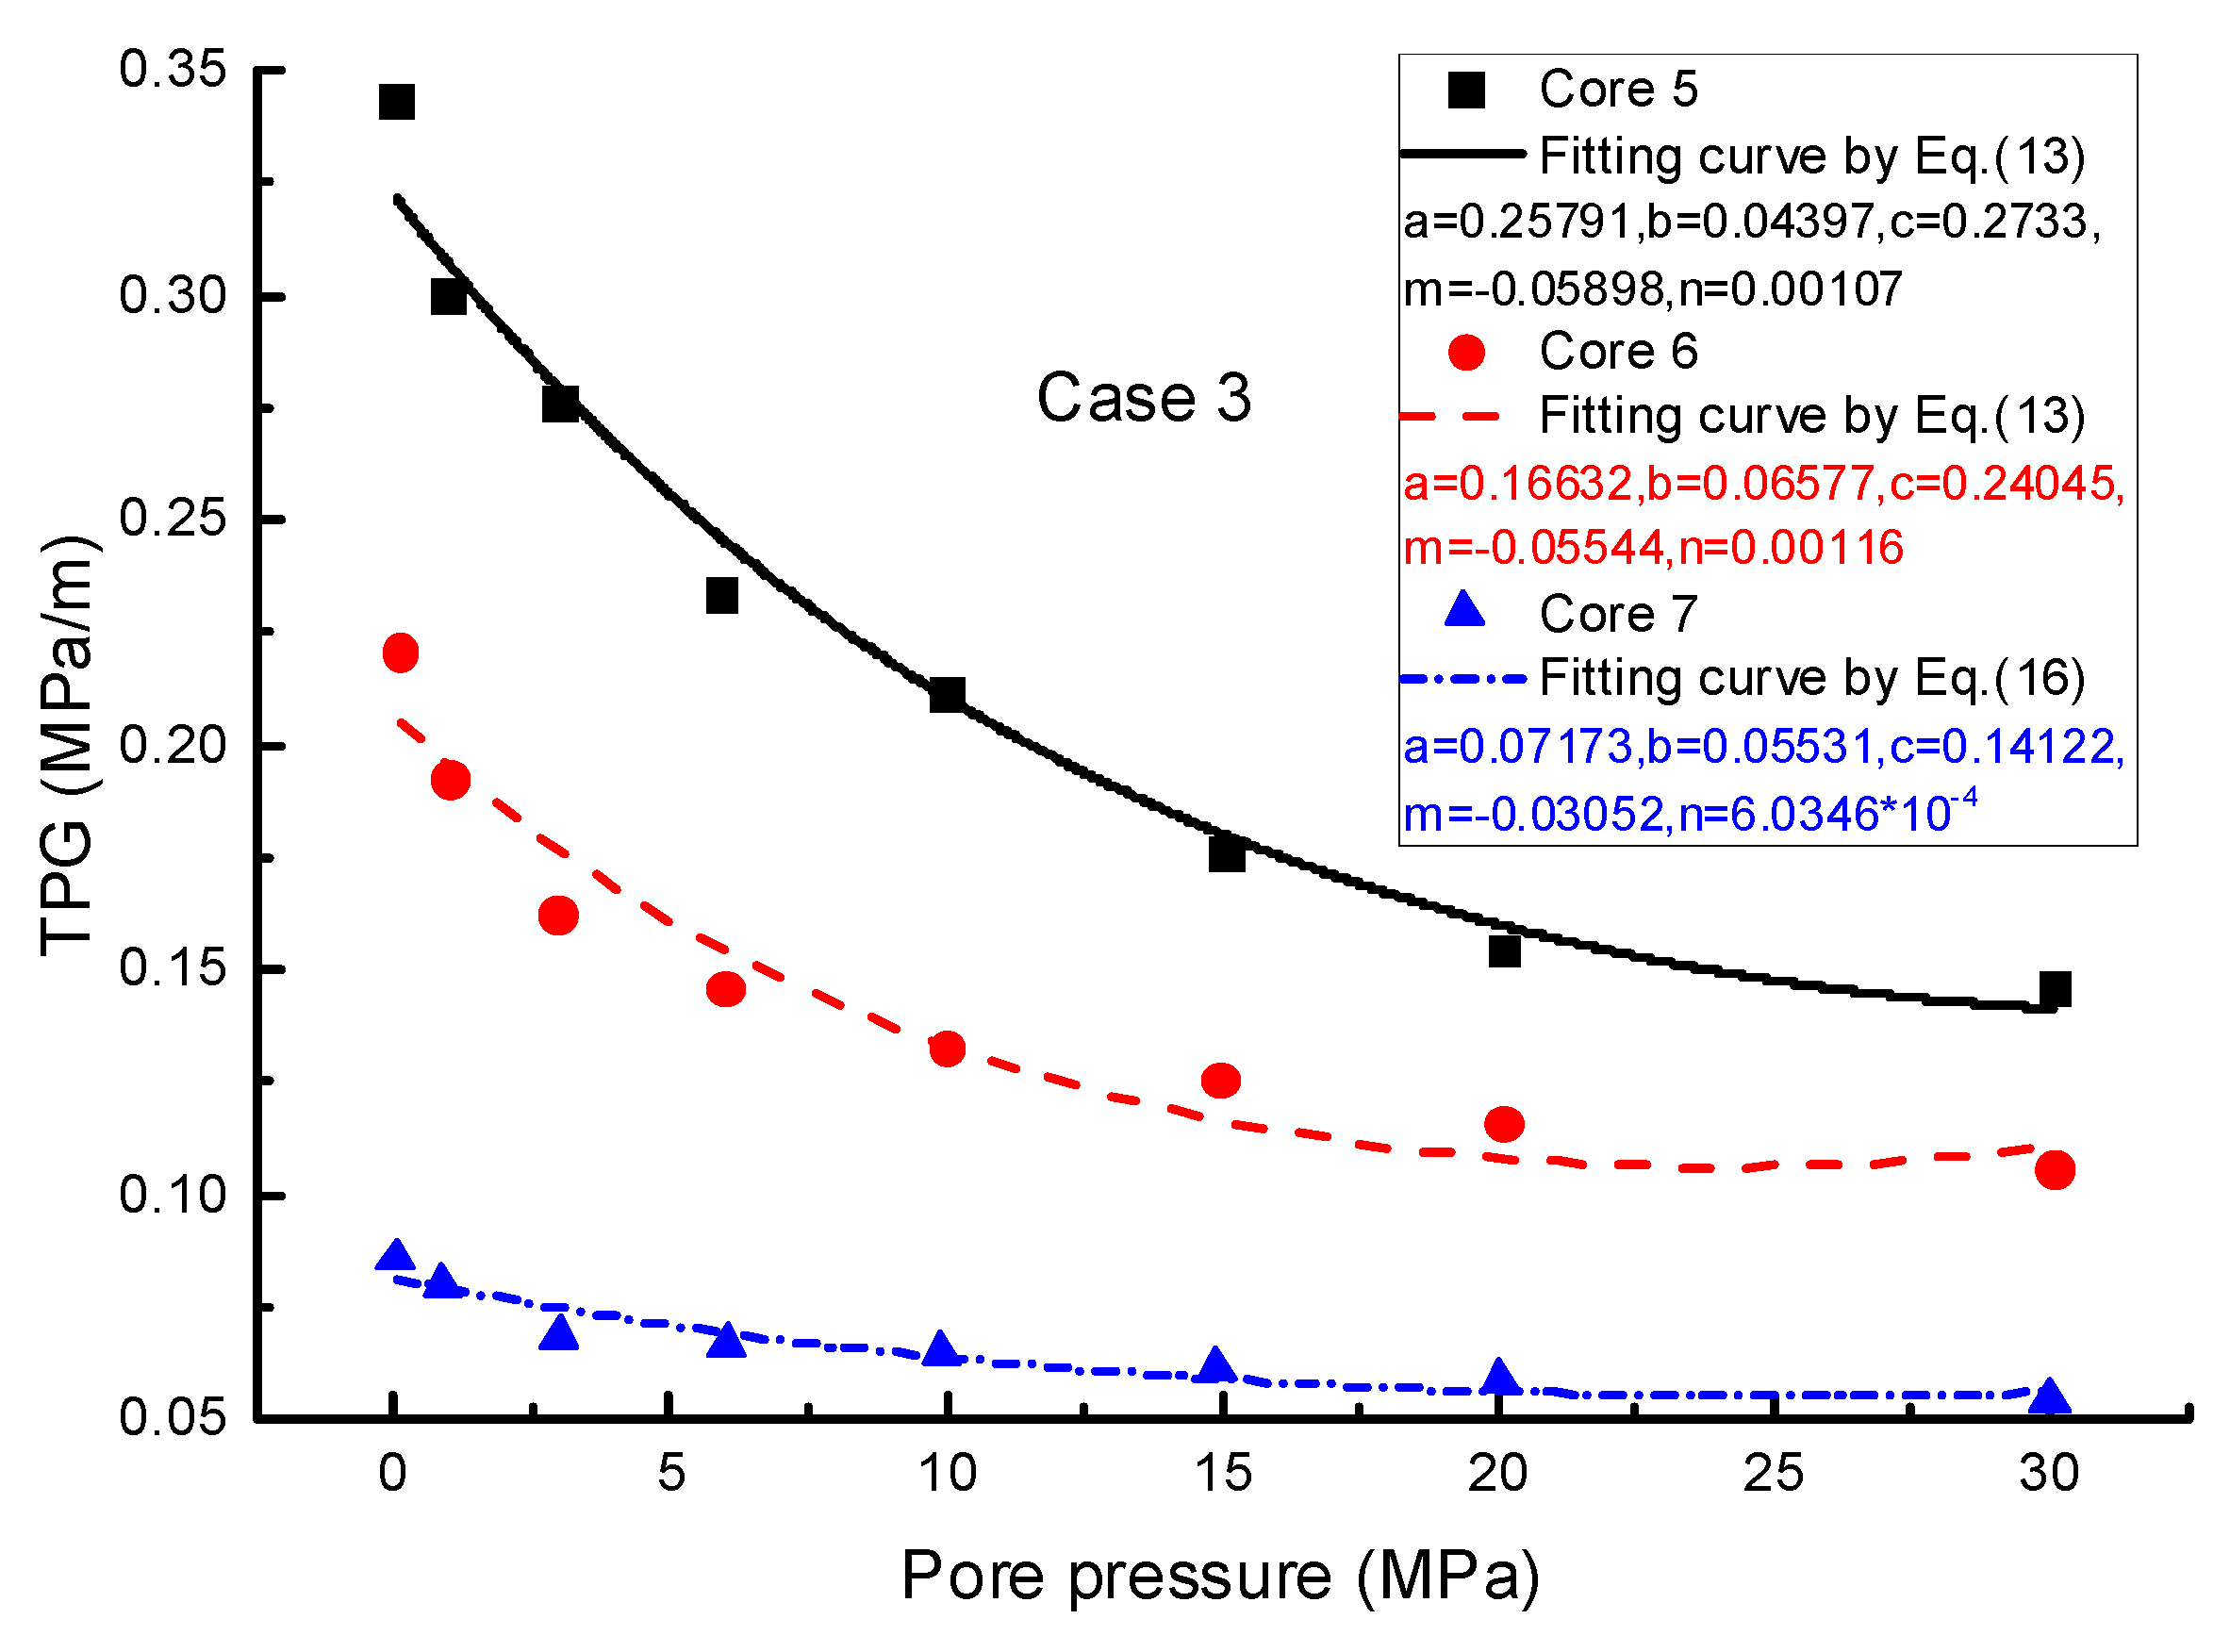
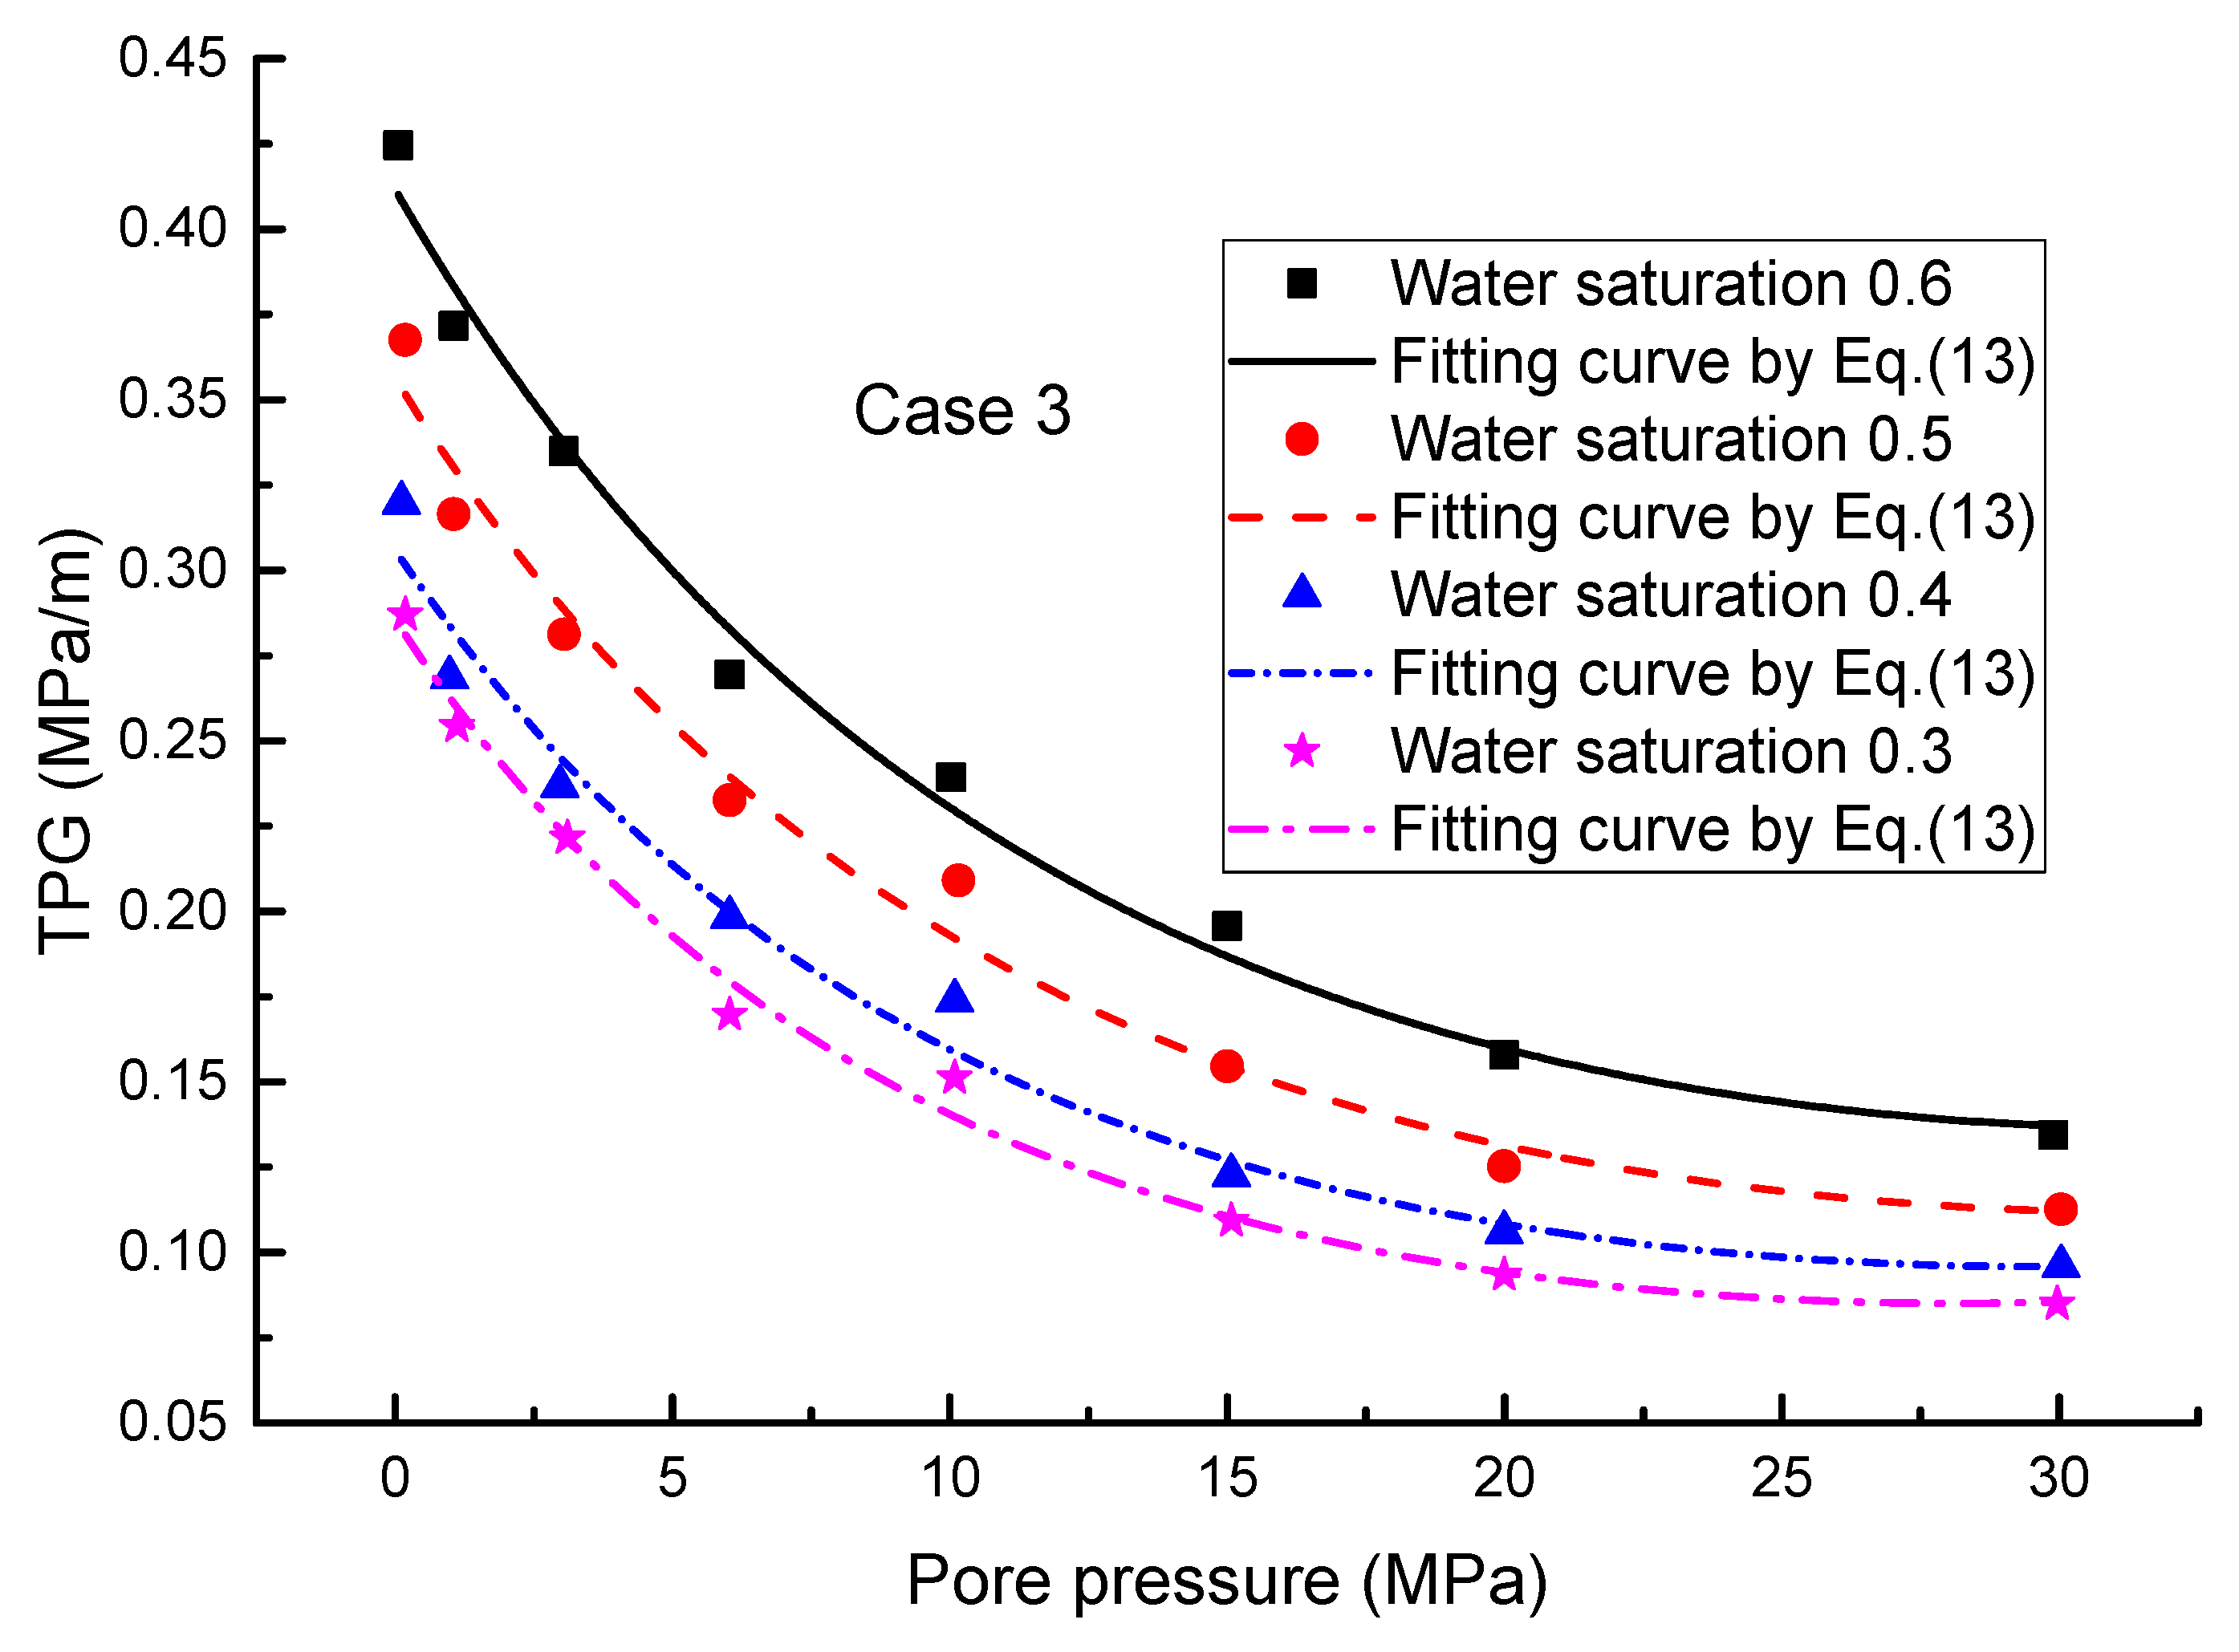
2.2.3. Case 3: Correlation of the TPG with Pore Pressure

Ding et al. [9] conducted a test to investigate the “dynamic TPG effect” during the development process in a tight gas reservoir. This dynamic TPG effect means that the TPG in the tight gas reservoir increases along with the decrease in pore pressure. A back-pressure system was added to the experiment to maintain the pore pressure of the cores. The cores were from the Daniudi gas field, which is a tight gas reservoir located in western China. The parameters of the cores are given in Table 3. This test obtains the variations in the TPG with pore pressure for cores with different permeabilities. The water saturation of the cores was the same. Equation (13) is still used to fit this relationship of the TPG and pore pressure and their fitting coefficients are also listed in Table 2. The fitting results are presented in Figure 5 and it was found that this equation could well fit these experimental data. As the pore pressure increases, flow channels are expanded, and the TPG rapidly decreases. When the permeability of the core is lower, the effect of pore pressure on the TPG is stronger. This also shows that a core with low permeability has a small radius of pore throat and produces a significant TPG, thus the deformation of pores caused by pore pressure should be carefully considered. Figure 6 presents the variation in the TPG with pore pressure at different water saturations. In summary, an approximate power function relationship exists between rock permeability and the TPG. An exponential relationship is more consistent with water saturation and pore pressure.

3. A Fractal Model for the Threshold Pressure Gradient

The above semi-empirical formula of Equation (13) has been demonstrated to be useful and convenient for numerical simulations on geofluid migration in low-permeability porous media. However, it could be difficult to link the parameters in this formula with the flow mechanisms of geofluid within complex pore structures. Thus, a novel fractal model was specifically developed to explore the microscopic pore structure based on this TPG formula.

3.1. Derivation of Threshold Pressure Gradient Based on Fractal Theory

Equations (5) and (8) indicate that the TPG is directly linked to the capillary radius, tortuosity, and Leverett J-function. These parameters (in previous studies) are all derived from the conceptual model of capillary flow without consideration of a microscopic flow mechanism. For example, the distribution of pore sizes, residual water, and the variation of tortuosity in porous media are not considered in the model. In this section, the conceptual model of capillary flow is modified through the introduction of fractal theory. Such a modification can provide microscopic insights into the evolution of the TPG in low-permeability reservoirs.
The flow rate through a tortuous capillary can be expressed by the Buclingham–Reibe equation [37]:
q = π r 4 128 μ L t ( Δ p 16 L t τ 0 3 r )
where r is the diameter of the pore; μ is the fluid viscosity; Δ p is the pressure difference across the capillary tube; and τ 0 is the yield stress. When the fluid flow overcomes the yield stress, the shear stress and the shear rate follow a linear relationship. If the yield stress is zero, Equation (14) is simplified into the classical Hagen–Poiseuille equation for Newtonian fluid flow. L t is a parameter with fractal characteristics to represent the length of tortuous capillary. The fractal parameters used in the following derivation are given in the Appendix A.
The proposed new model considers two more parameters: water film thickness r w f and capillary pressure. The water film adsorbed on the surface of the capillary tubes is the result of residual water in the formation. This study assumes that the thickness of the water film does not change with fluid flow. Due to its higher viscosity, this water film forms a fluid boundary layer on the capillary tubes. This boundary layer reduces the fluid flow space and applies a flow resistance to free fluid. The thickness of the water film is calculated by residual water saturation [26]:
r w f = ( 1 1 S w i ) r
Capillary pressure is the driving force to push the non-wetting phase to occupy a larger pore space. When fluid flows through a tiny pore throat, this effect is significant. The capillary pressure difference is [38]
Δ p c = γ σ cos θ 2 r 1 ϕ ϕ
This formula shows that the capillary pressure difference is controlled by surface tension σ , the contact angle between fluid and solid θ , and porosity ϕ . γ is the shape factor, which was taken in this study as a constant. Therefore, Equation (14) can be modified into
q = π r 4 ( 1 S w i ) 2 128 μ L ( Δ p + γ σ cos θ 2 r 16 L τ 0 3 r )
Combining the distribution of pore sizes obtains the total flow rate as
Q = r min r max q ( r ) d N ( r ) = π 128 ( 1 S w i ) 2 D f r max D f μ L 0 D T 1 1 3 + D T D f Δ p L 0 r max 3 + D T D f ( 1 ( r min r max ) 3 + D T D f ) + π 128 ( 1 S w i ) 2 D f r max D f μ L 0 D T 1 2 + D T D f γ σ cos θ 2 1 ϕ ϕ r max 2 + D T D f ( 1 ( r min r max ) 2 + D T D f ) π 128 ( 1 S w i ) 2 D f r max D f μ L 0 D T 1 3 D f 16 3 L 0 D T 1 τ 0 r max 3 D f ( 1 ( r min r max ) 3 D f )
Since r max / r min = 0.01 < < 1 , the above equation can be simplified as
Q = = π 128 ( 1 S w i ) 2 D f r max D f μ L 0 D T 1 r 3 + D T D f 3 + D T D f ( Δ p L 0 + 1 L 0 3 + D T D f 2 + D T D f γ σ cos θ 2 1 ϕ ϕ r 1 3 + D T D f 3 D f 16 3 L 0 D T 1 τ 0 r D T )
According to Darcy’s law, the total flow rate can also be expressed as
Q = k A μ ( Δ p L 0 T P G )
Substituting Equation (20) into Equation (19) obtains the permeability and threshold pressure gradient as
k = π 128 ( 1 S w i ) 2 D f r max D f μ L 0 D T 1 A r max 3 + D T D f 3 + D T D f
T P G = 3 + D T D f 3 D f 16 3 L 0 D T 1 τ 0 r max D T 1 L 0 3 + D T D f 2 + D T D f γ σ cos θ 2 1 ϕ ϕ r max 1

3.2. Model Validation and Analysis

Ye et al. [26] divided the core samples into three groups according to their permeabilities, which ranged from 0.001 mD to 0.5 mD, and measured the average threshold pressure gradient. These experimental data were used to verify this fractal model. The TPG can also be calculated by Equation (2) and their comparisons are shown in Figure 7. It was found that the proposed fractal model had good agreement with these experimental data. The geometric complexity in porous media can be described by fractal theory, especially in tight cores with a permeability of less than 0.1 mD. Compared to the classic models such as Equation (2), the proposed fractal model can better describe the effect of pore complexity on the variation of the TPG. The effects of pore structure parameters on the TPG will be discussed in the following sub-sections.
The yield stress of the non-Newtonian fluid is a critical stress to the initiation of fluid flow. This yield stress is directly related to the TPG. As the porosity decreases, the increase in yield stress has a significant enhancement effect on the growth of the TPG (see Figure 8). The results indicate that the TPG is a linear function of yield stress. Figure 9 further shows the evolution of TPG with yield stress. These results also show that the proposed fractal model and the macro-scale TPG model of Equation (2) had good agreement over a linear growth.

3.3. Effect of Fractal Dimensions

Pore-size distribution fractal dimension and tortuosity fractal dimension are two critical parameters for the distribution heterogeneity and tortuosity of pores. Figure 10a shows the comparison of the TPG with various pore-size distribution fractal dimensions. The tortuosity fractal dimension was assumed to be 1.7. As the pore-size distribution fractal dimension increased from 1.4 to 1.8, the TPG significantly declined in low-porosity reservoirs. The effect of tortuosity fractal dimension on TPG is shown in Figure 10b. When the pore-size distribution fractal dimension was held at the same value, the increase in the tortuosity fractal dimension caused a more significant growth in the TPG. These two cases show that the TPG increases significantly as the pore-size distribution fractal dimension and tortuosity fractal dimension increase. The TPG grows drastically with the decrease in porosity and becomes more sensitive to fractal dimensions as the porosity of the rock decreases. The effect of fractal dimension on the TPG cannot be ignored, especially in low-porosity and low-permeability reservoirs.

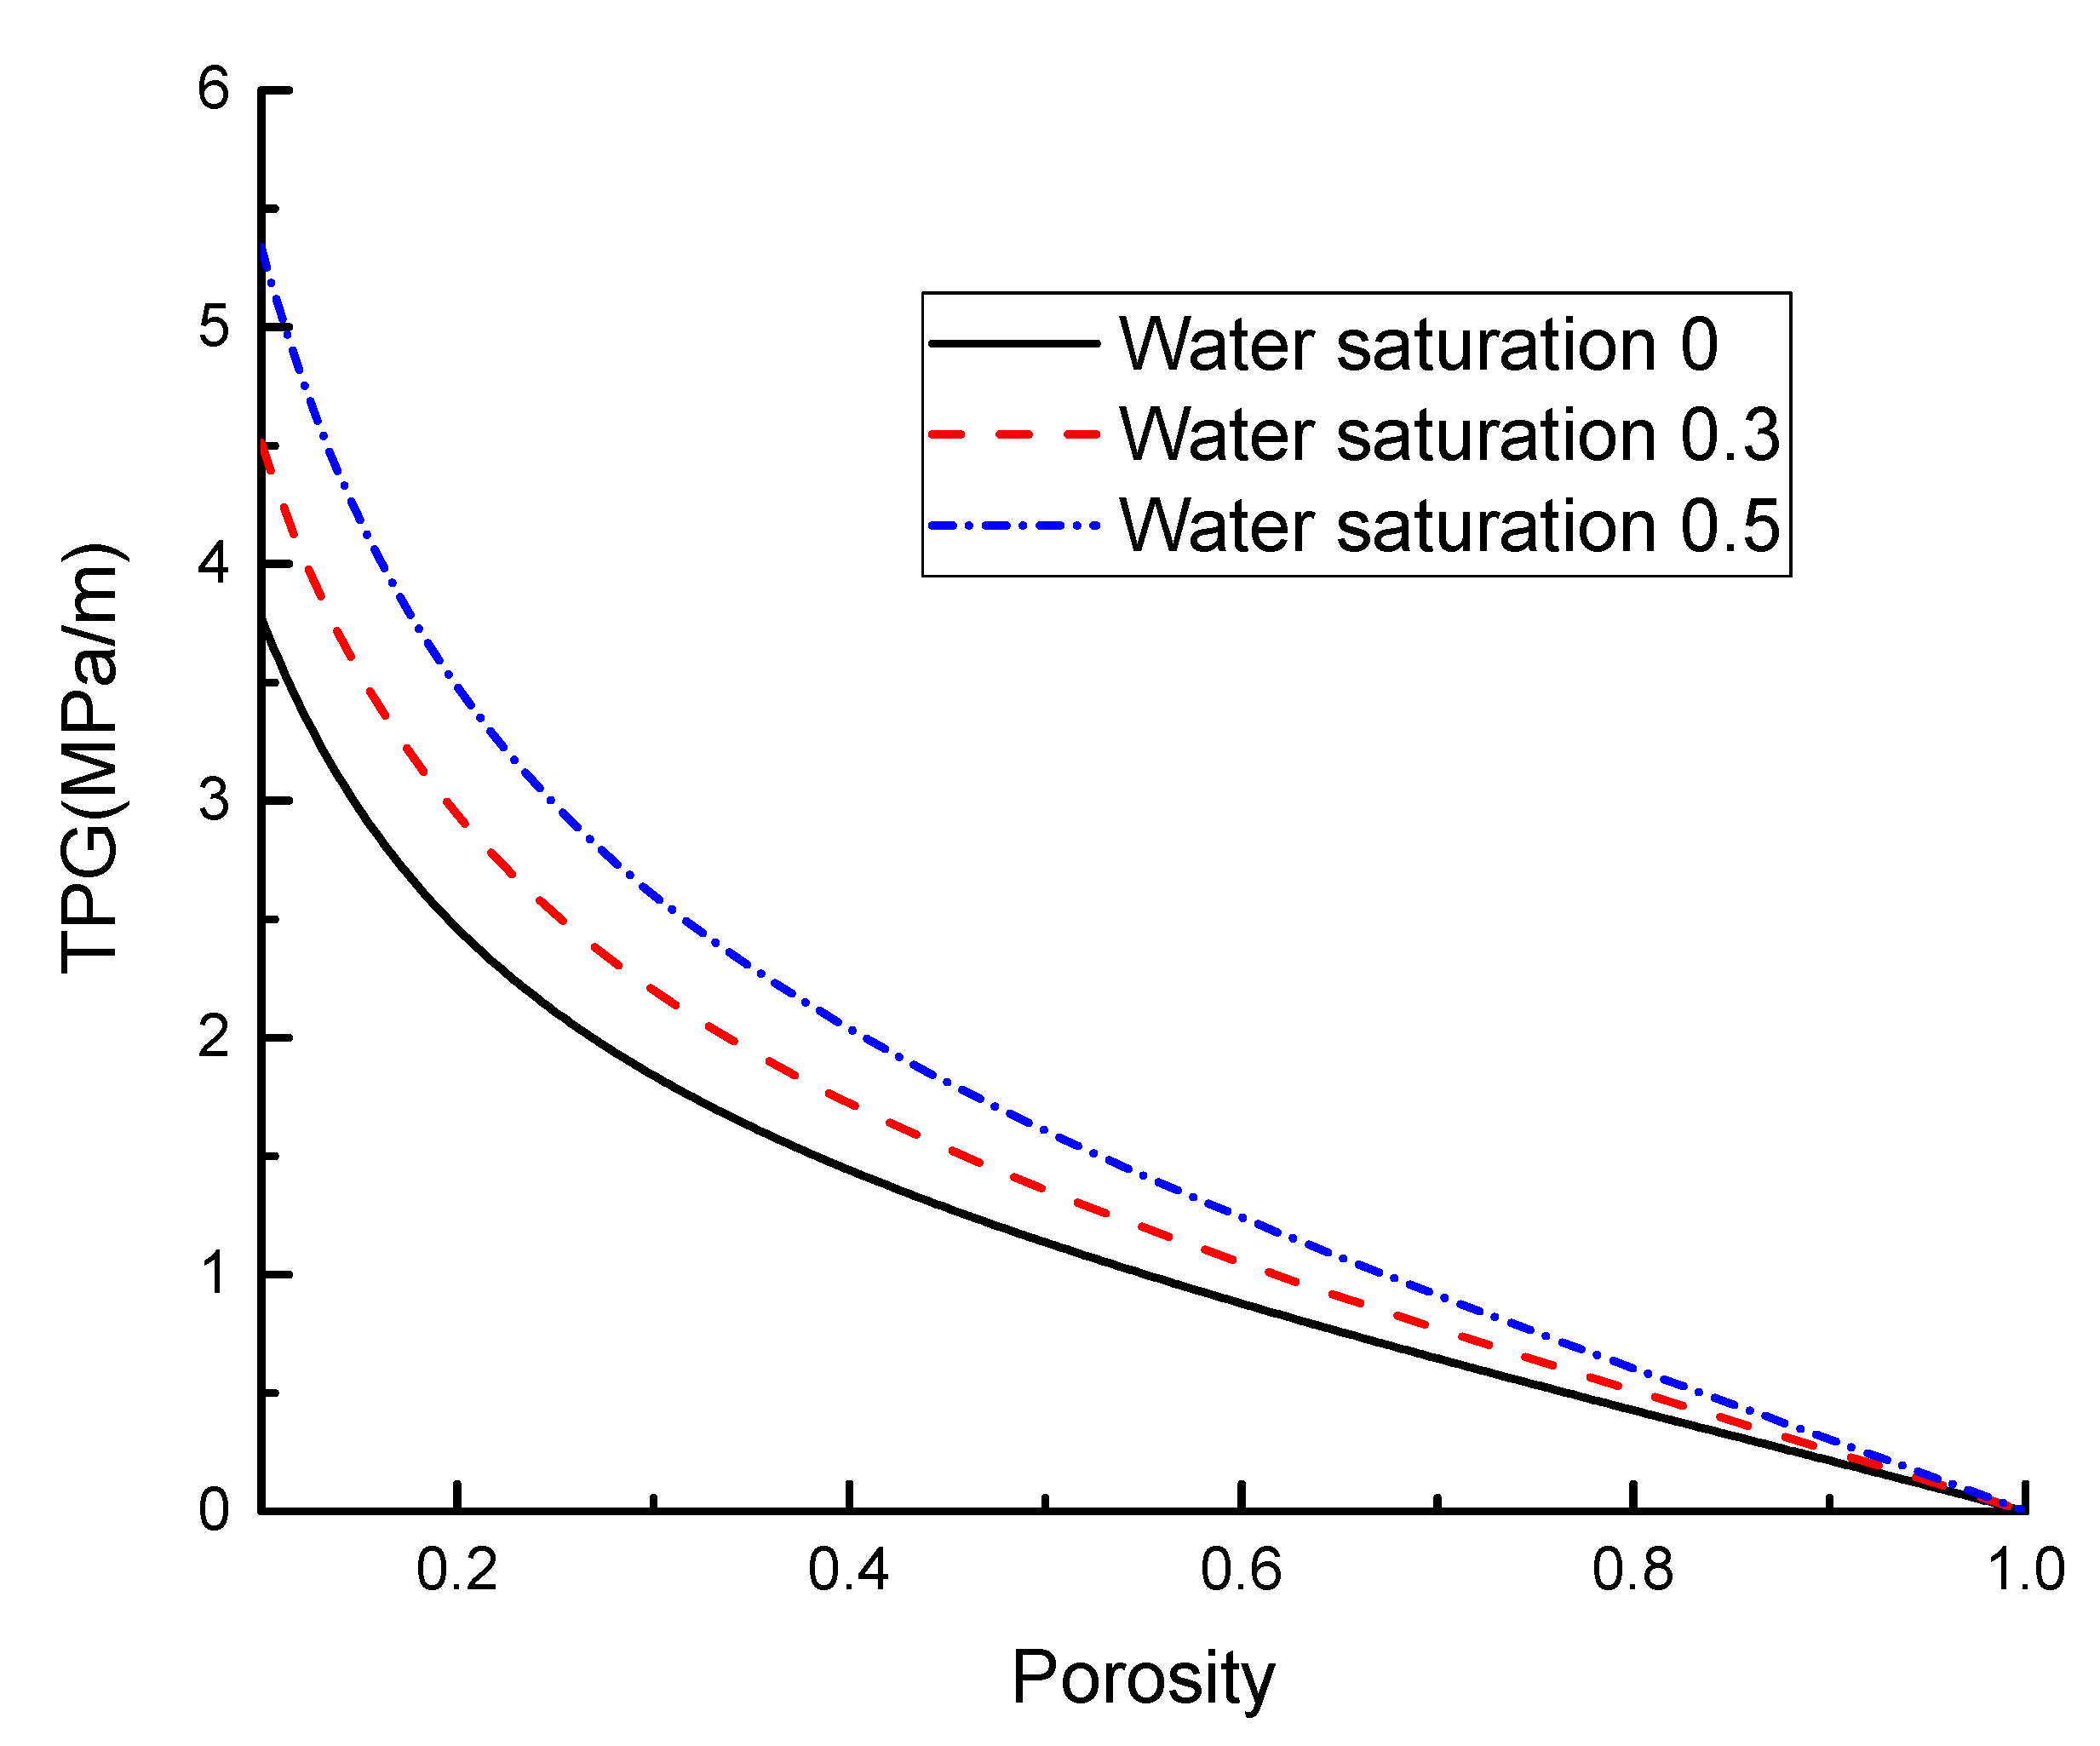
3.4. Effect of Residual Water Saturation

The residual water forms a fluid boundary layer in our capillary tubes, which significantly increases the resistance to fluid flow. An increase of residual water saturation means that a layer thickness of water film increases at the very tiny pore-throat and the effective radius of the fluid flow reduces. The high viscosity of the boundary fluid also adds a flow resistance. Thus, a higher TPG is obtained with the increase in residual water saturation, as shown in Figure 11. Unlike the effect of fractal dimensions on the TPG, the residual water saturation has a wider influence range because the pore complexity in the fractal dimension becomes less significant when the porosity is beyond a range, while the residual water saturation is not limited to low-porosity reservoirs.

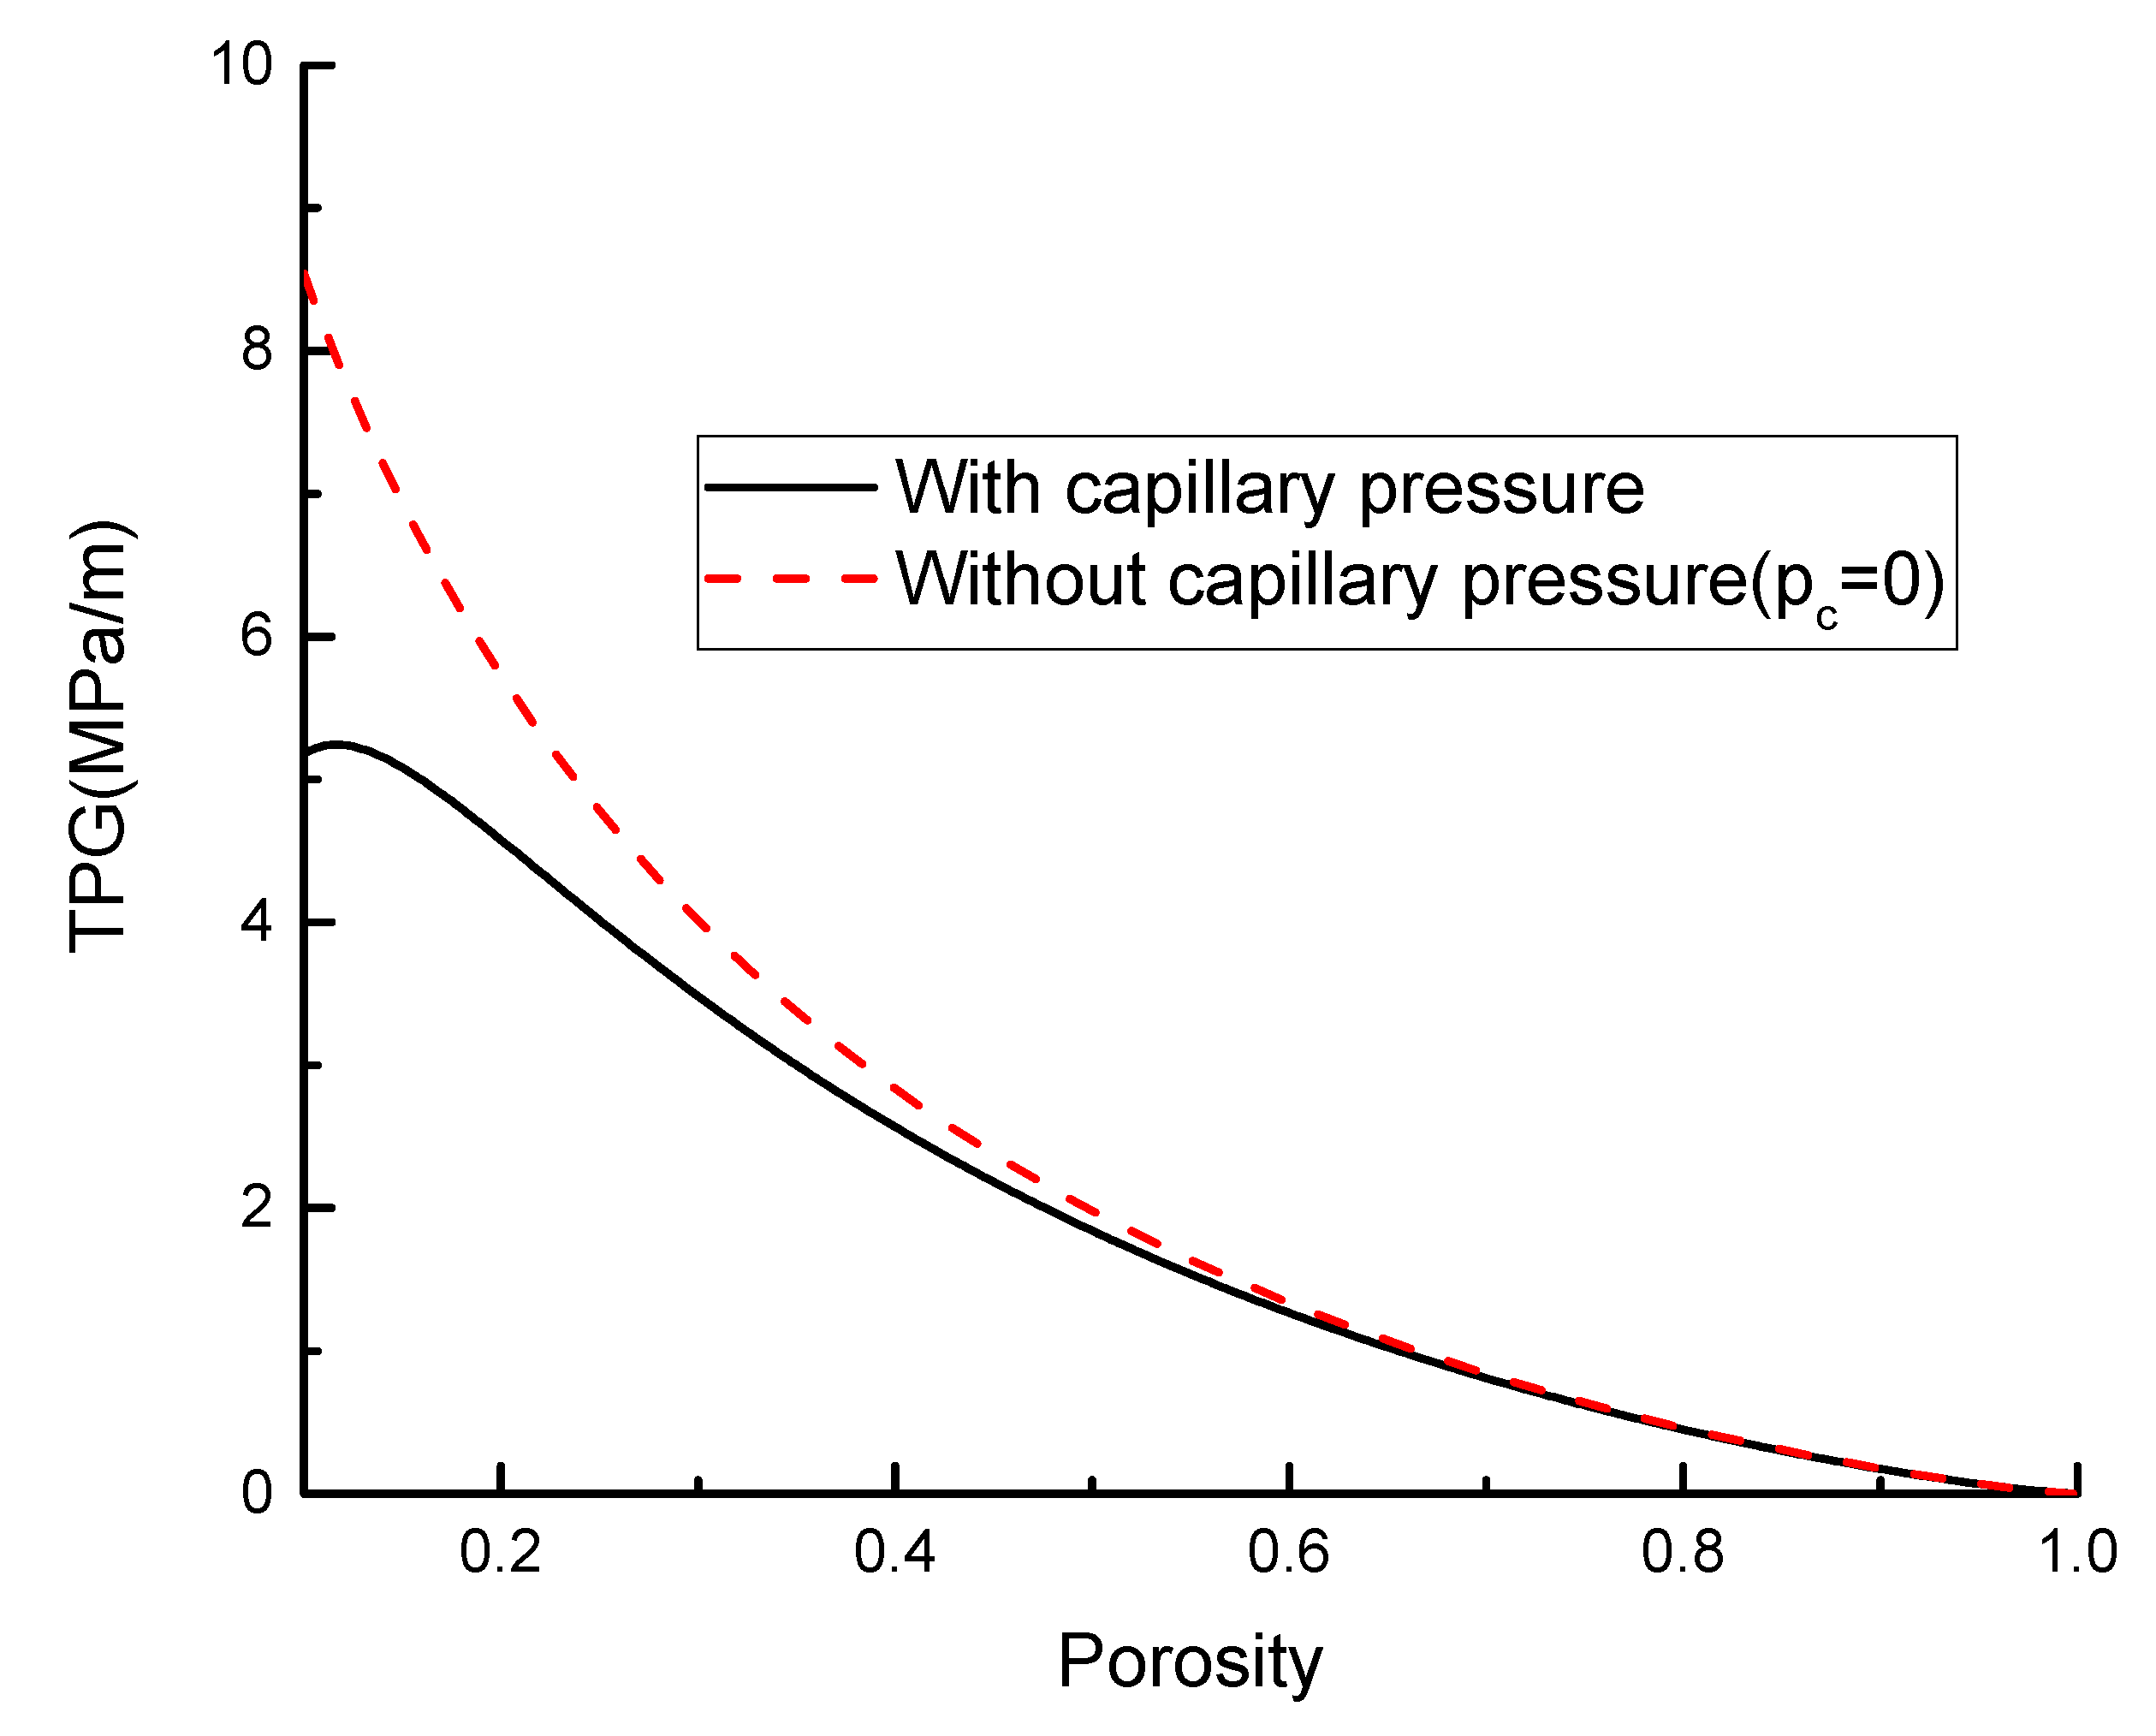
3.5. Effect of Capillary Pressure

Figure 12 shows the evolution of the TPG with porosity, with or without capillary pressure. When the porosity was higher than 0.4, the effect of capillary pressure on the TPG was no longer considered. However, the effects of capillary pressure could cause a maximum increase of 65% in low-porosity reservoirs.

4. Conclusions

This paper proposed a novel semi-empirical formula for the threshold pressure gradient. This formula established a macroscopic relationship with permeability, water saturation, and pore pressure. Furthermore, a fractal model of capillary tubes was developed to link this TPG formula with the structural parameters of porous media (pore-size distribution fractal dimension and tortuosity fractal dimension), residual water saturation, and capillary pressure. This formula was verified by multiple sets of experimental data. Finally, parameter sensitivity was investigated for the fractal model. Based on these studies, the following conclusions can be drawn.
  • The gas flow in low-permeability reservoirs exhibits a strong non-Darcy behavior. The boundary layer effect and fluid plasticity play the main role in this nonlinear behavior.
  • The threshold pressure gradient is directly related to permeability, water saturation, and pore pressure. An approximate power function can describe the relationship between permeability and the TPG. An exponential relationship is more consistent with the effects of water saturation and pore pressure.
  • Both pore-size distribution in the fractal dimension and tortuosity fractal dimension can increase the TPG by characterizing the complexity of the pore structure. However, the tortuosity fractal dimension has a more significant enhancement effect.
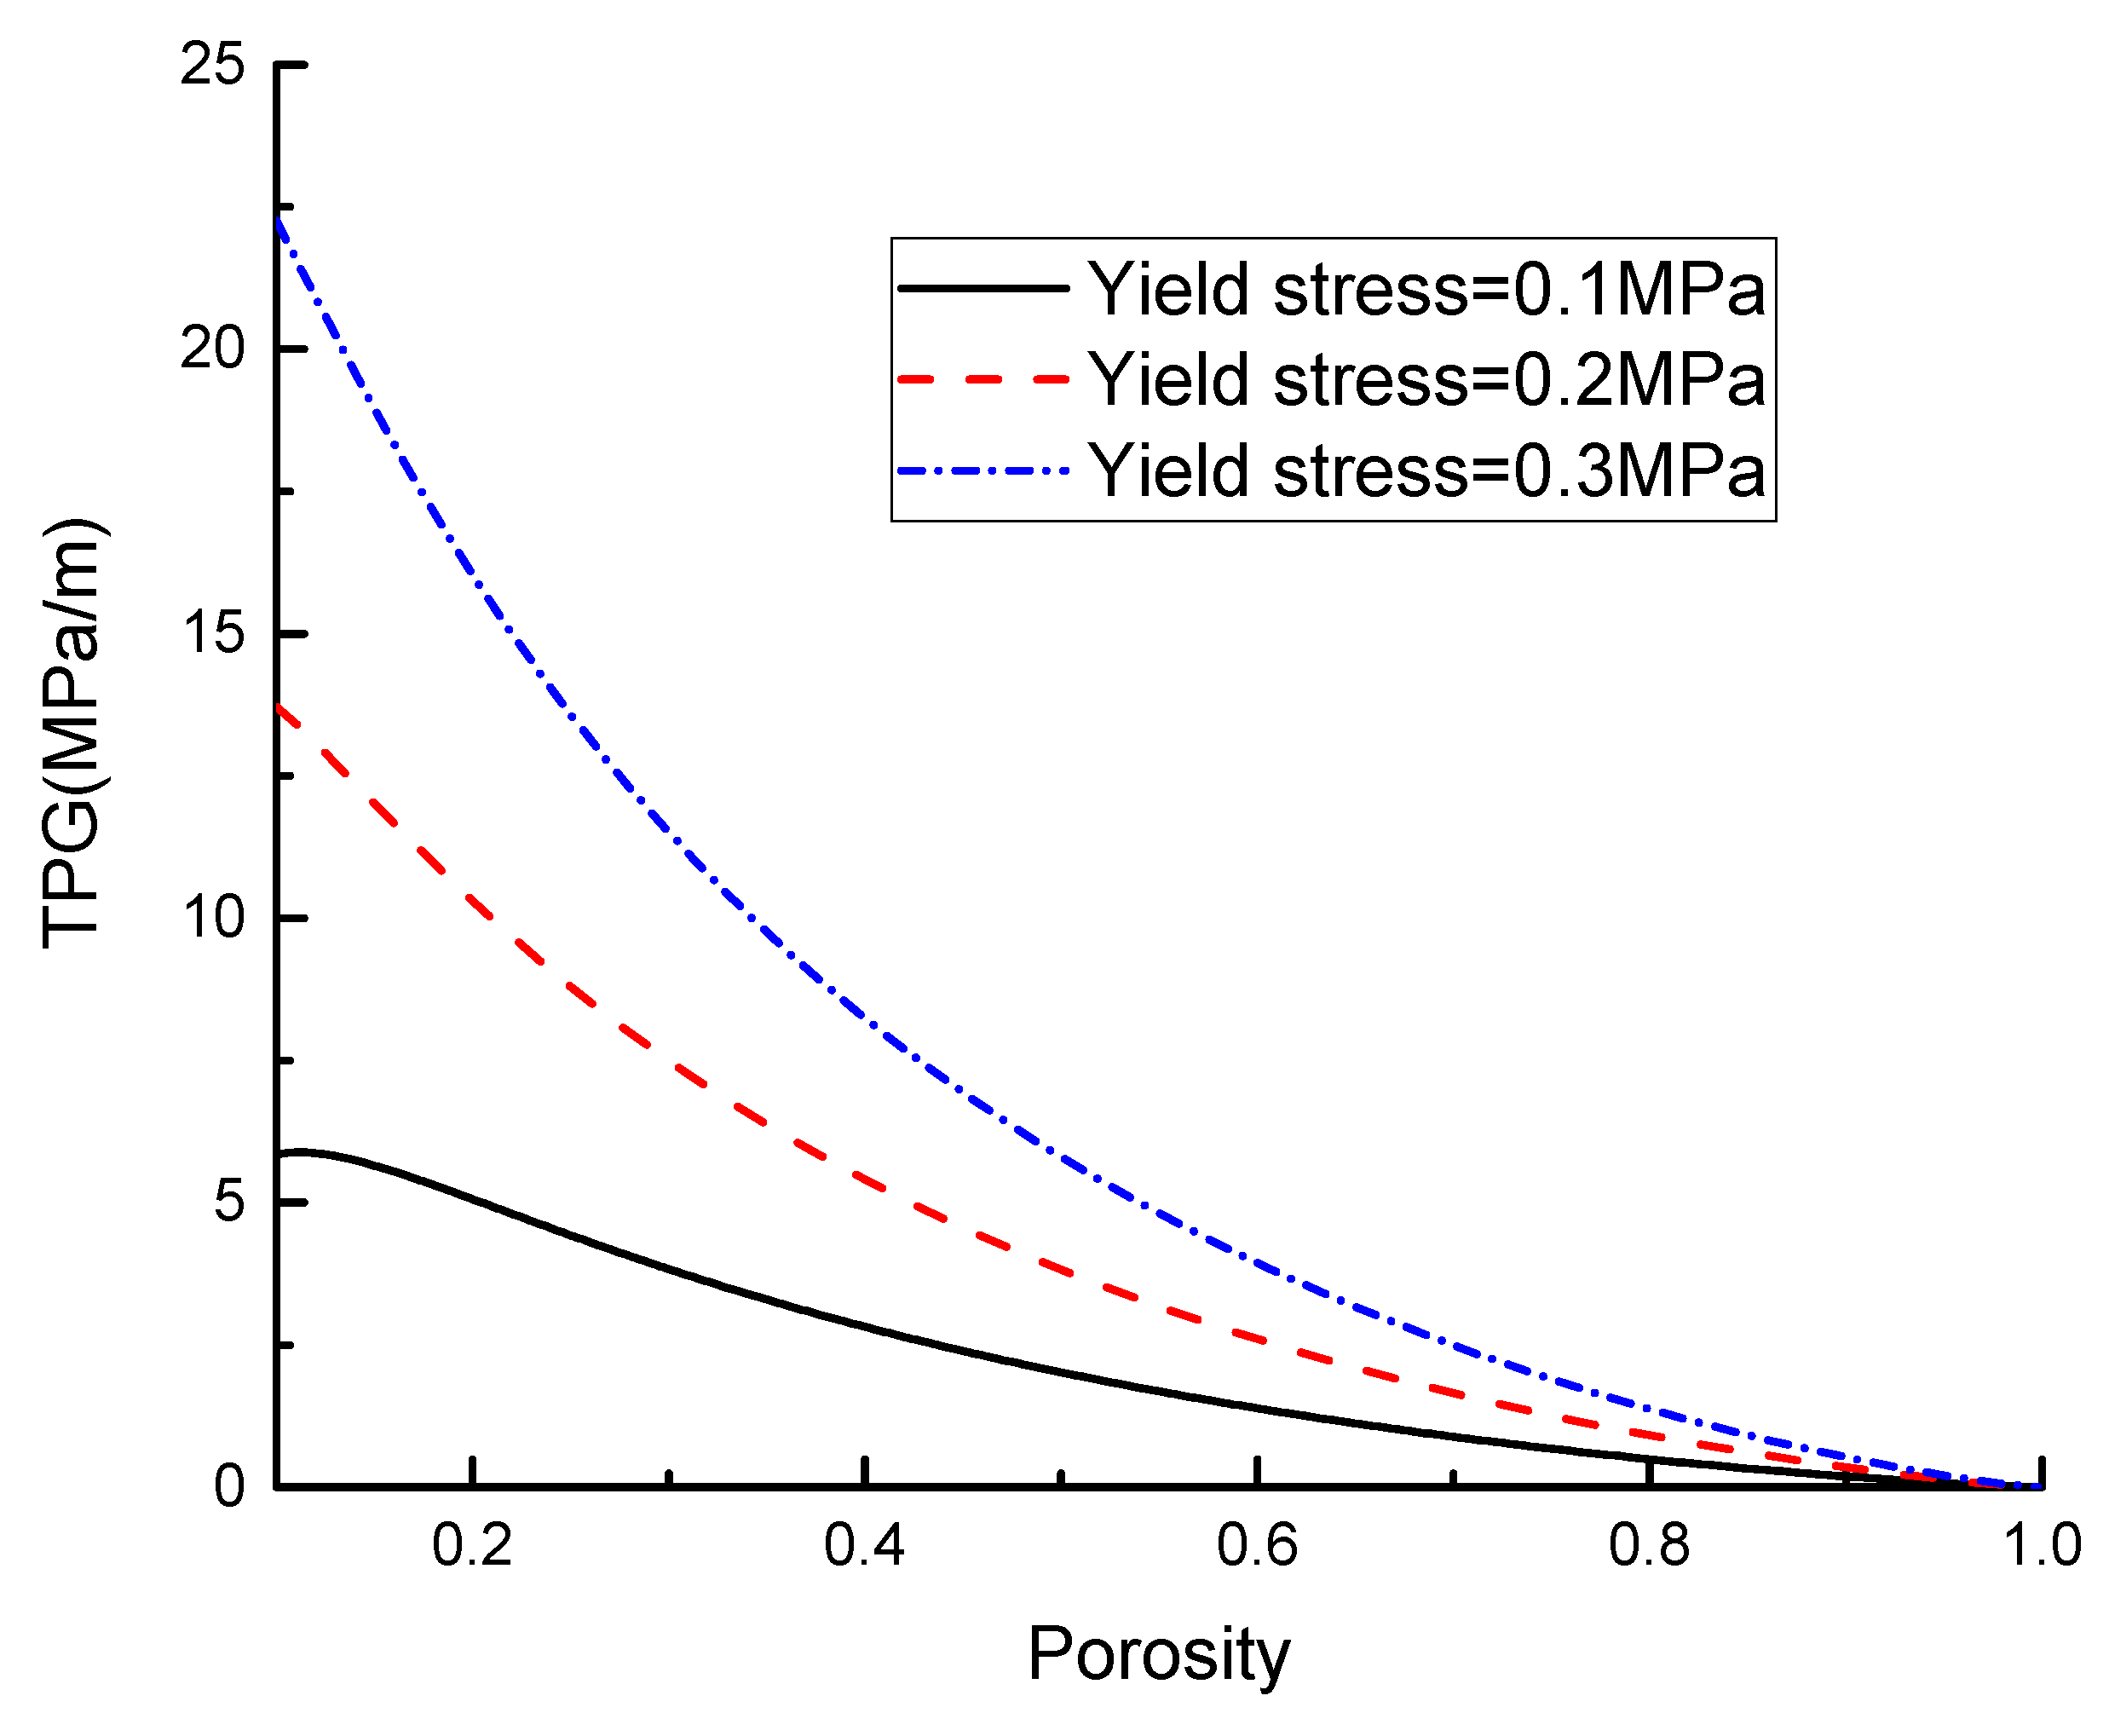
  • Complex pore structure has a significant effect on the TPG only in the range of low porosity, but water saturation and yield stress have a wider influence range. A linear relationship between yield stress and TPG can be observed.

Author Contributions

H.W., Data analysis, investigation, model validation, writing-original draft. J.W., Conceptualization, methodology, supervision, funding acquisition, writing-review and editing. X.W., Resources, funding acquisition, writing-review and editing. A.C., Software, visualization, writing-review and editing. All authors have read and agreed to publish this manuscript.

Funding

The authors are grateful to the financial support from the Outstanding Innovation Scholarship for Doctoral Candidate of CUMT (2019YCBS059).

Acknowledgments

The first author is grateful for the 2 + 2 joint PhD training program of the China University of Mining and Technology and the University of Tasmania.

Conflicts of Interest

The authors declare no conflicts of interest.

Appendix A: Derivation of Fractal Parameters

The capillaries in porous media have the characteristic of self-similarity. The fractal theory is effective at describing these capillary tubes with different pore sizes and tortuous lengths. The number of pore sizes that are greater than r in porous media follows this relation [39]:
N ( δ r ) = ( r max r ) D f
where δ , r max , and r are the scale of length, the maximum pore diameter, and pore diameter, respectively. D f is the fractal dimension of the pore size distribution and has a range of 0 < D f < 2 in two-dimensional space that can be obtained by [40]
D f = d E ln ϕ ln ( r min / r max )
where d E represents the Euclidean dimension. r min is the minimum pore diameter.
Differentiating Equation (A1) with respect to r obtains the following expression:
d N = D f r max D f r ( D f + 1 ) d r
Capillary length is related to the radius in following fractal law [40]:
L ( r ) = r 1 D T L 0 D T
where L and L 0 represent the actual capillary length and representative capillary length, respectively. D T is the fractal dimension of tortuosity, 1 < D T < 2 in two-dimensions. It can be expressed by
D T = 1 + ln τ a v ln ( L 0 / r a v )
where τ a v and r a v are the average tortuosity of capillaries and the average capillary diameter, respectively.
τ a v = 1 2 [ 1 + 1 2 1 ϕ + 1 ϕ ( 1 1 ϕ 1 ) 2 + 1 4 1 1 ϕ ]
r a v = r max ( D f 4 D f ) 1 4
r max = r a v 4 [ 2 ϕ 1 ϕ + 2 π 3 ( 1 ϕ ) 2 ]
Therefore, the cross-sectional area of all pores could be written as [41]
A = ( 1 ϕ ) ϕ D f π r max 2 4 ( 2 D f )
Thus, the representative capillary length could be expressed as
L 0 = r a v 2 π 3 ( 1 ϕ )

References

  1. Ahmad, F.; Adhami, A.Y.; Smarandache, F. Neutrosophic optimization model and computational algorithm for optimal shale gas water management under uncertainty. Symmetry 2019, 11, 544. [Google Scholar] [CrossRef] [Green Version]
  2. Jia, C.; Zheng, M.; Zhang, Y. Unconventional hydrocarbon resources in China and the prospect of exploration and development. Pet. Explor. Dev. 2012, 39, 139–146. [Google Scholar] [CrossRef]
  3. Cai, J. A fractal approach to low velocity non-Darcy flow in a low permeability porous medium. Chin. Phys. B 2014, 23, 44701. [Google Scholar] [CrossRef]
  4. Song, H.; Cao, Y.; Yu, M.; Wang, Y.; Killough, J.E.; Leung, J. Impact of permeability heterogeneity on production characteristics in water-bearing tight gas reservoirs with threshold pressure gradient. J. Nat. Gas Sci. Eng. 2015, 22, 172–181. [Google Scholar] [CrossRef]
  5. Li, D.; Zha, W.; Liu, S.; Wang, L.; Lu, D. Pressure transient analysis of low permeability reservoir with pseudo threshold pressure gradient. J. Pet. Sci. Eng. 2016, 147, 308–316. [Google Scholar] [CrossRef]
  6. Tian, W.; Li, A.; Ren, X.; Josephine, Y. The threshold pressure gradient effect in the tight sandstone gas reservoirs with high water saturation. Fuel 2018, 226, 221–229. [Google Scholar] [CrossRef]
  7. Zhu, W.; Song, H.; Huang, X.; Liu, X.; He, D.; Ran, Q. Pressure characteristics and effective deployment in a water-bearing tight gas reservoir with low-velocity non-Darcy flow. Energy Fuels 2011, 25, 1111–1117. [Google Scholar] [CrossRef]
  8. Wang, X.; Sheng, J.J. Effect of low-velocity non-Darcy flow on well production performance in shale and tight oil reservoirs. Fuel 2017, 190, 41–46. [Google Scholar] [CrossRef] [Green Version]
  9. Ding, J.; Yang, S.; Nie, X.; Wang, Z. Dynamic threshold pressure gradient in tight gas reservoir. J. Nat. Gas Sci. Eng. 2014, 20, 155–160. [Google Scholar] [CrossRef]
  10. Huang, L.; Shi, J.; Yang, L.; Zang, J.; Zhang, L.; Yu, P. Experimental research and analysis on threshold pressure gradient in low-permeability gas reservoir. Fault-Block Oil Gas Field. 2016, 23, 610–614. [Google Scholar]
  11. Zhang, R.H.; Zhang, L.H.; Wang, R.H.; Zhao, Y.L.; Huang, R. Simulation of a multistage fractured horizontal well in a water-bearing tight fractured gas reservoir under non-Darcy flow. J. Geophys. Eng. 2018, 15, 877–894. [Google Scholar] [CrossRef] [Green Version]
  12. Song, F.; Wang, J.; Liu, H. Static threshold pressure gradient characteristics of liquid influenced by boundary wettability. Chin. Phys. Lett. 2010, 27, 24704. [Google Scholar]
  13. Huang, Y.; Yang, Z.; He, Y.; Wang, X.; Luo, Y. Nonlinear porous flow in low permeability porous media. Mech. Pract. 2013, 35, 1–8. [Google Scholar] [CrossRef] [Green Version]
  14. Wang, F.; Liu, Z.; Cai, J.; Gao, J. A fractal model for low-velocity non-Darcy flow in tight oil reservoirs considering boundary-layer effect. Fractals 2018, 26, 1850077. [Google Scholar] [CrossRef]
  15. Miller, R.J.; Low, P.F. Threshold gradient for water flow in clay systems 1. Soil Sci. Soc. Am. J. 1963, 27, 605–609. [Google Scholar] [CrossRef]
  16. Prada, A.; Civan, F. Modification of Darcy’s law for the threshold pressure gradient. J. Pet. Sci. Eng. 1999, 22, 237–240. [Google Scholar] [CrossRef]
  17. Wang, S.; Huang, Y.; Civan, F. Experimental and theoretical investigation of the Zaoyuan field heavy oil flow through porous media. J. Pet. Sci. Eng. 2006, 50, 83–101. [Google Scholar] [CrossRef]
  18. Liu, W.; Yao, J.; Wang, Y. Exact analytical solutions of moving boundary problems of one-dimensional flow in semi-infinite long porous media with threshold pressure gradient. Int. J. Heat Mass Transf. 2012, 55, 6017–6022. [Google Scholar] [CrossRef]
  19. Li, S.; Cheng, L.; Li, X.; Hao, F. Nonlinear seepage flow of ultralow permeability reservoirs. Pet. Explor. Dev. 2008, 35, 606–612. [Google Scholar] [CrossRef]
  20. Zeng, B.; Cheng, L.; Hao, F. Experiment and mechanism analysis on threshold pressure gradient with different fluids. Presented at the Nigeria Annual International Conference and Exhibition, Calabar, Nigeria, 31 July–7 August 2010. SPE-140678MS. [Google Scholar]
  21. Yang, R.; Jiang, R.; Liu, S.; Zhang, X.; Liu, H. Numerical simulation of nonlinear seepage in ultra-low permeability reservoirs. Acta Pet. Sin. 2011, 32, 299–306. [Google Scholar]
  22. Chen, X.; He, P.; Qin, Z. Damage to the microstructure and strength of altered granite under wet–dry cycles. Symmetry 2018, 10, 716. [Google Scholar] [CrossRef] [Green Version]
  23. Bornstein, M.M.; Fernández-Martínez, M.; Guirao, J.L.; Gómez-García, F.J.; Guerrero-Sánchez, Y.; López-Jornet, P. On the symmetry of the bone structure density over the nasopalatine foramen via accurate fractal dimension analysis. Symmetry 2019, 11, 202. [Google Scholar] [CrossRef] [Green Version]
  24. Yu, B.; Cheng, P. A fractal model for permeability of bi-dispersed porous media. Int. J. Heat Mass Transf. 2002, 45, 2983–2993. [Google Scholar] [CrossRef]
  25. Wang, S.; Yu, B. A fractal model for the starting pressure gradient for Bingham fluids in porous media embedded with fractal-like tree networks. Int. J. Heat Mass Transf. 2011, 54, 4491–4494. [Google Scholar] [CrossRef]
  26. Ye, W.; Wang, X.; Cao, C.; Yu, W. A fractal model for threshold pressure gradient of tight oil reservoirs. J. Pet. Sci. Eng. 2019, 179, 427–431. [Google Scholar] [CrossRef]
  27. Li, J.; Chen, Z.; Wu, K.; Li, R.; Xu, J.; Liu, Q.; Qu, S.; Li, X. Effect of water saturation on gas slippage in tight rocks. Fuel 2018, 225, 519–532. [Google Scholar] [CrossRef]
  28. Cai, J.; Lin, D.; Singh, H.; Zhou, S.; Meng, Q.; Zhang, Q. A simple permeability model for shale gas and key insights on relative importance of various transport mechanisms. Fuel. 2019, 252, 210–219. [Google Scholar] [CrossRef]
  29. Huo, D.; Benson, S.M. Experimental investigation of stress-dependency of relative permeability in rock fractures. Transp. Porous Media 2016, 113, 567–590. [Google Scholar] [CrossRef]
  30. Su, H.B. A flow model reflecting dynamic kick-off pressure gradient for low permeability reservoirs. J. Southwest Pet. Univ. 2015, 37, 105–111. [Google Scholar]
  31. Wang, Q.; Tang, H.; Lv, L.; Peng, D.; Guo, F. An experimental study on threshold pressure gradient in low pernteability reservoir. Pet. Geol. Recovery Effic. 2011, 18, 97–100. [Google Scholar]
  32. Hao, F.; Cheng, L.S.; Hassan, O.; Hou, J.; Liu, C.Z.; Feng, J.D. Threshold pressure gradient in ultra-low permeability reservoirs. Pet. Sci. Technol. 2008, 26, 1024–1035. [Google Scholar] [CrossRef]
  33. Bachu, S.; Bennion, B. Effects of in-situ conditions on relative permeability characteristics of CO2-brine systems. Environ. Geol. 2008, 54, 1707–1722. [Google Scholar] [CrossRef]
  34. Thomas, L.K.; Katz, D.L.; Tek, M.R. Threshold pressure phenomena in porous media. Soc. Pet. Eng. J. 1968, 8, 174–184. [Google Scholar] [CrossRef]
  35. Wu, D.; Ju, B.; Wu, S.; Brantson, E.T.; Fu, Y.; Lei, Z. Investigation of productivity decline in inter-salt argillaceous dolomite reservoir due to formation damage and threshold pressure gradient: Laboratory, mathematical modeling and application. Energy Explor. Exploit. 2017, 35, 33–53. [Google Scholar] [CrossRef]
  36. Hu, B.; Wang, J.G.; Wu, D.; Wang, H. Impacts of zone fractal properties on shale gas productivity of a multiple fractured horizontal well. Fractals 2019, 27, 1950006. [Google Scholar] [CrossRef]
  37. Bird, R.B.; Stewart, W.E.; Lightfoot, E.N.; Meredith, R.E. Transport phenomena. J. Electrochem. Soc. 1961, 108, 78C–79C. [Google Scholar] [CrossRef]
  38. Ahn, K.J.; Seferis, J.C.; Berg, J.C. Simultaneous measurements of permeability and capillary pressure of thermosetting matrices in woven fabric reinforcements. Polym. Compos. 1991, 12, 146–152. [Google Scholar] [CrossRef]
  39. Yu, B. Fractal character for tortuous streamtubes in porous media. Chin. Phys. Lett. 2005, 22, 158. [Google Scholar]
  40. Yu, B.; Li, J. Some fractal characters of porous media. Fractals 2001, 9, 365–372. [Google Scholar] [CrossRef]
  41. Xu, P.; Qiu, S.; Yu, B.; Jiang, Z. Prediction of relative permeability in unsaturated porous media with a fractal approach. Int. J. Heat Mass Transf. 2013, 64, 829–837. [Google Scholar] [CrossRef]
Figure 1. A typical schematic of low-velocity non-Darcy flow with threshold pressure gradient (modified after references [8,12,13,14]).
Symmetry 12 00364 g001
Figure 2. The variation of the boundary layer thickness with pressure gradient.
Symmetry 12 00364 g002
Figure 3. (a) Verification of the TPG correlation with different permeabilities, (b) Verification of the TPG correlation with different water saturations.
Symmetry 12 00364 g003
Figure 4. (a) The variation of the TPG with water saturation at the permeability of 0.687, 1.51, and 9.02 mD, (b) The variation of the TPG with water saturation at the permeability of 9.02 mD.
Symmetry 12 00364 g004
Figure 5. The variation of the TPG with pore pressure at different permeabilities.
Symmetry 12 00364 g005
Figure 6. The variation of the TPG with pore pressure at different water saturations.
Symmetry 12 00364 g006
Figure 7. Comparison of the proposed fractal model with the classic model and experimental data.
Symmetry 12 00364 g007
Figure 8. The effect of yield stress on the TPG.
Symmetry 12 00364 g008
Figure 9. The evolution of the TPG with yield stress predicted by our fractal model and the classic model of Equation (2).
Symmetry 12 00364 g009
Figure 10. (a) The effect of pore size distribution fractal dimension on the TPG, (b) The effect of tortuosity fractal dimension on the TPG.
Symmetry 12 00364 g010
Figure 11. The effect of water saturation on the TPG.
Symmetry 12 00364 g011
Figure 12. The comparison of the TPG evolution with or without capillary pressure.
Symmetry 12 00364 g012
Table 1. Correlations of the TPG.
TPG CorrelationsCore DataReference
T P G = 16 ( k μ ) 0.8 Core flooding using brinePrada and Civan [16]
T P G = 0.5 ( k μ ) 0.9813 Core flooding using oilLi et al. [19]
T P G = 0.0747 k 1.117 Core flooding using oilLi et al. [19]
T P G = 0.4 k 0.9348 Core flooding using formation waterZeng et al. [20]
T P G = 0.00965 k 0.9738 Core flooding using oilYang et al. [21]
Table 2. Fitting coefficients for the three cases.
Fitting Coefficientsabcmn
Case 1 (permeability effect [10])Figure 3a 0.084640.42046
Figure 3b 2.542 × 10 4 −2.8612527.63959
Case 2 (water saturation effect [7])Figure 4aCore 10.1165−8.899497.41895
Core 20.002488.000768.40124
Figure 4bCore 315.354146.2152
Case 3 (pore pressure effect [9])Figure 5Core 50.257910.043970.2733−0.058980.00107
Core 60.166320.065770.24045−0.055440.00116
Core 70.071730.055310.14122−0.03052 6.0346 × 10 4
Figure 6
(Core 5)
Sw 0.60.304820.053710.25039−0.06870.00107
Sw 0.50.259430.056610.31669−0.072610.00114
Sw 0.40.184150.090780.635−0.078490.00133
Sw 0.30.165590.09730.90743−0.086210.00154
Table 3. Core parameters used in three cases.
Case 1 (permeability effect [10])Range of permeability (mD)Average permeability (mD)Range of porosity (%)Average porosity (%)
0.011–0.470.112.62–14.216.16
Case 2 (water saturation effect [7])Core NumberPermeability (mD)Length (cm)Diameter (cm)Driving pressure (MPa)
Core 10.68752.50.504
Core 21.5152.50.401
Core 39.0252.50.053
Case 3 (pore pressure effect [9])Core NumberPermeability (mD)Length (cm)Diameter (cm)Porosity (%)
Core 50.0615.9622.5346.15
Core 60.1936.282.5388.32
Core 70.3176.2862.5412.08

