1. Introduction
The World Health Organization (WHO) has warned that increasing global warming and climate change are contributing to the spread of infectious diseases and dengue fever. Dengue fever is a major mosquito-borne viral disease that is severely fatal and always occurs in the summer, especially in large, densely-populated tropical metropolitan areas. Today, with the rapid development of urbanization, dengue fever has become a major problem for many tropical regions during the summer [
1,
2]. In both 2014 and 2015, the number of infected people in Kaohsiung exceeded 10,000 and dengue fever broke out in Tainan, a neighbor of Kaohsiung, in 2015, with more than 25,000 infected cases [
3]. Dengue fever spreads through several species of mosquito, e.g.,
Aedes aegypti and
Aedes albopictus. When a mosquito bites a virus carrier, it can become a viral vector. Then, people bitten by the mosquito can become infected with dengue. Since current technology is not sufficient for tracking mosquitoes and the incubation period of dengue fever is about 3 to 14 days, dengue fever may have spread widely once the first case is found.
A vaccine for dengue fever has been available since 2016 [
4,
5]. However, vector control approaches are still the primary methods employed to prevent the spread of dengue fever [
6]. Chemical insecticides are the most popular tools for vector control [
7]. More than chemical insecticides, common vector control approaches include the genetic elimination of vector mosquitoes [
8,
9] and the improvement of environments of possible habitats of vector mosquitoes [
10,
11].
As spraying chemical insecticides is the most popular approach, chemical insecticides are usually sprayed in places which are either the homes of infected persons or potential habitats of vector mosquitoes. As a result, not only vector mosquitoes, but also other creatures, in these places may be killed. Consequently, this approach seriously damages the ecosystem of an area [
12]. In addition, in the long run, the species of vector mosquitoes may also mutate, and thus become resistant to chemical insecticides [
13].
The infectious sites may be different from the homes of infected persons. As many persons may be infected in the same place, the number of infectious sites should be much smaller than the number of homes of infected persons. Therefore, a method is needed to search for infectious sites so that a city which may suffer from an outbreak of dengue only has to focus on improving the environment of neighborhoods of infectious sites, instead of spraying chemical insecticides all around the city.
Several types of mathematical models have been developed to predict the epidemic of dengue in order to prevent it in advance. Models based on populations of people or vectors in an area or the climate have been developed to predict the transmission conditions of epidemics [
14,
15,
16]. Models have been built to simulate the dynamics of dengue fever in order to predict the outbreak of epidemics [
17,
18,
19]. The control variables are embedded in the models of epidemics. Then, the optimal settings of these variables are obtained using optimal algorithms, in order to suppress the spread of dengue fever [
20,
21,
22]. In conclusion, according to the best of the authors’ knowledge, a model for exploring the infectious sites of dengue fever has not yet been studied.
Inspired by the technology of image reconstruction [
23], this paper presents a method for exploring infectious sites. First, we define the
infectious capacity (IC) of dengue fever of a site—a latent value of the site. A mathematical model from the
split feasibility problem (SFP) is formulated to connect the relationship between infectious capacities of potential sites in a city and the observable information from the public database. As the number of potential sites should be more than thousands in data for an outbreak of dengue fever, searching the ICs of potential sites is a large-scale problem. Then, a proper iterative scheme for SFP is proposed in order to look for the latent ICs of these potential sites. As the ICs are obtained, these potential sites can be categorized into several groups based on their own ICs. Each group is treated with a suitable strategy to prevent the spread of dengue, in order to protect the ecosystem of a city simultaneously.
The paper is divided into five sections.
Section 2 is devoted to establishing a mathematical formulation for exploring the IC of each potential site for spreading dengue fever. The model connects the relationship between ICs and the observable information from the public database.
Section 3 discusses the algorithms for the SFP and then proposes an iterative scheme for calculating the IC of each potential site.
Section 4 uses the real data of Kaohsiung City from 2014 and 2015 to demonstrate the performance of our proposed method, while
Section 5 gives the conclusion of this study.
2. A Model for Exploring Infectious Capacities and a New Eco-Friendly Prevention Strategy
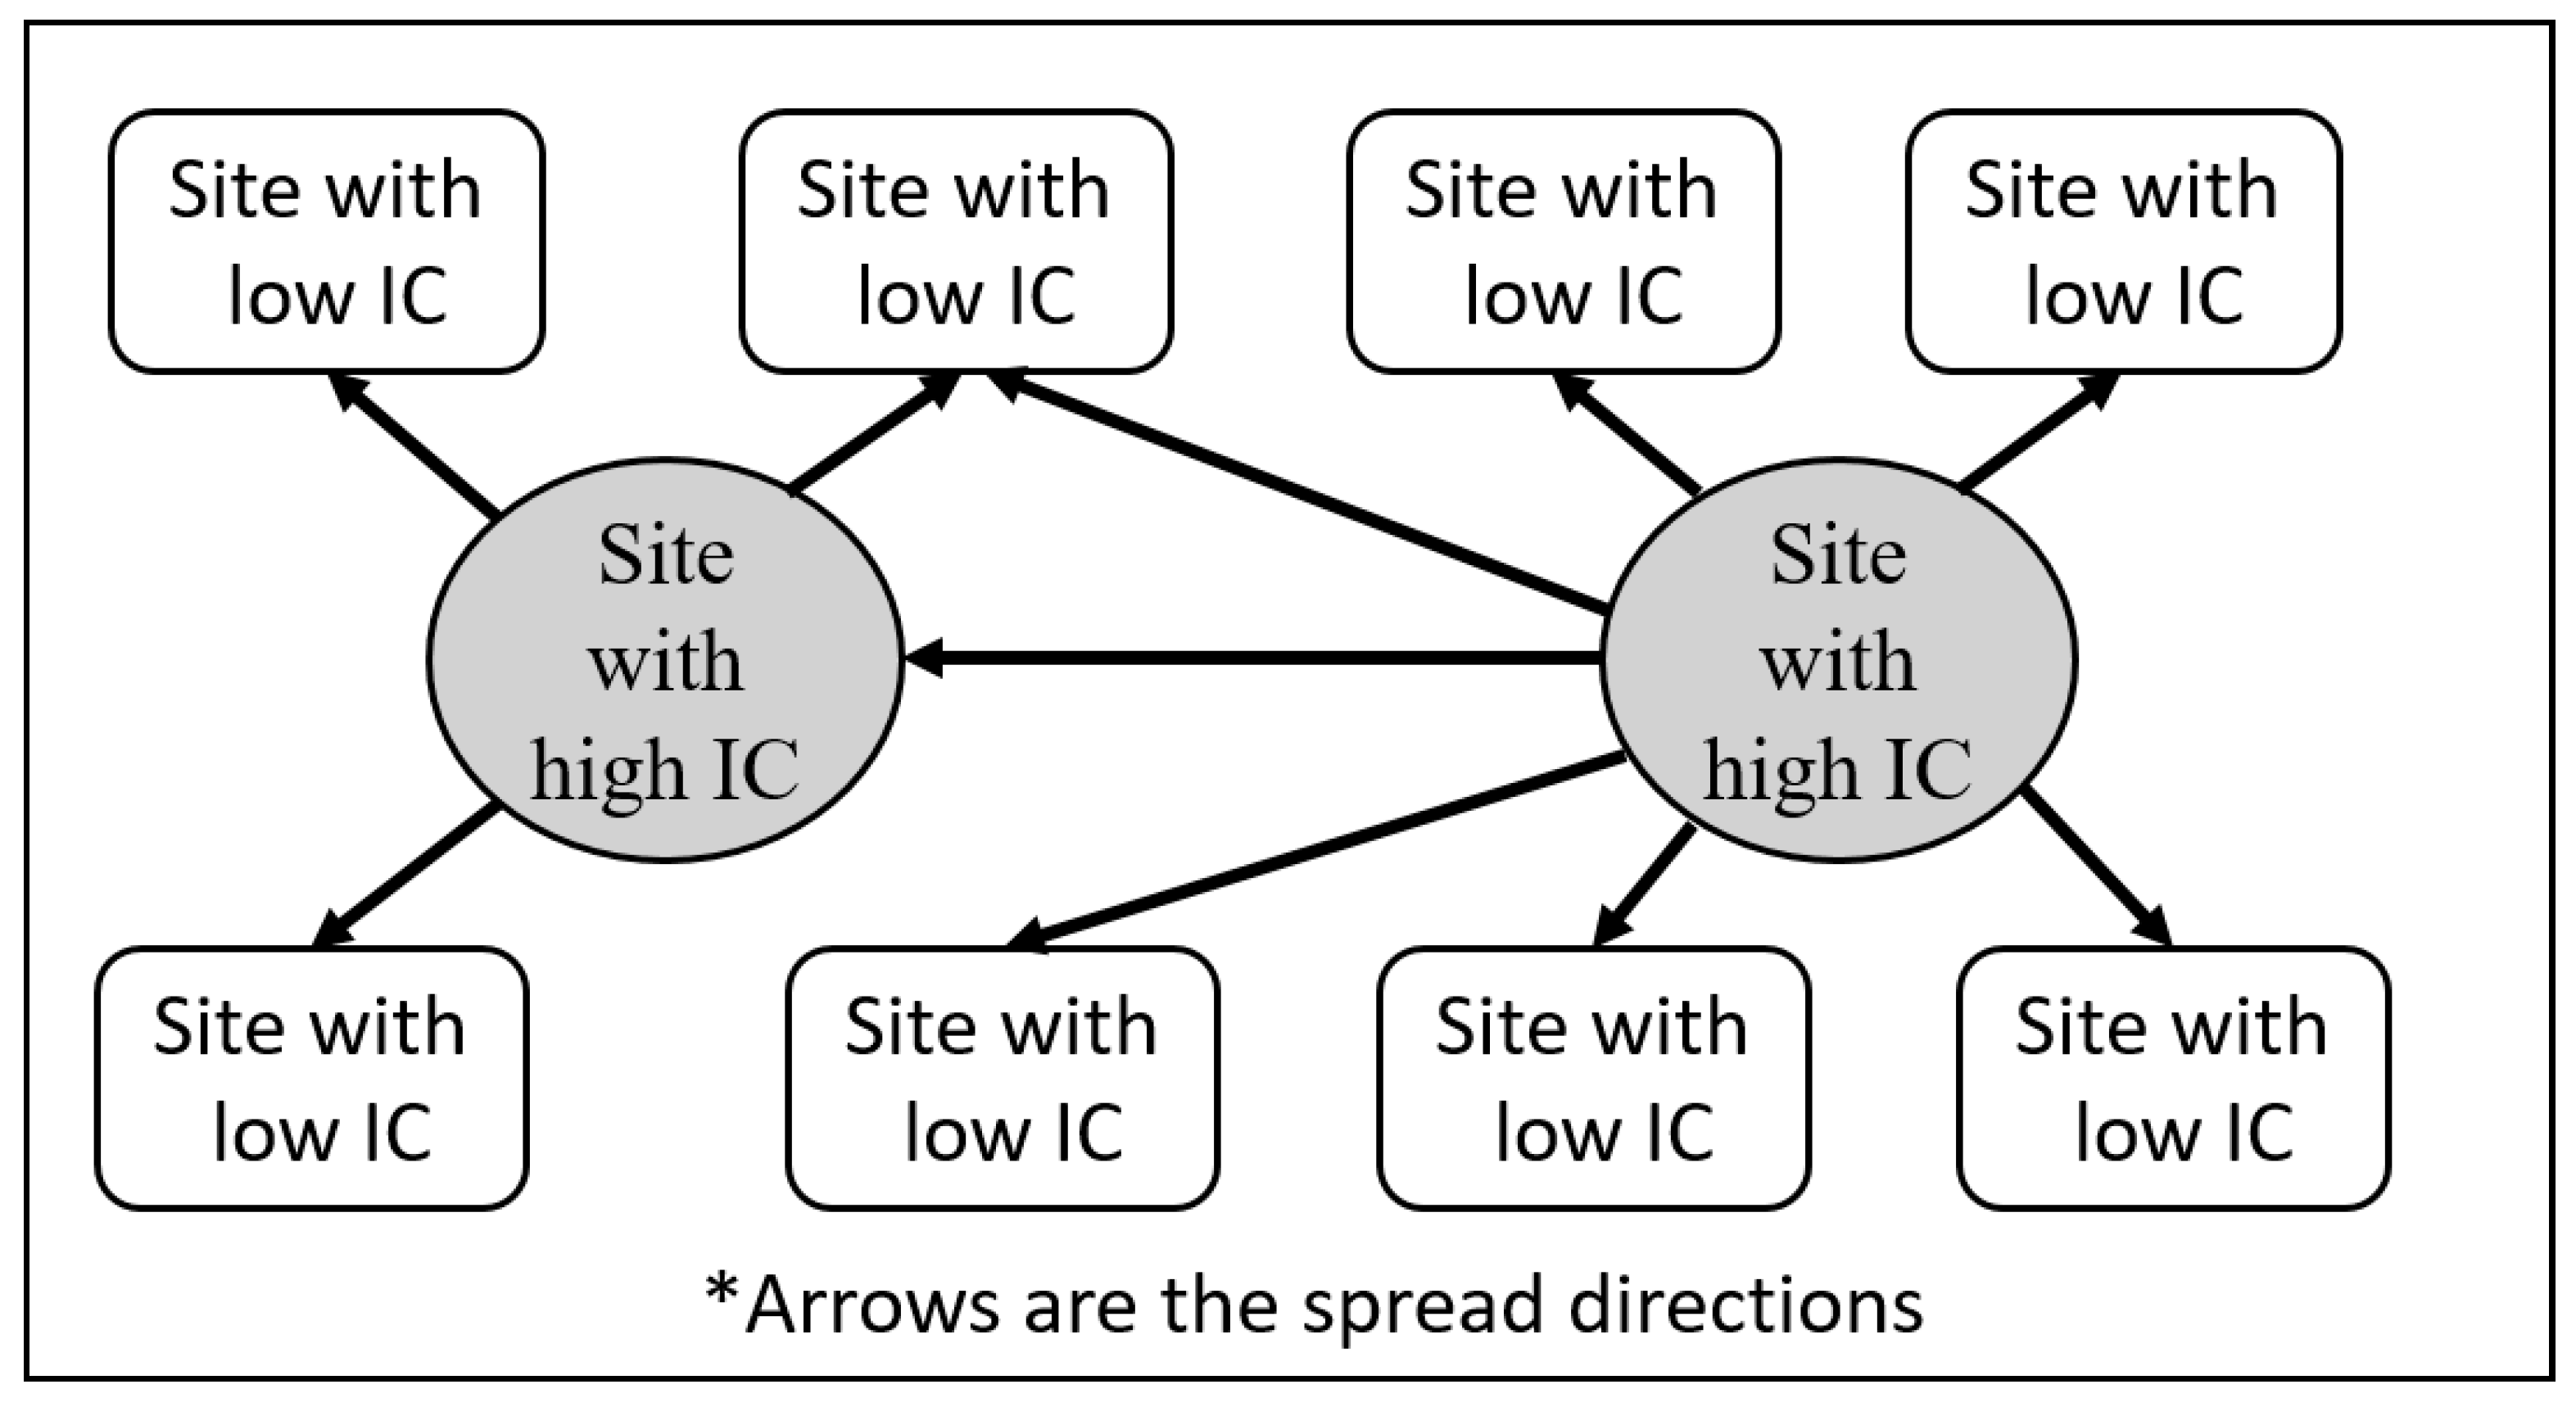
As the outbreak of dengue fever always happens in a highly urbanized city and people can frequently move around in an urbanized city, it is difficult to accurately point out where a patient of dengue fever is infected. Therefore, the public data can only record the date a certain patient was identified, the location of the home of the patient, and some personal information about the patient. Considering this, for quickly suppressing the spread of dengue fever, the authority sprays a heavy amount of chemical insecticides in the neighborhood of the home of a patient as soon as the patient is found.
Since the home of each patient is considered a potential site for spreading dengue fever, but not each of these potential sites has a high IC (shown in
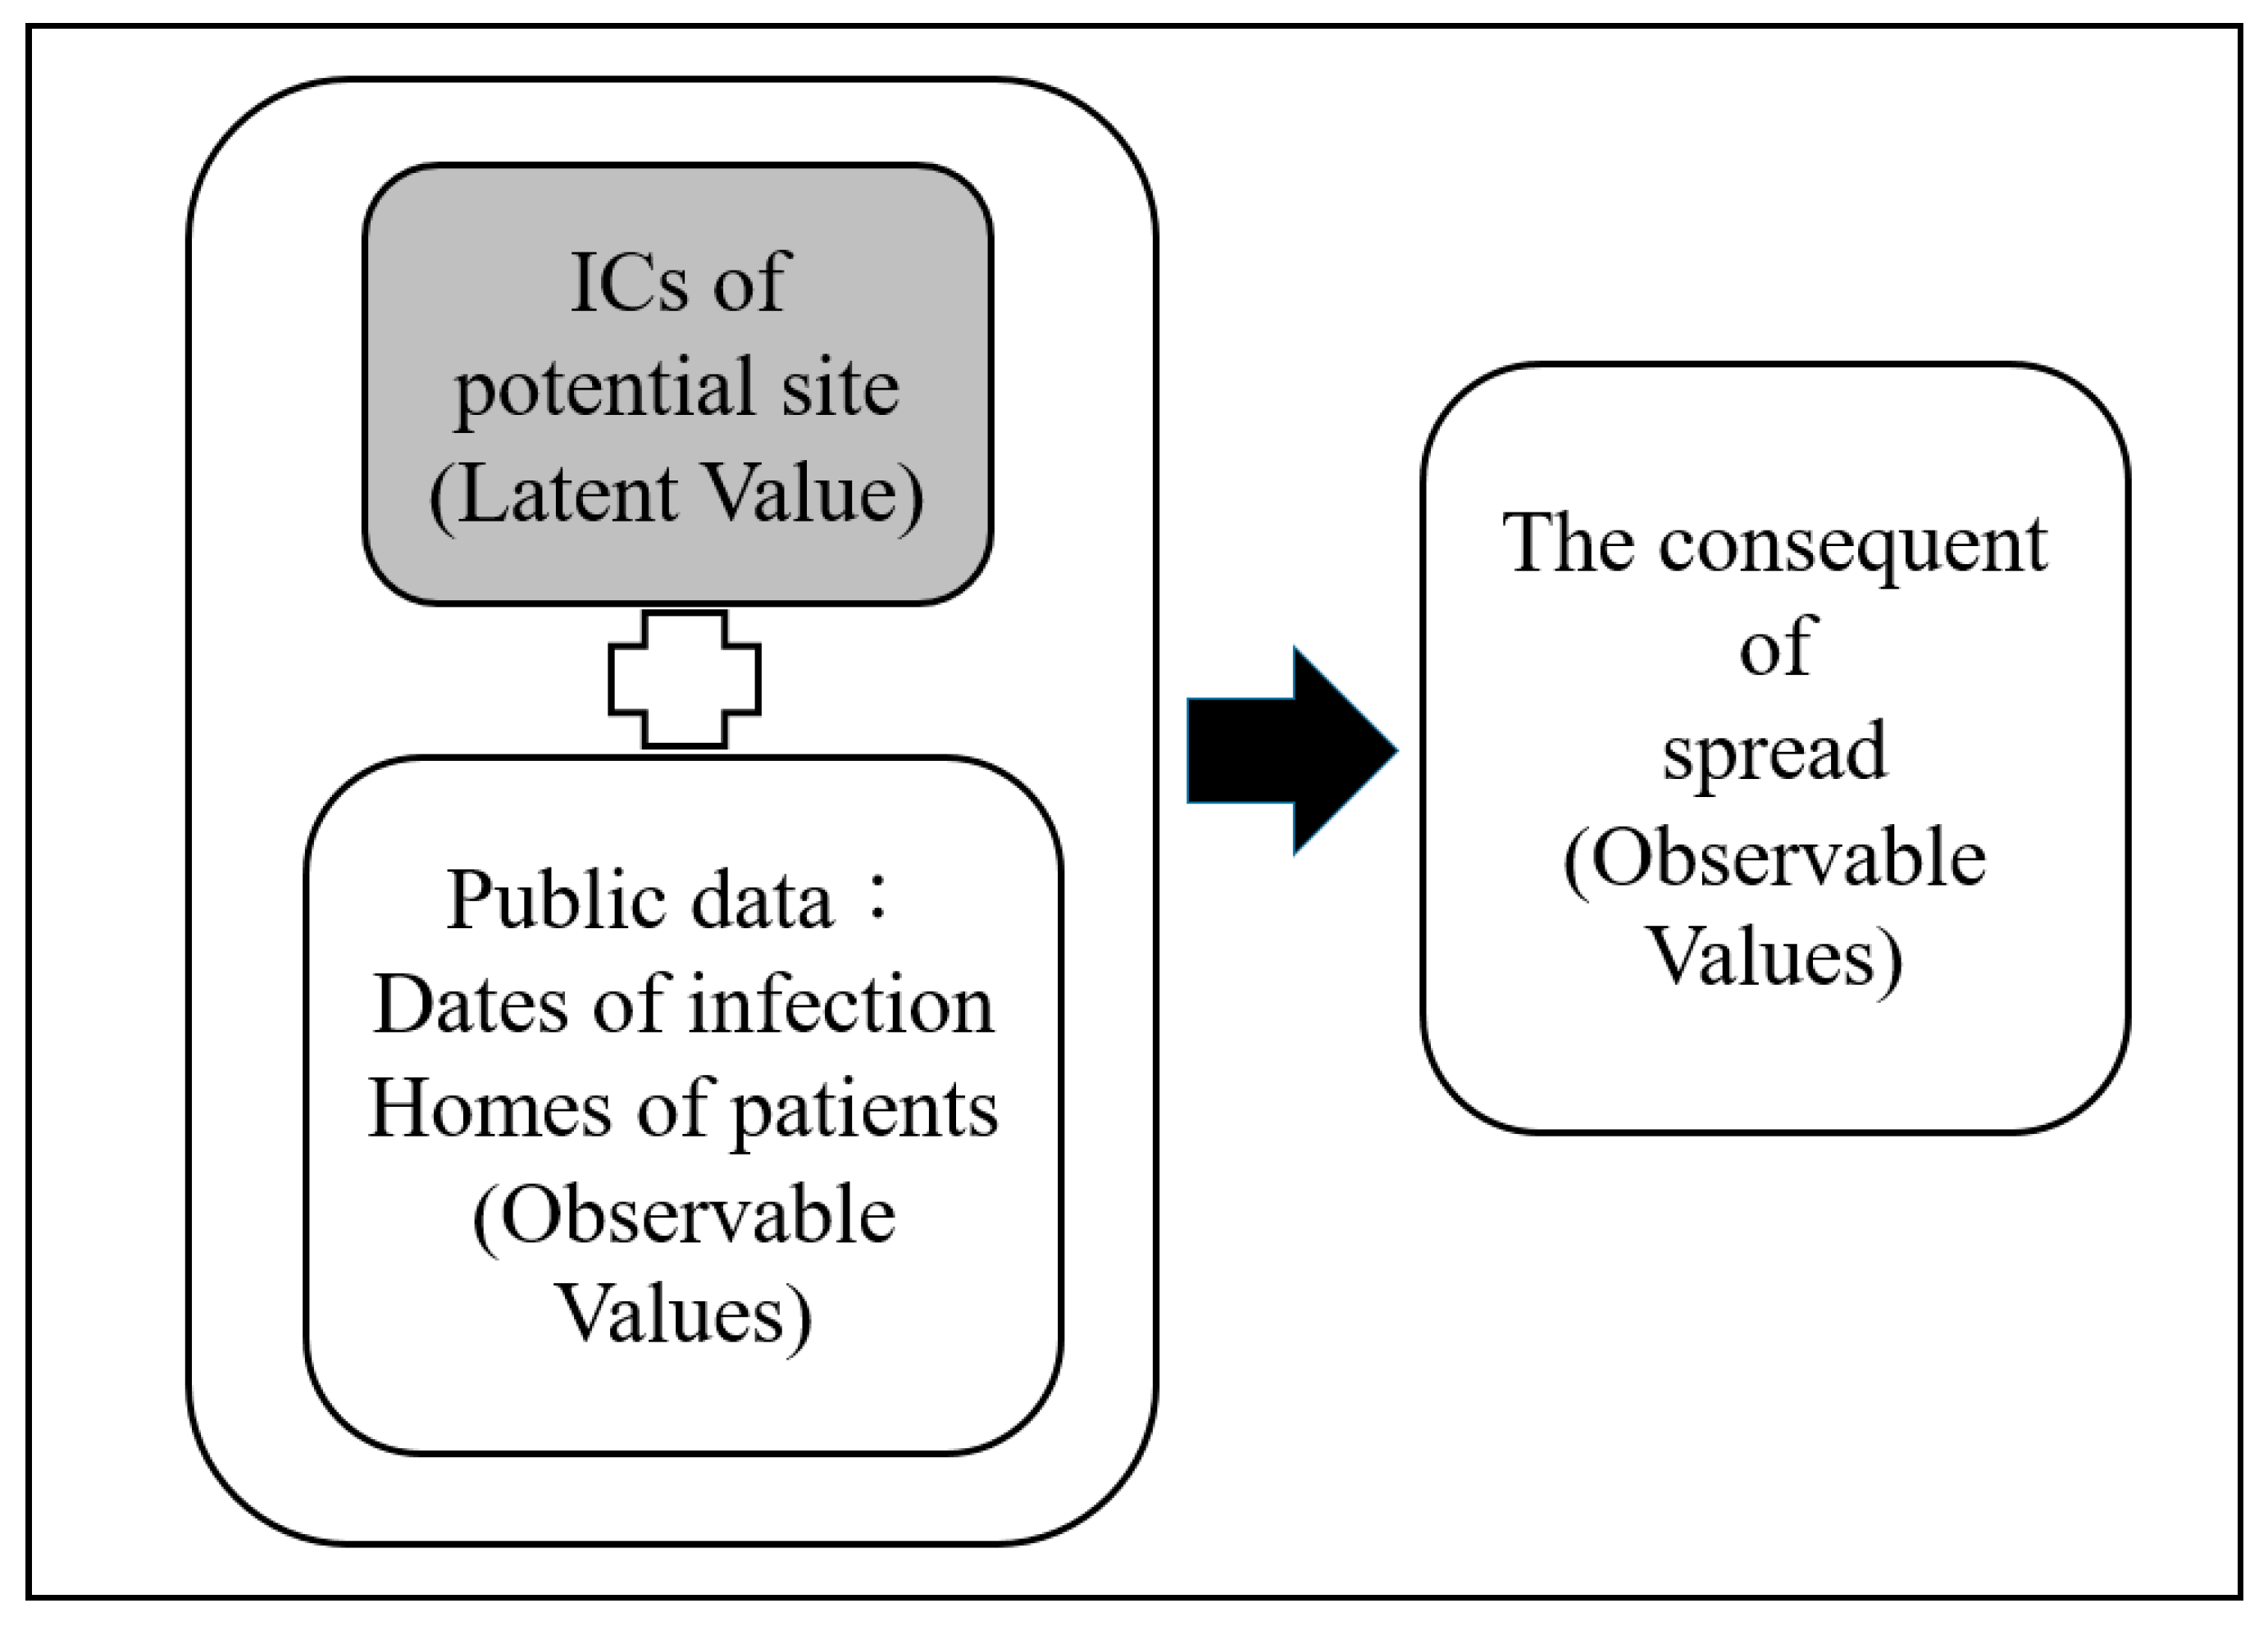
Figure 1), a mathematical model connecting the public data and the ICs of the potential sites is needed. The structure of the model is shown in
Figure 2. Then, the authority can improve the environment of the sites with high ICs through studying the environmental attributes of the sites with low infectious capacities. This could prevent serious damage of an ecosystem when the outbreak of dengue fever happens.
We assumed that the public data contained
locations for the homes of reported patients during
days.
will be less than 365 and
will be more than thousands if the public data used records the outbreak of dengue in a certain year. Therefore,
is usually much bigger than
(
). Let
be an
matrix and
be the entry in the
row and
column of
:
where
denotes the
potential site on day
. It is noted that the home of each patient in the public data is considered as one potential site. Value
is 1 if the data shows that a patient lives in potential site
and was found on day
; otherwise,
is 0. Then, let
be a vector with length
and
represent the outcome of the spread of dengue fever after the
day. Finally, let
and
denote the latent IC of potential site
. Since
represents the IC of site
, we can assume that
. The mathematical model connecting the public data and the ICs can be written as Equation (2).
We note that
can be assigned by the average number of patients for consecutive days after day
. Since
, value
represents how these potential sites found on day
influence the spread of disease in the following few days based on their ICs. In addition, value
, is bounded by
. Let
. Then, Equation (2) can be rewritten as Equation (3), for obtaining the
Problem of Exploring Infectious Capacities (PEIC):
As the set of potential sites contains all homes of patients in the public data and only a small portion of patients are found in day for all , most of are zero and thus is a sparse matrix. Additionally, as highlighted in the above discussion, is usually more than thousands and much bigger than the value . Therefore, PEIC (3) is a large-scale problem and usually more than one solution satisfies PEIC (3). Considering this, we need an algorithm that can efficiently obtain a reasonable solution of PEIC (3) for the values of ICs.
In this paper, we propose a new eco-friendly prevention strategy for dengue fever. The key steps in our new method for searching for the solution of PEIC and the key areas of spreading dengue fever are as follows:
- Step 1.
Preparing data for the PEIC;
- Step 2.
Selecting an algorithm to approach the solution of PEIC;
- Step 3.
Setting up parameters for the chosen algorithm;
- Step 4.
Checking the reliability of the obtained solution;
- Step 5.
Locating the areas with high densities of key high infectious points and key low infectious points.
3. Algorithms for the Solution of PEIC and the Related Eco-Friendly Strategy
Let the sites with ICs bigger than 1 be the
high infectious points (HIPs) and the remaining sites be the
low infectious points (LIPs), since, in PEIC (3), a site
can lead to an increase in the number of infections due to
and an decrease as
. Then, we can define the
key HIPs (KHIPs) as being the HIPs of a year and each of them can reach at least an HIP of the next year within a certain distance
(we use 150 m in our case study in
Section 4). The
key LIPs (KLIPs) are the LIPs of a year and each of them cannot reach any HIP of the next year within
.
It is worth noting that the neighborhood of a KHIP is a highly contagious area with a high possibility as it contains HIPs in two consecutive years. However, the neighborhood of a KLIP can be a low contagious area as it does not contain HIPs in two consecutive years. Through understanding the differences in the environmental conditions of KHIPs and those of KLIPs, we can change an HIP to an LIP to prevent the spread of dengue fever.
We use our new eco-friendly prevention strategy to search for the solution of PEIC (3) and the ICs of each potential site, and locate the areas with high densities of KHIPs and KLIPs. The following is a detailed description of the five steps included in our new method.
- Step 1.
Preparing data for the PEIC
First, several values are selected from the interesting public data for providing matrix and vector of PEIC (3). For matrix , we need to know the length of the recorded period in the public data in a certain year for the size of its rows, the number of all potential sites during the period for the size of its columns, and the infectious condition of each potential site on each day during the period for deciding the value (0 or 1) of each entry. For vector , we need to know the number of infectious people for the outcome of the spread of dengue fever after a certain day.
After obtaining matrix and vector , we can move to selecting a proper algorithm for solving the PEIC (3).
- Step 2.
Selecting an algorithm to approach the solution of PEIC
Let
and
be two Hilbert spaces.
and
are two nonempty closed convex subsets of
and
, respectively. Let
be a bounded linear mapping procedure. Then, the SFP, a modeling inverse problem, can be expressed as Equation (4) below:
Operator in PEIC (3) is a linear bounded mapping procedure. It can be noted that sets and are nonempty closed convex subsets of and , respectively, and (3) is the same as finding an , such that , . Therefore, PEIC (3) can be considered a special case of SFP.
The SFP was raised from phase retrieval and image reconstruction, and was first introduced by Censor and Elfving [
24] in 1994. Many iterative algorithms have been designed to approach the solution of SFP. However, the following CQ algorithm presented by Byrne [
25,
26] is the most famous one:
Theorem 1. (Byrne’s CQ algorithm, cf. [25,26]) Assume that the SFP (4) has a solution. The iterative process starts from any.
Then, sequencederived using Equation (5) converges weakly to a solution of SFP (4).where;is the adjoint of;is the identity mapping of; andandare the metric projections ontoand, respectively. It is worth noting that the solution of SFP (4) is also a fixed point of operator (6).
Then, Xu [
27] focused on the fixed point algorithms and adjusted operator (6) to develop the following regularization algorithm for SFP:
Theorem 2. (Xu’s regularization method, cf. [27]) Assume that the SFP (4) has a solution. Then, sequencegenerated by Equation (7) converges strongly to the minimum norm solution of SFP (4).whereandsatisfy the following four conditions: - (i)
for all large enough ;
- (ii)
;
- (iii)
;
- (iv)
Later, Yao et al. [
28,
29] extended the regularization method to approach the solution of SFP (4). Some works [
30,
31,
32,
33,
34,
35,
36] also developed generalized fixed point algorithms which can be applied to approach the solution of SFP. In particular, the iterative scheme, expressed as the following Equation (8), proposed by Hong and Huang [
32], has shown that it can efficiently approach the solution of SFP:
Theorem 3. (cf. [32]) Assume that the SFP (4) has a solution. Letbe the solution set of SFP (4) andbe the metric projection onto. Starting from any point, the sequencegenerated by Equation (8) converges strongly to a point.whereis a chosen point in,and parametersandare sequences in intervalsatisfying the following conditions: Through replacing and with , and , respectively, we can obtain the following corollary to approach a solution of PEIC (3):
Corollary 1. Letbe the solution set of PEIC (3) andbe the metric projection onto. Starting from any point, the sequencegenerated by Equation (11) converges strongly to a point.whereis a chosen point in,and parametersandare sequences in the intervalsatisfying the following conditions: Then, we know that we can approach a solution of PEIC (3) using the above Corollary 1.
- Step 3.
Setting up parameters for the chosen algorithm
We assigned values to , , and , which satisfy the requirements of Corollary 1. Then, is set to the original point in the iterative scheme (11) in order to obtain a solution of PEIC (3) that is closest to the original point. It is reasonable to consider the point closest to the original point as the value of ICs of potential sites since the ICs should be zero at the beginning and then reach a point closest to the beginning point at the outbreak of dengue fever. Therefore, we chose an efficient iterative scheme (8) to explore the infectious capacities of potential sites. The iteration starts from any arbitrary and stops as is less than a small enough value .
It is worth noting that the obtained solution is independent of parameters , , and since always converges strongly to the projection point of in the solution set of PEIC (3).
- Step 4.
Checking the reliability of the obtained solution
After obtaining a proper solution of PEIC (3) using the above steps, it is important to evaluate the reliability of the obtained solution. According to a previous study, the environment of an area is the main factor in the spread of dengue fever. As the change of environment in a city should not differ much between two consecutive years, we can study the relationships between ICs of an area in two consecutive years based on the environment. If they are highly consistent, the ICs obtained by our proposed method are reliable.
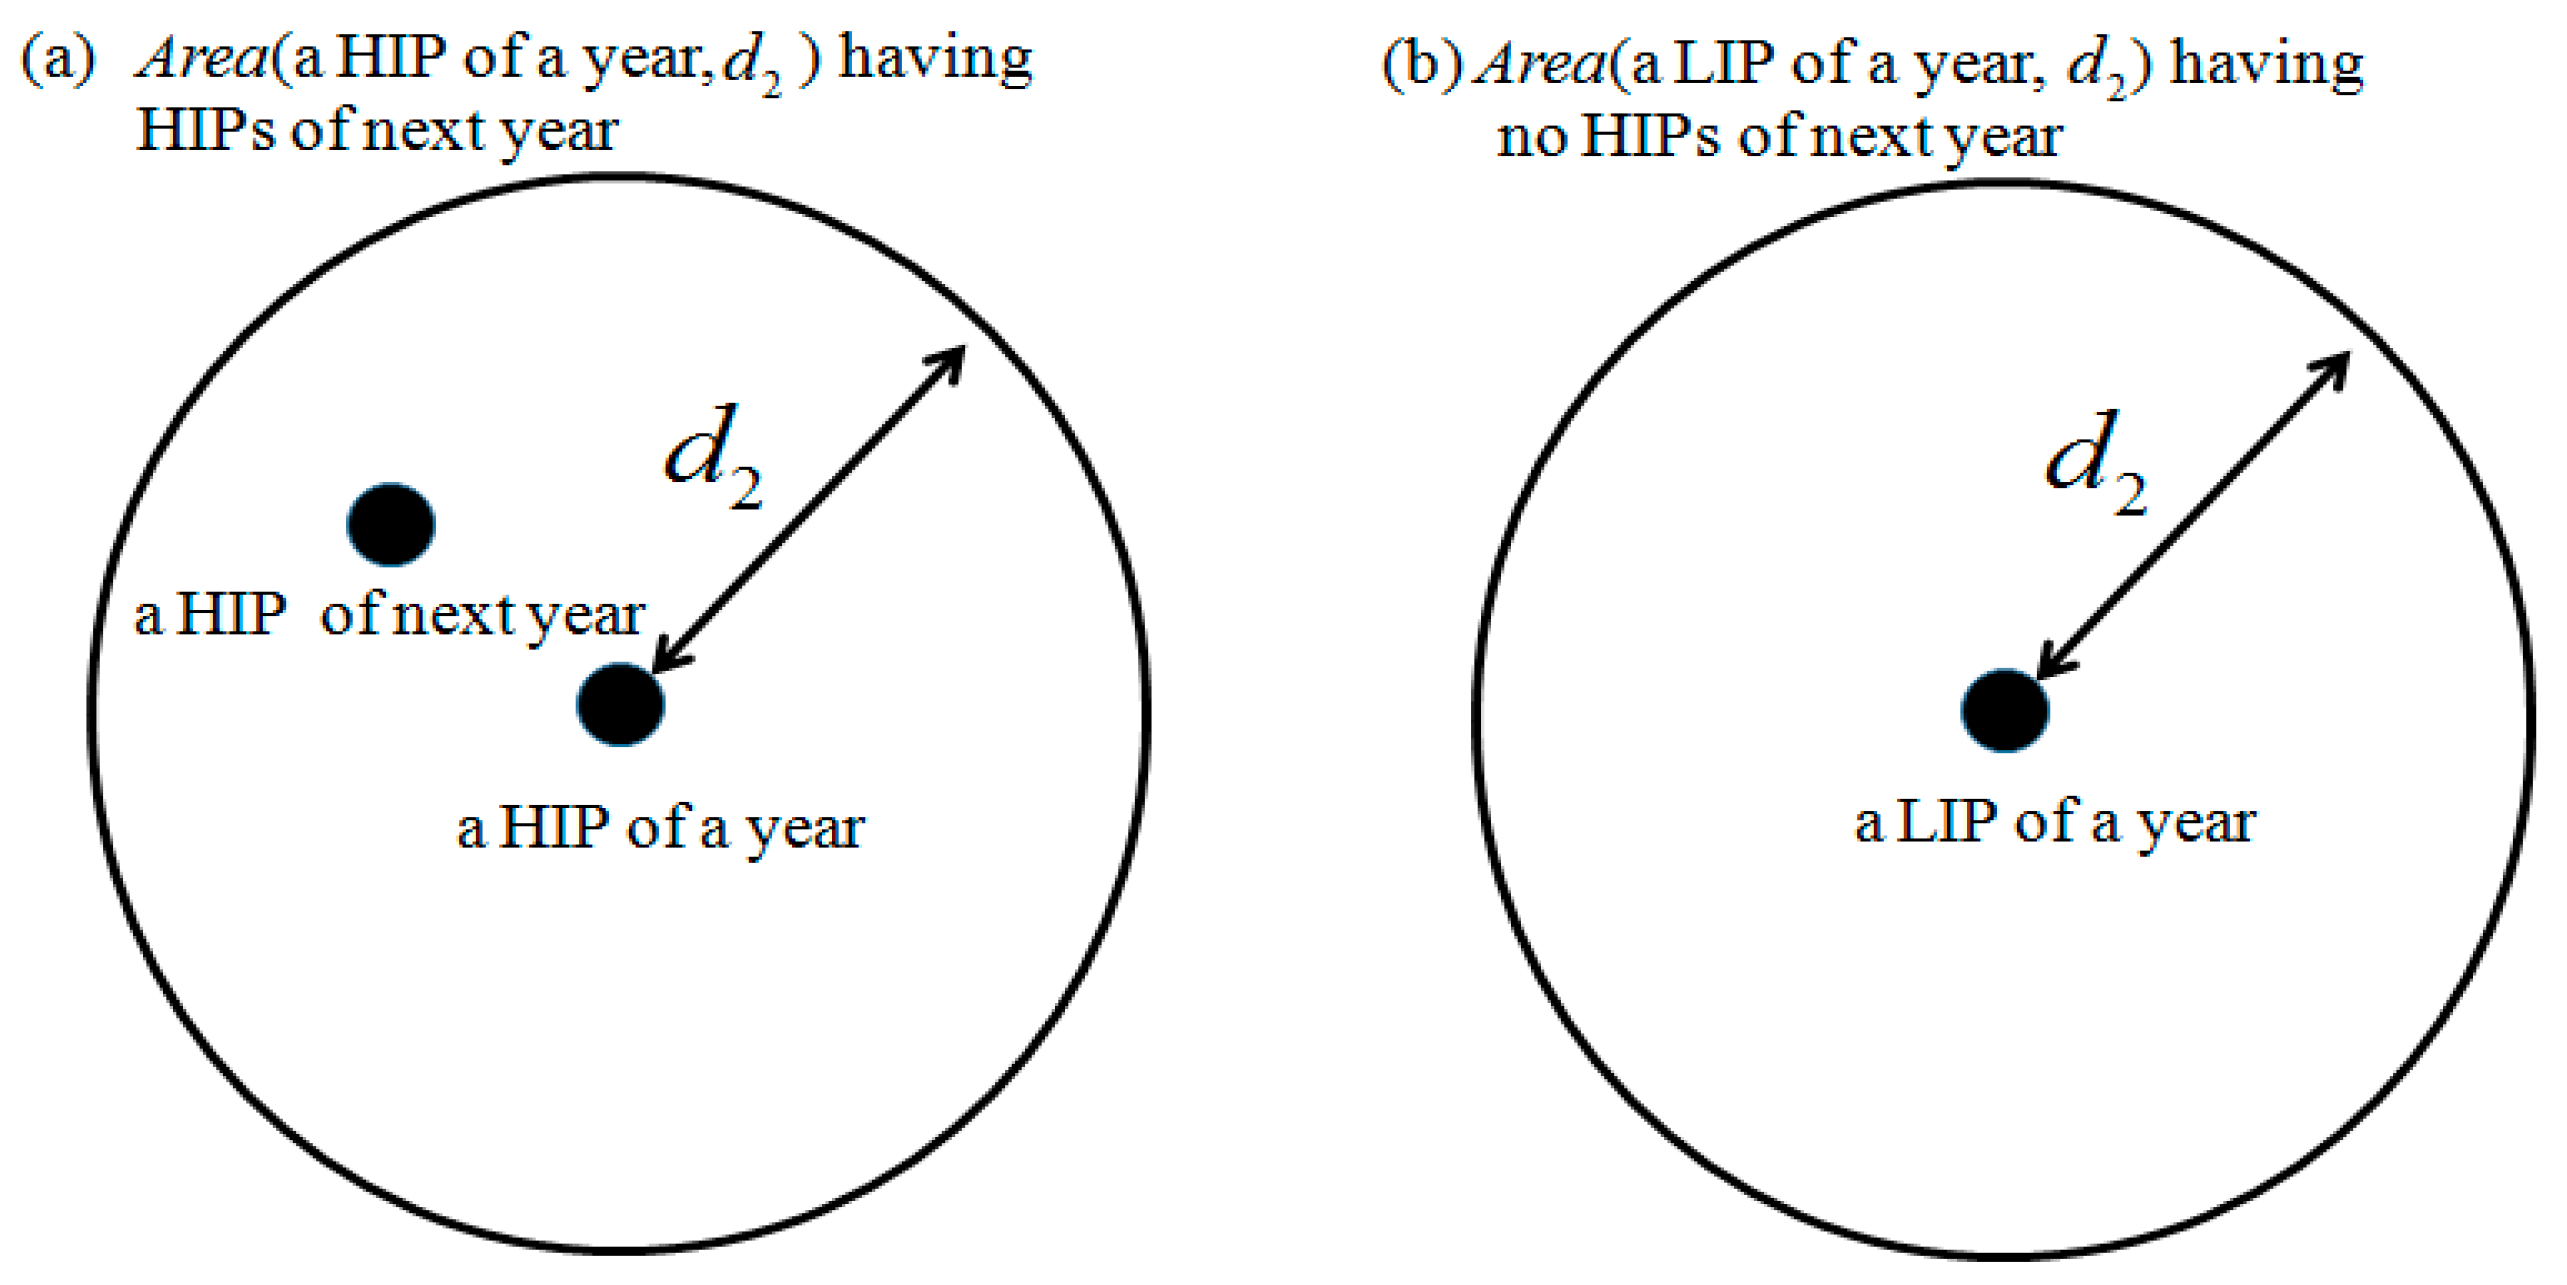
Then, the recurrence rate and the retaining rate are defined to evaluate the reliability in this subsection. Let
be the collection of circle areas whose centers are the points of set
and the radius is
. The schematic diagrams of
having HIPs of
and
having no HIPs of
are shown as
Figure 3a,b, respectively.
Now, we can define the recurrence rate of
, expressed as Equation (14), and the retaining rate of
, expressed as Equation (15), for studying the similarity of two years. The concept of the schematic diagram is
and,
The recurrence rate means that the neighborhood of an HIP can find an HIP again in the next year and the retaining rate means that the neighborhood of an LIP cannot find an HIP in the next year. If both rates are high, then the ICs in an area for two consecutive years are consistent and the solution obtained using steps 1 to 3 is reliable.
- Step 5.
Locating the areas with high densities of KHIPs and KLIPs
After pointing out the HIPs and LIPs for two consecutive years based on their ICs, we can locate the KHIPs and KLIPs. Then, we can group the KHIPs by putting two KHIPs into the same group if the distance between them is less than a certain distance . The KLIPs are also grouped using the same method. The locations of these groups of KHIPs and KLIPs are the areas with high densities of KHIPS or KLIPs.
4. Numerical Results—Application to the Public Data of Kaohsiung City for 2014 and 2015
The five steps described in the previous section were applied to analyze the public data from Taiwan Centers for Disease Control for Kaohsiung in 2014 and 2015, respectively, as Kaohsiung faced an outbreak of dengue fever in both years. The data contains the date of infection and the location (longitudes and latitudes) of the home of the patient. The public data is available at the following URL:
https://data.cdc.gov.tw/en/dataset/dengue-daily-determined-cases-1998. The latitude and longitude of the data are accurate to five decimal places (around 1.1 m).
Let
be the average of the numbers of daily reported patients on the three consecutive days after day
. We assigned
,
, and
, and
is equal to the original point. Then, the iteration starts from an
whose each element is 1 and stops as
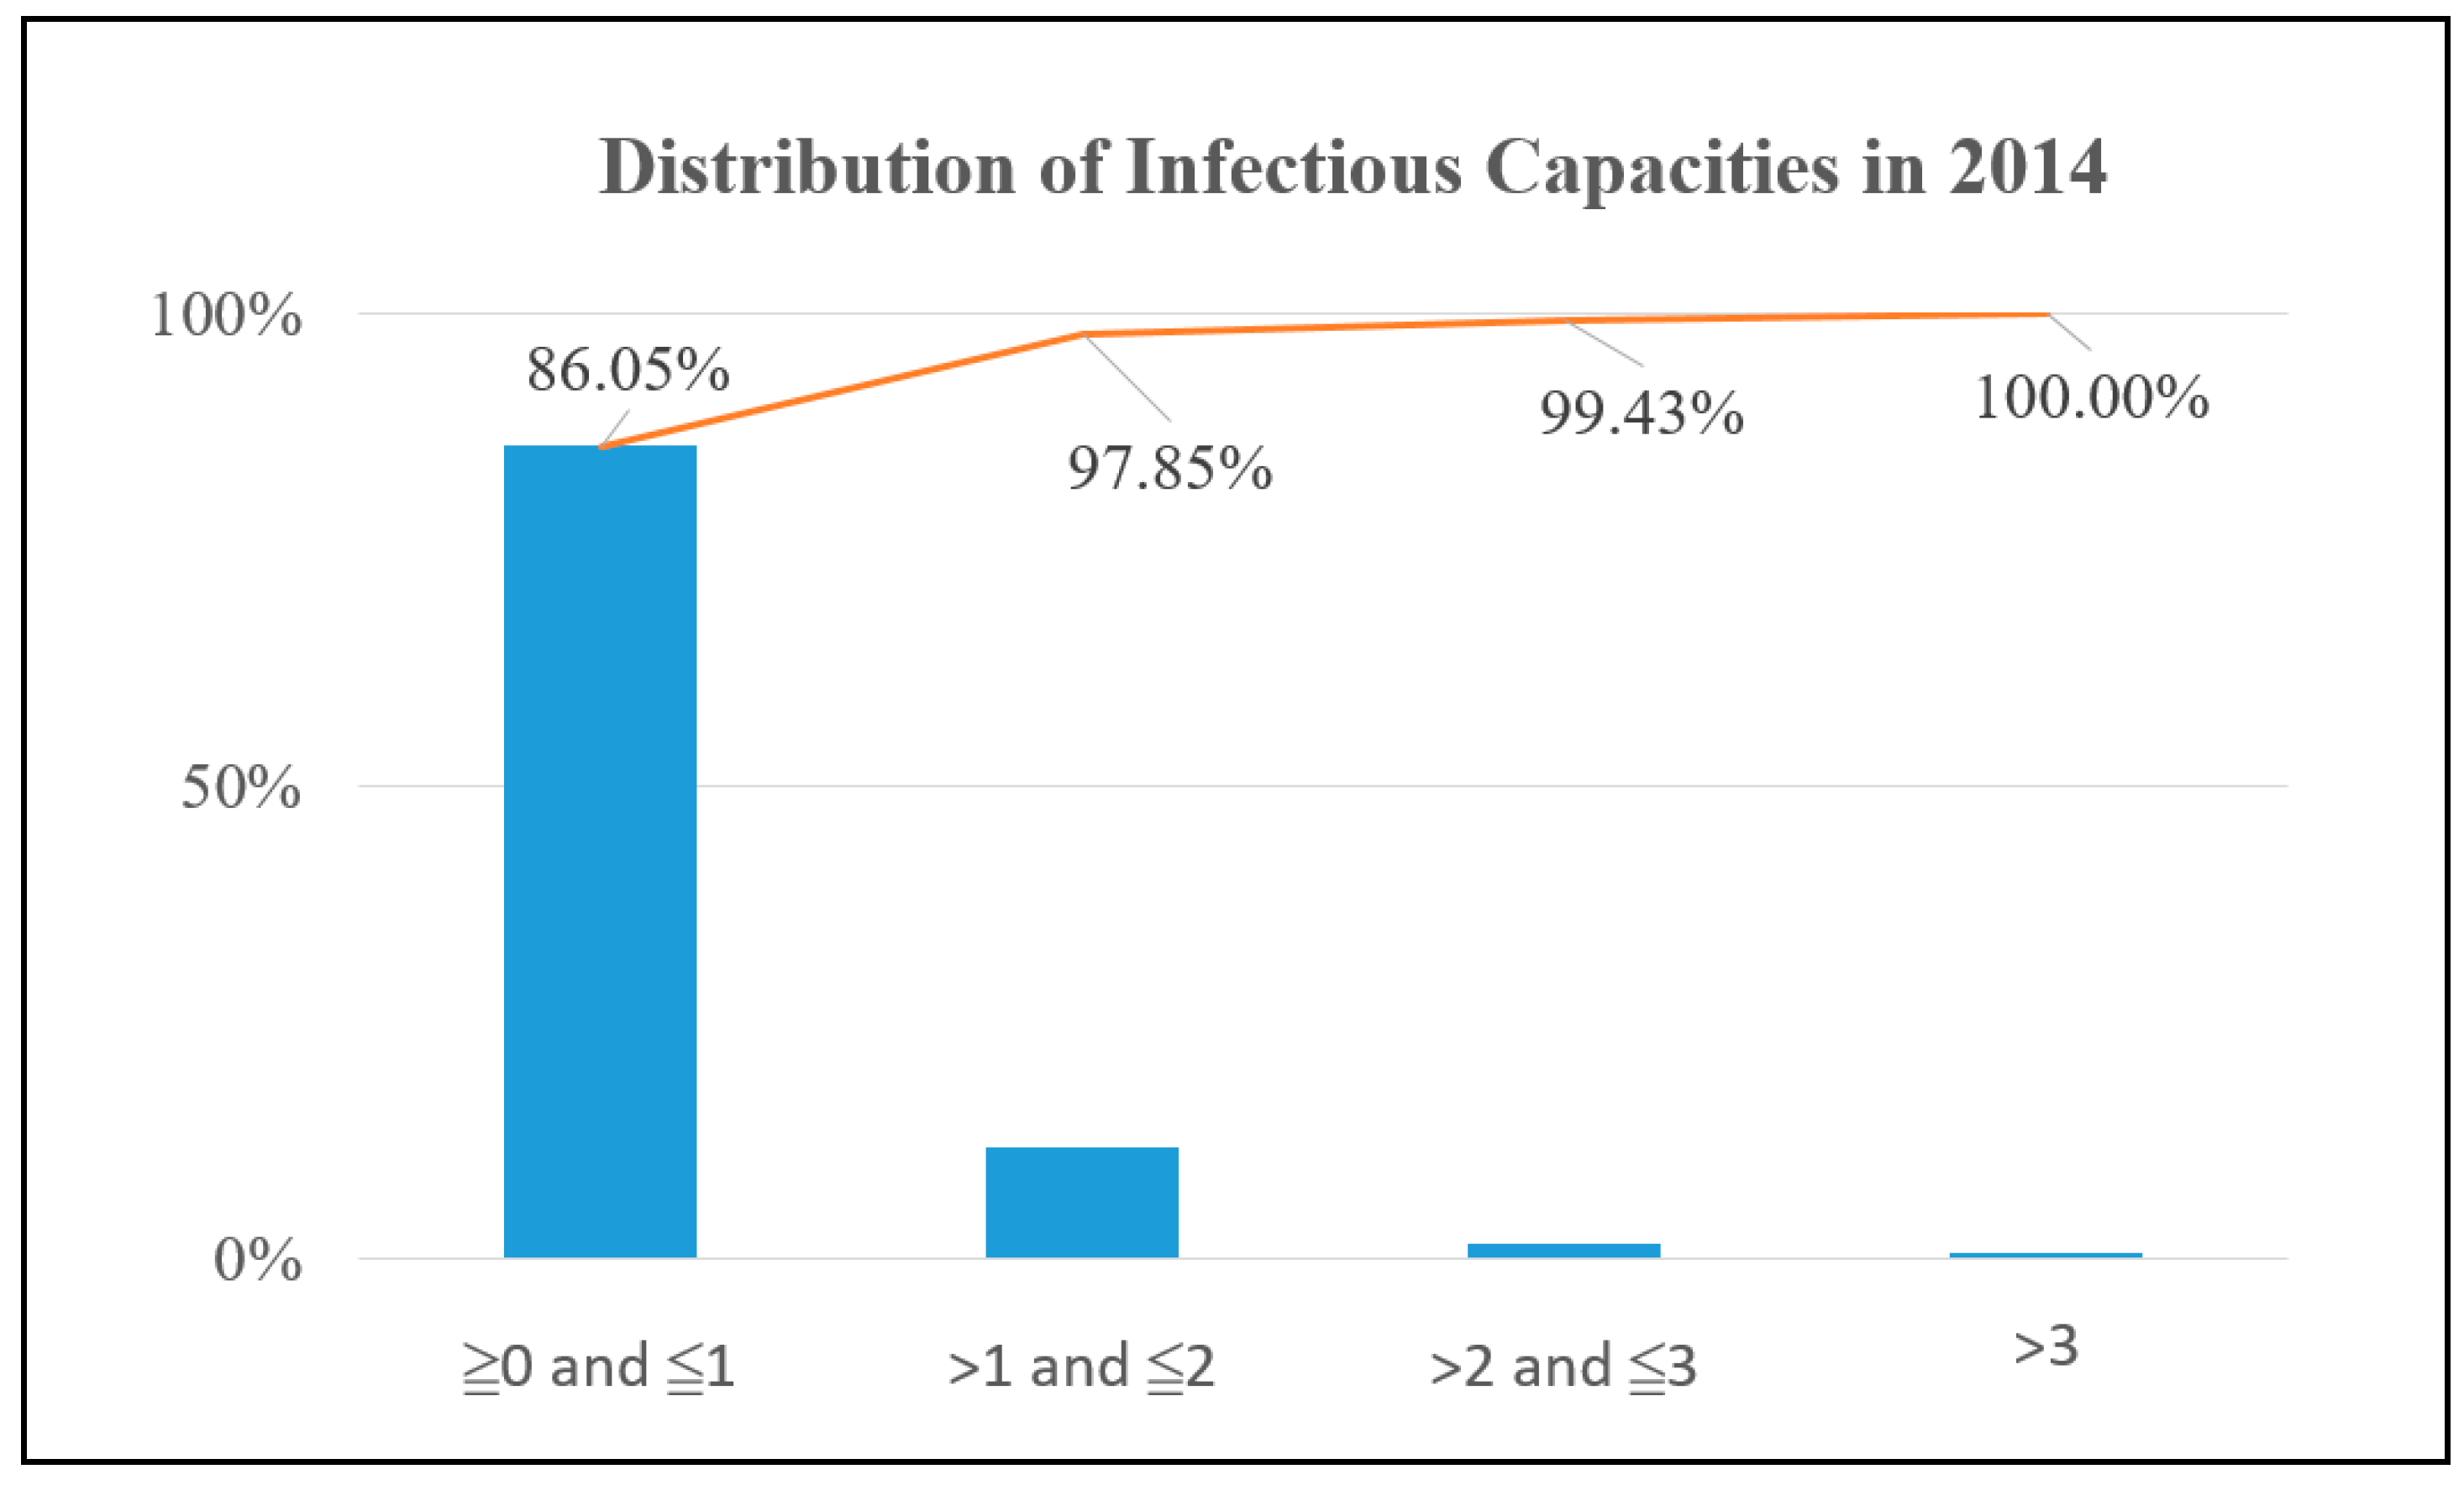
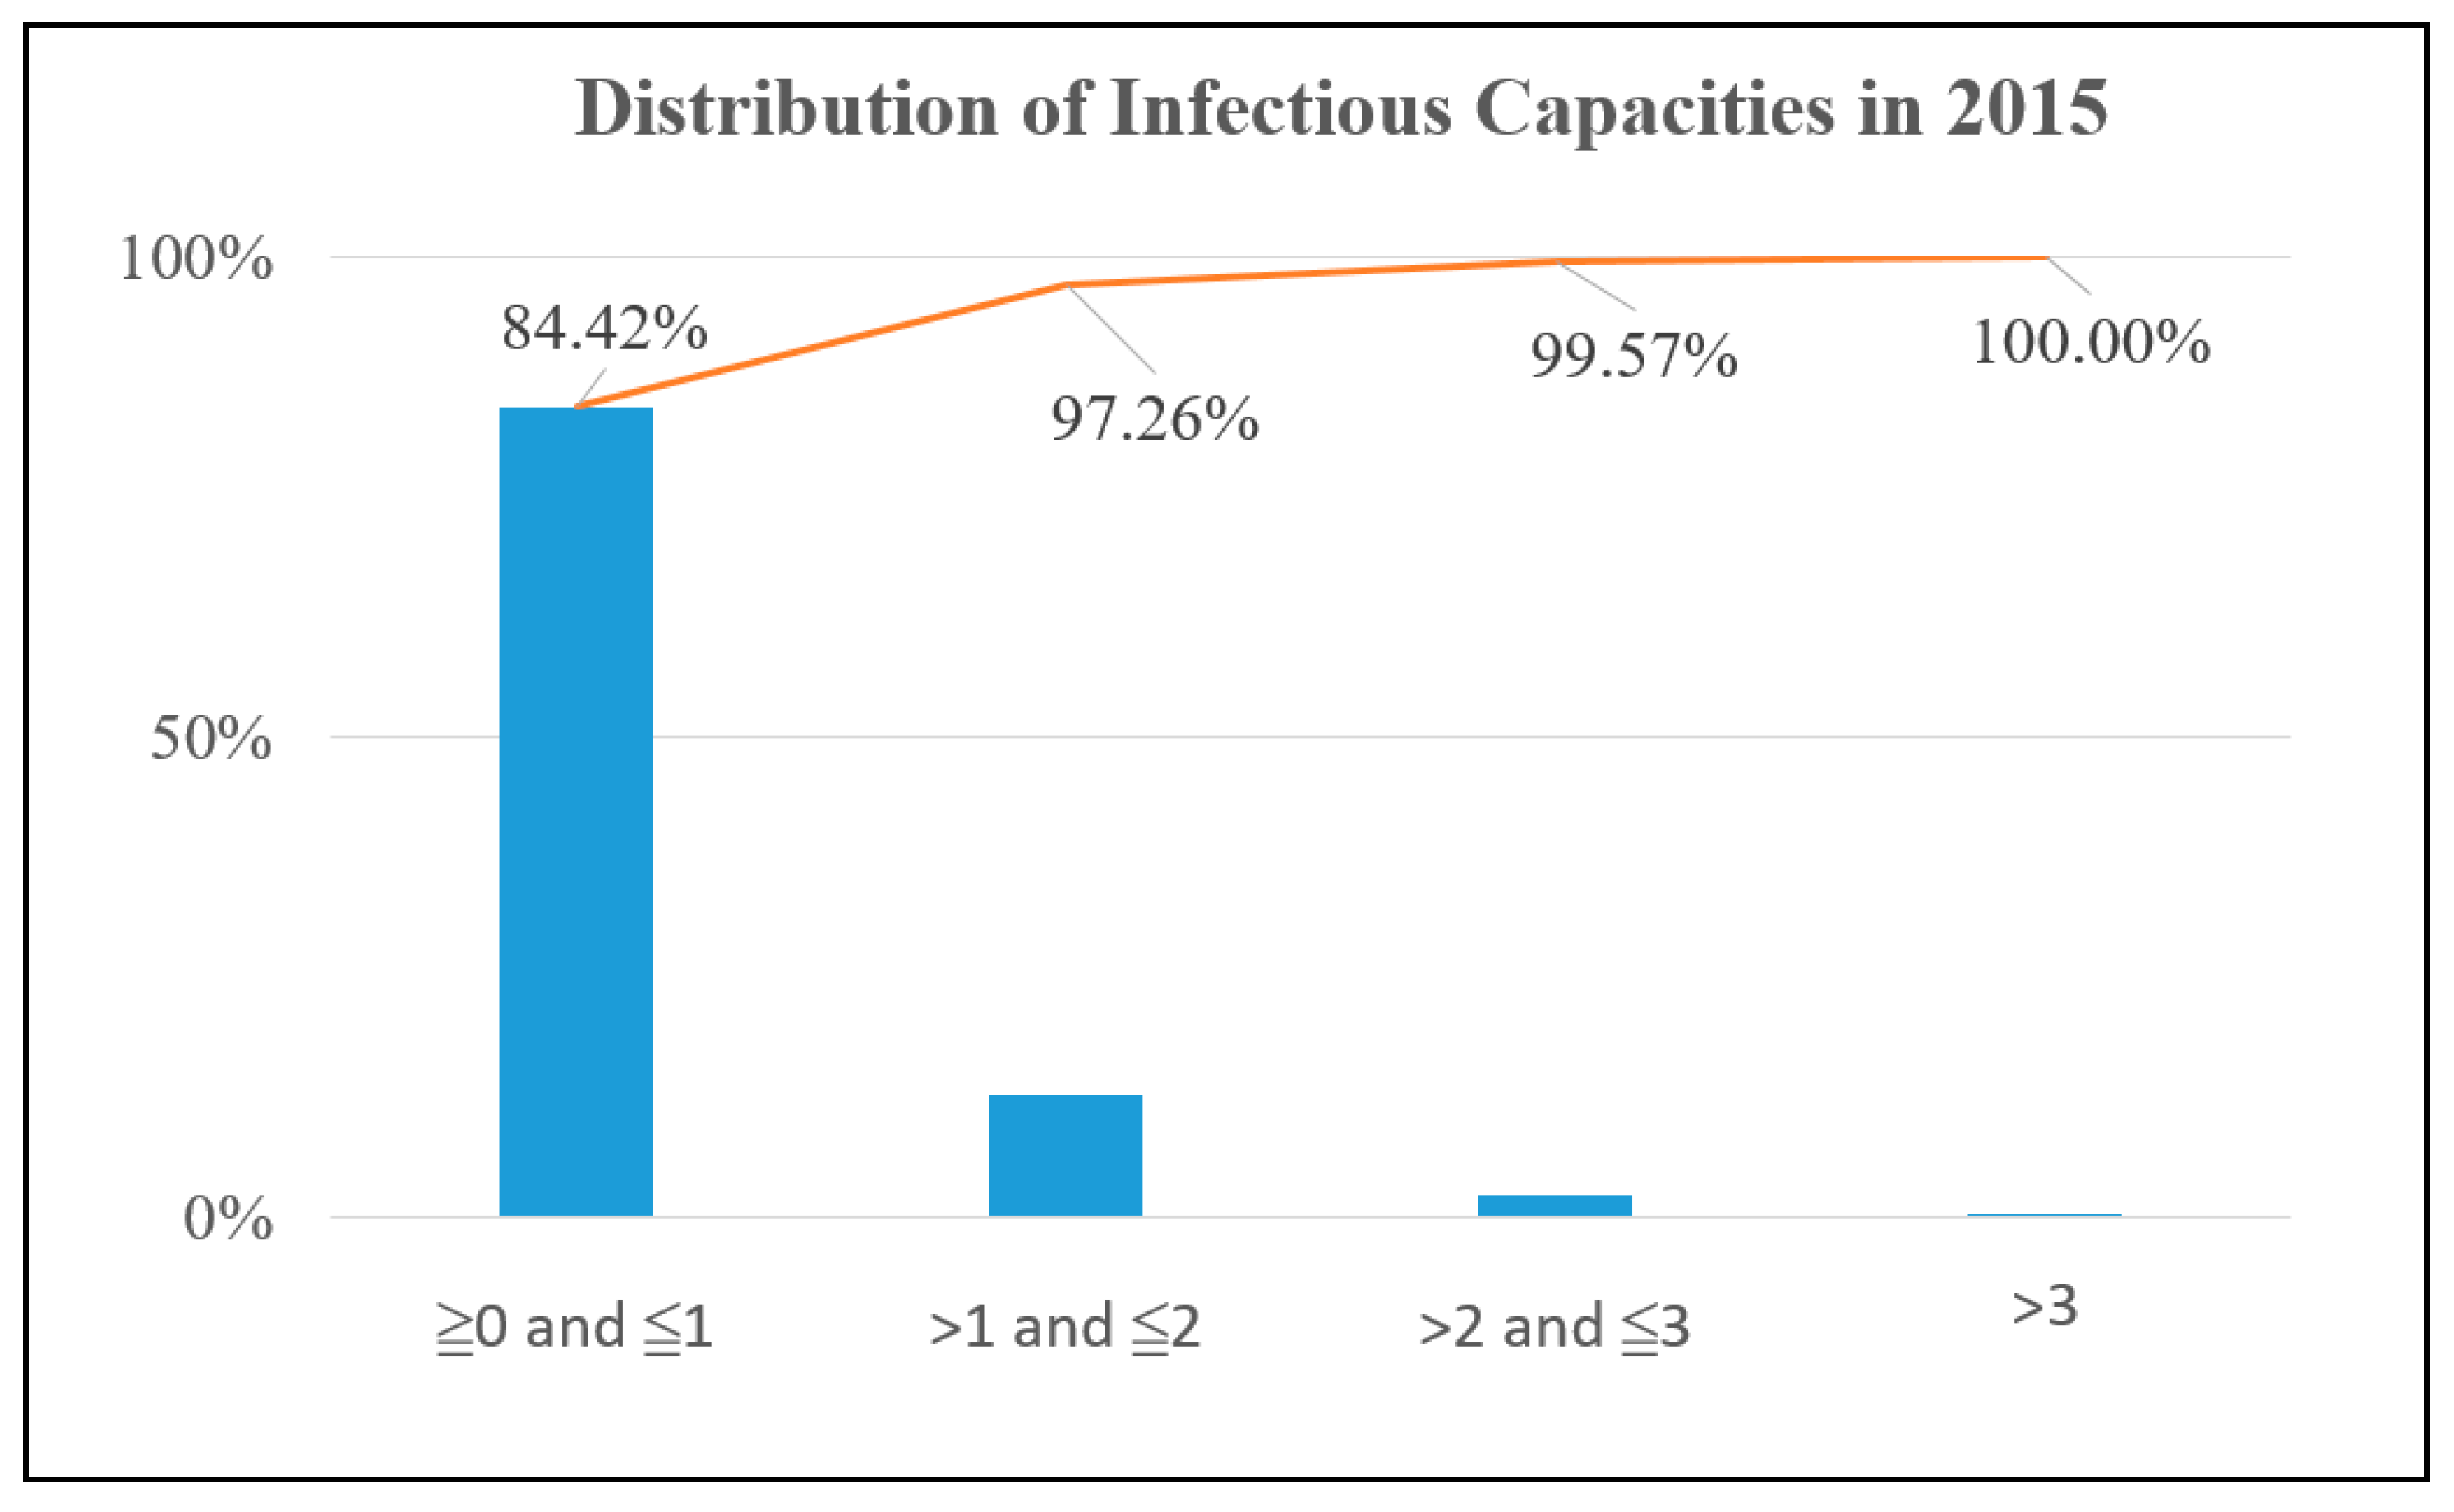
. There are 5262 potential sites for 2014 and 6523 for 2015. We noted that the
x-axis of
Figure 4 and
Figure 5 represents these different ranges of ICs and the
y-axis is the proportion of these sites with ICs being in a certain range for all potential sites. The potential sites are distributed almost anywhere in downtown Kaohsiung for both years. However, only 13.95% of the potential sites have an IC above 1 in 2014, as shown in
Figure 4, while the value is 15.58% in 2015, as shown in
Figure 5. Therefore, if the result is accurate, then the authority only needs to focus on improving the environment of around 15% potential sites.
After obtaining the ICs for both 2014 and 2015, we moved to step 3 for evaluating the reliability of the obtained ICs. The result of recurrence rates for the HIPs in year 2014, shown in
Table 1, reveals that the neighborhood of an HIP is still an area with HIP in the coming year, with a high probability. The recurrent rate reaches around 70% as the radius is only 150 m.
We also looked at the retaining rates for LIPs. As seen in
Table 2, most of the neighborhoods of the LIPs of 2014 do not have an HIP in the coming year. The retaining rate reaches 85% as the radius is 50 m. Although the radius is 150 m, the retaining rate is still around 55%.
According to the above discussion, the value of ICs from our proposed model can indicate the ability of dengue transmission in a potential site. Therefore, as the HIPs are only a small portion of all the potential sites, the authority can focus on how to improve the environment of HIPs through studying the environment of LIPs. Therefore, we searched for the dense areas of HIPs and LIPs in order to study the properties of the environments of these areas.
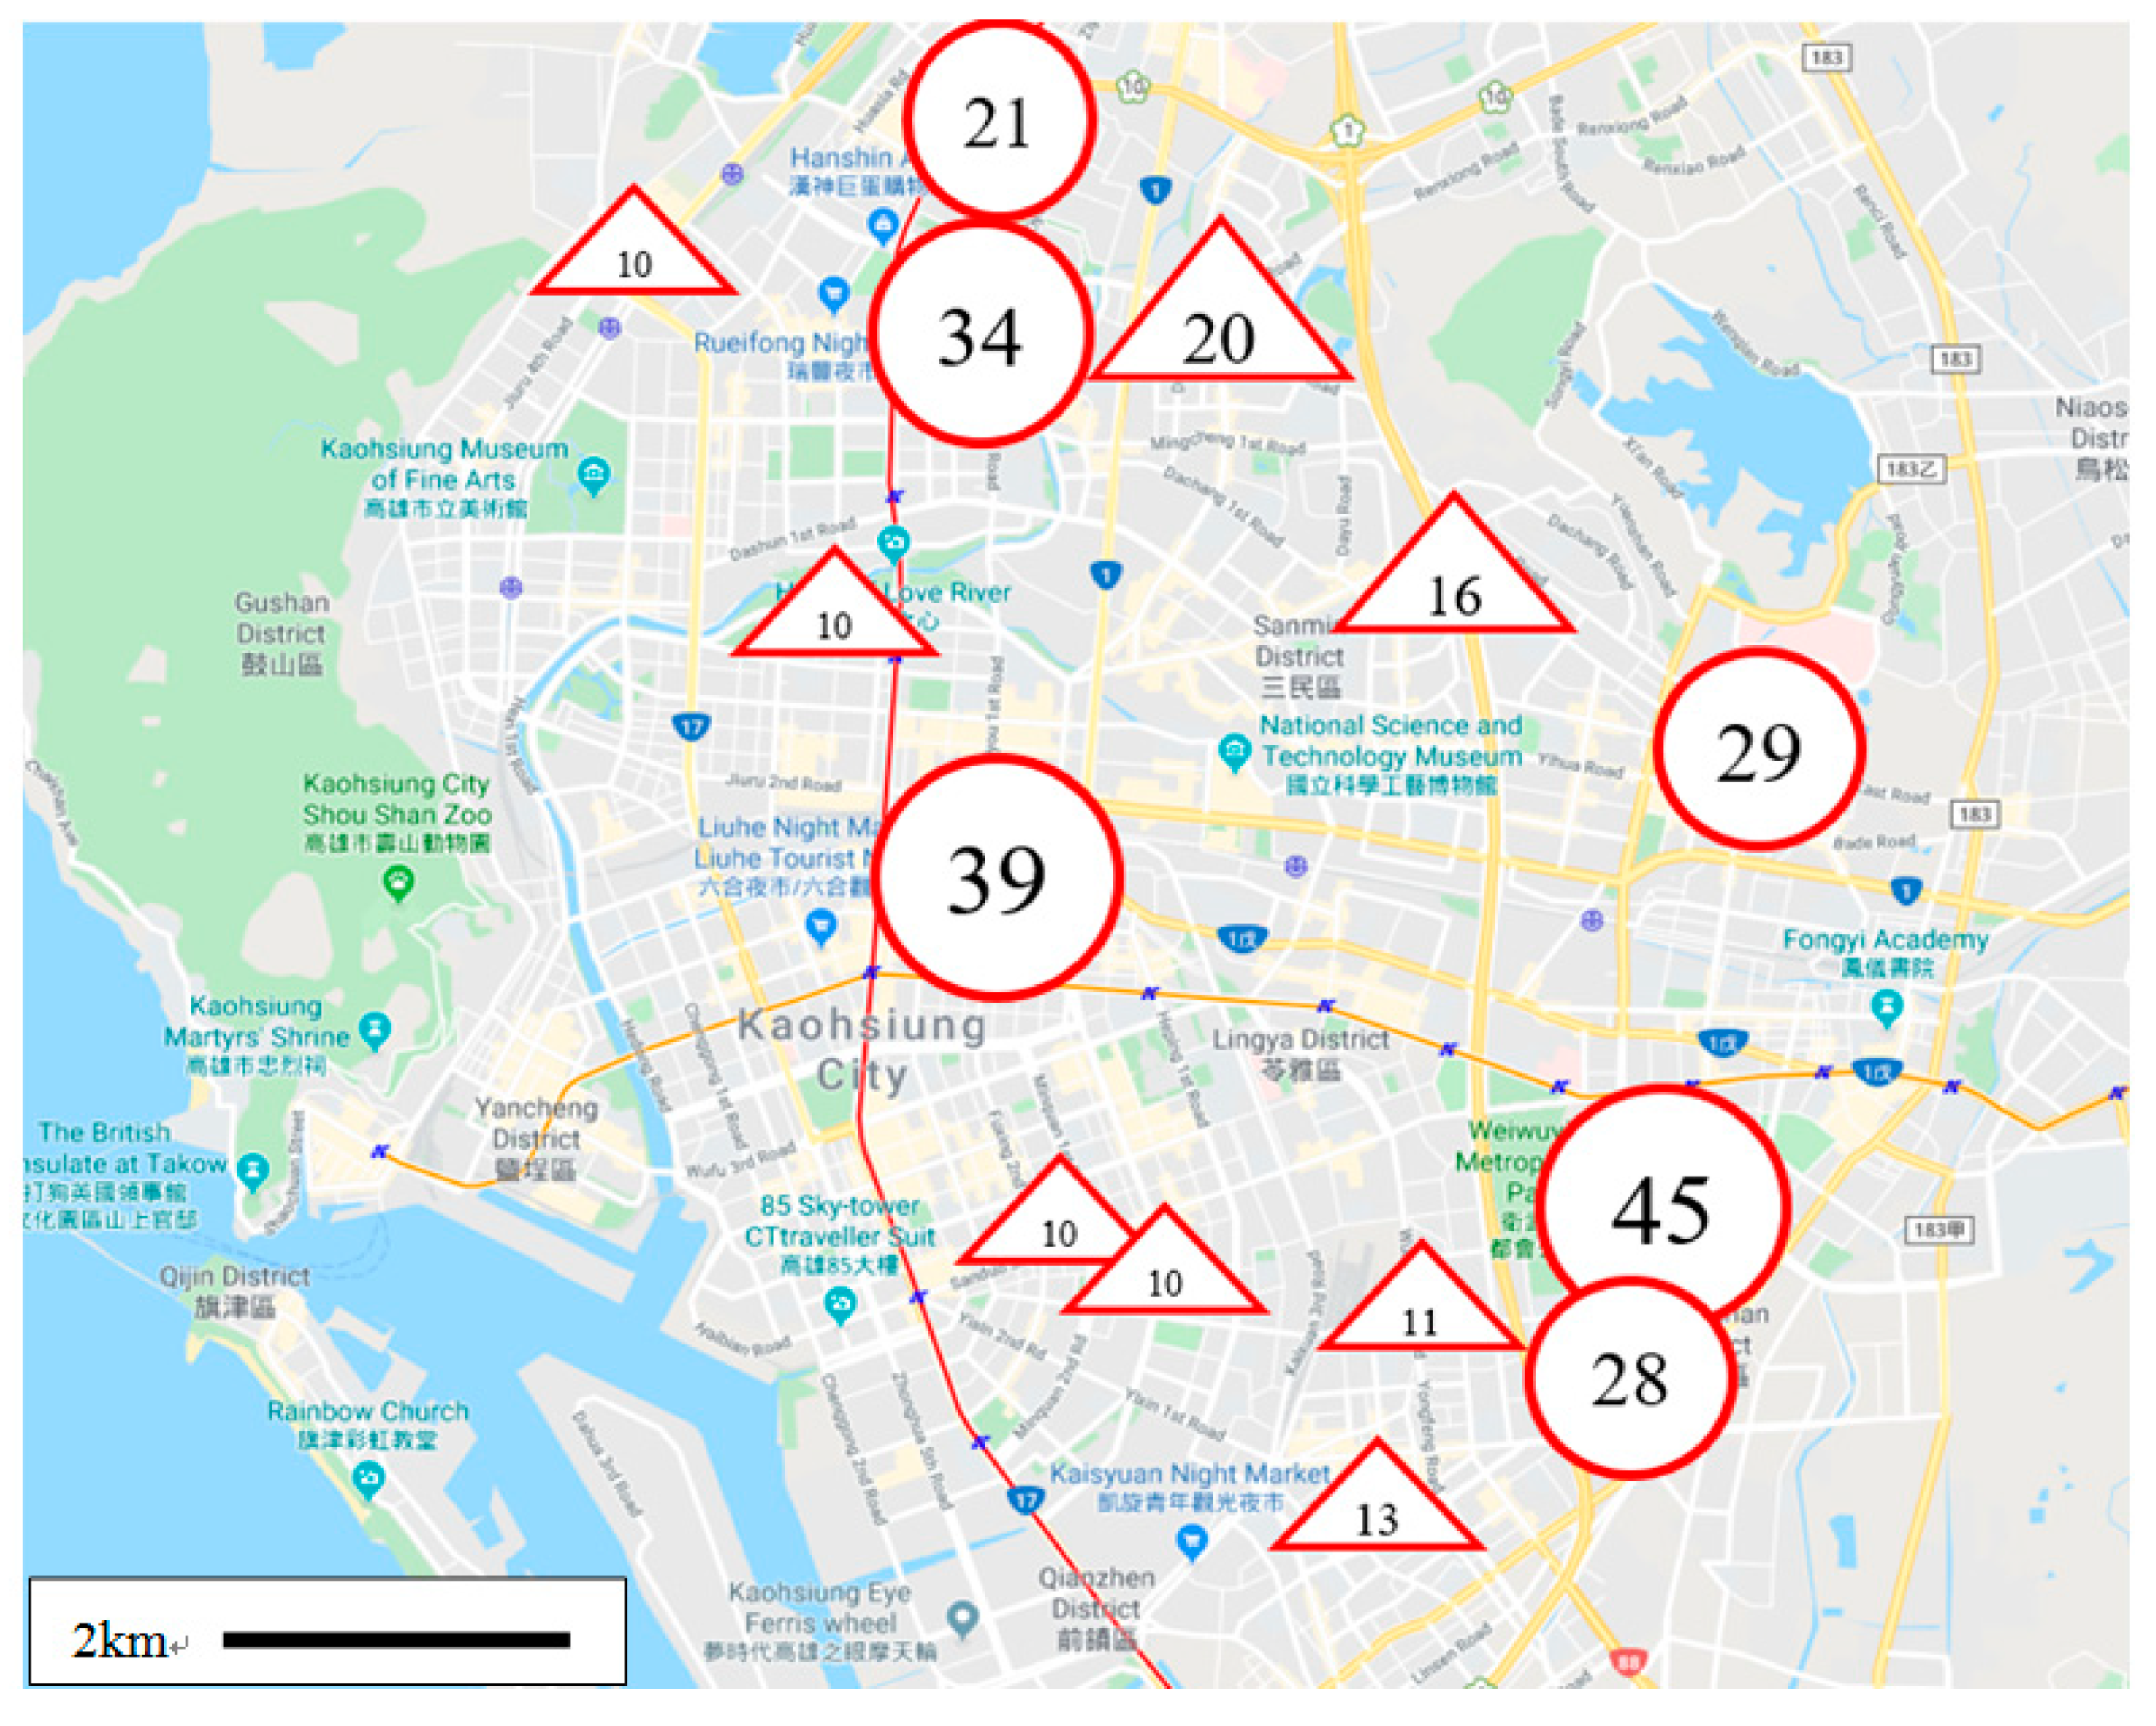
Then, as presented in the description of step 5, we grouped the KHIPs by putting two KHIPs in the same group if the distance between them was less than 150 m. The KLIPs were also grouped using the same method. The distribution of the numbers of a group of KHIPs is shown in
Table 3, while the distribution for KLIPs is shown in
Table 4. As can be seen in
Table 3, there are 9 groups with more than 10 KHIPs, and 8 of these 9 groups are located in the downtown area of Kaohsiung City. The positions of these 8 groups are indicated in
Figure 6 with triangular symbols. In addition, as can be seen from
Table 4, there are 9 groups with more than 20 KLIPs and 6 of them are located in the downtown area of Kaohsiung City. The positions of the 6 groups are also shown in
Figure 5 with circular symbols.
From
Figure 6, we can see that not every potential site (the home of a patient) is a dangerous zone for dengue transmission. Therefore, it may not be necessary to spray chemical insecticides at each potential site for preventing the spread of dengue fever. Since the environment of circular symbols in
Figure 5 is not conducive to dengue transmission, it can be studied and the results can be used to improve the environment of triangular symbols.


