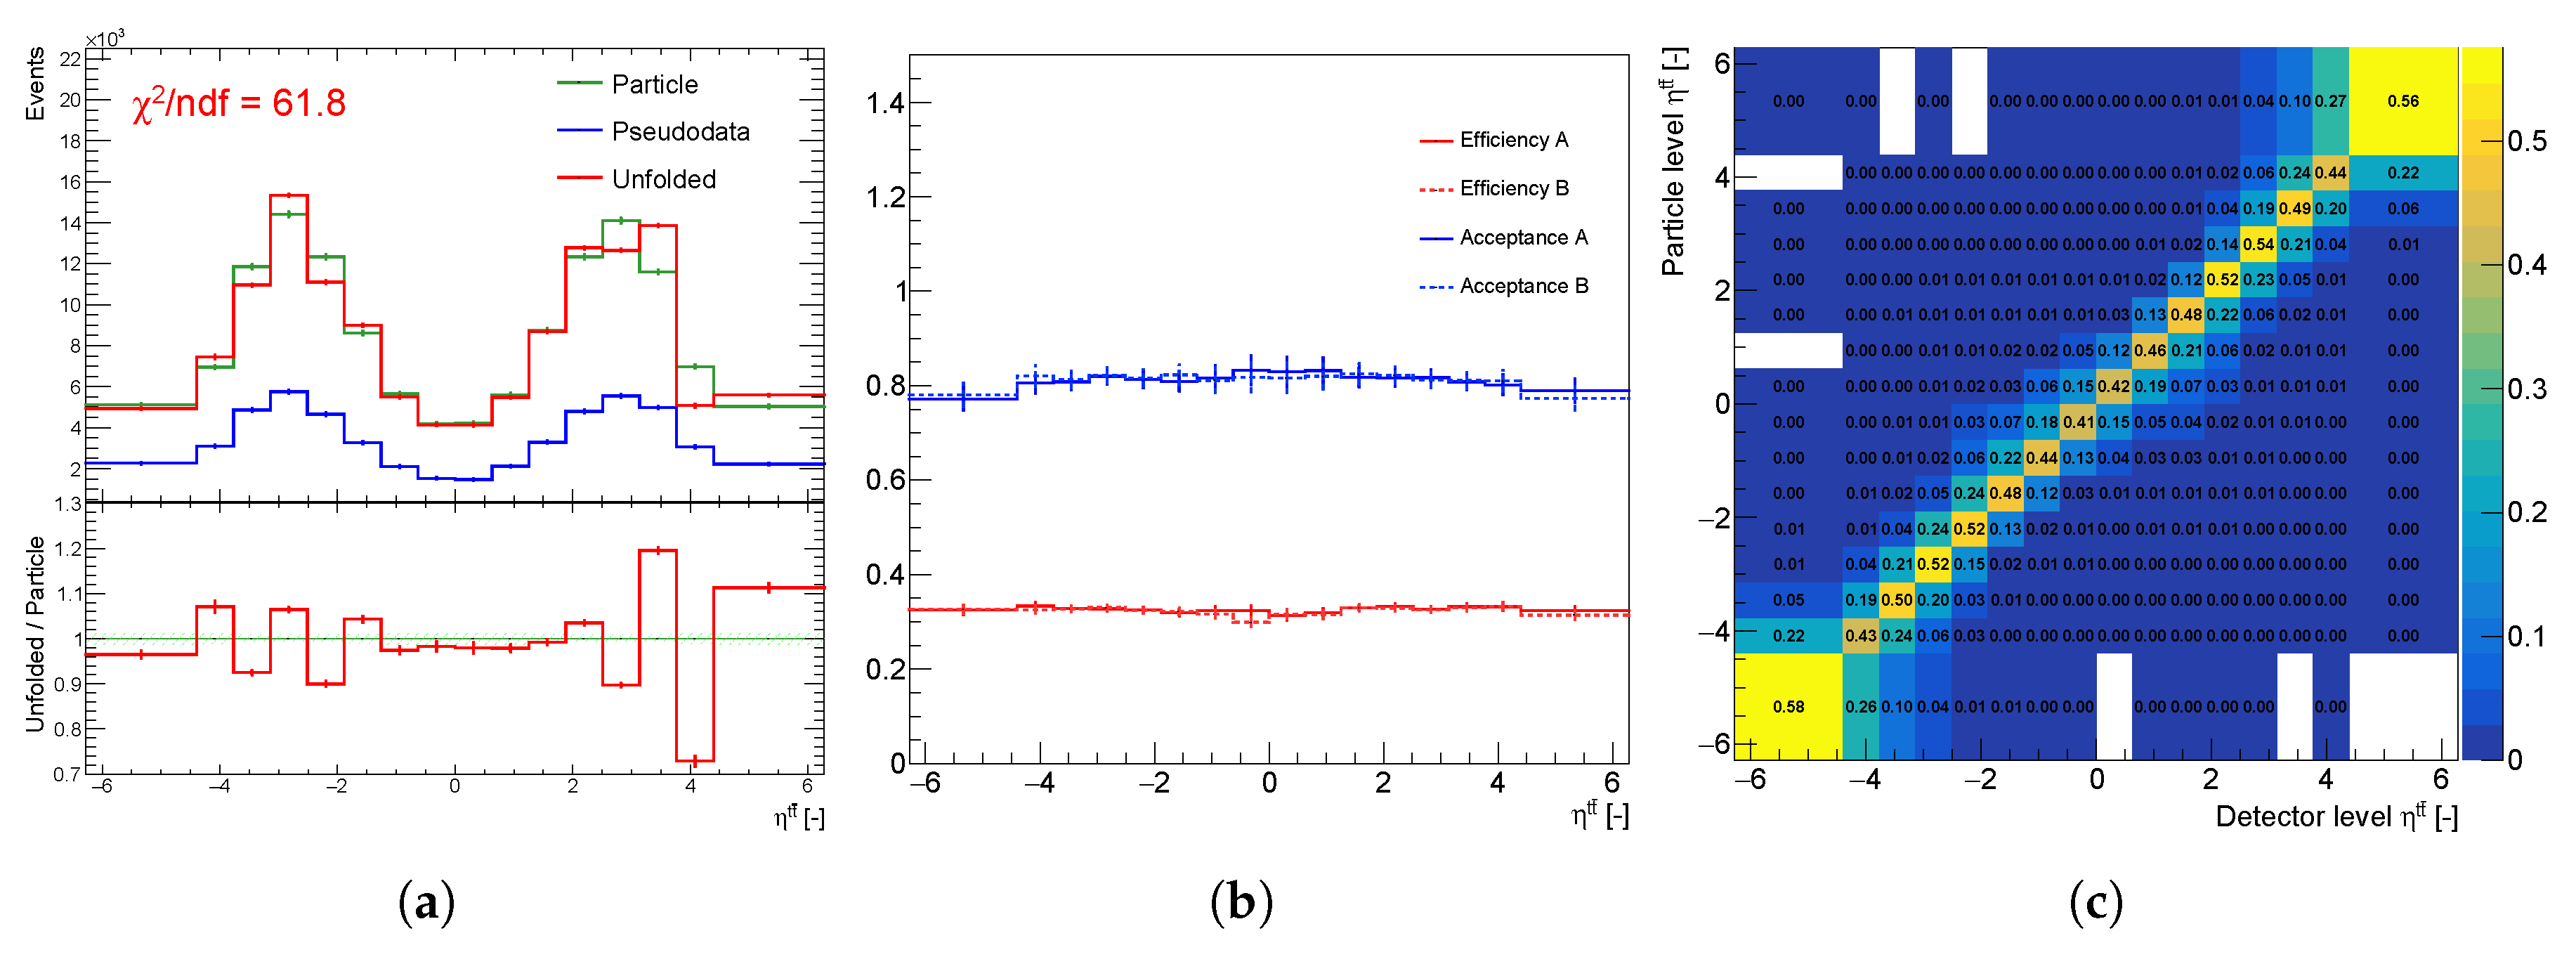
Figure 1.
Unfolding components of the spectrum : (a) particle spectra (green), pseudo data (blue), unfolding result (red), (b) efficiency and acceptance corrections of statistically independent sets A and B, and (c) normalized migration matrix .
Figure 1.
Unfolding components of the spectrum : (a) particle spectra (green), pseudo data (blue), unfolding result (red), (b) efficiency and acceptance corrections of statistically independent sets A and B, and (c) normalized migration matrix .
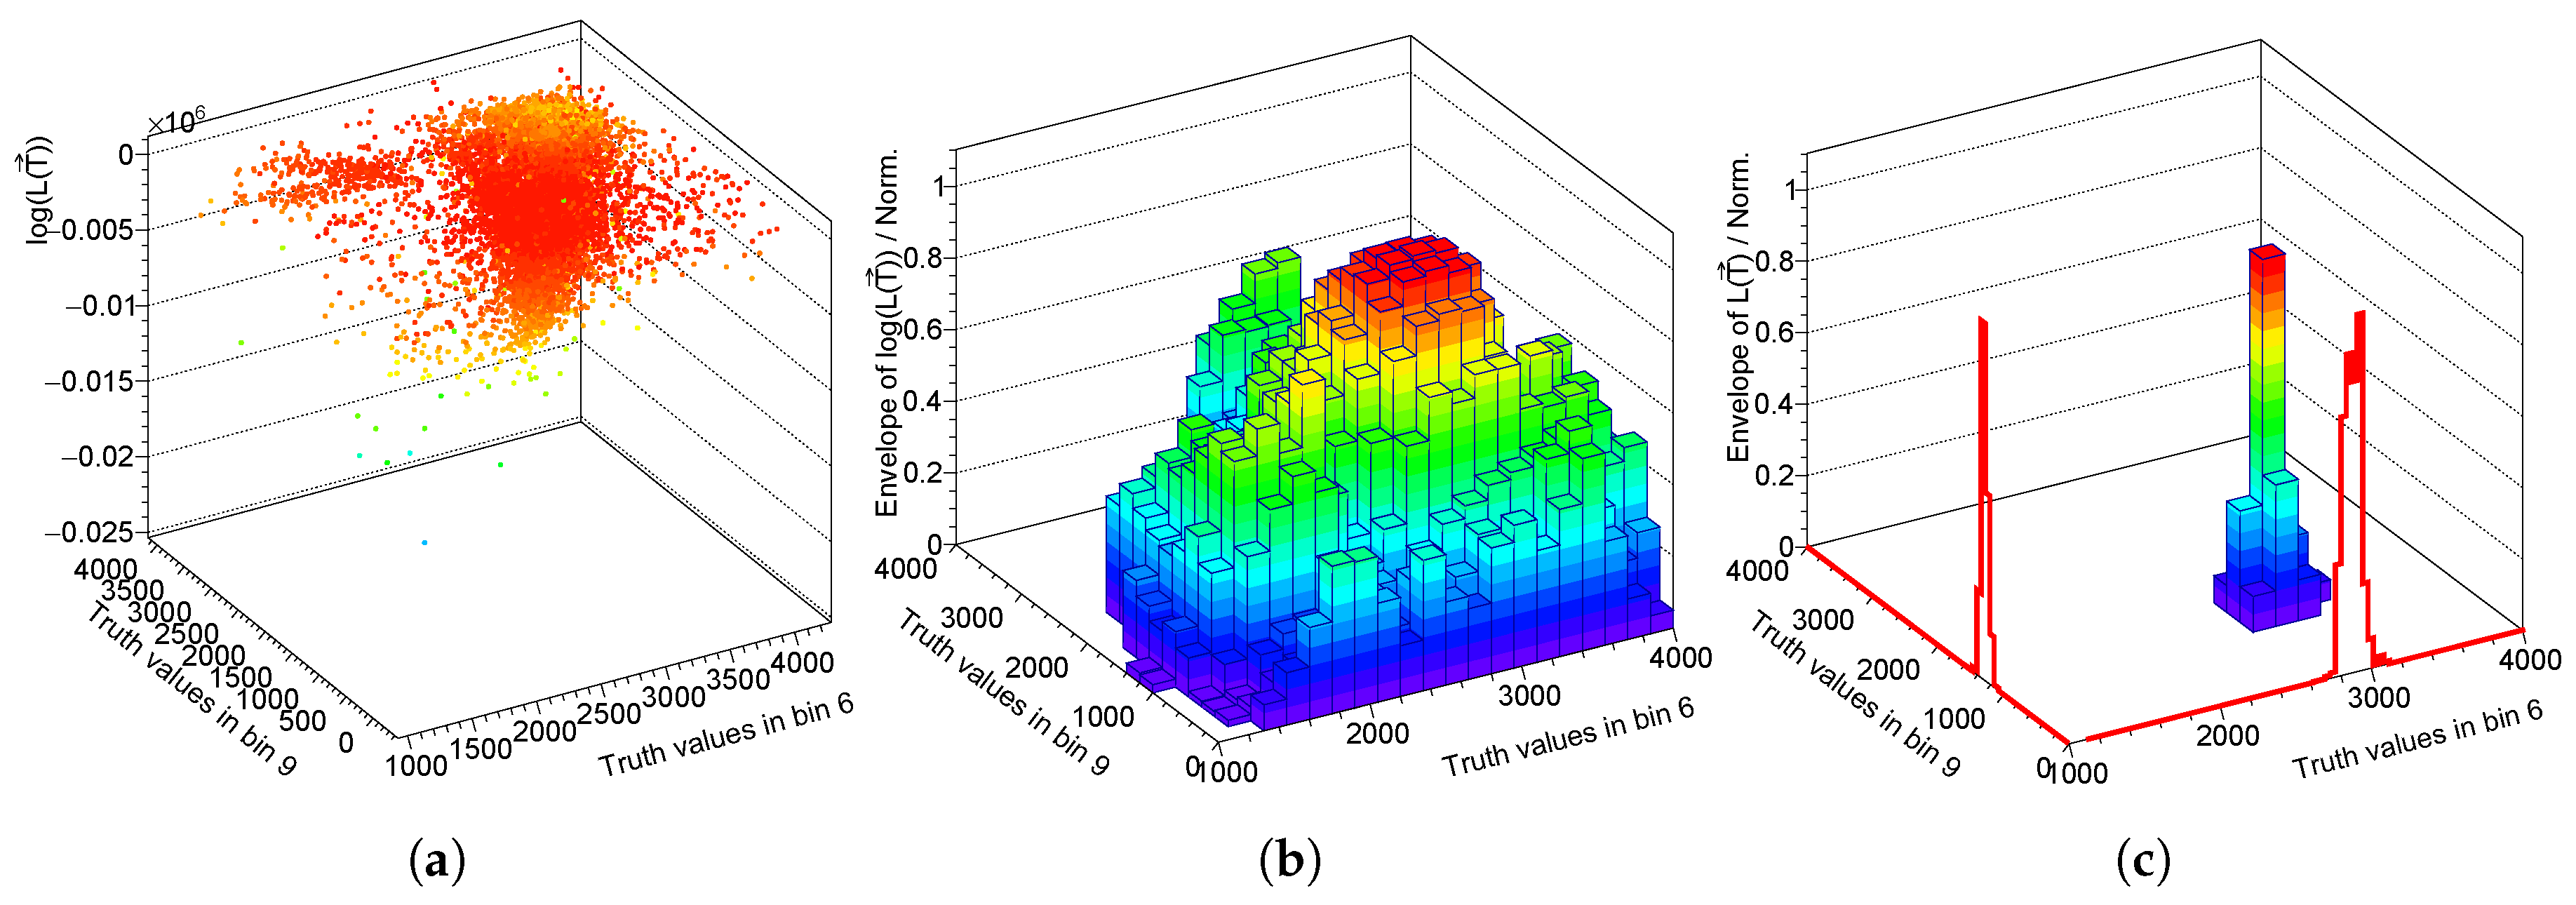
Figure 2.
(a) View of a part of the 16-dimensional log-likelihood function as function of the 6th and 9th bin (b) normalized maximal values of , and (c) normalized maximal values of .
Figure 2.
(a) View of a part of the 16-dimensional log-likelihood function as function of the 6th and 9th bin (b) normalized maximal values of , and (c) normalized maximal values of .
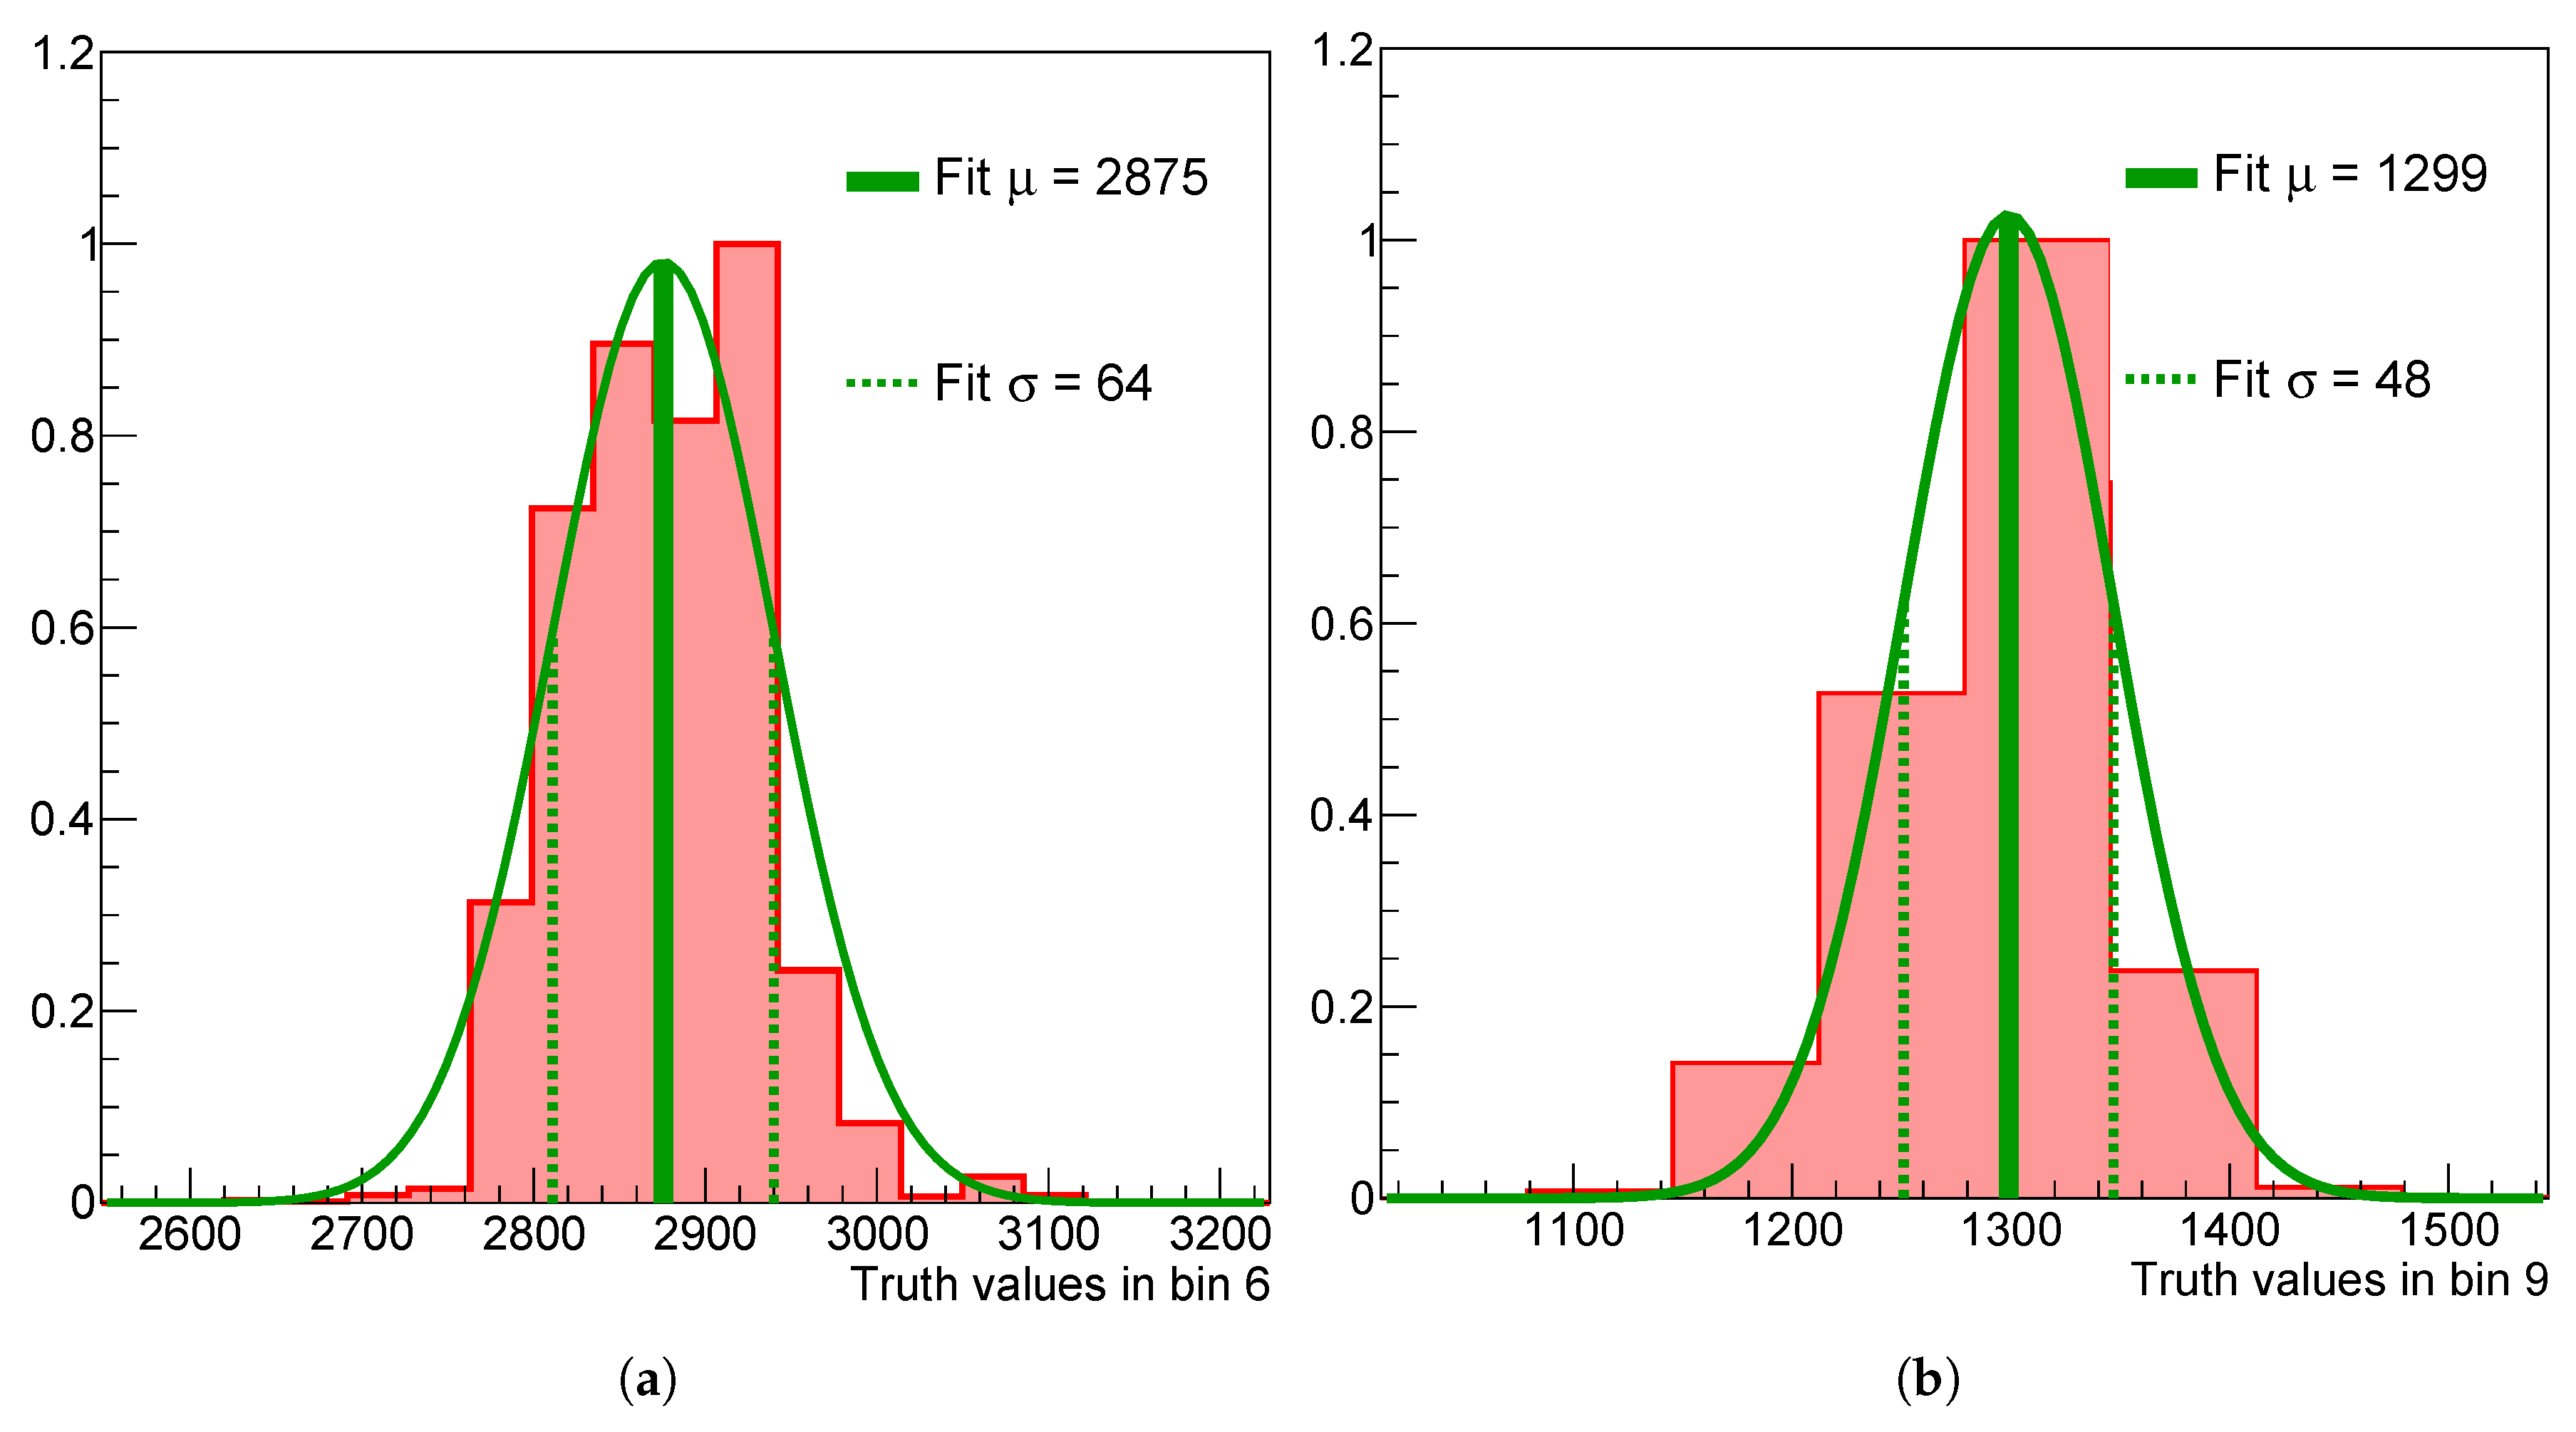
Figure 3.
Marginalized 1D posteriors in the 6th (a) and 9th (b) bin of the spectrum without regularization applied.
Figure 3.
Marginalized 1D posteriors in the 6th (a) and 9th (b) bin of the spectrum without regularization applied.
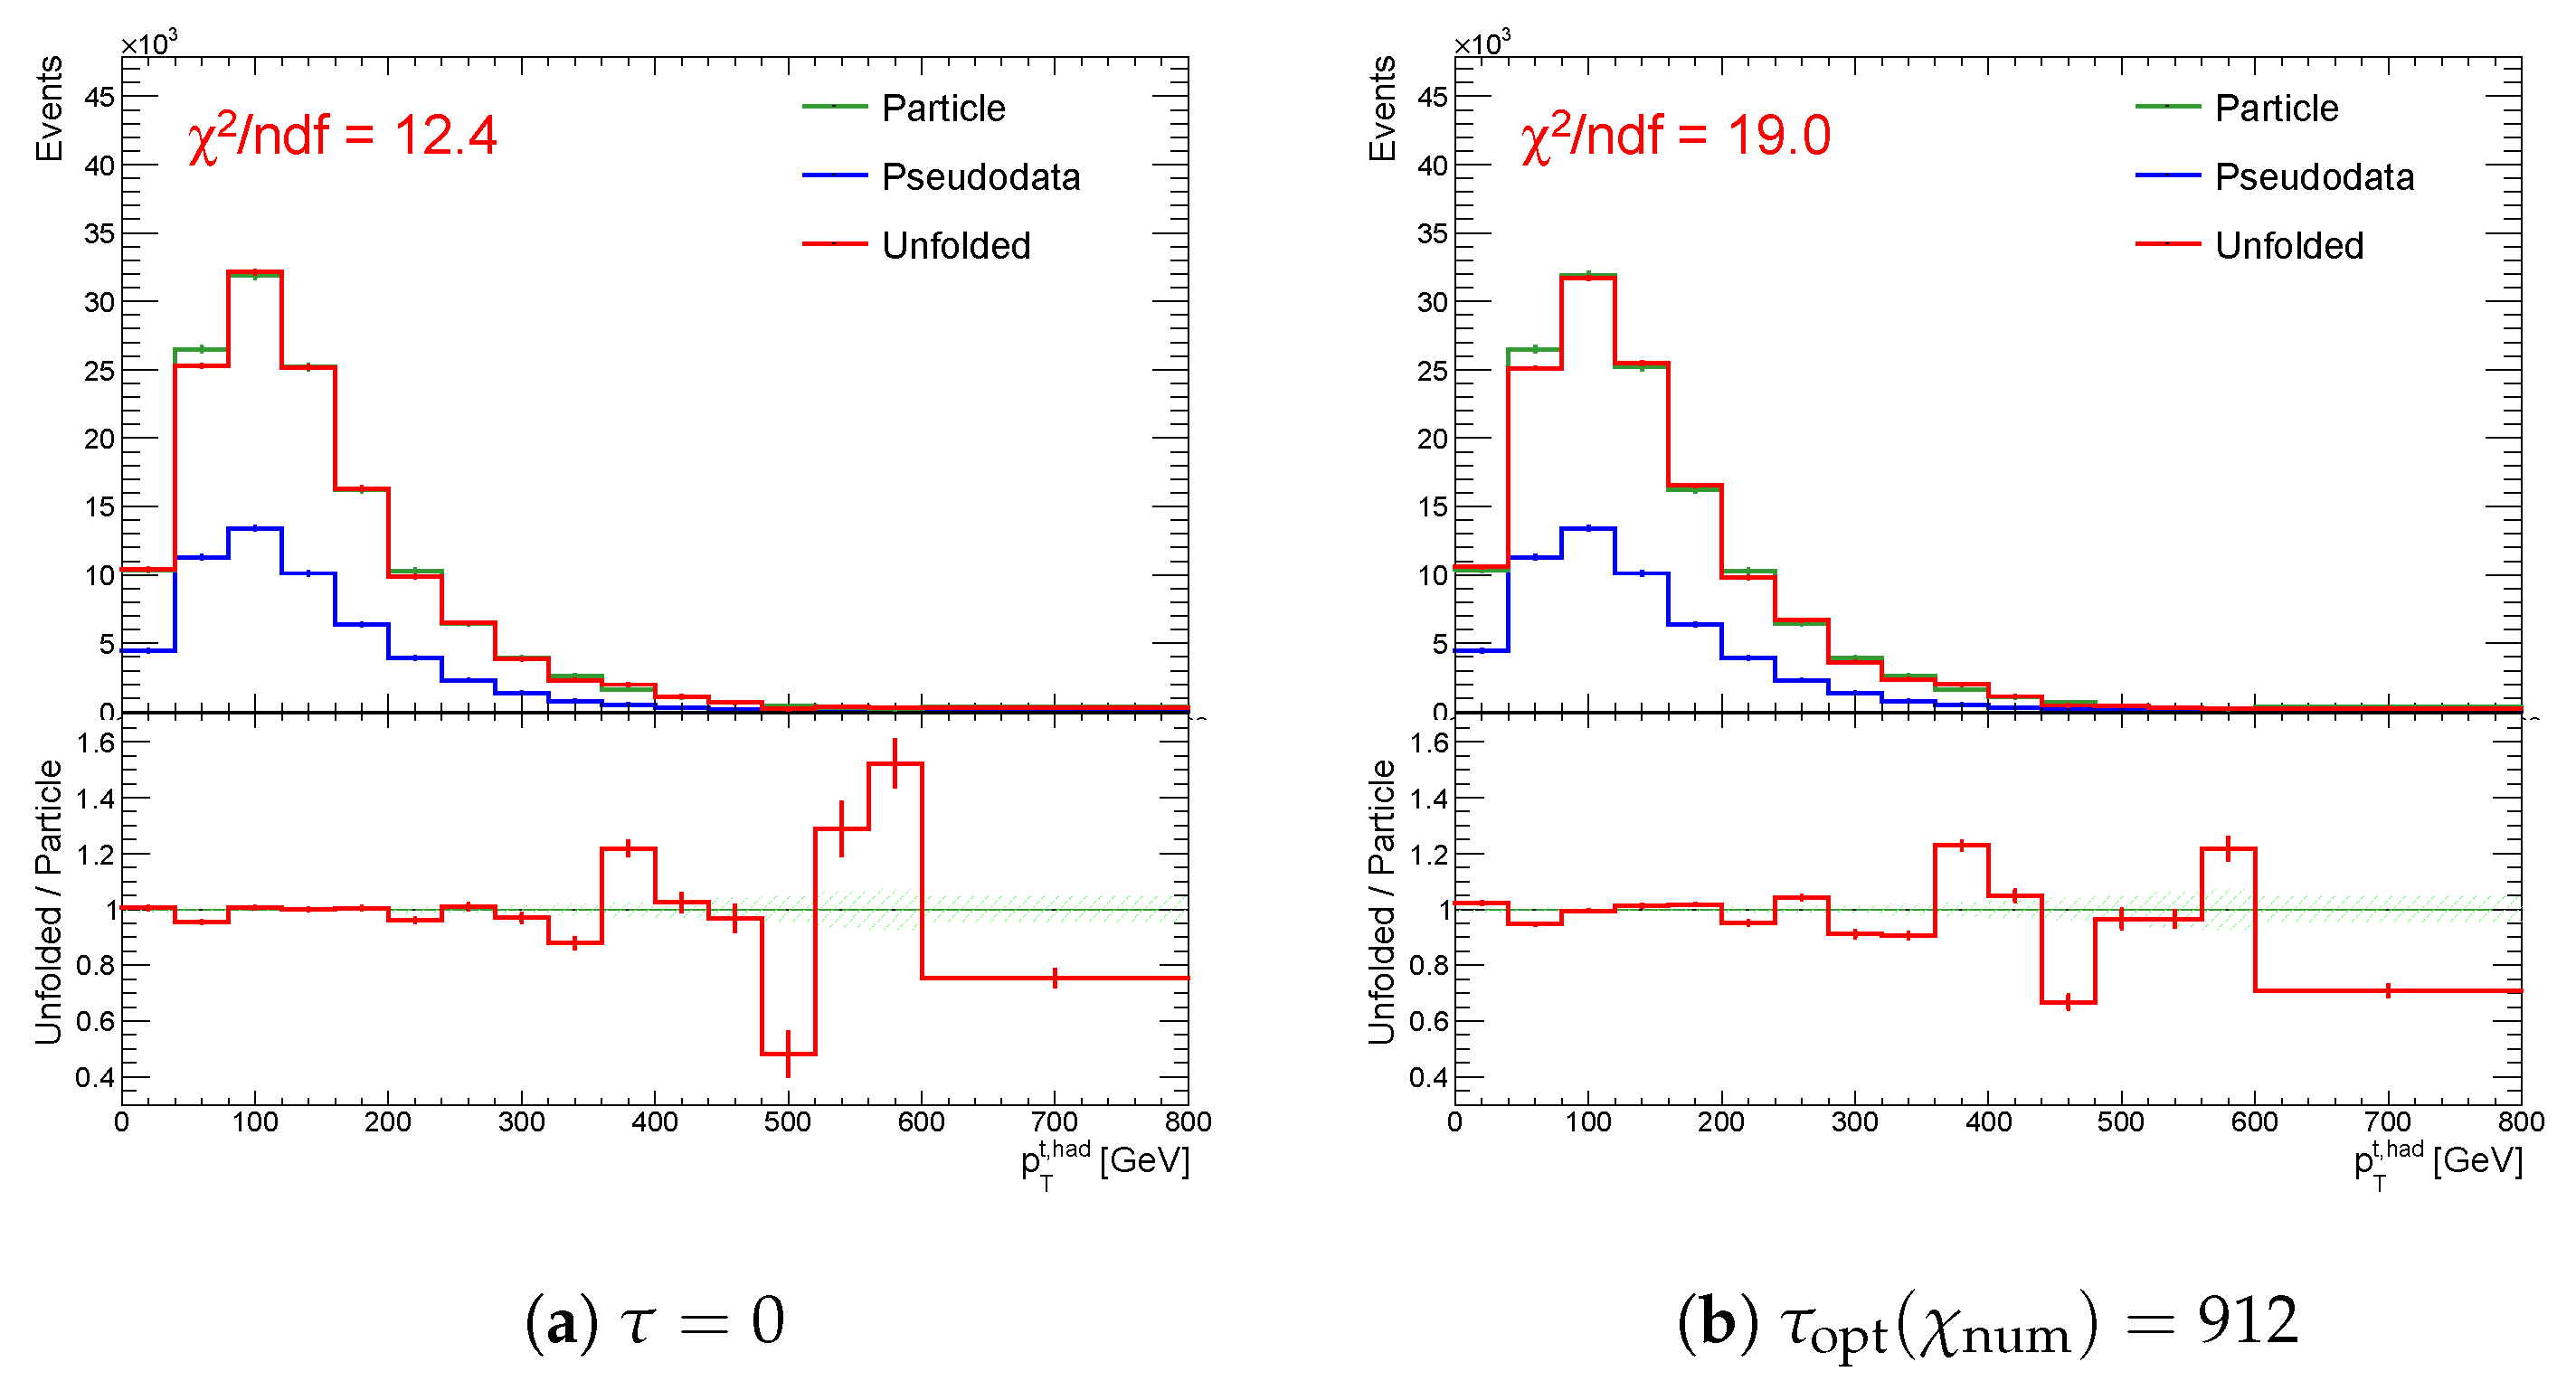
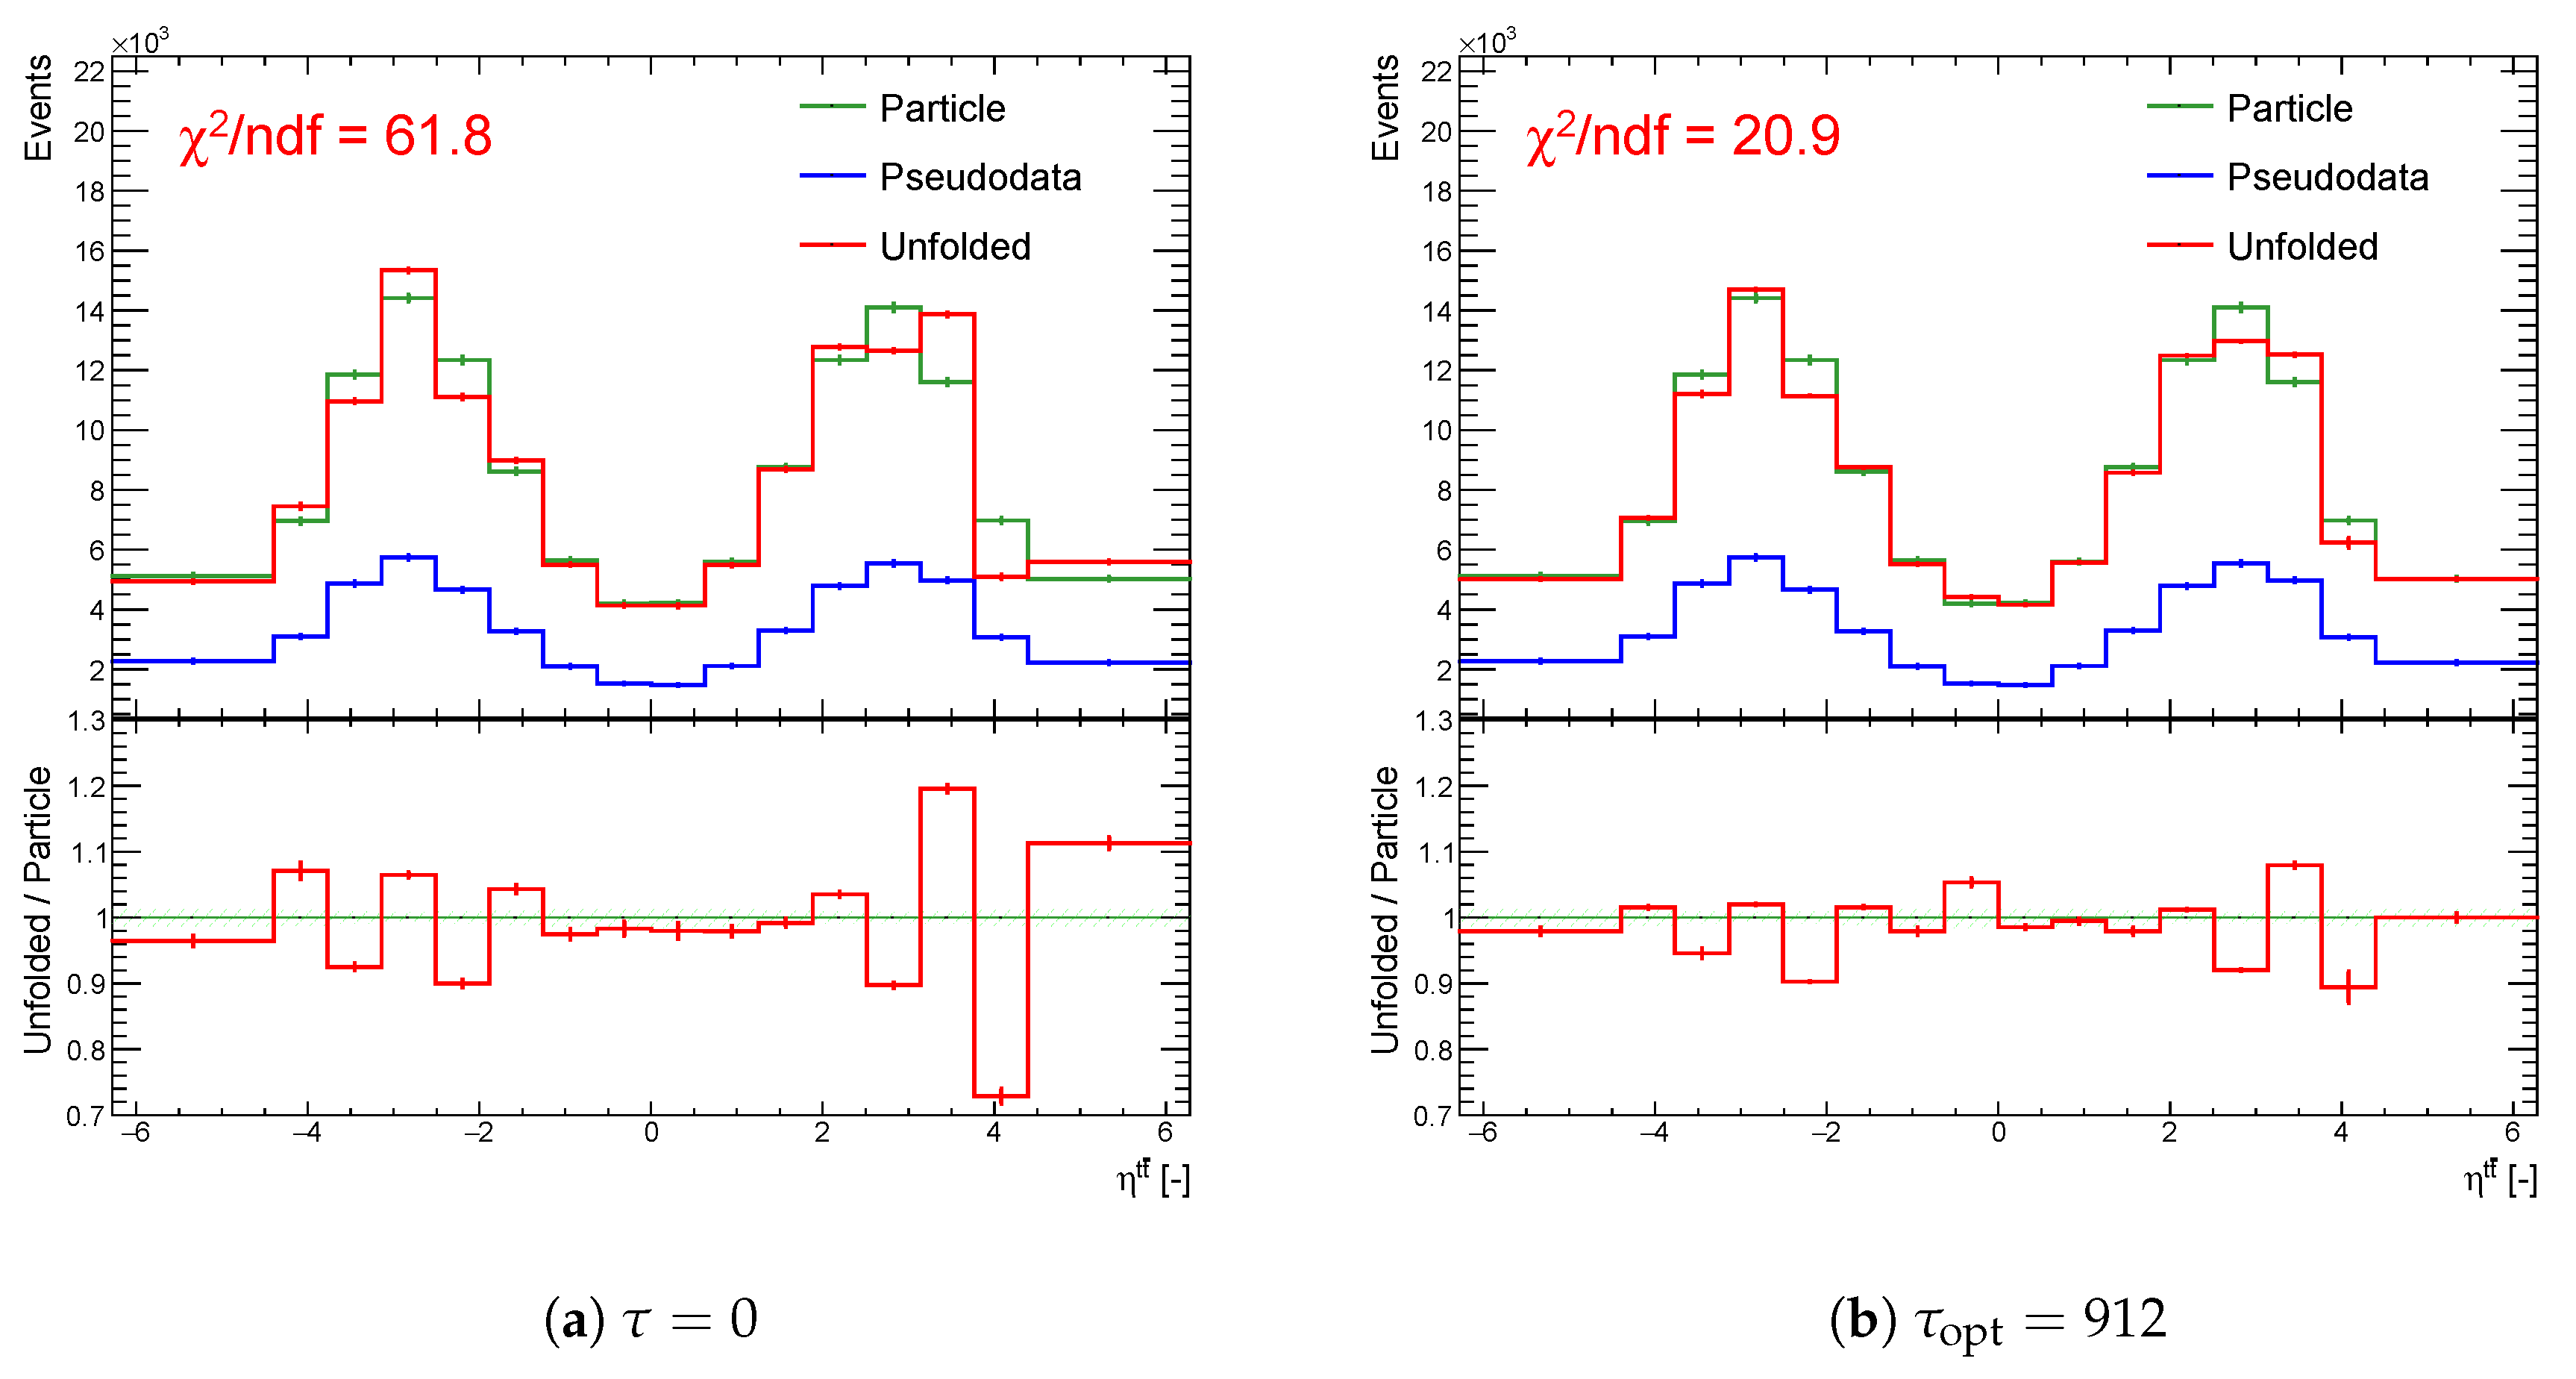
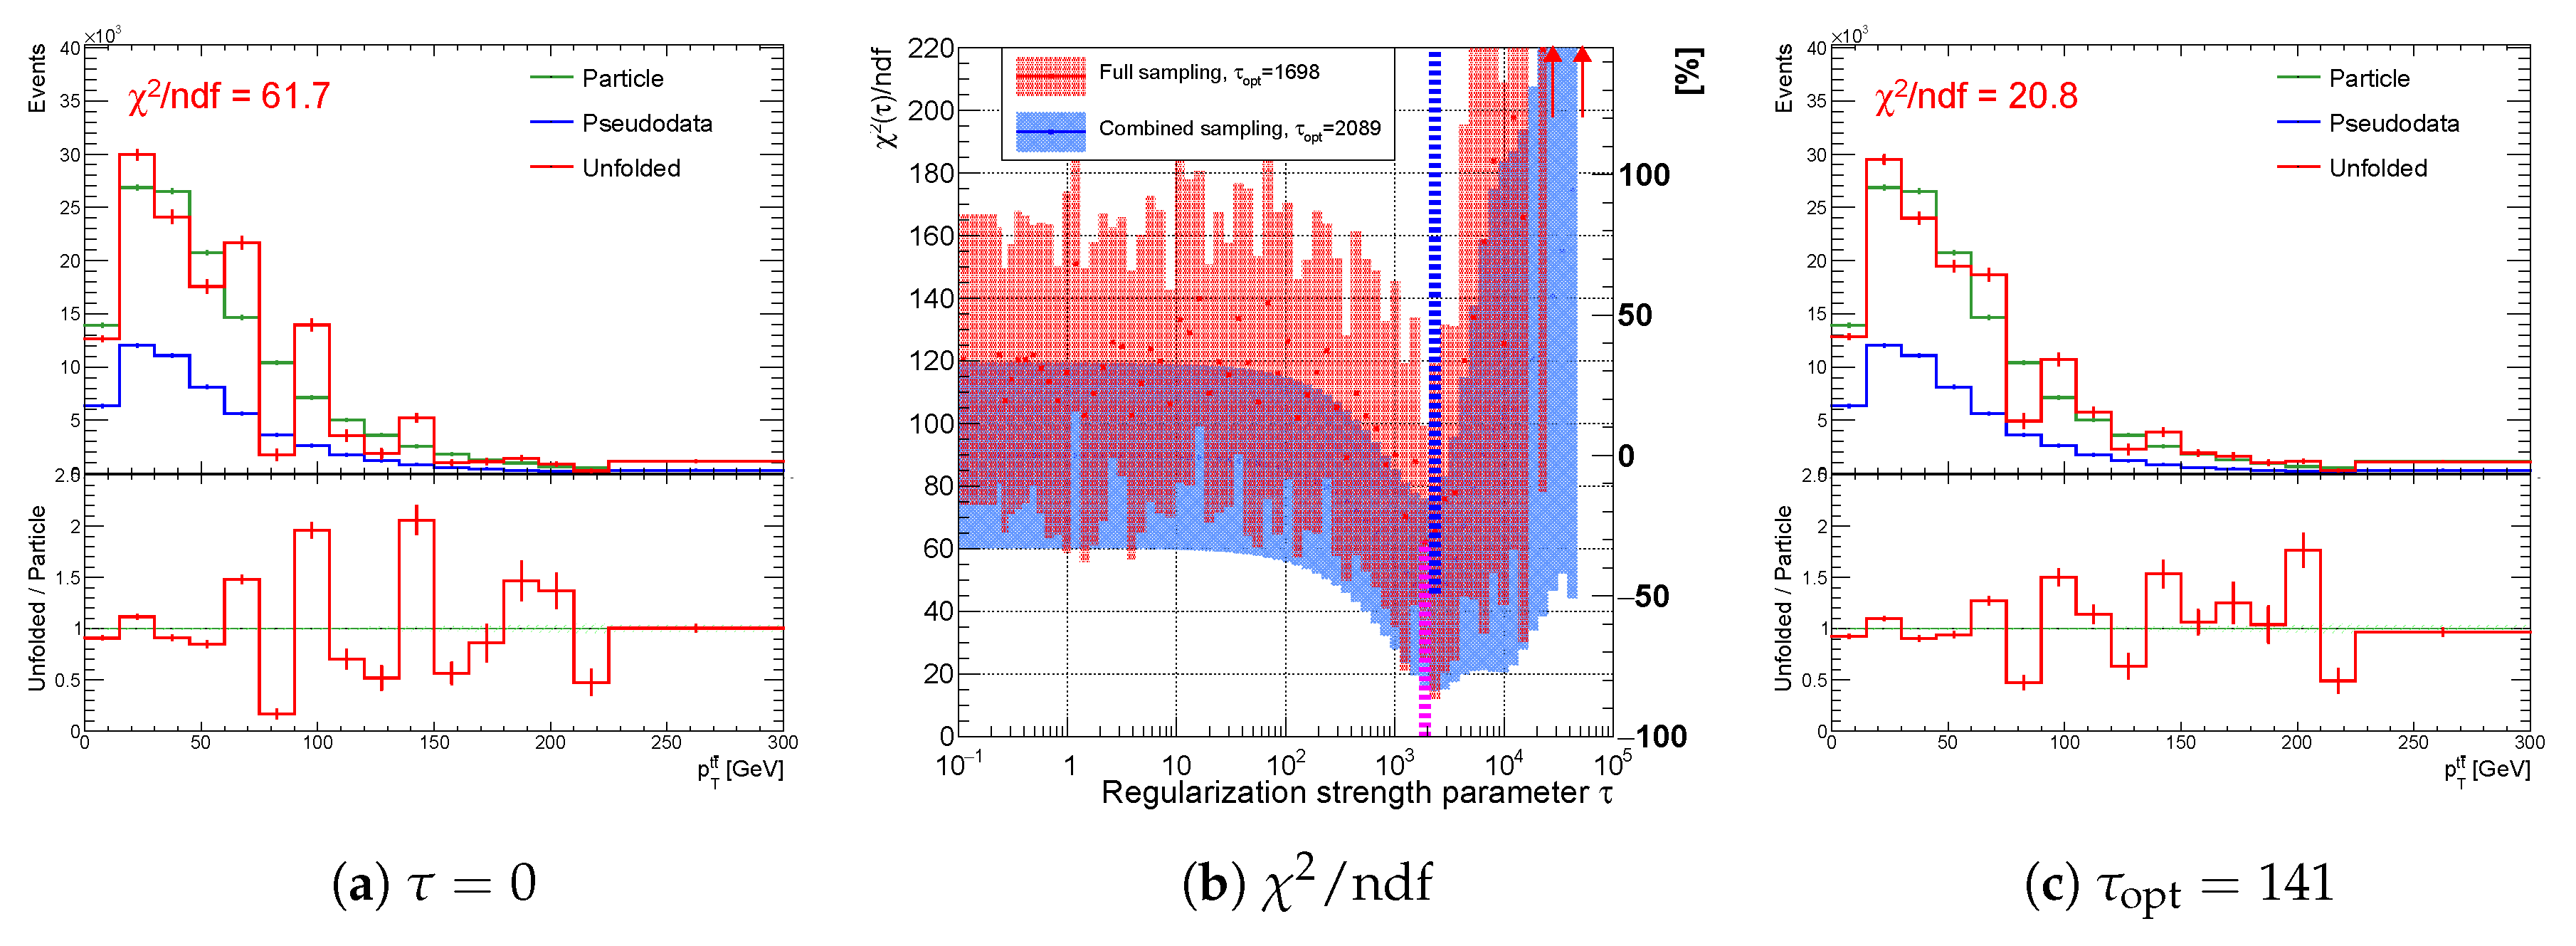
Figure 4.
Unfolding the double-peaked
over-binned spectrum for different values of the regularization strength parameter
. The parameter
is normalized, such that
, see
Section 3.
Figure 4.
Unfolding the double-peaked
over-binned spectrum for different values of the regularization strength parameter
. The parameter
is normalized, such that
, see
Section 3.
Figure 5.
Relative
as function of the regularization strength parameter
and its minimum at
. The parameter
is normalized, such that
, see
Section 3. The vertical line represents the minimum of
.
Figure 5.
Relative
as function of the regularization strength parameter
and its minimum at
. The parameter
is normalized, such that
, see
Section 3. The vertical line represents the minimum of
.
Figure 6.
The envelope of normalized regularization functions in the 6th and 9th bin. For sampling purposes, the gradient of was used.
Figure 6.
The envelope of normalized regularization functions in the 6th and 9th bin. For sampling purposes, the gradient of was used.
Figure 7.
Posterior shifting and narrowing with increasing the regularization strength parameter in a selected single bin: (a) no regularization applied (b) (c) .
Figure 7.
Posterior shifting and narrowing with increasing the regularization strength parameter in a selected single bin: (a) no regularization applied (b) (c) .
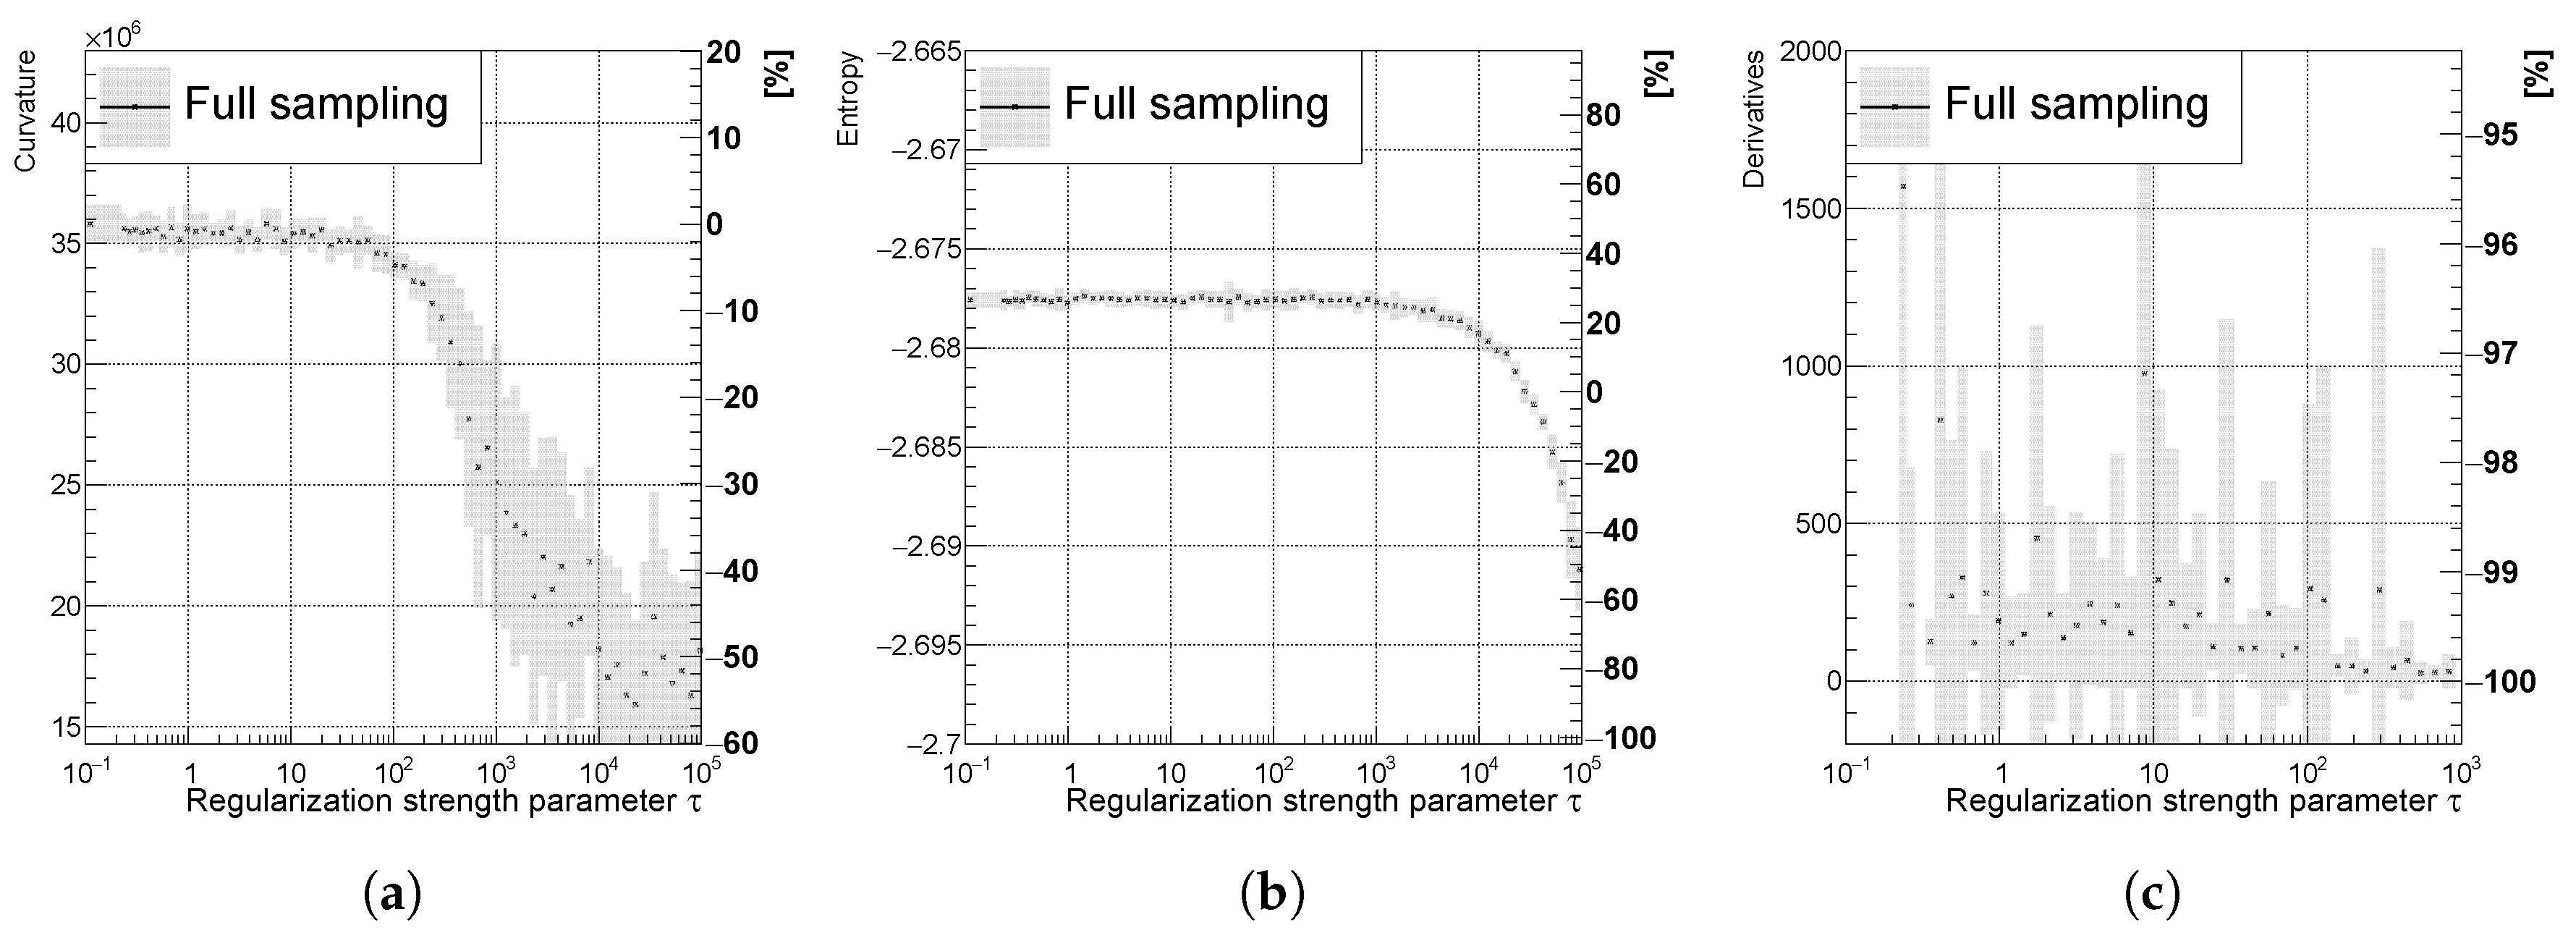
Figure 8.
Mostly decreasing (a) curvature, (b) entropy, and (c) derivatives of the unfolded spectrum with respect to . The uncertainty band is evaluated as a standard deviation over 20 independent unfolding runs initiated with different random seeds.
Figure 8.
Mostly decreasing (a) curvature, (b) entropy, and (c) derivatives of the unfolded spectrum with respect to . The uncertainty band is evaluated as a standard deviation over 20 independent unfolding runs initiated with different random seeds.
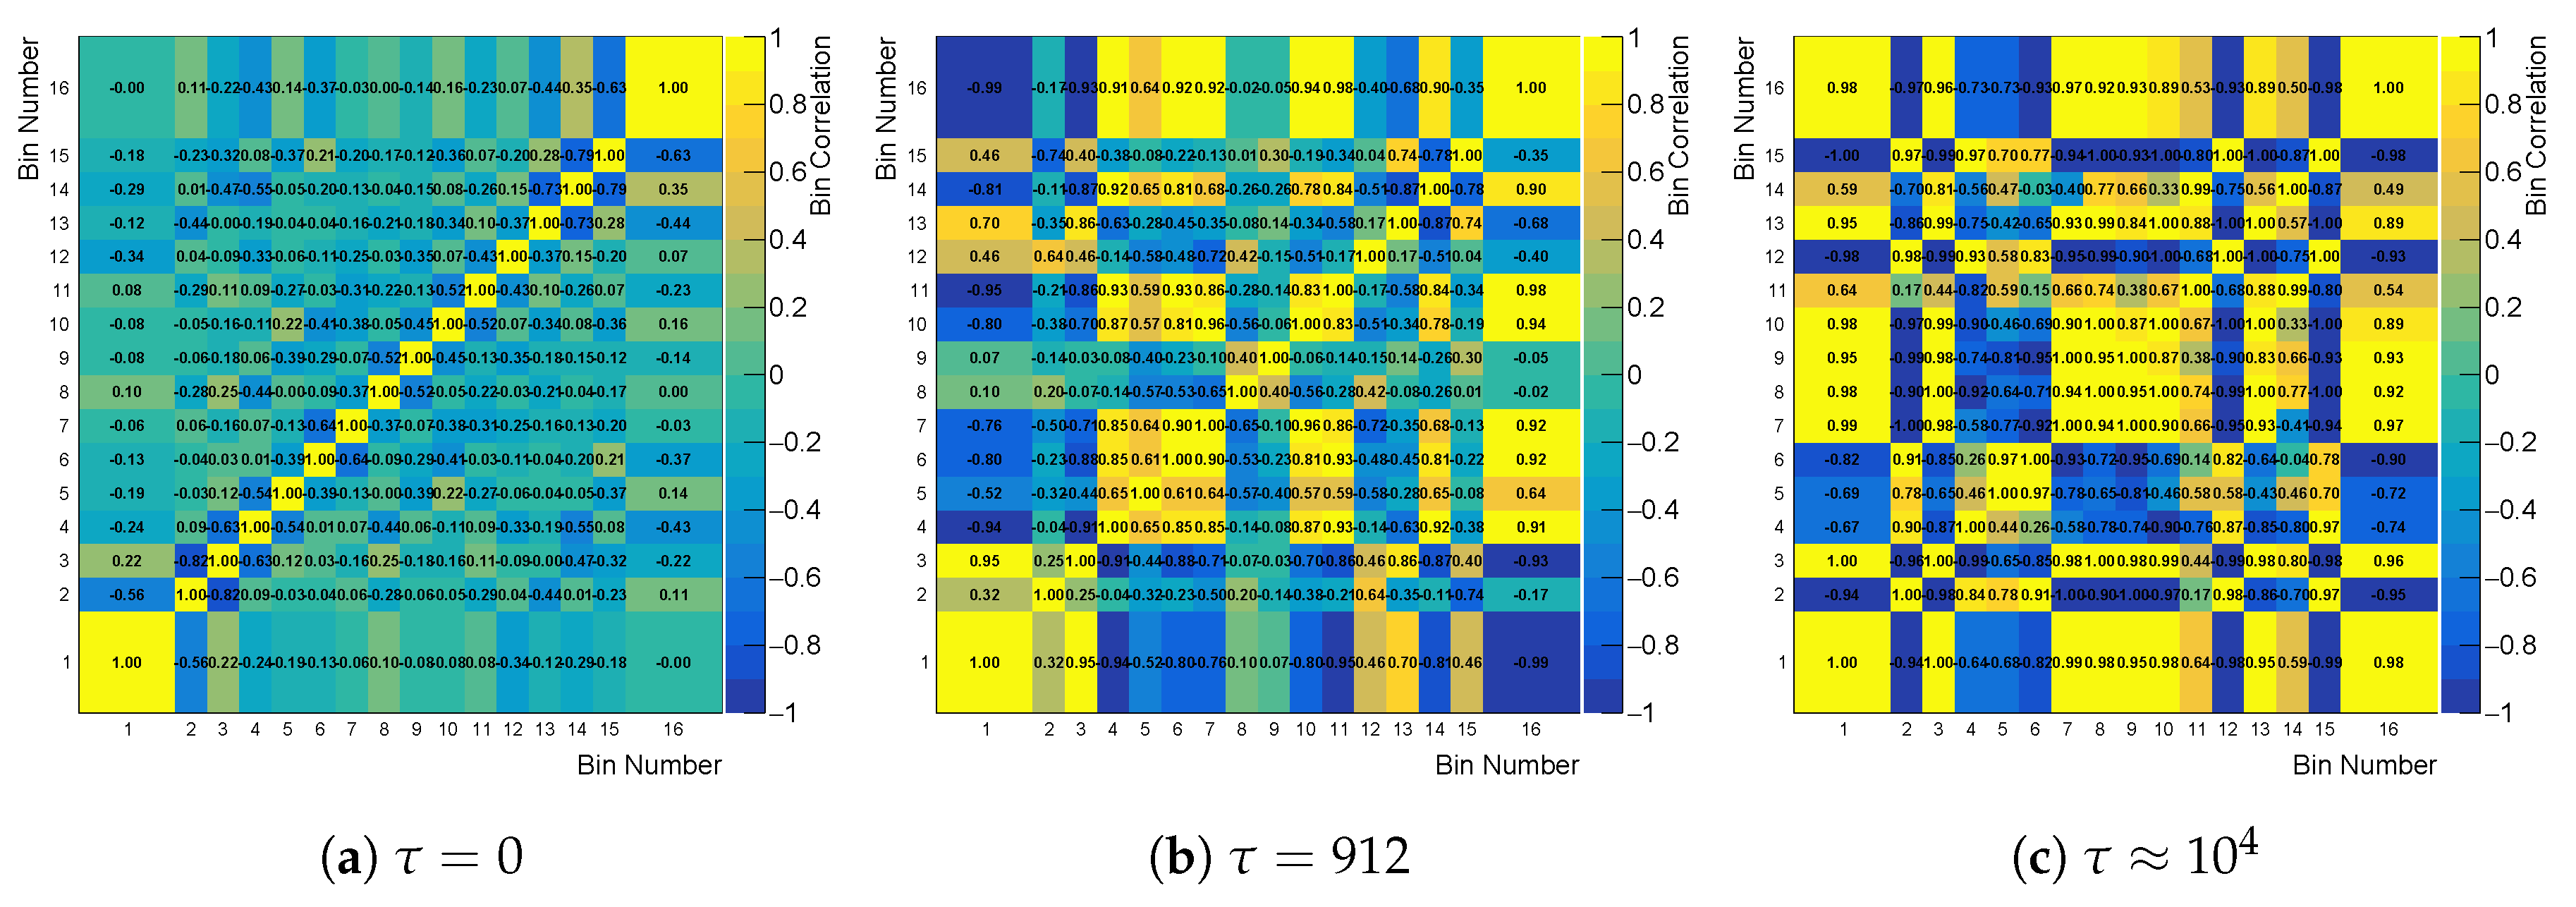
Figure 9.
Cross-bin correlation matrix built from the correlation factor of likelihood, while using the curvature regularization for three different values of .
Figure 9.
Cross-bin correlation matrix built from the correlation factor of likelihood, while using the curvature regularization for three different values of .
Figure 10.
The averaged cross bin correlations (black) and (pink) using (a) curvature, (b) entropy, and (c) derivative regularization for the spectrum. The uncertainty band is evaluated as a standard deviation over 20 independent unfolding runs initiated with different random seeds.
Figure 10.
The averaged cross bin correlations (black) and (pink) using (a) curvature, (b) entropy, and (c) derivative regularization for the spectrum. The uncertainty band is evaluated as a standard deviation over 20 independent unfolding runs initiated with different random seeds.
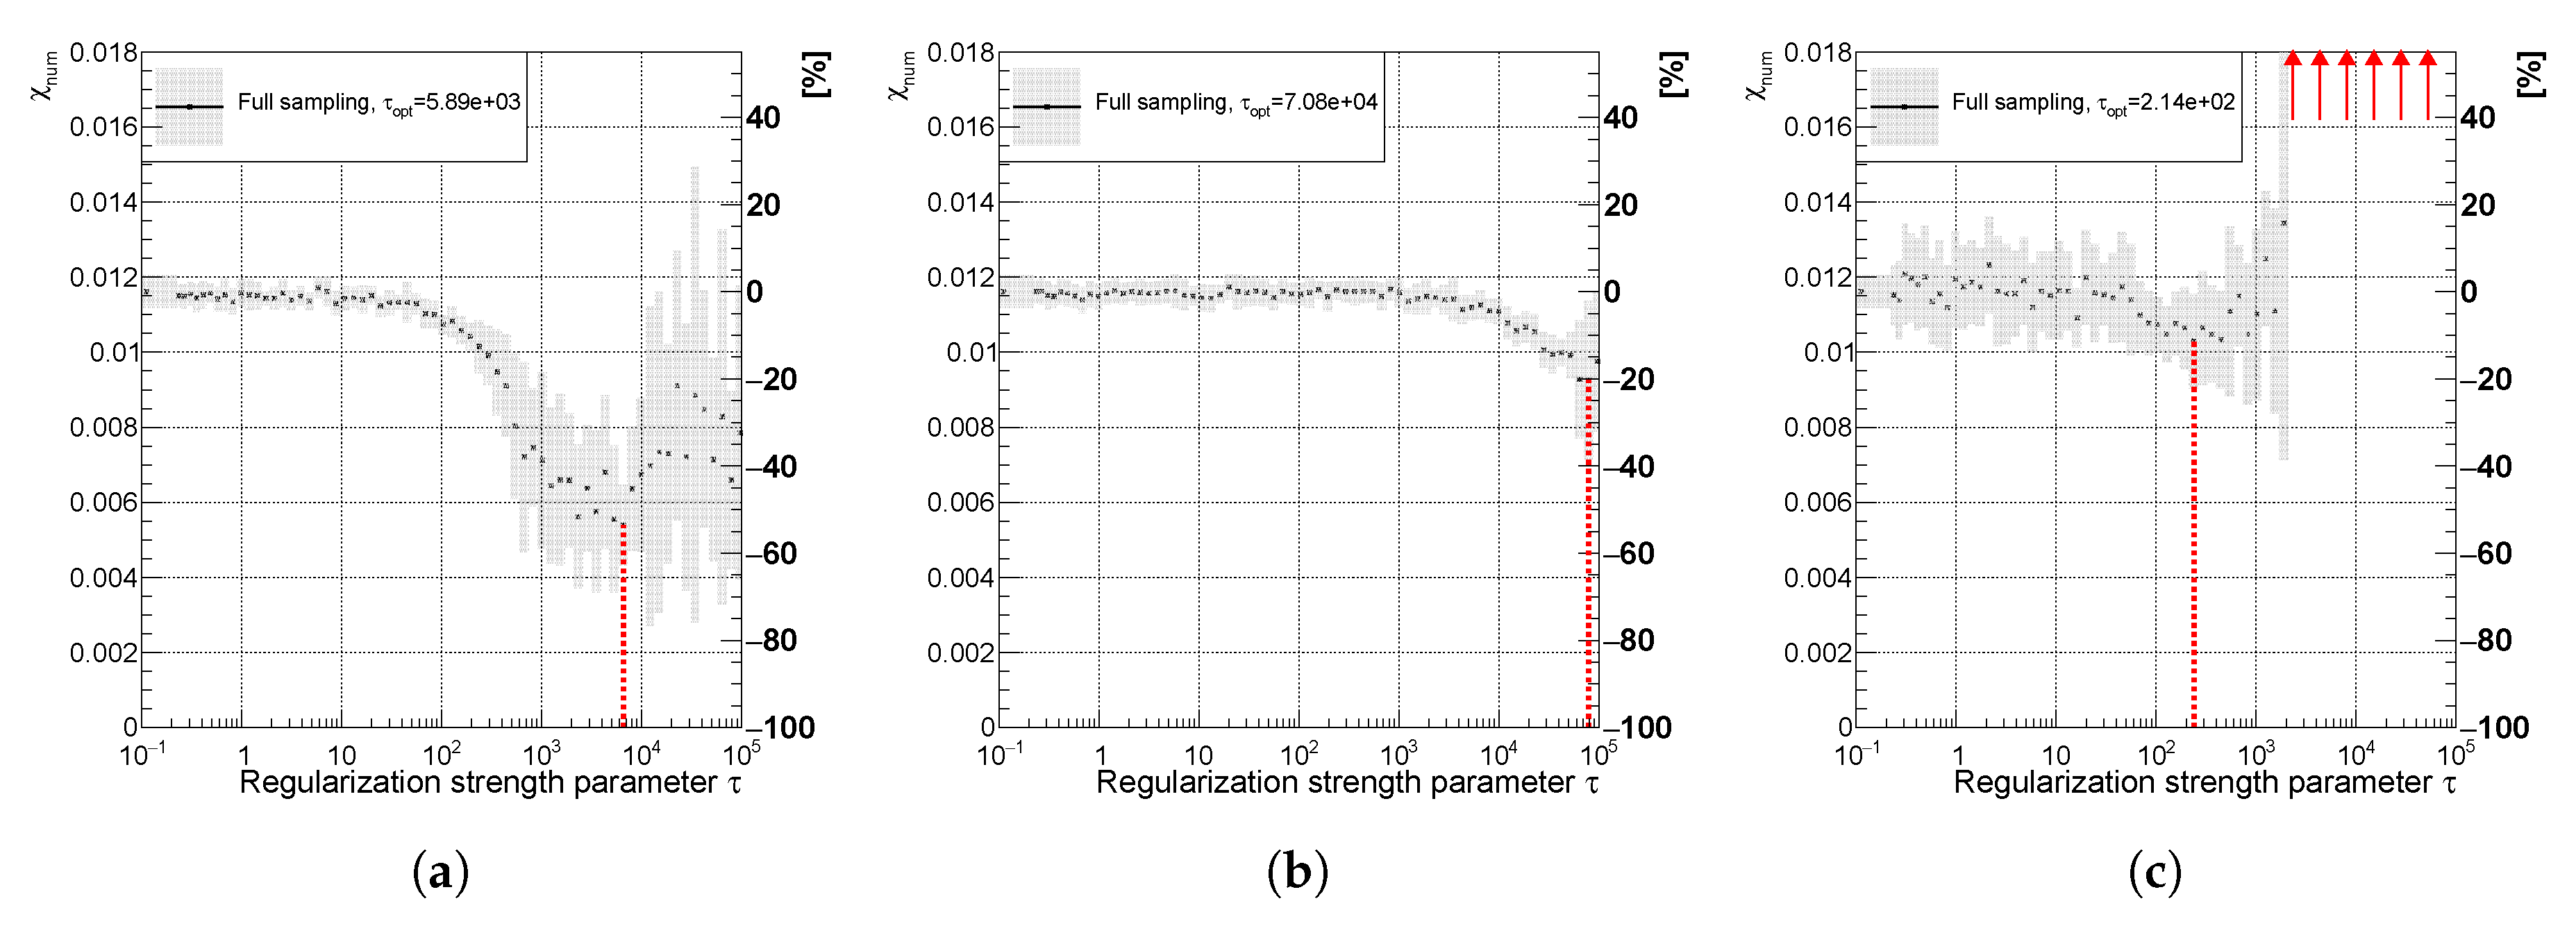
Figure 11.
Variable of the spectrum using (a) curvature (b) entropy and (c) derivative regularization illustrating the effect of spectra smoothing. The uncertainty band is evaluated as a standard deviation over 20 independent unfolding runs initiated with different random seeds. The red line indicates the minimal value of the .
Figure 12.
Variable of the spectrum using (a) curvature, (b) entropy, and (c) derivative regularization illustrating the effect of narrowing the posteriors and decreasing the uncertainty. The uncertainty band is evaluated as a standard deviation over 20 independent unfolding runs initiated with different random seeds.
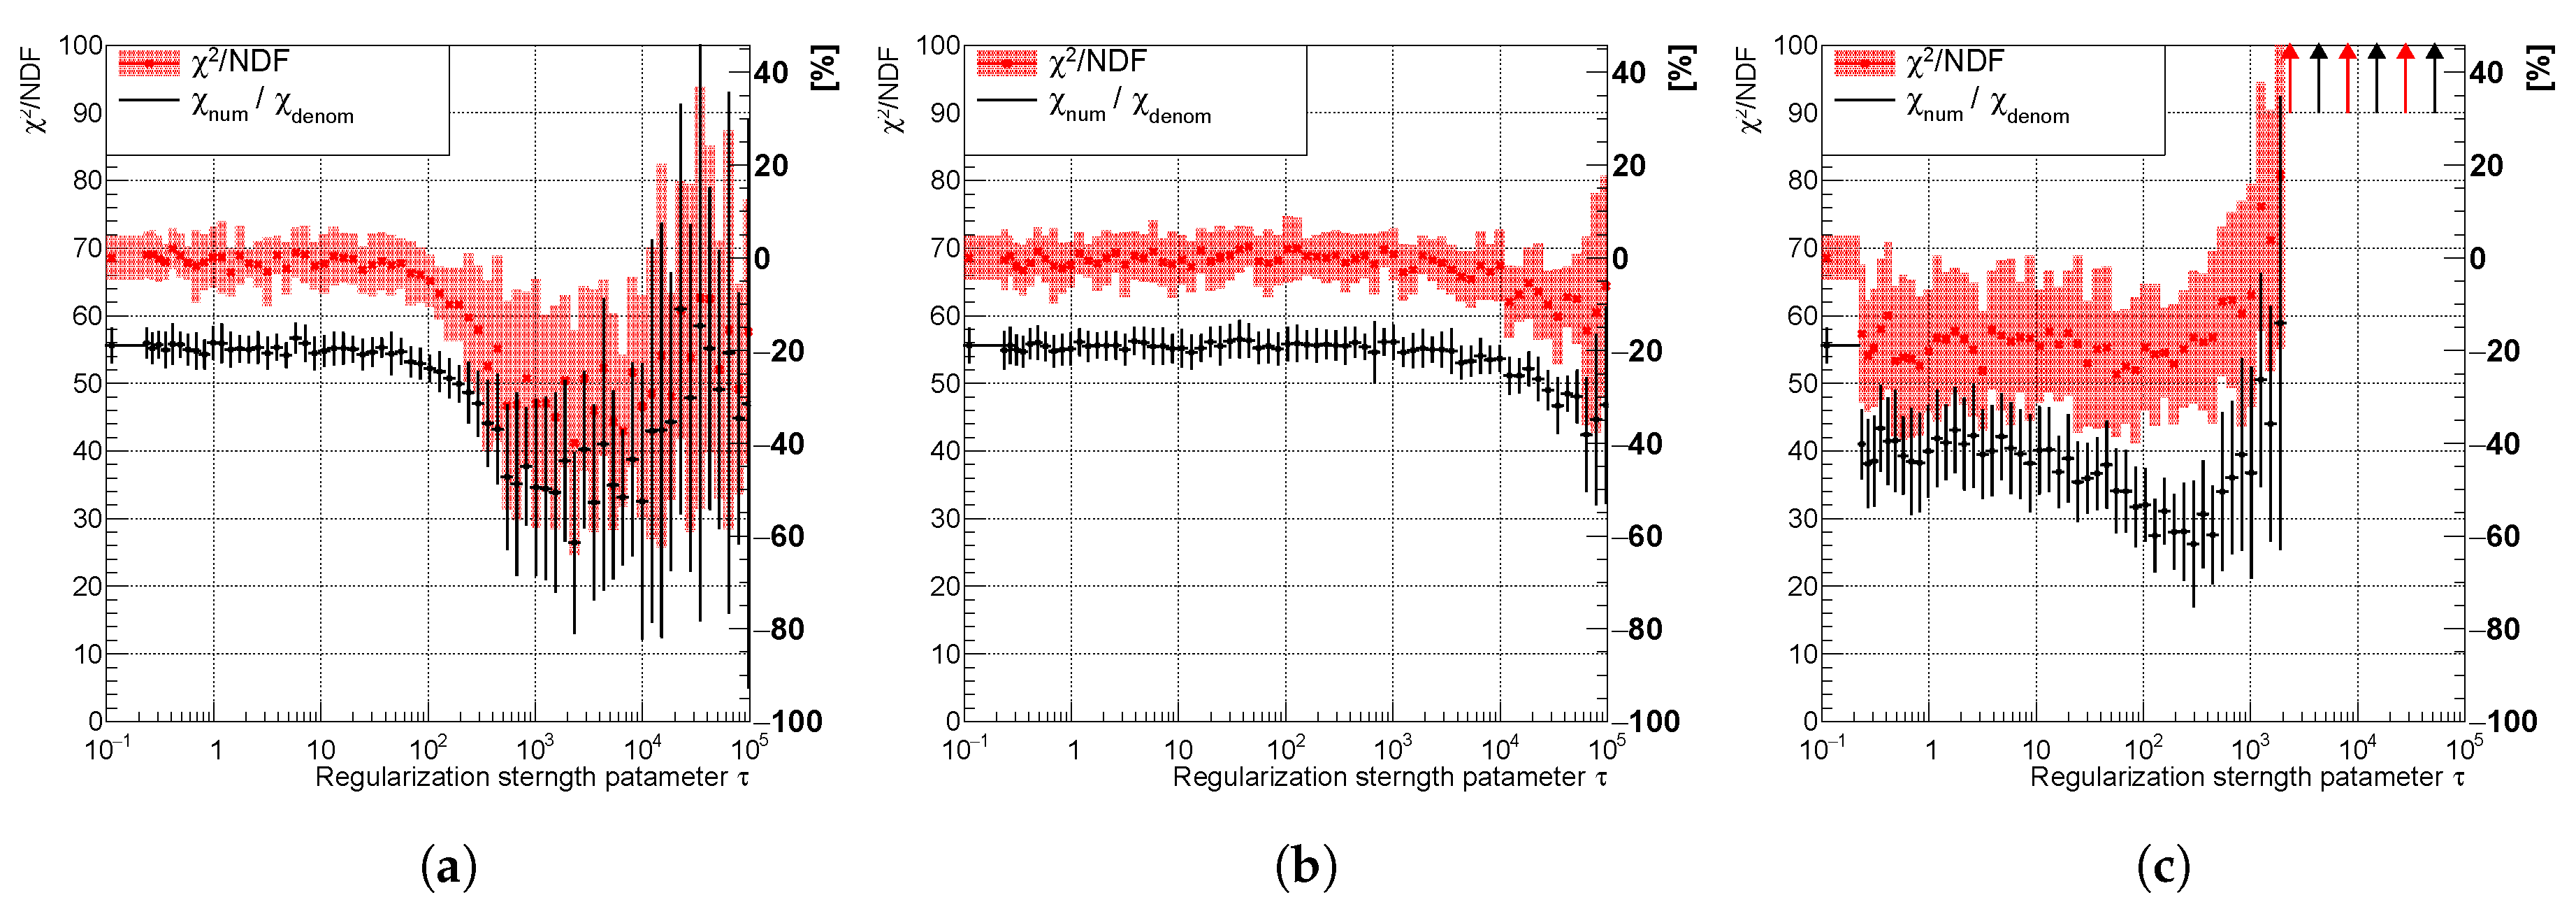
Figure 13.
Variables and of the spectrum using (a) curvature, (b) entropy, and (c) derivative regularization showing good correspondence. The uncertainty band is evaluated as a standard deviation over 20 independent unfolding runs initiated with different random seeds.
Figure 13.
Variables and of the spectrum using (a) curvature, (b) entropy, and (c) derivative regularization showing good correspondence. The uncertainty band is evaluated as a standard deviation over 20 independent unfolding runs initiated with different random seeds.
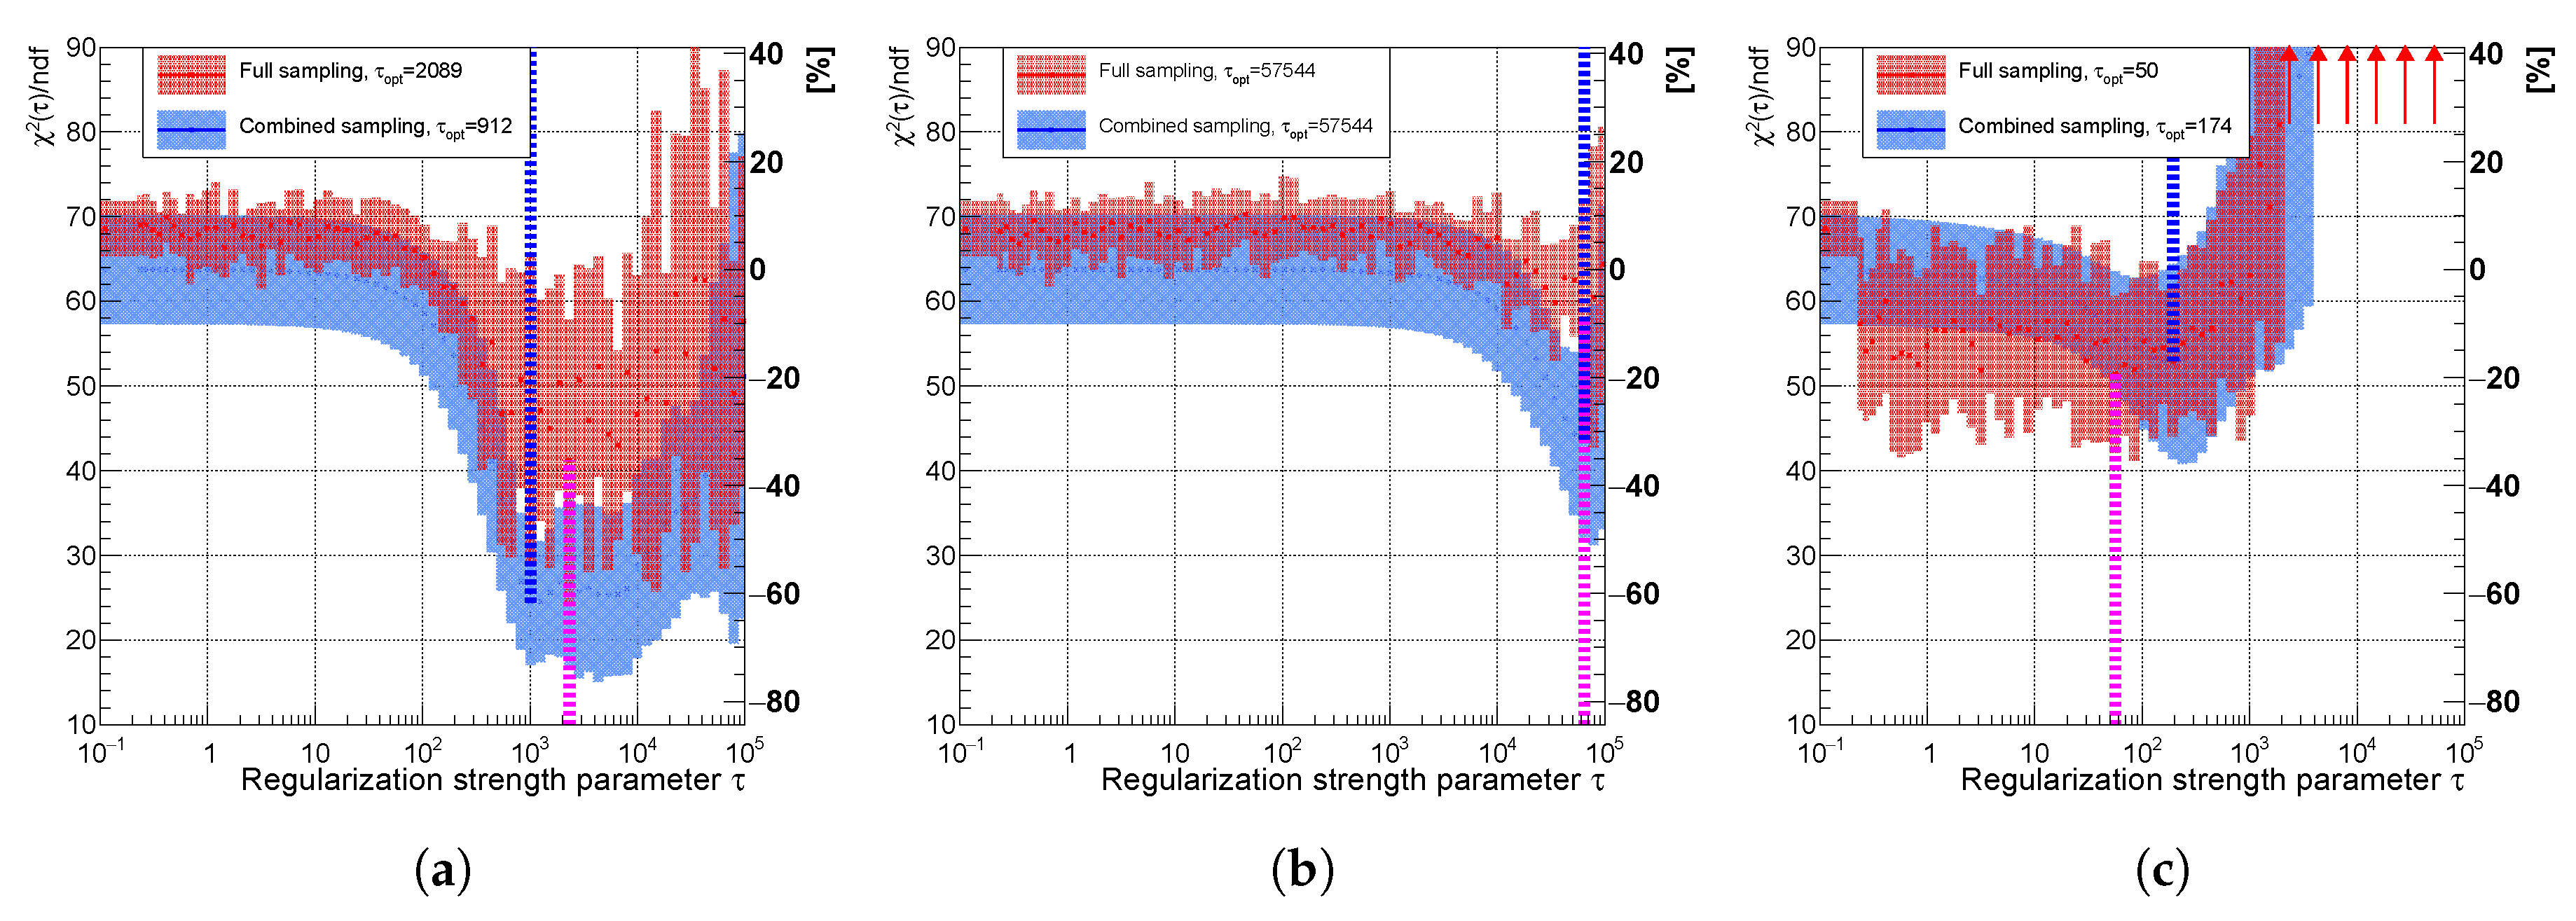
Figure 14.
Variable of the spectrum using (a) curvature, (b) entropy, and (c) derivative regularization comparing combined (faster) sampling (blue) and full sampling (red). The uncertainty band is evaluated as a standard deviation over 20 independent unfolding runs initiated with different random seeds. The vertical dotted lines indicate positions of minima for each sampling case.
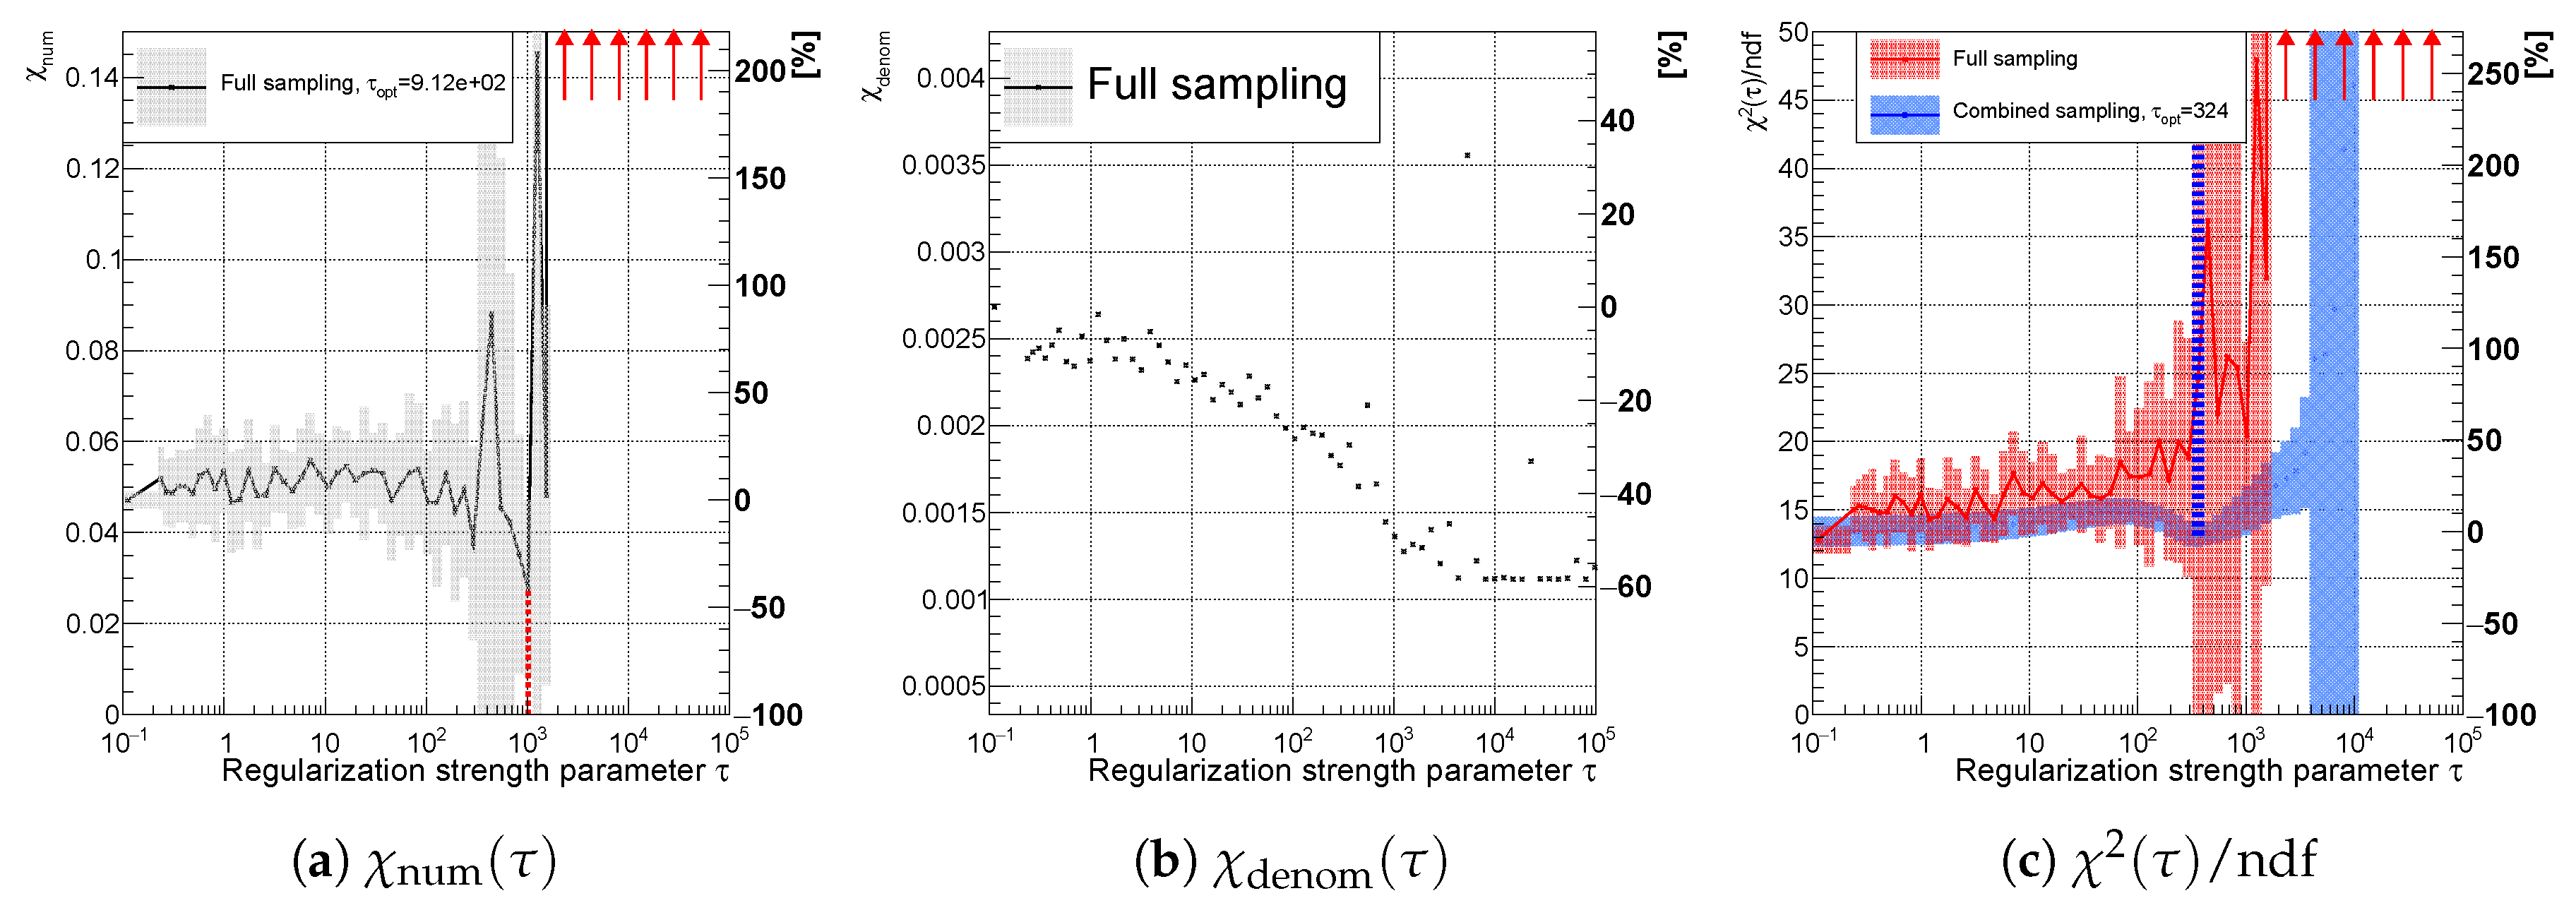
Figure 15.
Variables (a) , (b) for the full sampling method; and (c) using full (red) and combined (blue) sampling of the spectrum with an accidental minimum at (curvature regularization). The vertical dotted lines indicate positions of minima for each sampling case.
Figure 15.
Variables (a) , (b) for the full sampling method; and (c) using full (red) and combined (blue) sampling of the spectrum with an accidental minimum at (curvature regularization). The vertical dotted lines indicate positions of minima for each sampling case.
Figure 16.
The result of unfolding (a) without regularization (b) with regularization and (c) with regularization applied only at second half of the spectrum while using the curvature in the case of a accidental minimum in for one representative random seed.
Figure 16.
The result of unfolding (a) without regularization (b) with regularization and (c) with regularization applied only at second half of the spectrum while using the curvature in the case of a accidental minimum in for one representative random seed.
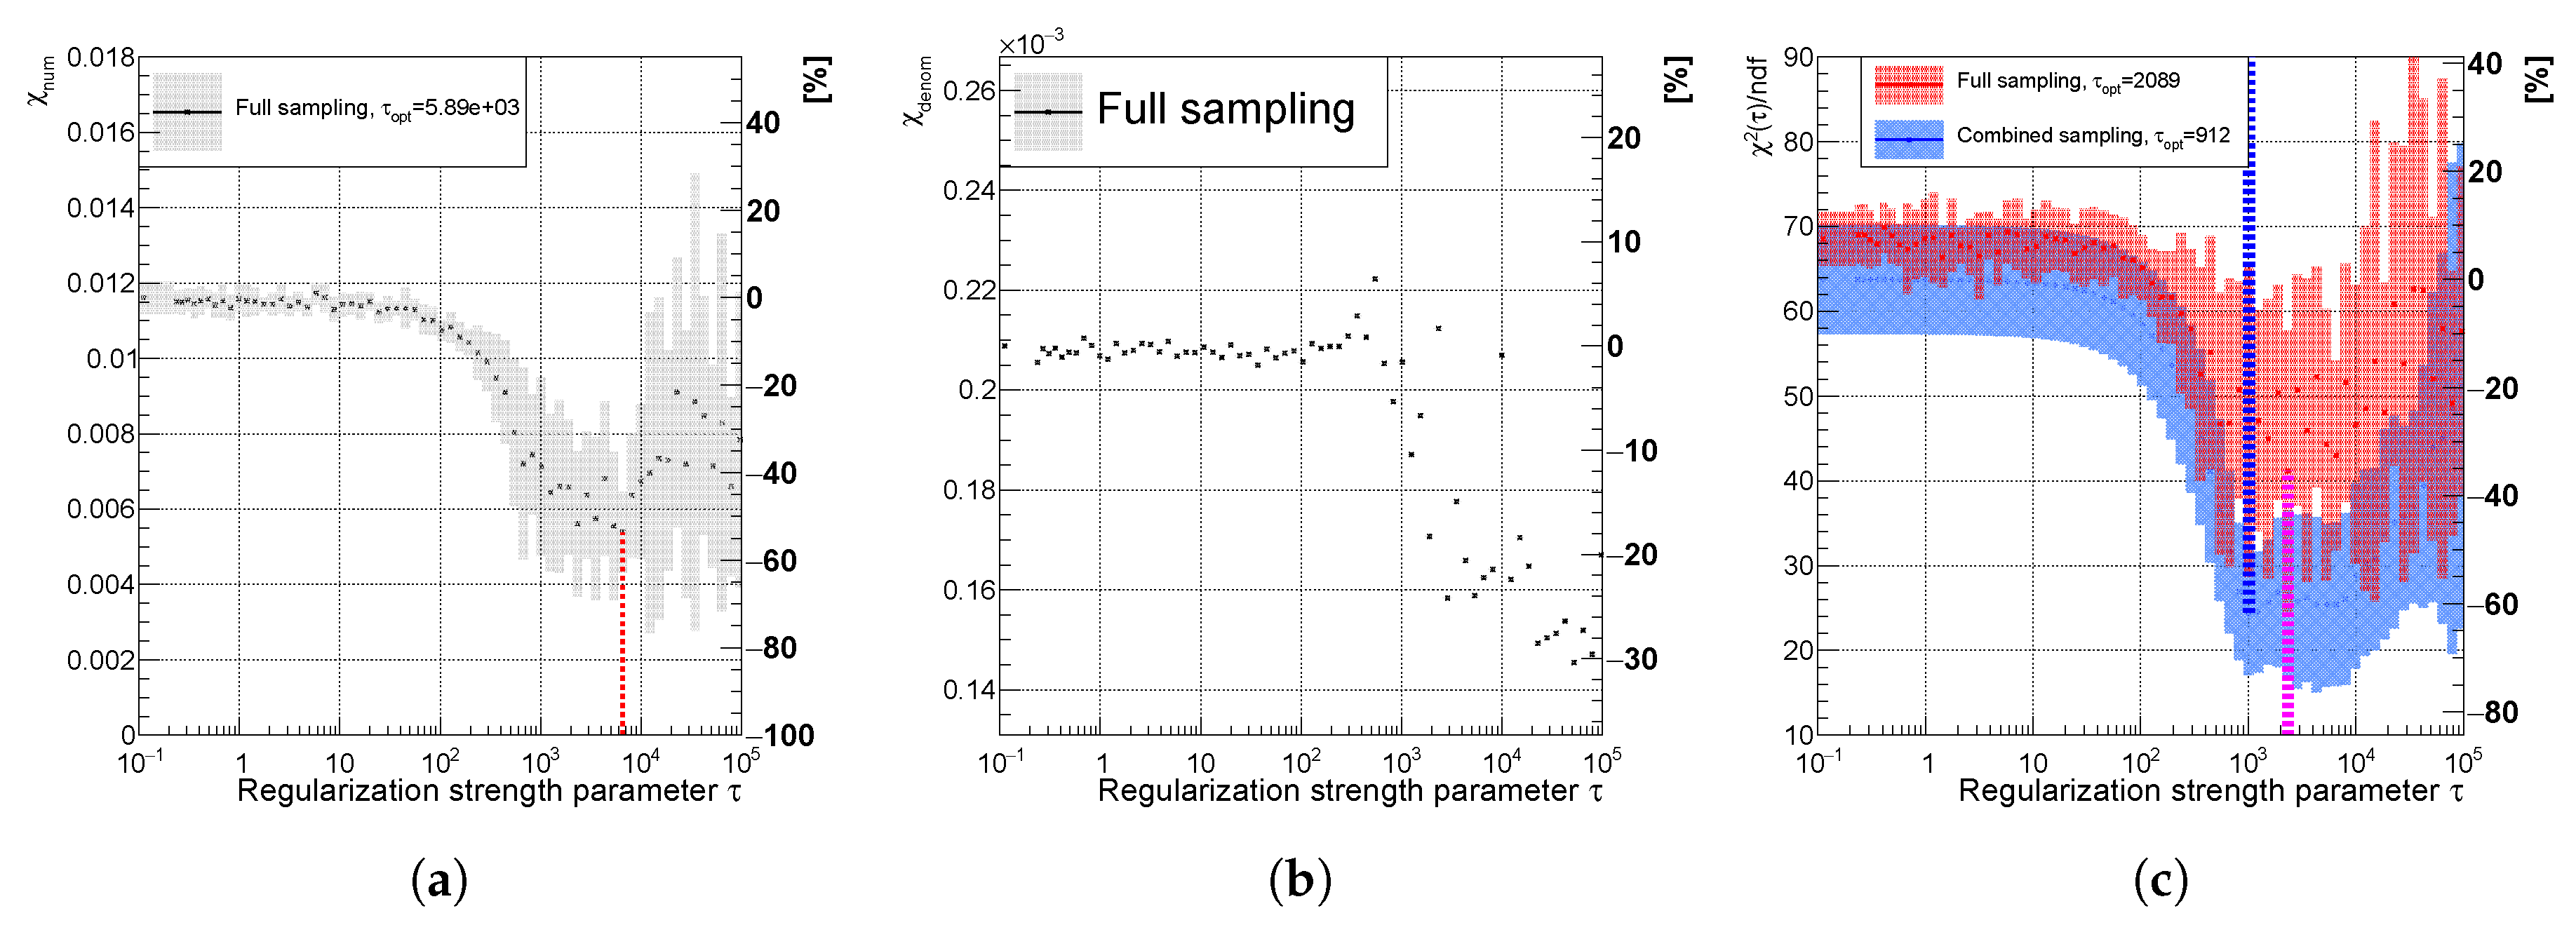
Figure 17.
Variables (a) , (b) for the full sampling method; and, (c) using full (red) and combined (blue) sampling of the spectrum with a vanishing minimum (derivative regularization). The vertical dotted lines indicate positions of minima for each sampling case.
Figure 17.
Variables (a) , (b) for the full sampling method; and, (c) using full (red) and combined (blue) sampling of the spectrum with a vanishing minimum (derivative regularization). The vertical dotted lines indicate positions of minima for each sampling case.
Figure 18.
Result of unfolding (a) without regularization and (b) with regularization of the spectrum using the derivatives in case of a hidden minimum in for one representative random seed. Spectrum becomes smoother, but does not improve due to the narrowing of posteriors.
Figure 18.
Result of unfolding (a) without regularization and (b) with regularization of the spectrum using the derivatives in case of a hidden minimum in for one representative random seed. Spectrum becomes smoother, but does not improve due to the narrowing of posteriors.
Figure 19.
Variables (a) , (b) for the full sampling method; and (c) using full (red) and combined (blue) sampling of the spectrum with the real minimum at (curvature regularization). The vertical dotted lines indicate positions of minima for each sampling case.
Figure 19.
Variables (a) , (b) for the full sampling method; and (c) using full (red) and combined (blue) sampling of the spectrum with the real minimum at (curvature regularization). The vertical dotted lines indicate positions of minima for each sampling case.
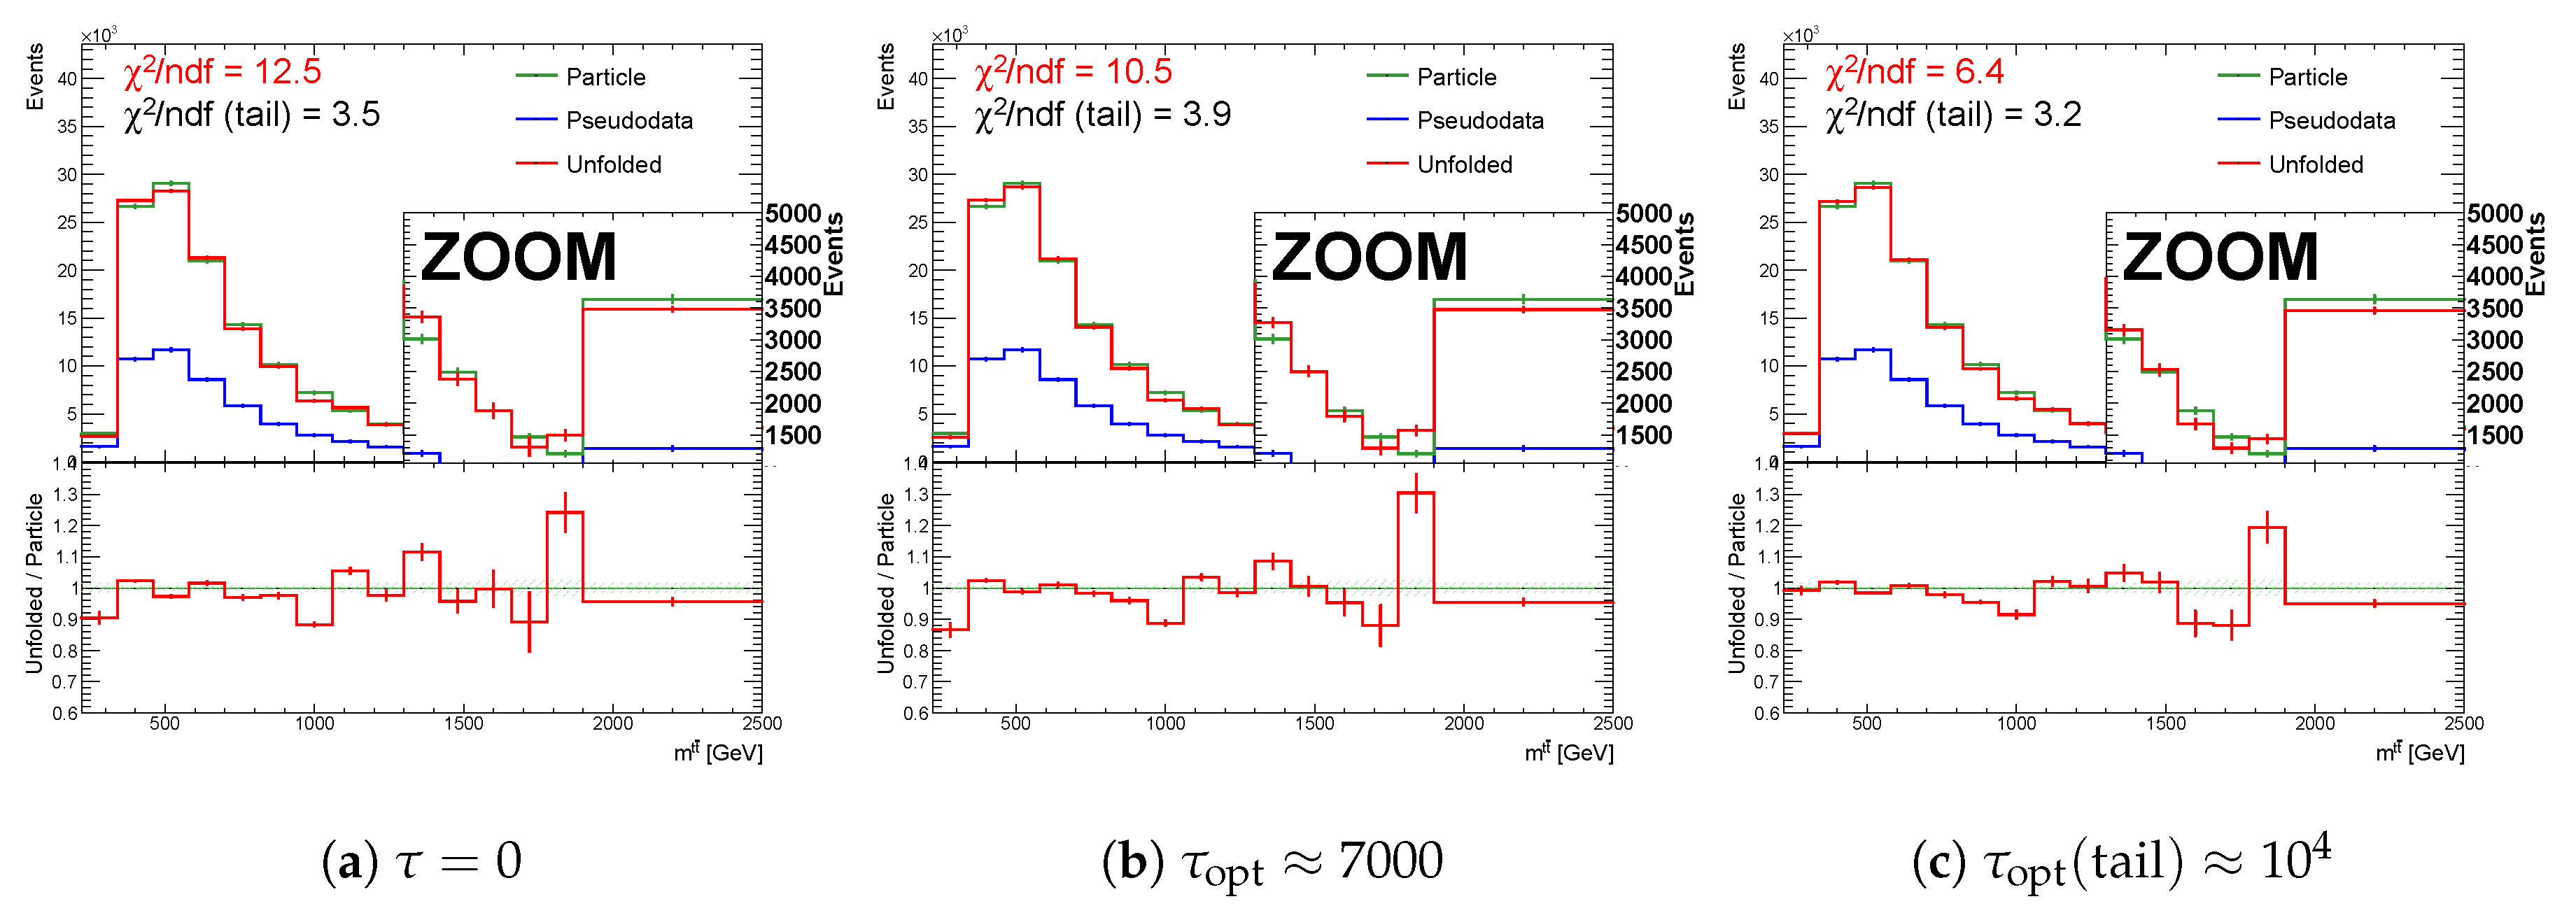
Figure 20.
The result of unfolding (a) without regularization and (b) with regularization of the spectrum while using the curvature in case of a real minimum in for one representative random seed.
Figure 20.
The result of unfolding (a) without regularization and (b) with regularization of the spectrum while using the curvature in case of a real minimum in for one representative random seed.
Figure 21.
Result of unfolding (a) without regularization and (c) with regularization of the spectrum using the curvature regularization for one representative random seed. Variable (b) while using full (red) and combined (blue) sampling of the spectrum with minimum at (curvature regularization). In this case, the regularization is not needed. The vertical dotted lines indicate positions of minima for each sampling case.
Figure 22.
Result of unfolding (a) without regularization and (c) with regularization of the spectrum using entropy regularization for one representative random seed. Variable (b) using full (red) and combined (blue) sampling of the spectrum with minimum at (entropy regularization). The vertical dotted lines indicate the positions of minima for each sampling case.
Table 1.
Results of minima type and basic characteristics of the migration matrix M: averaged on-diagonal factor and correlation matrix .
Table 1.
Results of minima type and basic characteristics of the migration matrix M: averaged on-diagonal factor and correlation matrix .
| Spectrum | Type | Minimum | Method | | |
|---|
| falling | Accidental | Curvature | 0.51 | 0.92 |
| falling | Hidden | Derivative | 0.48 | 0.86 |
| double-peaked | Real | Curvature | 0.75 | 0.93 |
| double-peaked | Real | Curvature | 0.49 | 0.94 |
| falling | Real | Entropy | 0.29 | 0.86 |
Table 2.
Relative curvature, entropy and derivatives of the unfolded spectra () with respect to the curvature, entropy, and derivatives of the particle level spectra.
Table 2.
Relative curvature, entropy and derivatives of the unfolded spectra () with respect to the curvature, entropy, and derivatives of the particle level spectra.
| Spectrum | Minimum | | | |
|---|
| Accidental | 1.1 | 1.0 | 2.7 |
| Hidden | 0.98 | 1.0 | 11 |
| Real | 1.1 | 1.0 | 0.96 |
| Real | 3.7 | 1.0 | 3.5 |
| Real | 14 | 0.97 | 11 |
Table 3.
Time needed to produce curve using combined sampling and full sampling for 68 points of in the region [0; ]. Time in seconds is rounded to hundreds.
Table 3.
Time needed to produce curve using combined sampling and full sampling for 68 points of in the region [0; ]. Time in seconds is rounded to hundreds.
| Spectrum | Minimum | [s] | [s] | |
|---|
| Accidental | 900 | 30,700 | 0.029 |
| Hidden | 1200 | 41,300 | 0.030 |
| Real | 600 | 14,500 | 0.039 |
| Real | 1000 | 33,700 | 0.029 |
| Real | 1300 | 44,700 | 0.030 |


