Article

Study on the Effects of the Wear-Rings Clearance on the Solid-Liquid Two-Phase Flow Characteristics of Centrifugal Pumps

College of Mechanical Engineering, Zhejiang University of Technology, Zhejiang 310023, China
*
Author to whom correspondence should be addressed.
Symmetry 2020, 12(12), 2003; https://doi.org/10.3390/sym12122003
Submission received: 17 November 2020 / Revised: 1 December 2020 / Accepted: 1 December 2020 / Published: 4 December 2020

Abstract

:
In order to study the wear law of the centrifugal pump flowing surface under different wear-rings clearance, the McLaury wear model was used to conduct the full-passage numerical simulation of solid-liquid two-phase flow in a single-stage single-suction centrifugal pump. The reliability of the numerical calculation method is verified by comparing the experimental data and numerical simulation results. The clearance is 0.1, 0.15, 0.2, 0.3 and 0.5 mm, respectively. The results show that the wear of the centrifugal pump blades is mainly concentrated in the end part and the inlet part of the blade, and the wear of the pressure surface at the end of the suction surface and the front of the blade is more serious. As the clearance increases, the maximum wear value in the impeller increases first and then decreases, reaching a maximum at 0.15 mm. With the increase of the clearance, the wear degree and the wear rate of the volute wall surface first increase and then decrease, and reach the maximum at 0.2 mm. With the increase of the clearance and the concentration of the fluid medium, the wear at the clearance of the centrifugal pump is more serious, and the severe wear area exhibits a point-like circumferential distribution.

1. Introduction

As a widely used fluid machine, the centrifugal pump is characterized by a simple structure, stable performance, simple operation, and convenient maintenance. However, the actual operating environment of the centrifugal pump is mostly in the river basin, and the fluid composition contains solid phase particles. With the flow of water, the solid particles continuously impinged and cut the surface of the passing parts of the centrifugal pump, making it lose its body. This impact and cutting can result in large punctured pits on the blade surface, irregular and serrated leaf blade edges, and the head and tail of the blade are gradually thinned, which, in turn, leads to blade failure. The wear at the ring causes the gap to become larger and a groove appears. It usually leads to a decrease in the operating efficiency of the centrifugal pump and affects the safe operation of the centrifugal pump and shortens the service life of the centrifugal pump over current components [1]. Studying the wear law of the over-current components in the centrifugal pump under the sandy water flow is of great significance for mastering the flow, vibration characteristics, and safe operation of the centrifugal pump under the solid-liquid two-phase flow.
Wu [2] used the continuum model to calculate the relative velocity and concentration distribution of solid particles in the pump fluid medium. The results show that the volume fraction and relative velocity of solid particles at the front of the blade and the rear cover increase with the rise of the solid particle size. As the particle size increases, the volume fraction of solid particles on the wall of the pressurized water chamber increases, while the relative speed decreases accordingly. Liu [3] used the mixture model to simulate the flow field of the centrifugal pump, and studied the trajectory of the solid phase with the liquid phase in the flow field from four variables: sediment concentration, density, particle size, and flow. He finds that the nature of the particle itself-density and particle size have a greater impact on the distribution and movement of the particle. The larger the density and particle sizes are, the larger the particle is. It is easy to deflect to the working surface under the action of inertial force. Nonetheless, it cannot simulate the movement trajectory of the particles in the discrete phase in the flow field. Therefore, if the movement of the particles is to be tracked, the Euler model cannot be accurately solved [4]. Since the interaction force between the liquid phase and the solid phase in the solid-liquid two-phase is complex, additional interface force models are usually required. Therefore, for two-phase fluid media, the two-phase interface force is an important development direction for future research [5].
For the particle trajectory model, the calculation method is the Euler-Lagrangian method [6] with regard to the fluid as the continuous phase and the particles as the discrete phase. The flow field, the physical properties of the fluid medium, and the geometric size of the particles are all reference factors for the force between the particles. This model also needs to track the particle motion of solid particles, and then use a statistical average to time-average a large number of particle motions. The advantage of the particle trajectory model is that it can describe the movement of solid particles in detail, and can obtain the particle speed, flow field, and wear characteristics at any point. Its disadvantage is that it needs to track a large number of particle trajectories, which is time-consuming and requires higher computer requirements. This model is mostly used in systems with fewer particles to solve the particle trajectory equation [7]. Li [8] used the Euler multiphase flow model, the extended standard k-ε turbulence equation, and the SIMPLEC(Semi-Implicit Method for Pressure Linked Equations) algorithm to numerically simulate the solid-liquid two-phase turbulence in the impeller of the swirl pump, and found that the solid particles are mainly distributed in the swirl and the working surface of the flow pump. The concentration and particle size of the solid phase all have an impact on the hydraulic performance of the cyclone pump, which is mainly reflected in the head and efficiency, and the concentration is more serious. Peng [9] used the Euler-Lagrangian method to study mud pumps. The two factors of flow and concentration were simulated and calculated separately, and the wear rate was calculated using the wear prediction model. Chen [10] regarded quartz sand as a discrete phase to study the solid-liquid two-phase flow of the centrifugal pump, and assumed that the particle shape was spherical, and used the particle trajectory model to analyze its trajectory in the flow field and in different processes. Under the condition of the wear of the impeller, the wear rule of the impeller can be obtained.
When compared with the particle trajectory model, the calculation results of the dual-channel model can be compared with the measured results in the Euler coordinate system, and the results of numerical simulation can be used to a greater extent. Therefore, this paper will select the two-fluid model to analyze the flow field and wear of the centrifugal pump.
In order to link the wear of equipment wall materials with many variables, scholars have proposed wear equations or wear models under different conditions based on a large number of wear experiments. Tabakoff [11] used coal ash particles and metal wall collision experiments and observed the resulting wall wear, and proposed a multi-parameter solid particle wear empirical equation including particle collision speed and the particle collision angle. The wear rate is defined as the ratio of the mass of the wall material lost after the impact to the total mass of the colliding particles. This model has been widely used in the numerical simulation of solid particles at home and abroad to calculate the wear rate of solid particles on metal walls. McLaury B. S [12] proposed a new type of wear equation, which includes the effects of the physical properties of the material surface, the incident speed of solid particles, the incident angle, and the shape of the particles. Oka [13,14] and others also put forward a prediction equation of the metal wall wear rate with wear-related parameters as variables through a large number of wear experiments.
Qian [15] numerically simulated the fluid medium containing solid particles in a double suction centrifugal pump by numerical simulation of the multi-phase flow model. The results show that, due to the low flow velocity near the ring, the sediment will not be carried by the high-speed moving water flow to the outlet of the centrifugal pump, and it is easy to accumulate and form a high particle concentration fluid, resulting in rapid wear of the ring.
Huang [16] used the experimental method to conduct a wear test on a clean water pump under different flow rates, different solid particle sizes, and different solid particle concentrations, and obtained the influence of various parameters on the wear position and extent of the pump impeller. The experimental results show that the impeller wear is more serious when the fluid flow rate is larger, the solid particle diameter is larger, and the fluid contains high particle concentration, and the main wear part is at the impeller inlet turn.
Wang [17] used a particle orbit model to simulate the internal flow field of the centrifugal pump with different particle sizes. The results show that, with the increase of particle size, the slip speed of the solid phase of the centrifugal pump over-flow wall increases overall, increased solid phase concentration of the blade face, the solid phase concentration of the non-working surface decreases, and the solid phase shifts to the working surface decreases. The solid phase concentration of the non-working surface decreases, and the solid phase shifts to the working surface. The severely worn area is in the blade head and the tail of the blade’s non-working surface.
Some other scholars have also done related research [18,19,20]. The research on the wear characteristics of centrifugal pump particles mainly focuses on the impeller and the overcurrent components, while the wear characteristics of the wear-rings particles are relatively less. The wear characteristics of the wear-rings particles are beneficial for the safe operation of the pump station and prolong the service life of the centrifugal pump.
In this paper, based on a numerical method and Fluent software, the Euler two-phase mixing model, k-ε turbulence model, and McLaury wear model were used to study the wear law of the centrifugal pump flowing surface under different wear-rings clearance.

2. Method

2.1. Calculation Model

The single-stage single suction centrifugal pump IS80-50-250 is taken as the object of modeling. The IS pump(Single-stage single-suction centrifugal pump) is designed in accordance with the performance and size specified by the international standard IS02858. The IS80-50-250 single-stage single-suction centrifugal pump is widely used in industrial and urban drainage, water supply, and used in agricultural irrigation and water supply. The representativeness of this pump is selected as the research object. The main hydraulic design parameters: Q = 50 m3/h (Q means flow rate), H = 80 m (H means head), and n = 2900 r/min (n means Rotating speed). Figure 1a shows a schematic diagram of the pump body and parts of a single-stage single-suction centrifugal pump. Figure 1b is the clearance diagram of the straight orifice ring of the centrifugal pump, where L represents the clearance length and d represents the clearance size.
Figure 2 is the three-dimensional modeling diagram of the computational fluid domain of the centrifugal pump. The fluid domain refers to the area that the fluid medium can reach in the centrifugal pump. In the figure, the computational fluid domain is composed of the inlet extension tube, the cavity, the impeller, the volute, and the outlet extension tube. The cavity is divided into the front cavity and the back cavity. The shape of the blade is a twisted blade, the balance of the impeller has a balance hole, the volute is spiral, the section is irregularly rectangular, and the outlet section is circular.
The main parameters of the model pump are shown in Table 1 below.

2.2. Meshing and Boundary Conditions

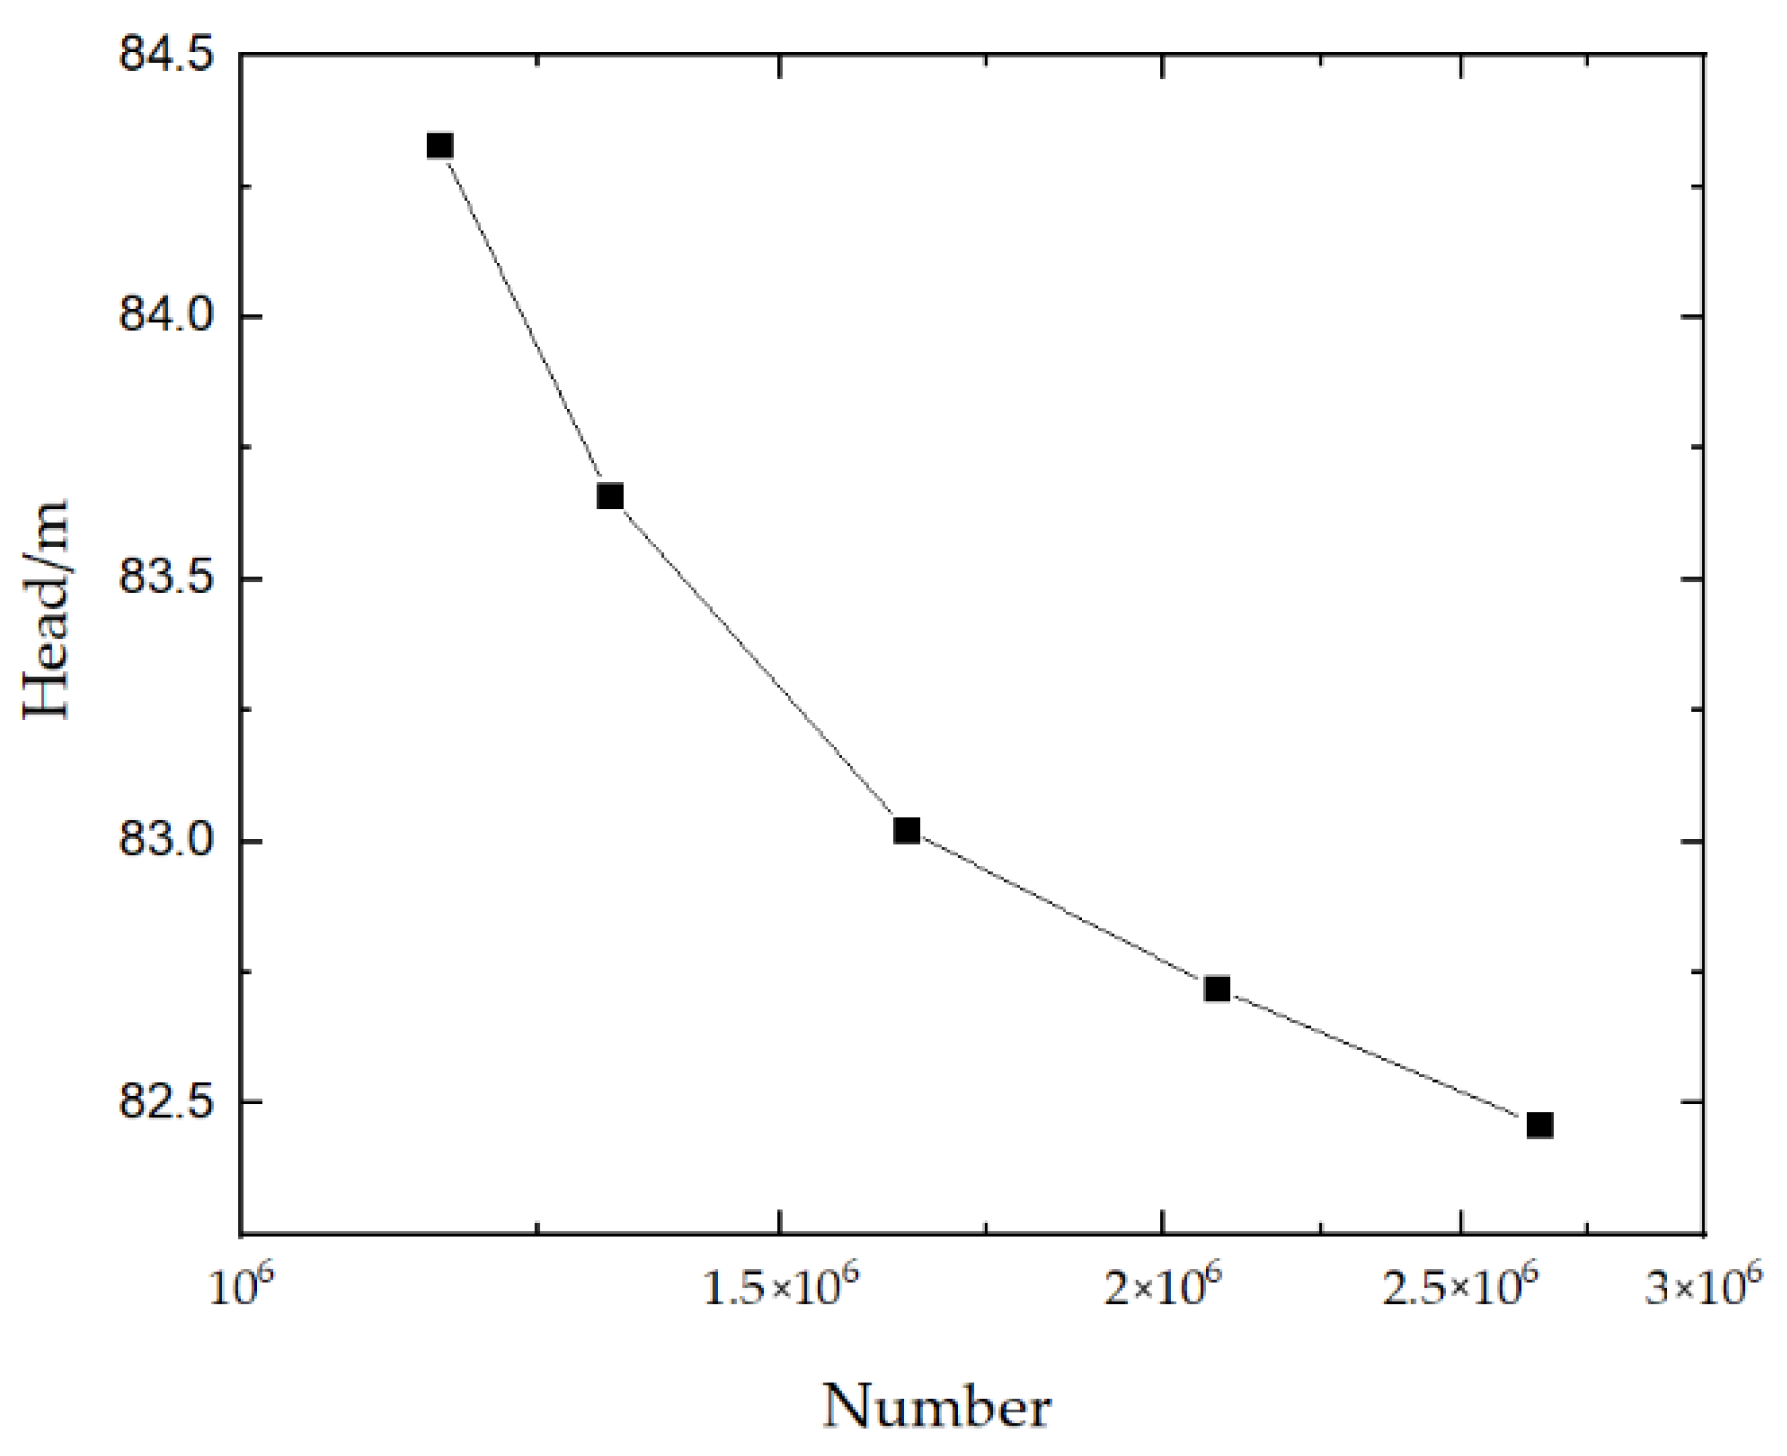
The computational grid is generated by ICEM (The Integrated Computer Engineering and Manufacturing code for Computational Fluid Dynamics) using a hybrid grid, as shown in Figure 3. Both the inlet extension tube and the outlet extension tube are cylindrical cylinders of a regular shape, which are cut by the O-shape, as shown in Figure 3a. The geometry of the volute and the impeller is more complicated, and the unstructured mesh is adopted. The geometrical size of the volute tongue is small and the flow is complicated, while the mesh is encrypted, as shown in Figure 3b,c. The structure of the anterior cavity and the posterior cavity is relatively simple and adopts a structured grid, as shown in Figure 3d,e. Finally, the inspection grid quality is above 0.4, which meets the requirements of a numerical simulation calculation. In addition, check the grid independence, as shown in Figure 4, when the total number of grids is 2.08 million, the error of the analog head value is within 2%, and the calculation is not too complicated. Therefore, the total number of grids is 2.08 million.
The Euler model is used to calculate the solid-liquid two-phase flow. The turbulence calculation models are standard k-ε models. The sliding grid is used for the part that belongs to the impeller fluid domain, and the rest is selected for the stationary coordinate system. The Wen-Yu model is selected. The boundary conditions of the inlet are all speed imports, and the boundary conditions of the outlets are all free flow. The impeller rotation speed is set to 2900 r/min, and the wall roughness is set to 0.04 mm. Among them, the liquid phase in the overflow wall surface and the sandy water flow adopt the non-slip wall boundary condition, while the solid phase adopts the free slip wall boundary condition. Since the reference pressure has no effect on calculating the external characteristics of the centrifugal pump, the reference pressure is set to 0 Pa. The convergence accuracy is set to 10−4.

2.3. Governing Equation

The Eulerian multiphase flow model is widely used in the simulation of a multi-phase flow. In addition, the standard k-ε turbulence model can also obtain more consistent and accurate conclusions with experimental data [21,22,23,24,25]. Therefore, the Euler multiphase flow model and the standard k-ε turbulence model were selected. The k-ε model introduces two new variables in the Navier-Stokes equation.
Assuming that the total number of phases of the multiphase flow in general is N, then the conservation equation of the qth phase is [26,27]:
( α q ρ q ) t + · ( α q ρ q v q ) = P = 1 n m ˙ P q
The momentum equation is:
( α q ρ q v q ) t + · ( α q ρ q v q v q ) = α q P + · [ τ q ] + F q + P = 1 n ( K P q ( v P v q ) ) + m ˙ P q v P q
[ τ q ] is the qth phase known as the stress-strain tensor, which can be obtained by the following formula.
τ q , i j = α q μ q ( u q , j x j + u q , i x i ) 2 3 α q μ q δ i j u q , i x i
Turbulent viscosity:
μ t , q = ρ q C μ K q 2 ε q
where αq is the volume fraction of the phase q, u is the instantaneous velocity, F is the interphase force, g is the acceleration of gravity, ρ is the density, μ is the dynamic viscosity, and λ is the volume viscosity [28].

2.4. Wear Model

In the wear calculation of solid-liquid two-phase flow in the centrifugal pump, the velocity of fluid medium and the concentration distribution of solid particles are important parameters to study the internal flow field. The McLaury model is widely used in calculating the solid-liquid two-phase flow wear in hydraulic machinery, and this wear model considers the effects of speed and concentration. Therefore, based on the wear model proposed by McLaury, the distribution law of wear rate of centrifugal pump overcurrent components is obtained through the following calculation.
The calculation formula for this model is as follows [12]:
W R = 2.17 × 10 7 × ( B H ) 0.59 F p v p 2.41 F ( φ )
F ( φ ) = 5.4 φ 10.11 φ 2 + 10.93 φ 3 6.33 φ 4 + 1.42 φ 5
E R = q m W R / A c e l l
where WR is the weight loss rate of grinding, BH is brinell hardness of the wall material, and FP is the particle shape coefficient. The solid phase is angular particles, and FP = 1 is taken. In addition, vp is the speed of the solid phase, m/s, φ is the solid-phase incident angle, rad, ER is the wear rate, qm is the solid phase mass flow rate, kg/s, and Acell is the area of the grid wall of the calculation unit. When the material of the centrifugal pump is unchanged, it can be seen from the formula that the wear rate is related to the incident collision velocity, incident collision angle, and mass flow rate of the solid phase.

2.5. Verification of a Numerical Simulation Method

The model pump with a ring gap of 0.15-mm was verified by numerical simulation experiments at different flow rates. Figure 5 below is a schematic diagram of a centrifugal pump test bench. The test bench mainly includes water tanks, test pumps, pressure gauges, torque meters, flow meters, and piping systems.
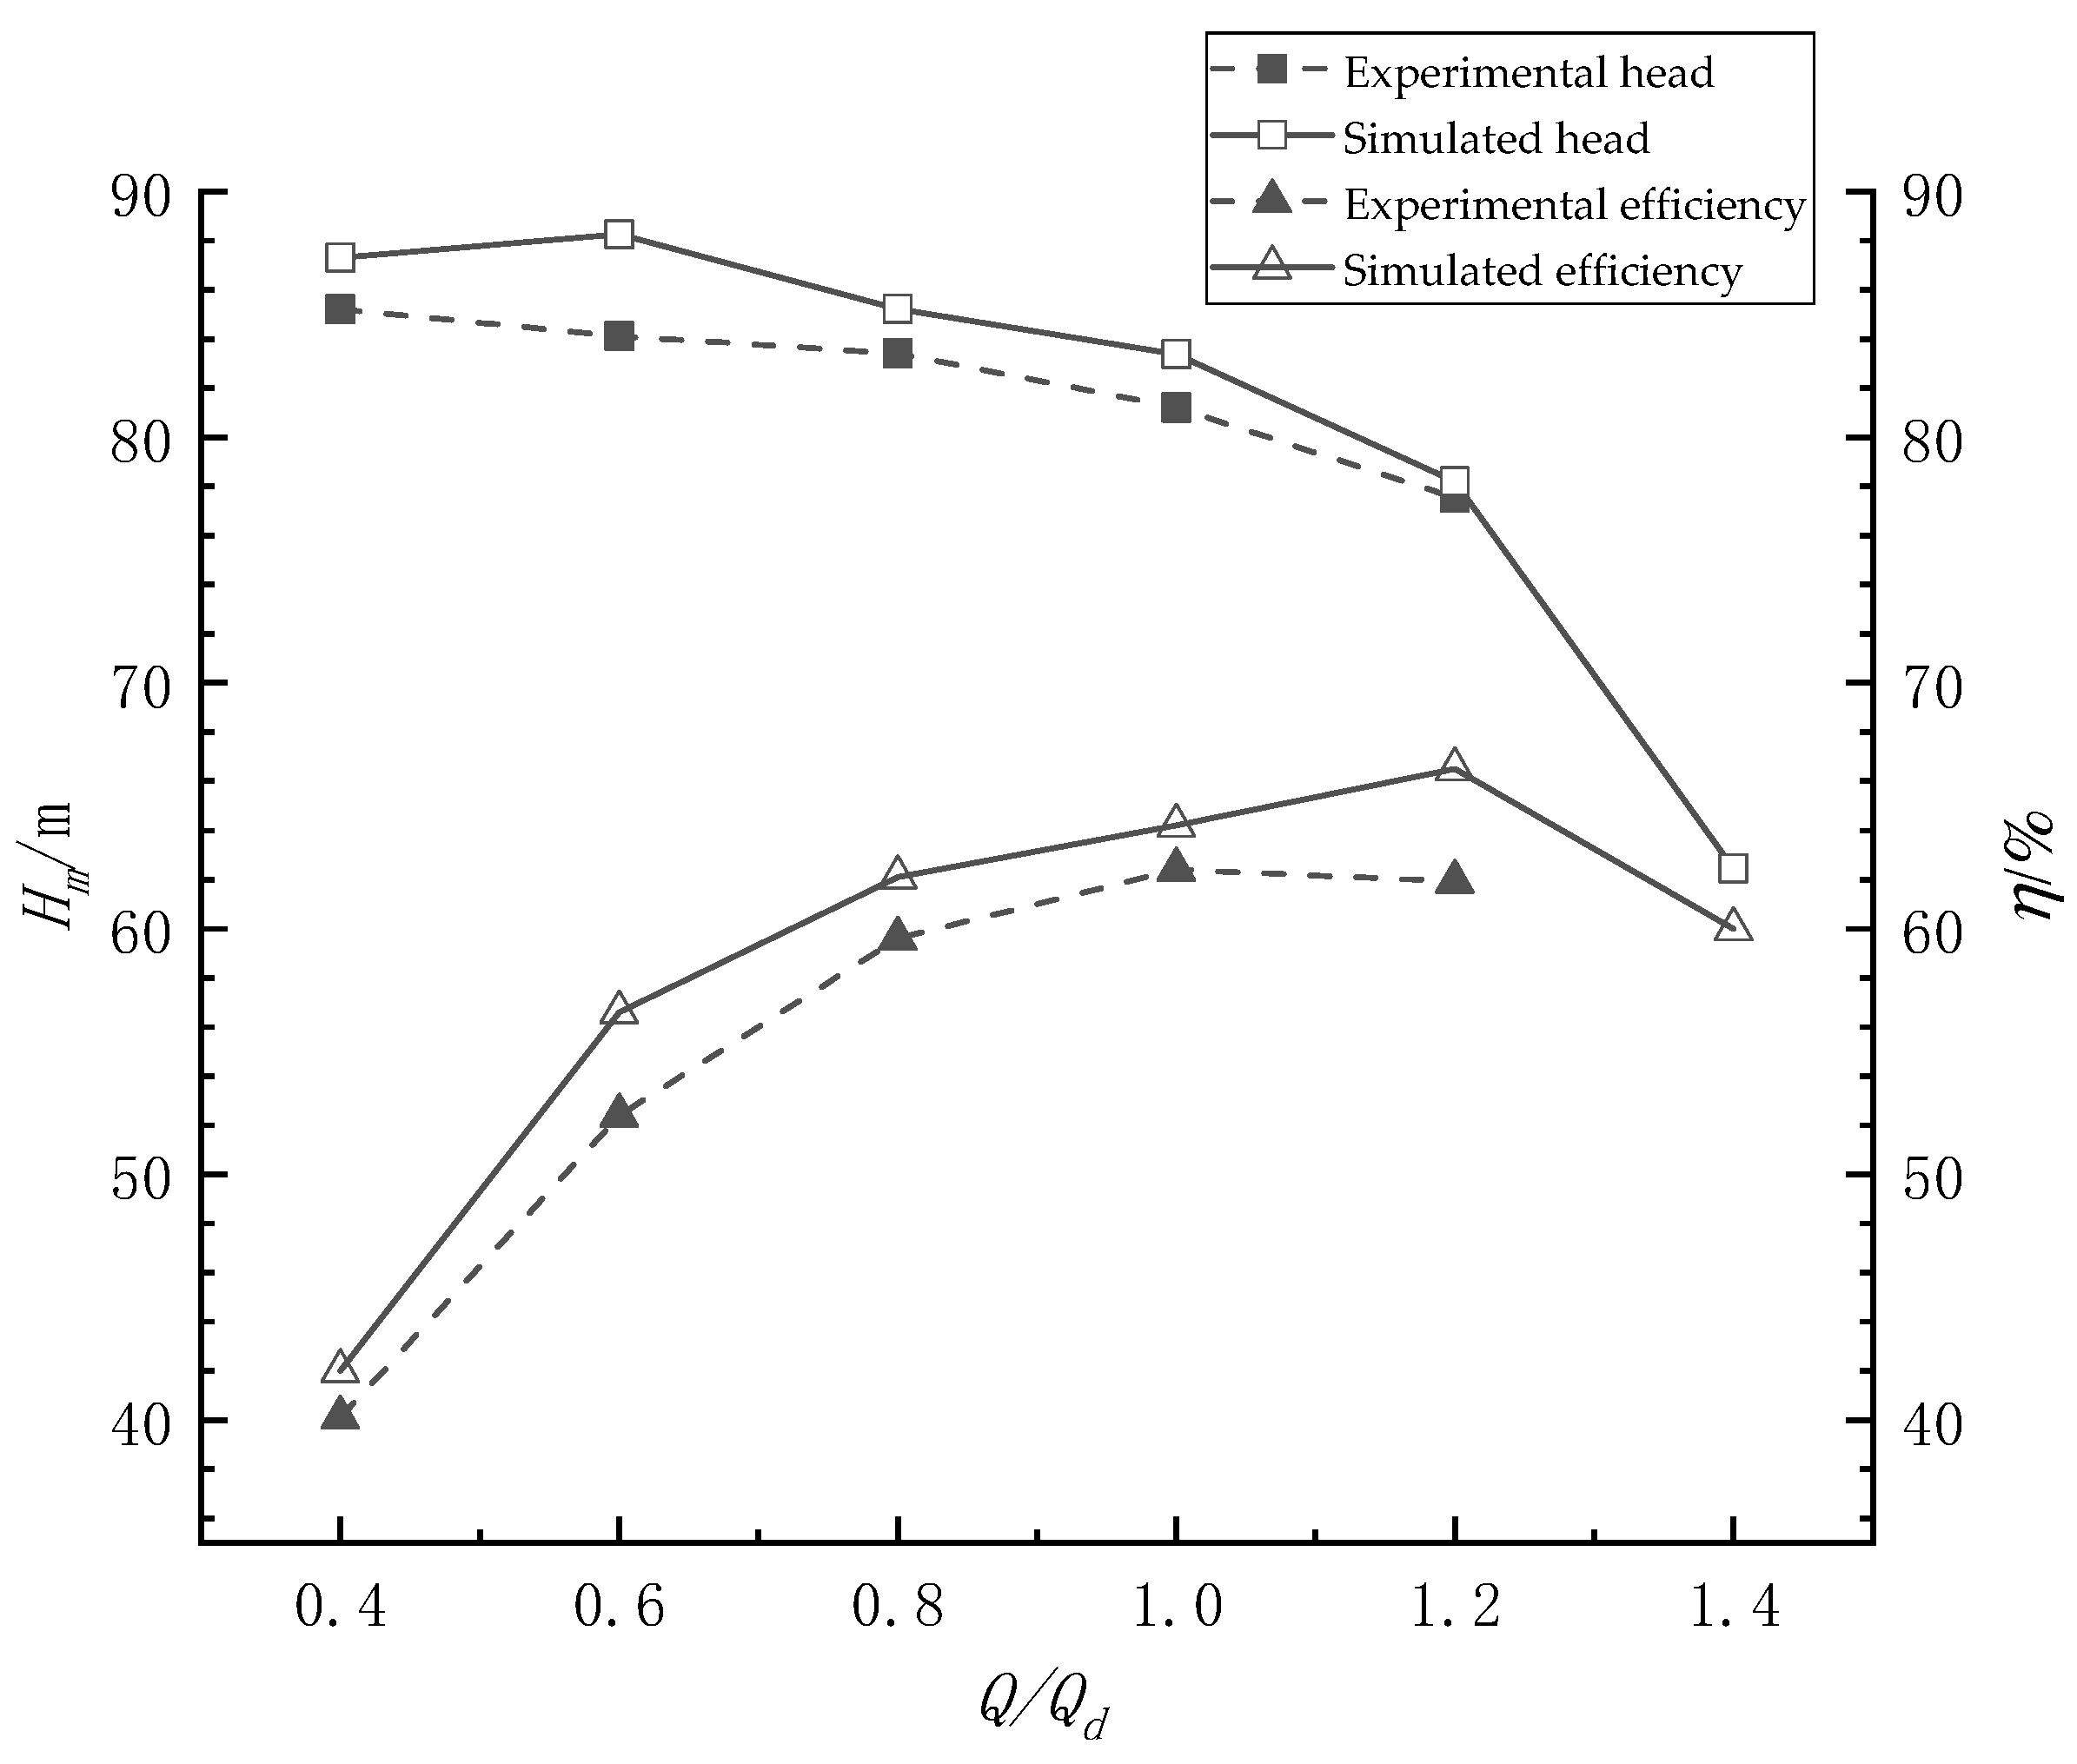
Figure 6 shows the external characteristic curve of the centrifugal pump test bench and the numerical simulation when the water medium is clean. Except for the 0.6 working condition, the simulated head increases and the hump phenomenon occurs. Under other conditions, the simulated head and the test head have a tendency to decrease with the increase of flow, and the drop gradient of head gradually increases. While the simulation efficiency and test efficiency graphs first increase with the increase of flow, and then decrease, because this model pump designed is biased toward large flow conditions, the efficiency value reaches the maximum value under 1.2 operating conditions, which is slightly greater than the efficiency value under standard conditions. According to Figure 6, the simulated values of head and efficiency are slightly larger than the experimental values. This is due to the insufficiency and roughness of the centrifugal pump wetted parts manufacturing process under actual conditions.
Compare the magnitude of the corresponding simulation and test values in the curve in the figure below. The error values are all within 5%, which meets the calculation requirements.

3. Results and Discussions

3.1. Effects of Wear-Rings Clearance on External Characteristics of Centrifugal Pump

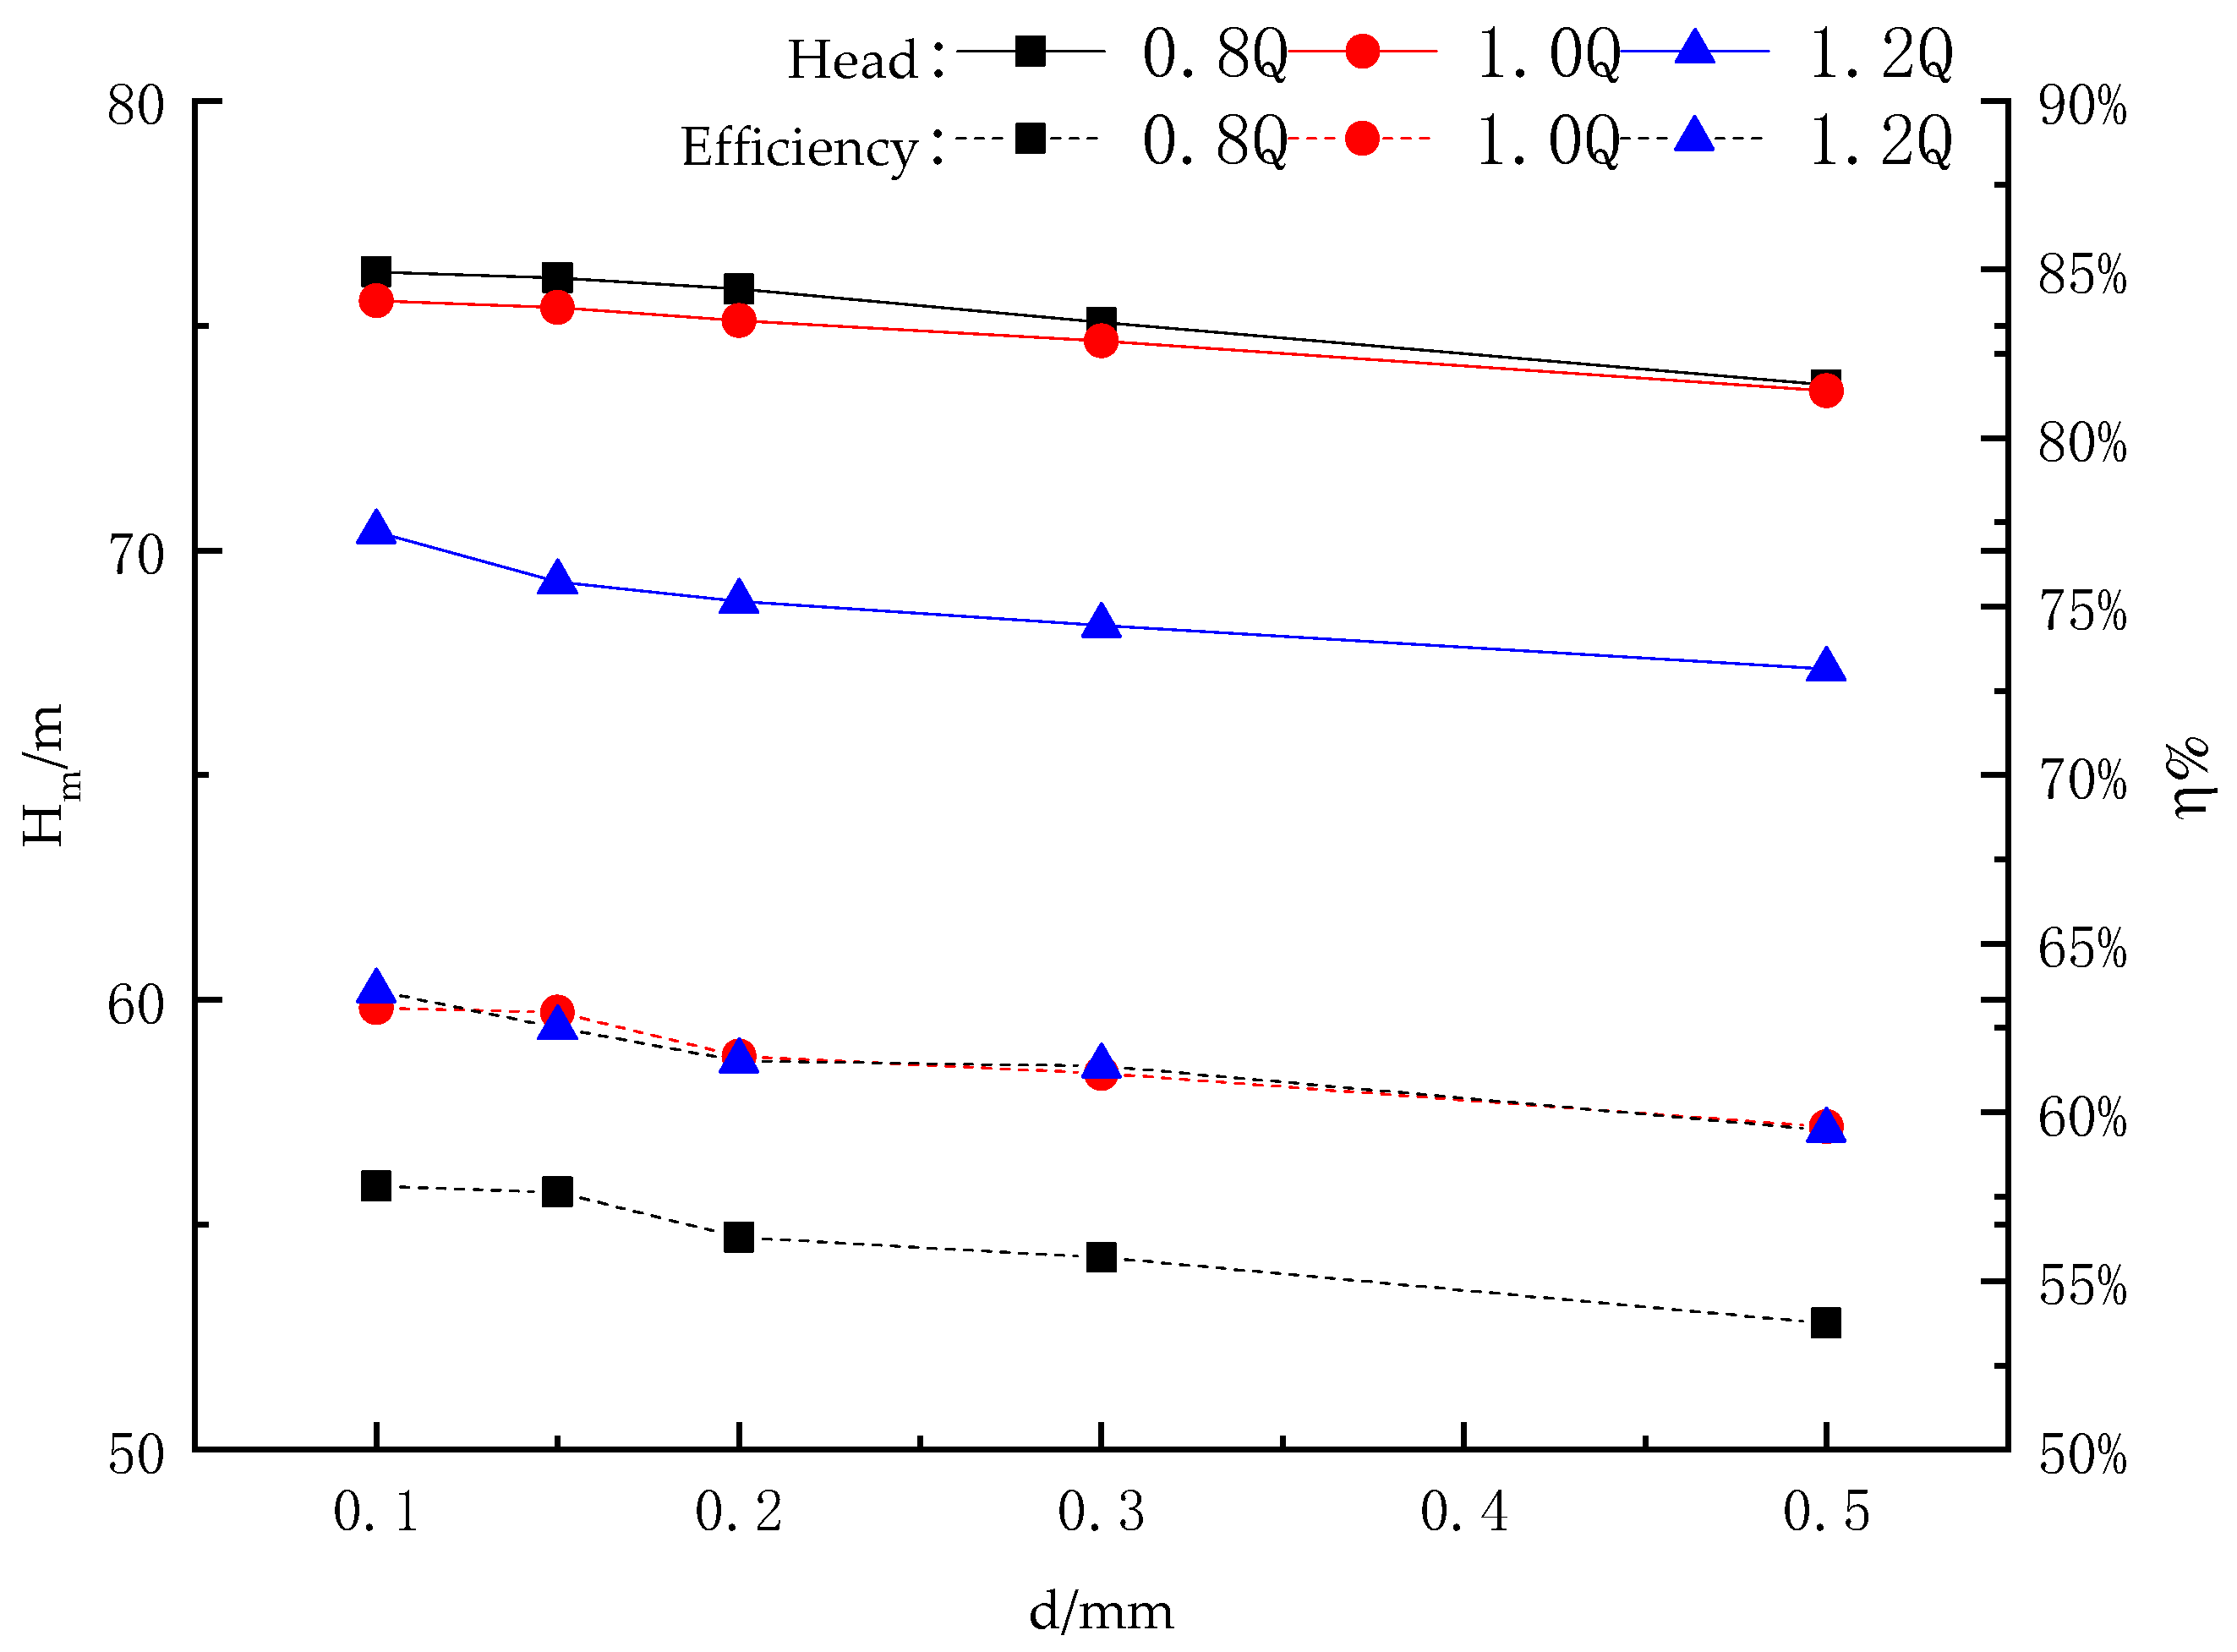
As shown in Figure 7, in the performance curve of the centrifugal pump under the condition of sand concentration under a different opening ring clearance d, three working conditions: 0.8q, 1.0q, and 1.2q are selected for numerical simulation analysis of the centrifugal pump. Flow-head curve and flow-efficiency curve are significant performance curves of centrifugal pumps. According to the curve of the wear-rings clearance d and the head of the centrifugal pump in the upper part of Figure 7, it can be seen that, under the same clearance, the head of small-flow is the highest, the head of large-flow is the lowest, and the head declines faster. The head in the small-flow is more similar to the standard. The head of the centrifugal pump in small-flow is the highest when d = 0.1 mm. The head of the centrifugal pump tends to decrease as the clearance increases in the same conditions. When d = 0.5 mm, the downward trend of head in large-flow is the fastest. The larger the flow, the more clear the impact of the change in clearance on the external characteristics of the centrifugal pump. The larger the clearance, the more energy leaked, making the head decrease faster.
The efficiency graph of the centrifugal pump is located at the bottom of Figure 7. In the figure, the abscissa represents the gap of the mouth ring, the ordinate H represents the head, and η represents the efficiency. The efficiency of the centrifugal pump under the sandy condition increases with the increase of the flow no matter how the clearance changes. This may be because the research object shifted the highest efficiency point to a large flow to ensure the efficiency at high flow conditions. When the clearance increases, the efficiency decreases in the three flow conditions.

3.2. Unsteady Clearance Flow Analysis

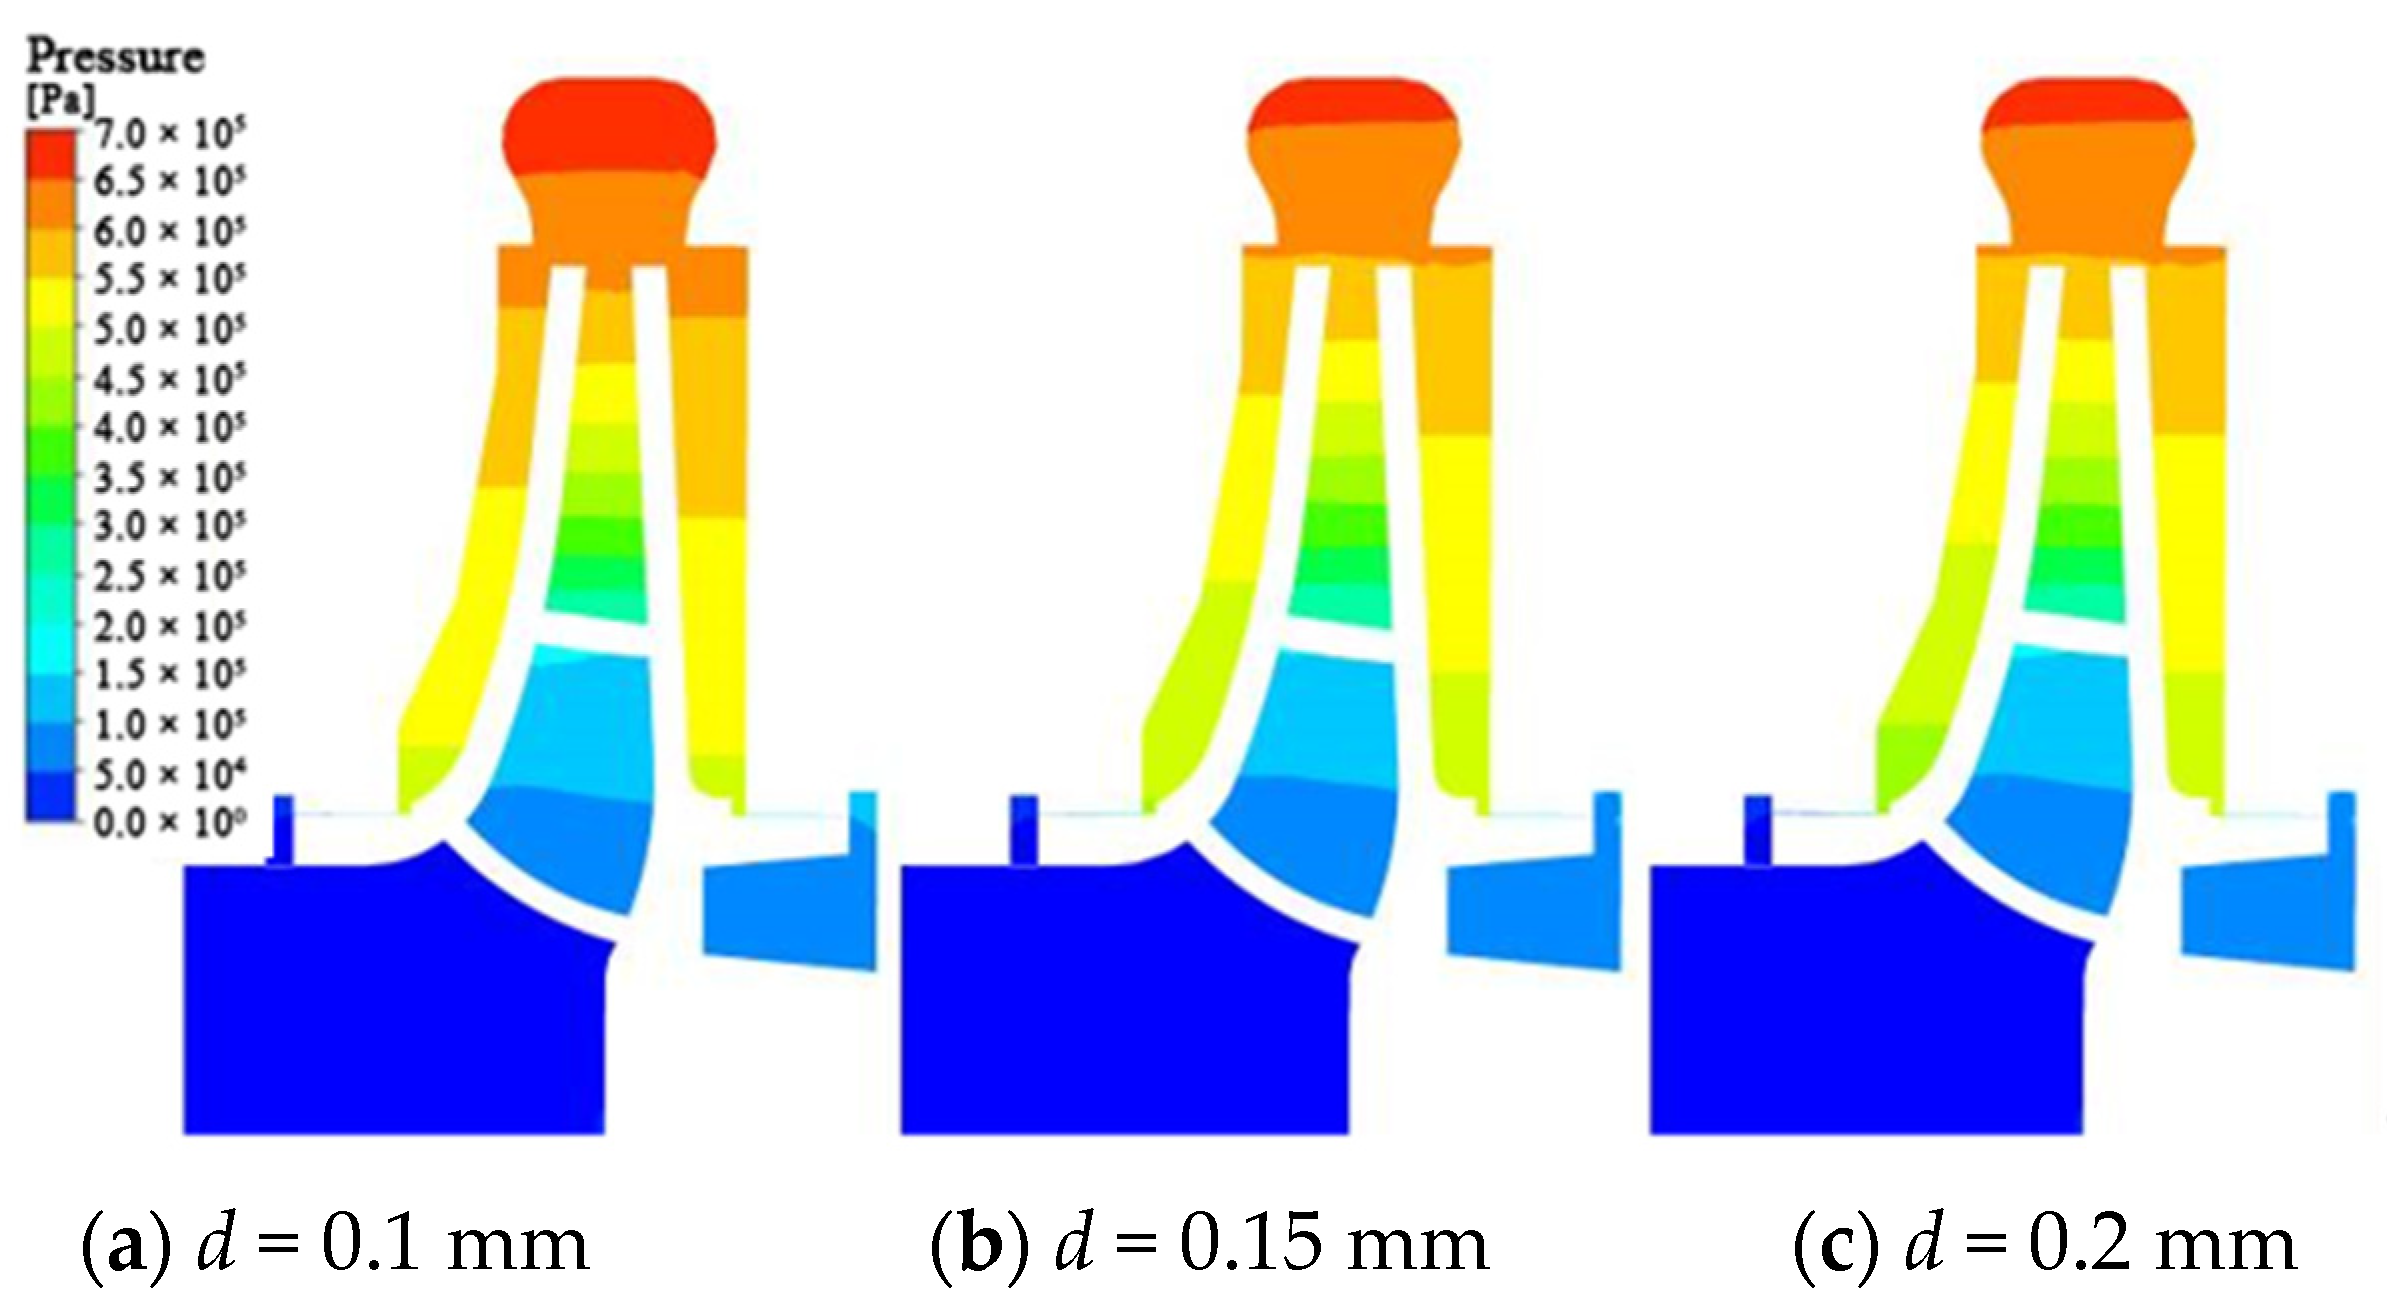
In order to study the working condition of the experimental pump in most working hours, the internal flow field of the centrifugal pump is analyzed under the standard working condition, i.e., Q = 50 m3/h. Figure 8 shows the instantaneous static pressure distribution diagram of the centrifugal pump under different clearances under standard working conditions, and studies the pressure distribution in the centrifugal pump under a different clearance with sandy water. As can be seen from the pressure nephogram of the cross section of the centrifugal pump in Figure 6, the pressure distribution of each flow channel in the impeller is very regular and symmetrical in the center, except the flow channel near the tongue. There is a pressure accumulation near the septum tongue, and a small pressure drop occurs in the diffusion tube area connected to it. At the same time, the internal flow field distribution is basically the same while the clearance is different and the internal pressure of the centrifugal pump impeller increases with the radial gradient. This is because the centrifugal force generated by the rotation of the impeller does work for the fluid in the impeller passage. The larger the radius, the greater the centrifugal force suffered by the fluid, and the more work is done. The more kinetic energy is converted to pressure energy, the higher the static pressure value is. The pressure near the inlet of the impeller is the lowest and the pressure distribution is relatively uniform, while the pressure near the outlet of the impeller is higher. However, the pressure distribution is not uniform. This non-uniformity is mainly caused by the geometric asymmetry of the volute and the static interference. The pressure on the working surface of the blade is higher than that on the non-working surface, which is mainly caused by the inertial force and viscous force of the fluid in the flow passage. It can also be seen from the figure that the pressure gradient of the middle section of the impeller gradually decreases with the increase of the clearance. From the blade inlet to blade outlet, the clearance increases, the pressure in the area near the blade inlet increases, and the pressure in the area near the blade outlet decreases. Then the head tends to decrease, corresponding to the relationship between clearance and head in Figure 7.
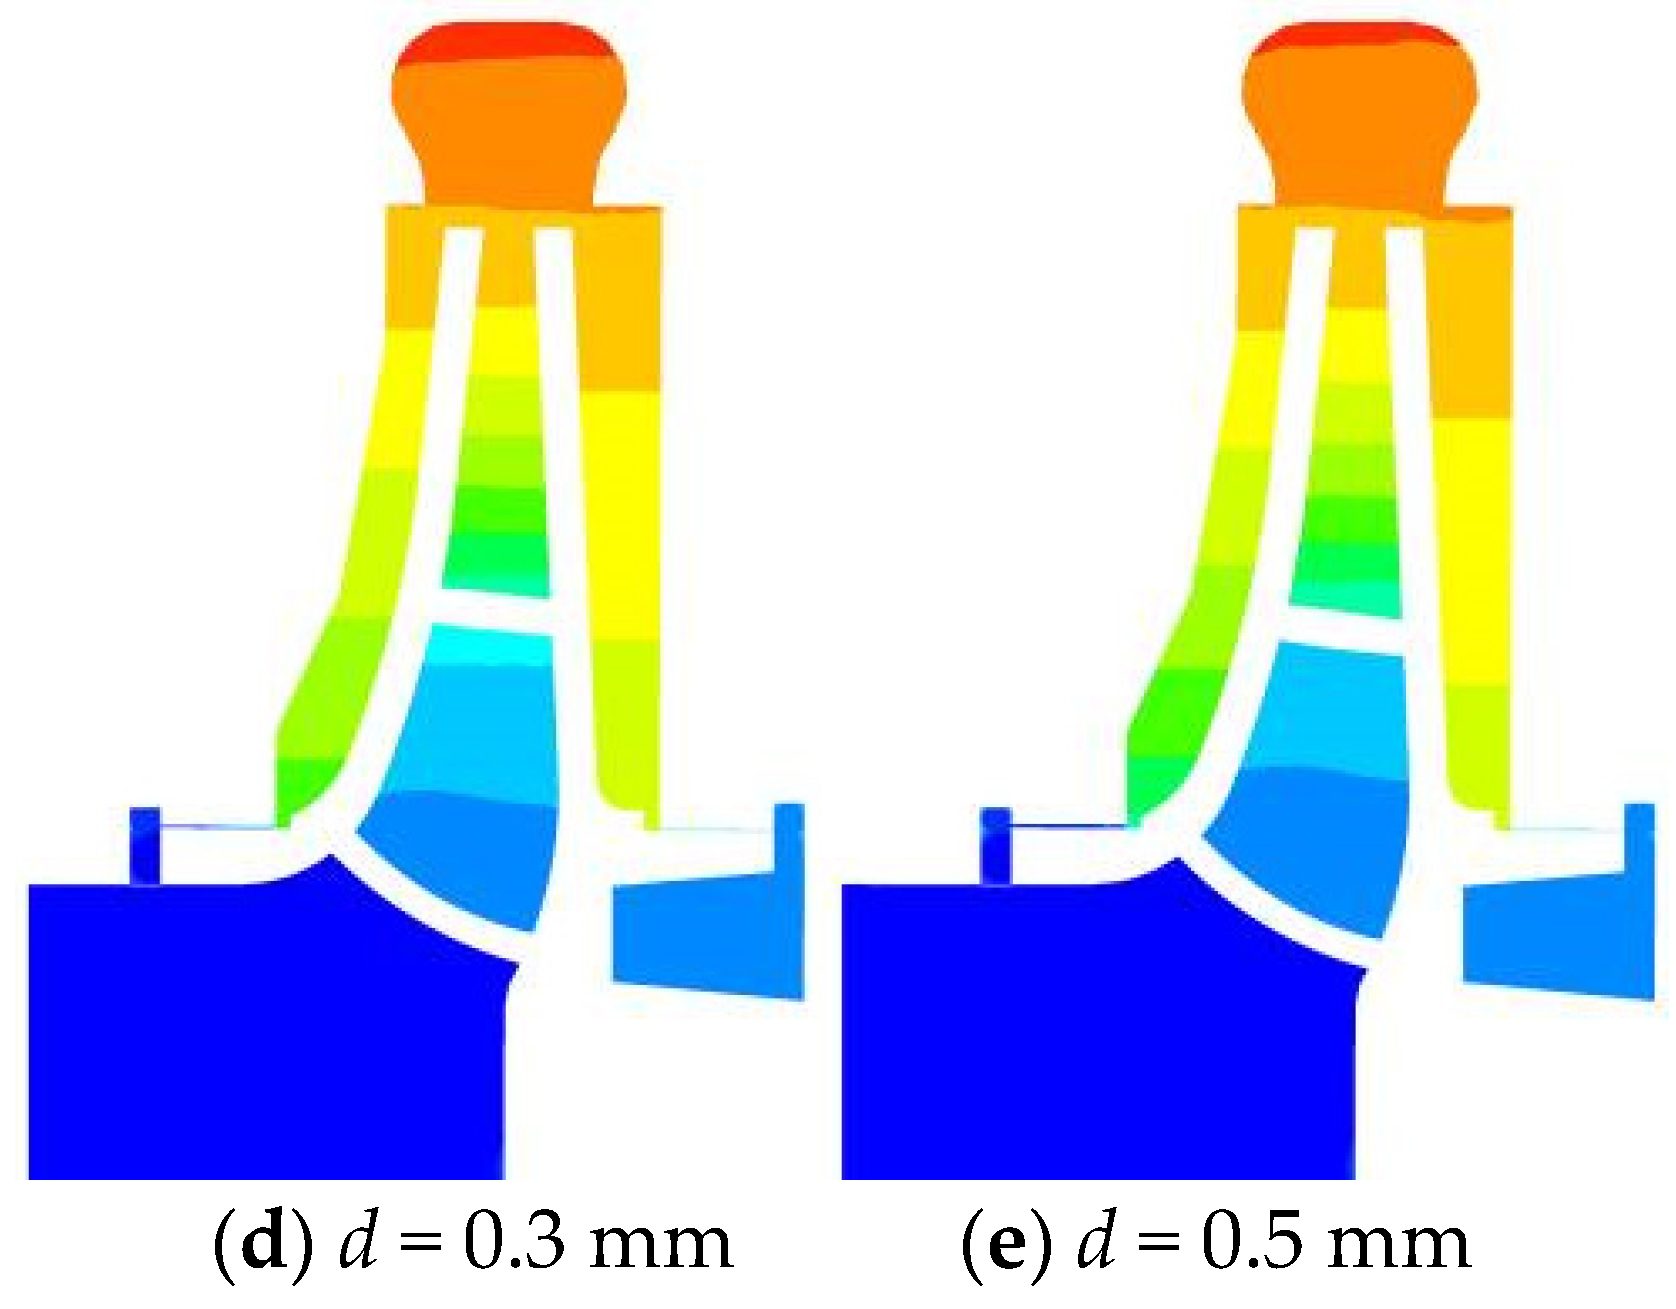
Figure 9 is the static pressure distribution diagram of section y = 0 containing sand water at the same time in different clearance under the design condition. The section y = 0 can be more comprehensive to see the pressure changes in the whole passage of the centrifugal pump, mainly including the front chamber and the back chamber, which is easy to ignore when studying the internal flow of the centrifugal pump. As can be seen from the figure, the pressure inside the impeller has a change, but the range of change is relatively small. From the change of clearance from 0.1 mm to 0.5 mm, it can be clearly seen that the pressure gradient of the front cavity is small when the clearance is 0.1 mm. The change of clearance of the front wear-ring mainly has a significant impact on the pressure of the front cavity and the overall pressure is basically consistent with the pressure at the outlet of the impeller. As the clearance becomes larger and the pressure gradient increases, the pressure near the inlet wear-ring of the front chamber decreases and the low-pressure area gradually expands. Since the clearance size of the rear ring remains unchanged, the pressure in the back chamber decreases in a small range but does not change significantly. With the increase of clearance, the high-pressure area in the volute gradually decreases and the change is clear. Therefore, when the clearance between the front wear-ring increases, the main effect on the front cavity is relatively large, so that the average pressure of the front cavity decreases and the pressure gradient increases.
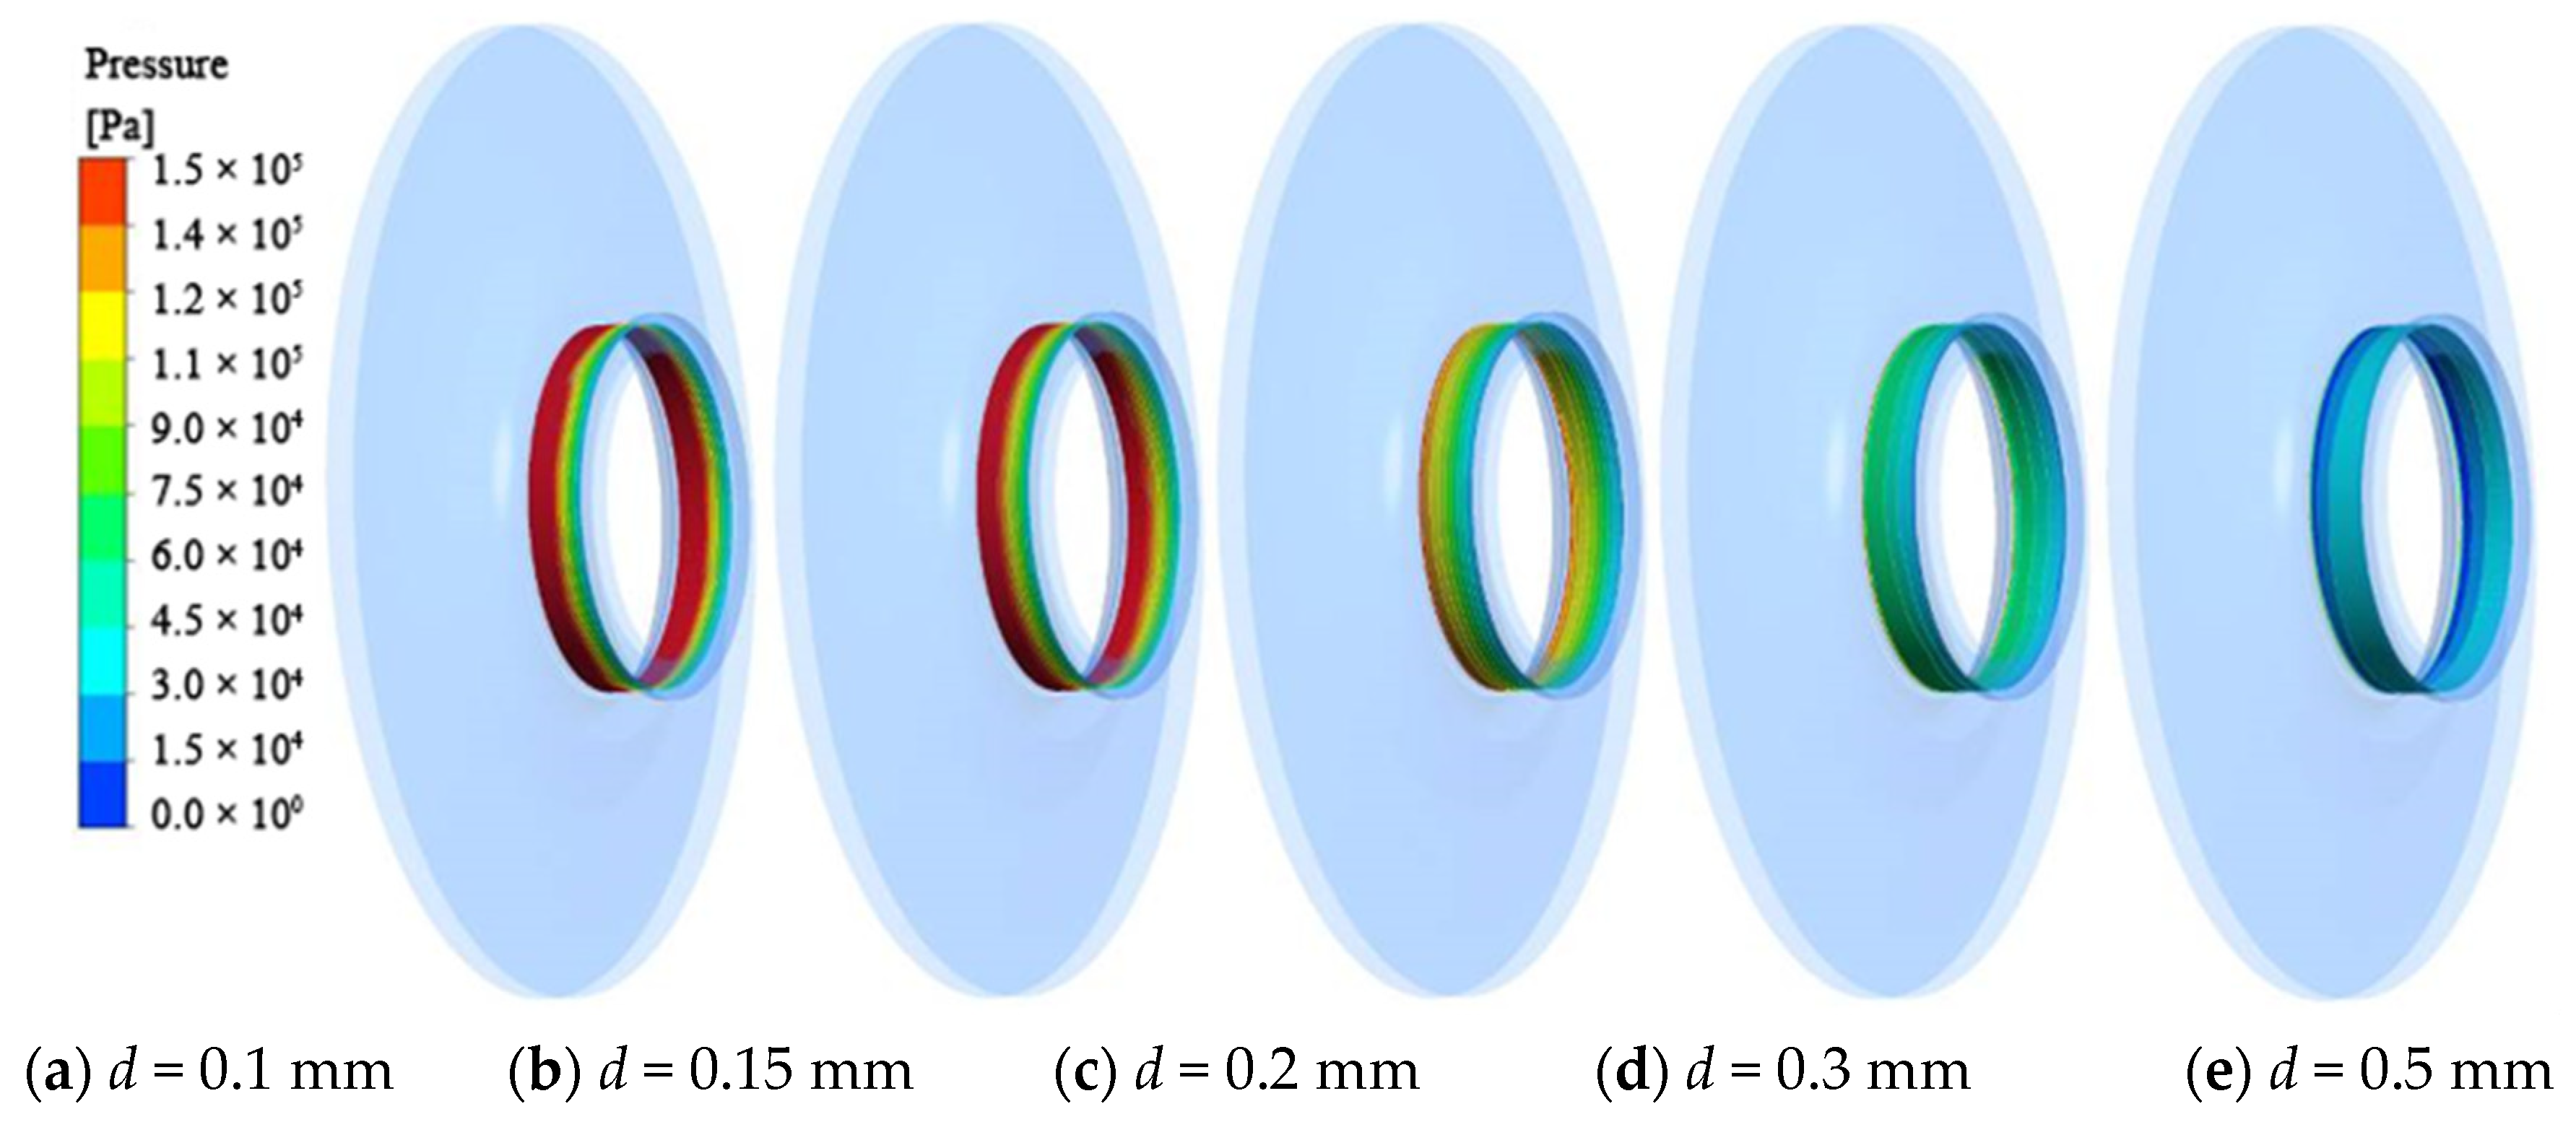
Figure 10 shows the pressure distribution of the circular section with the same diameter at the same time of different fluid medium with different wear-rings clearance. As shown in the figure, when the clearance increases, the orifice ring pressure near the front cavity drops, and the overall pressure distribution of wear-rings is more uniform. When clearance d is 0.1 mm and 0.15 mm, the geometric size of the wear-rings is too small, which is easily affected by the rotating impeller front cover plate and the stationary front pump cover. When clearance d = 0.2 mm, the geometric size of the wear-rings is less than 0.1 mm. In addition, 0.15 mm is less affected by the rotating surface of the impeller and the stationary surface of the front pump cover, but the size change is still relatively large compared with the interface of the front cavity. Therefore, the pressure drops somewhat, but the pressure near the front cavity is higher than that near the wear-rings. When clearance d is 0.3 mm and 0.5 mm, it can be seen that the overall pressure distribution of the outlet ring is symmetric because the geometrical size of the interface between the front cavity and the wear-rings is similar, and the influence on the wear-rings is reduced. The fluid in the front cavity presents different flow characteristics under the influence of the flow in the wear-rings. Since the front cover plate is a rotating surface while the front pump cover is static, the flow in different positions in the front cavity presents different flow states. The non-uniform pressure distribution caused by the clearance makes the axial force of the wear-rings non-uniform, while the annular force of the orifice ring has axial symmetry. Therefore, the non-uniform axial force can be ignored. When the clearance is small, the high energy fluid leaked from the outlet pipe is less likely to enter the inlet of the impeller through the wear-rings, which reduces the energy leakage. Therefore, it is relatively advantageous to choose a small clearance of the wear-rings to improve the efficiency.
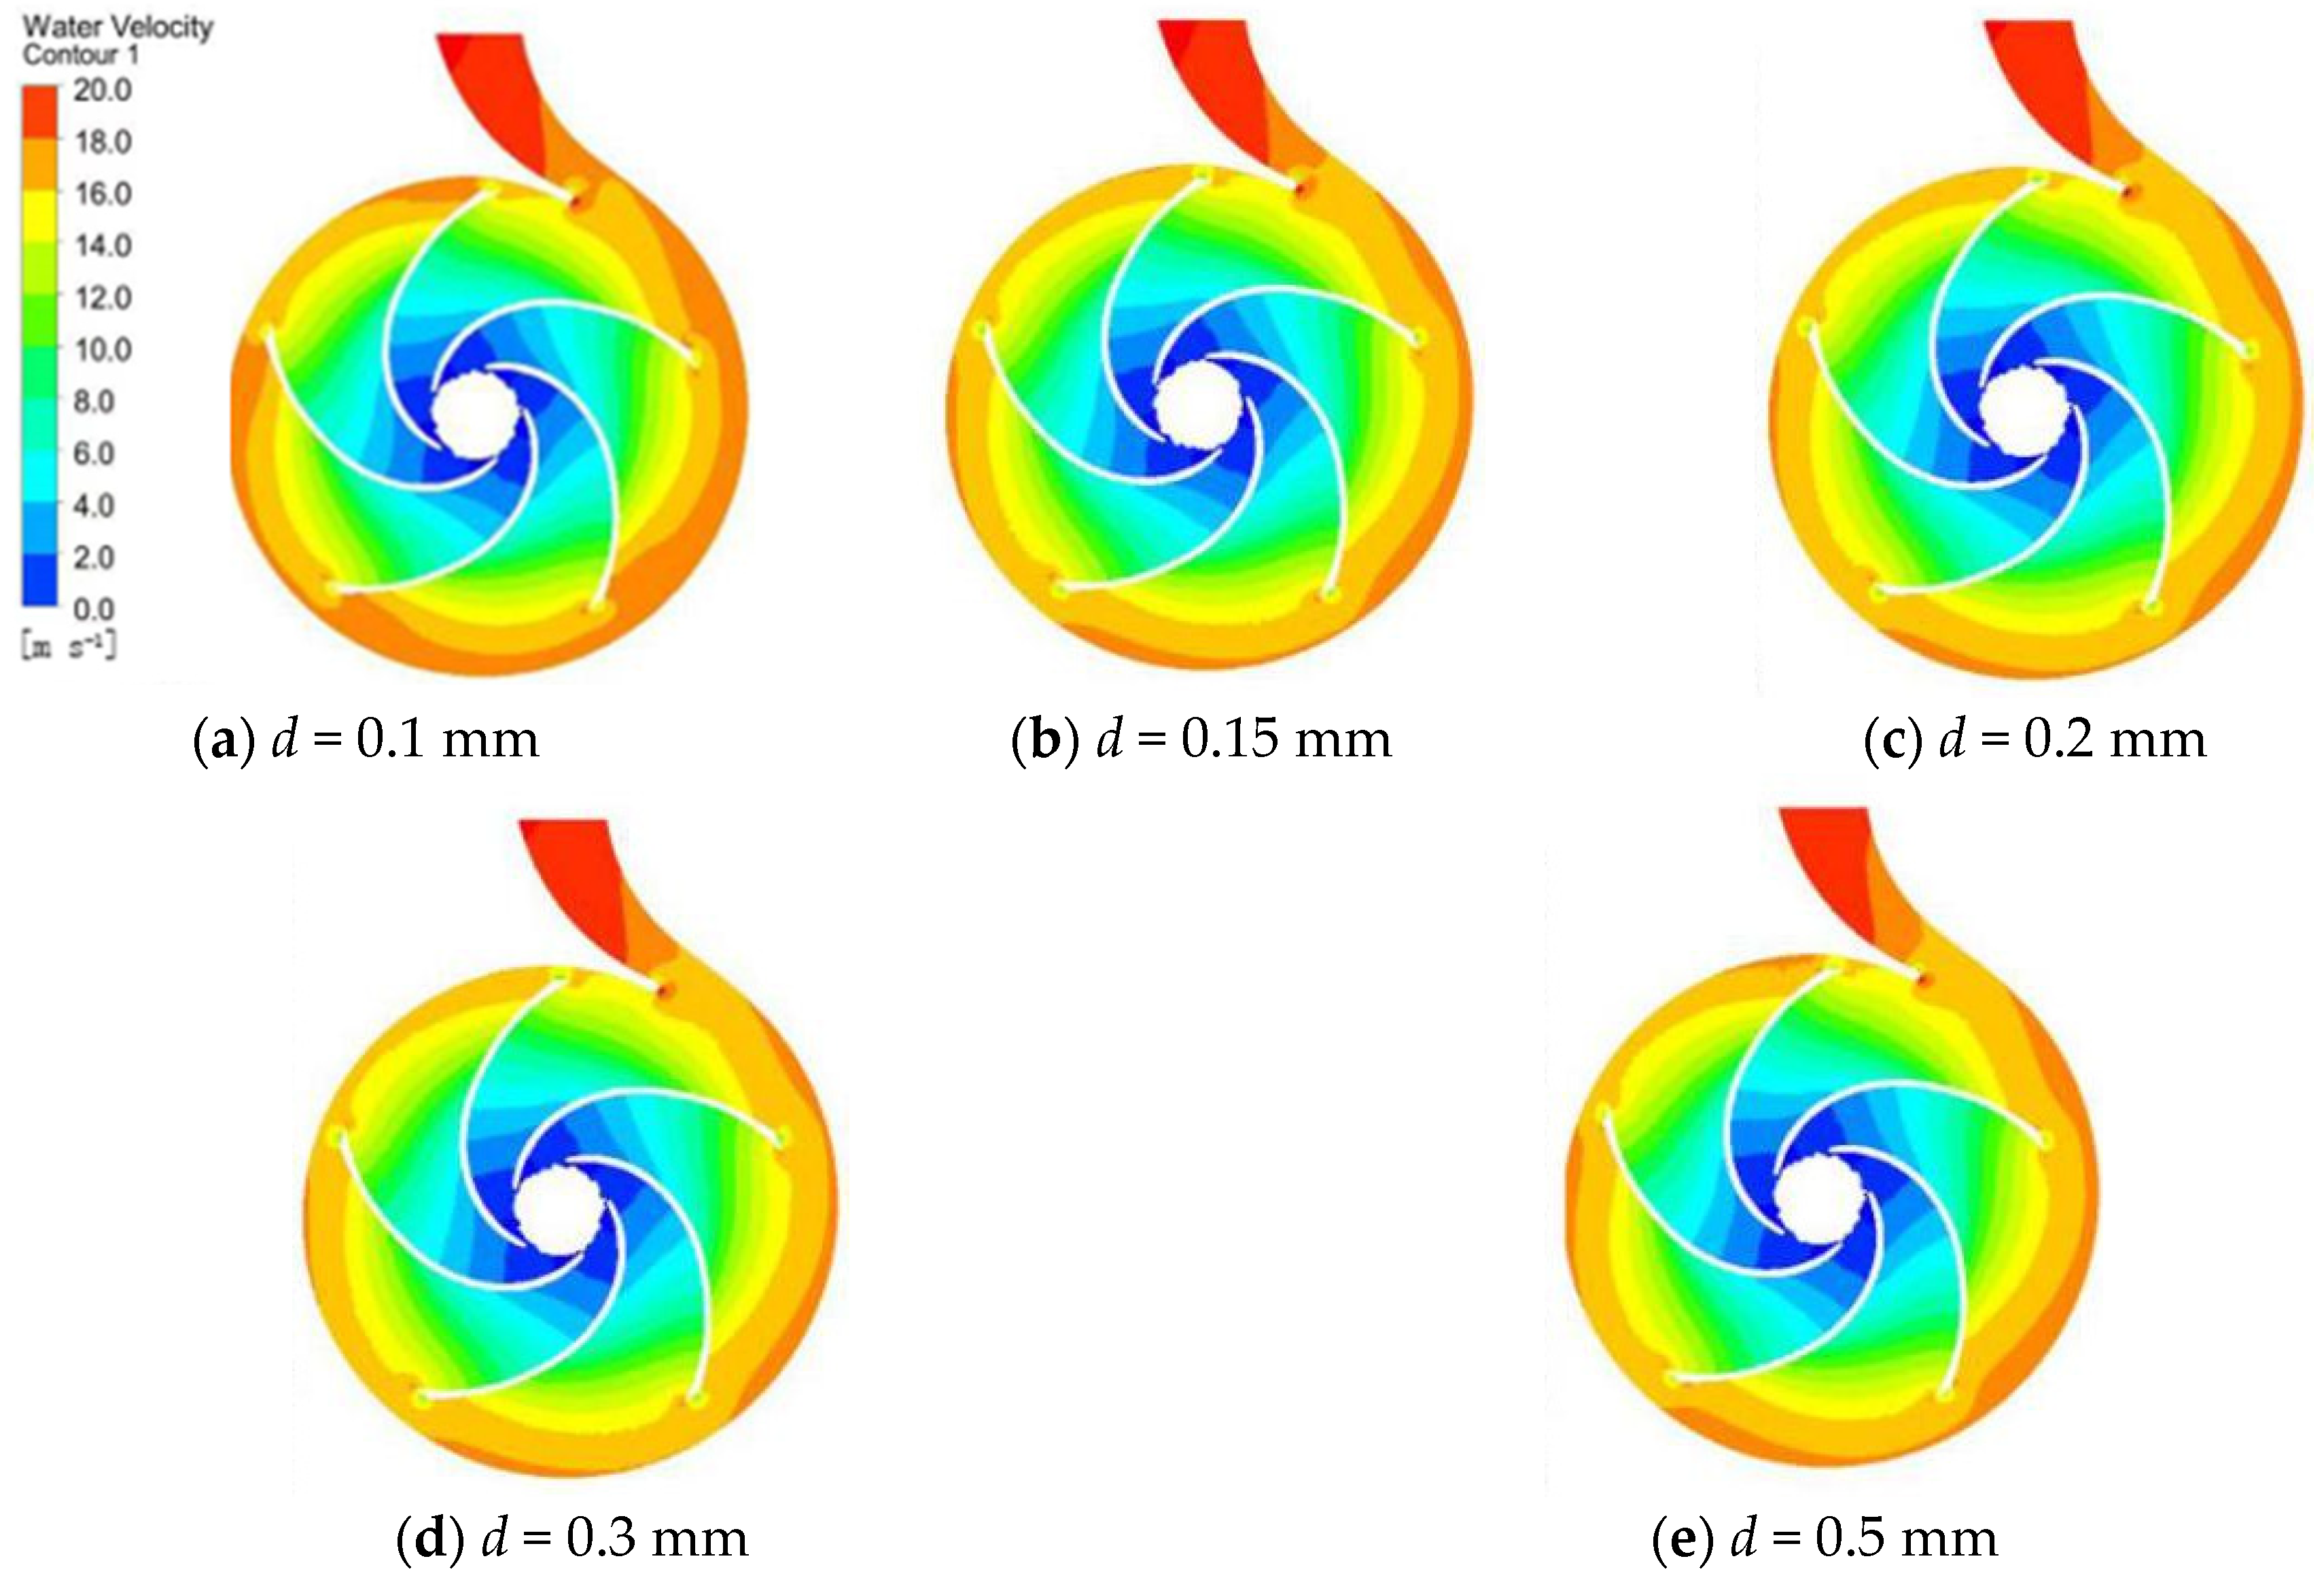
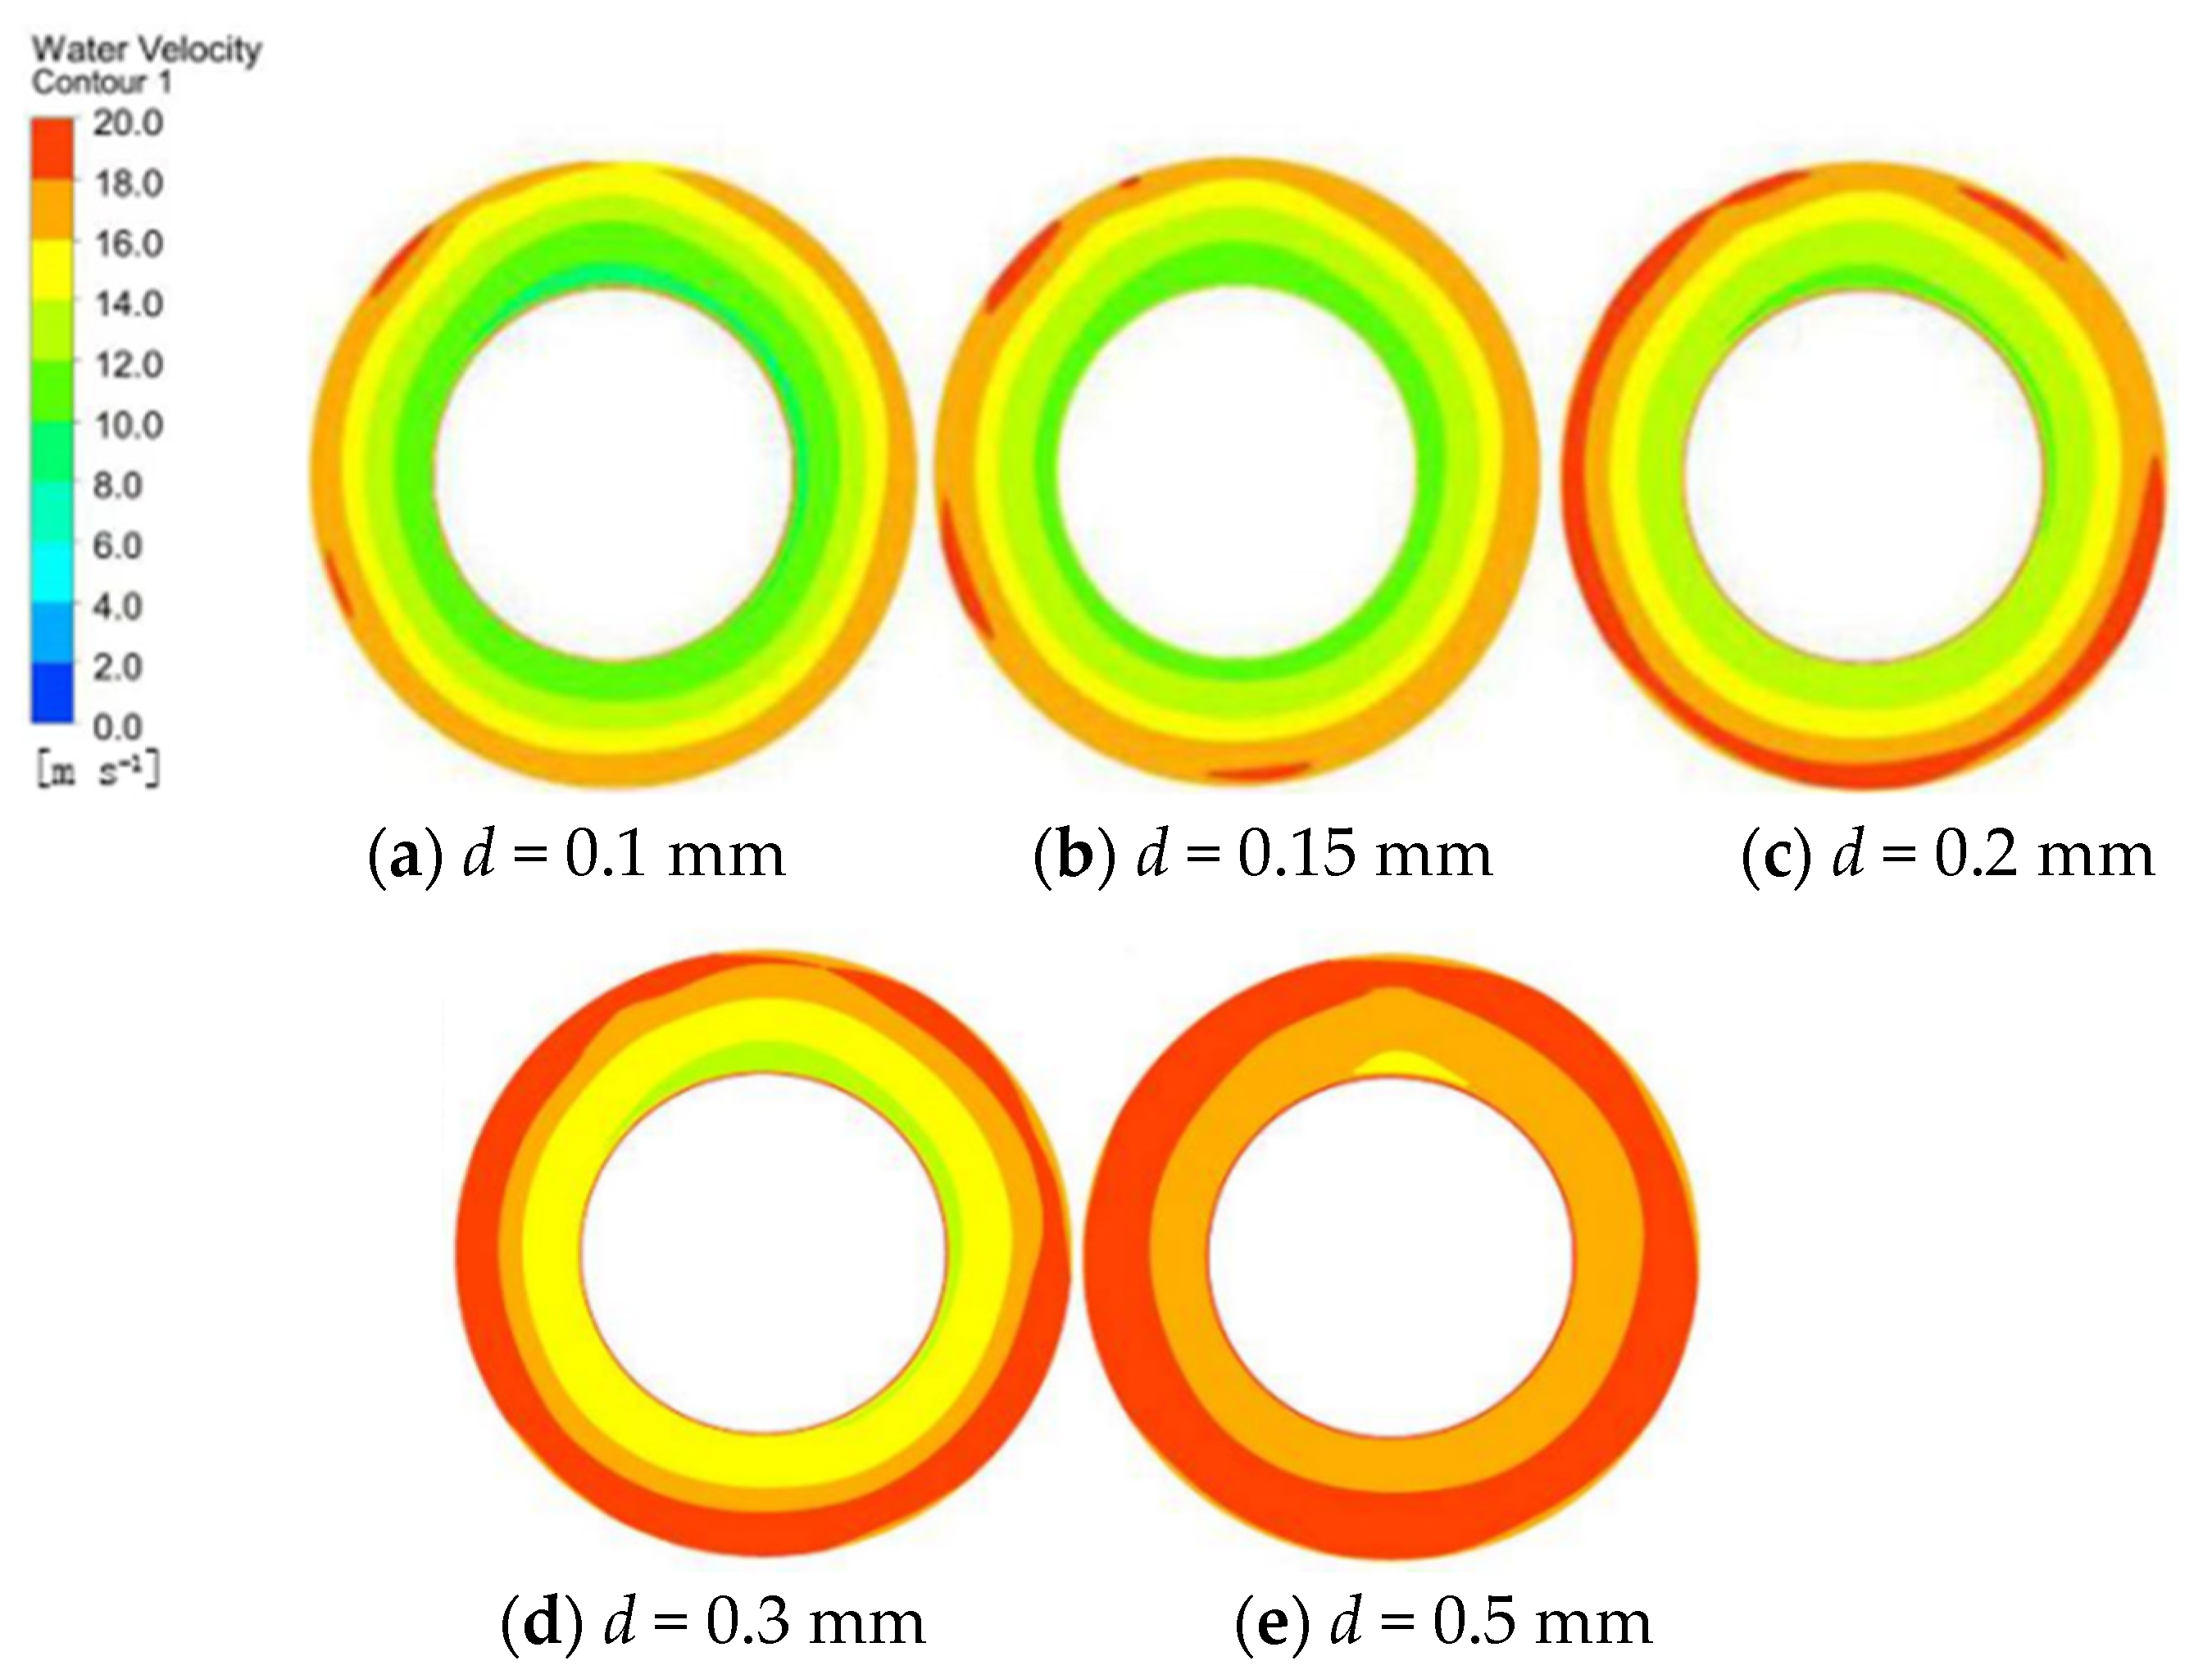
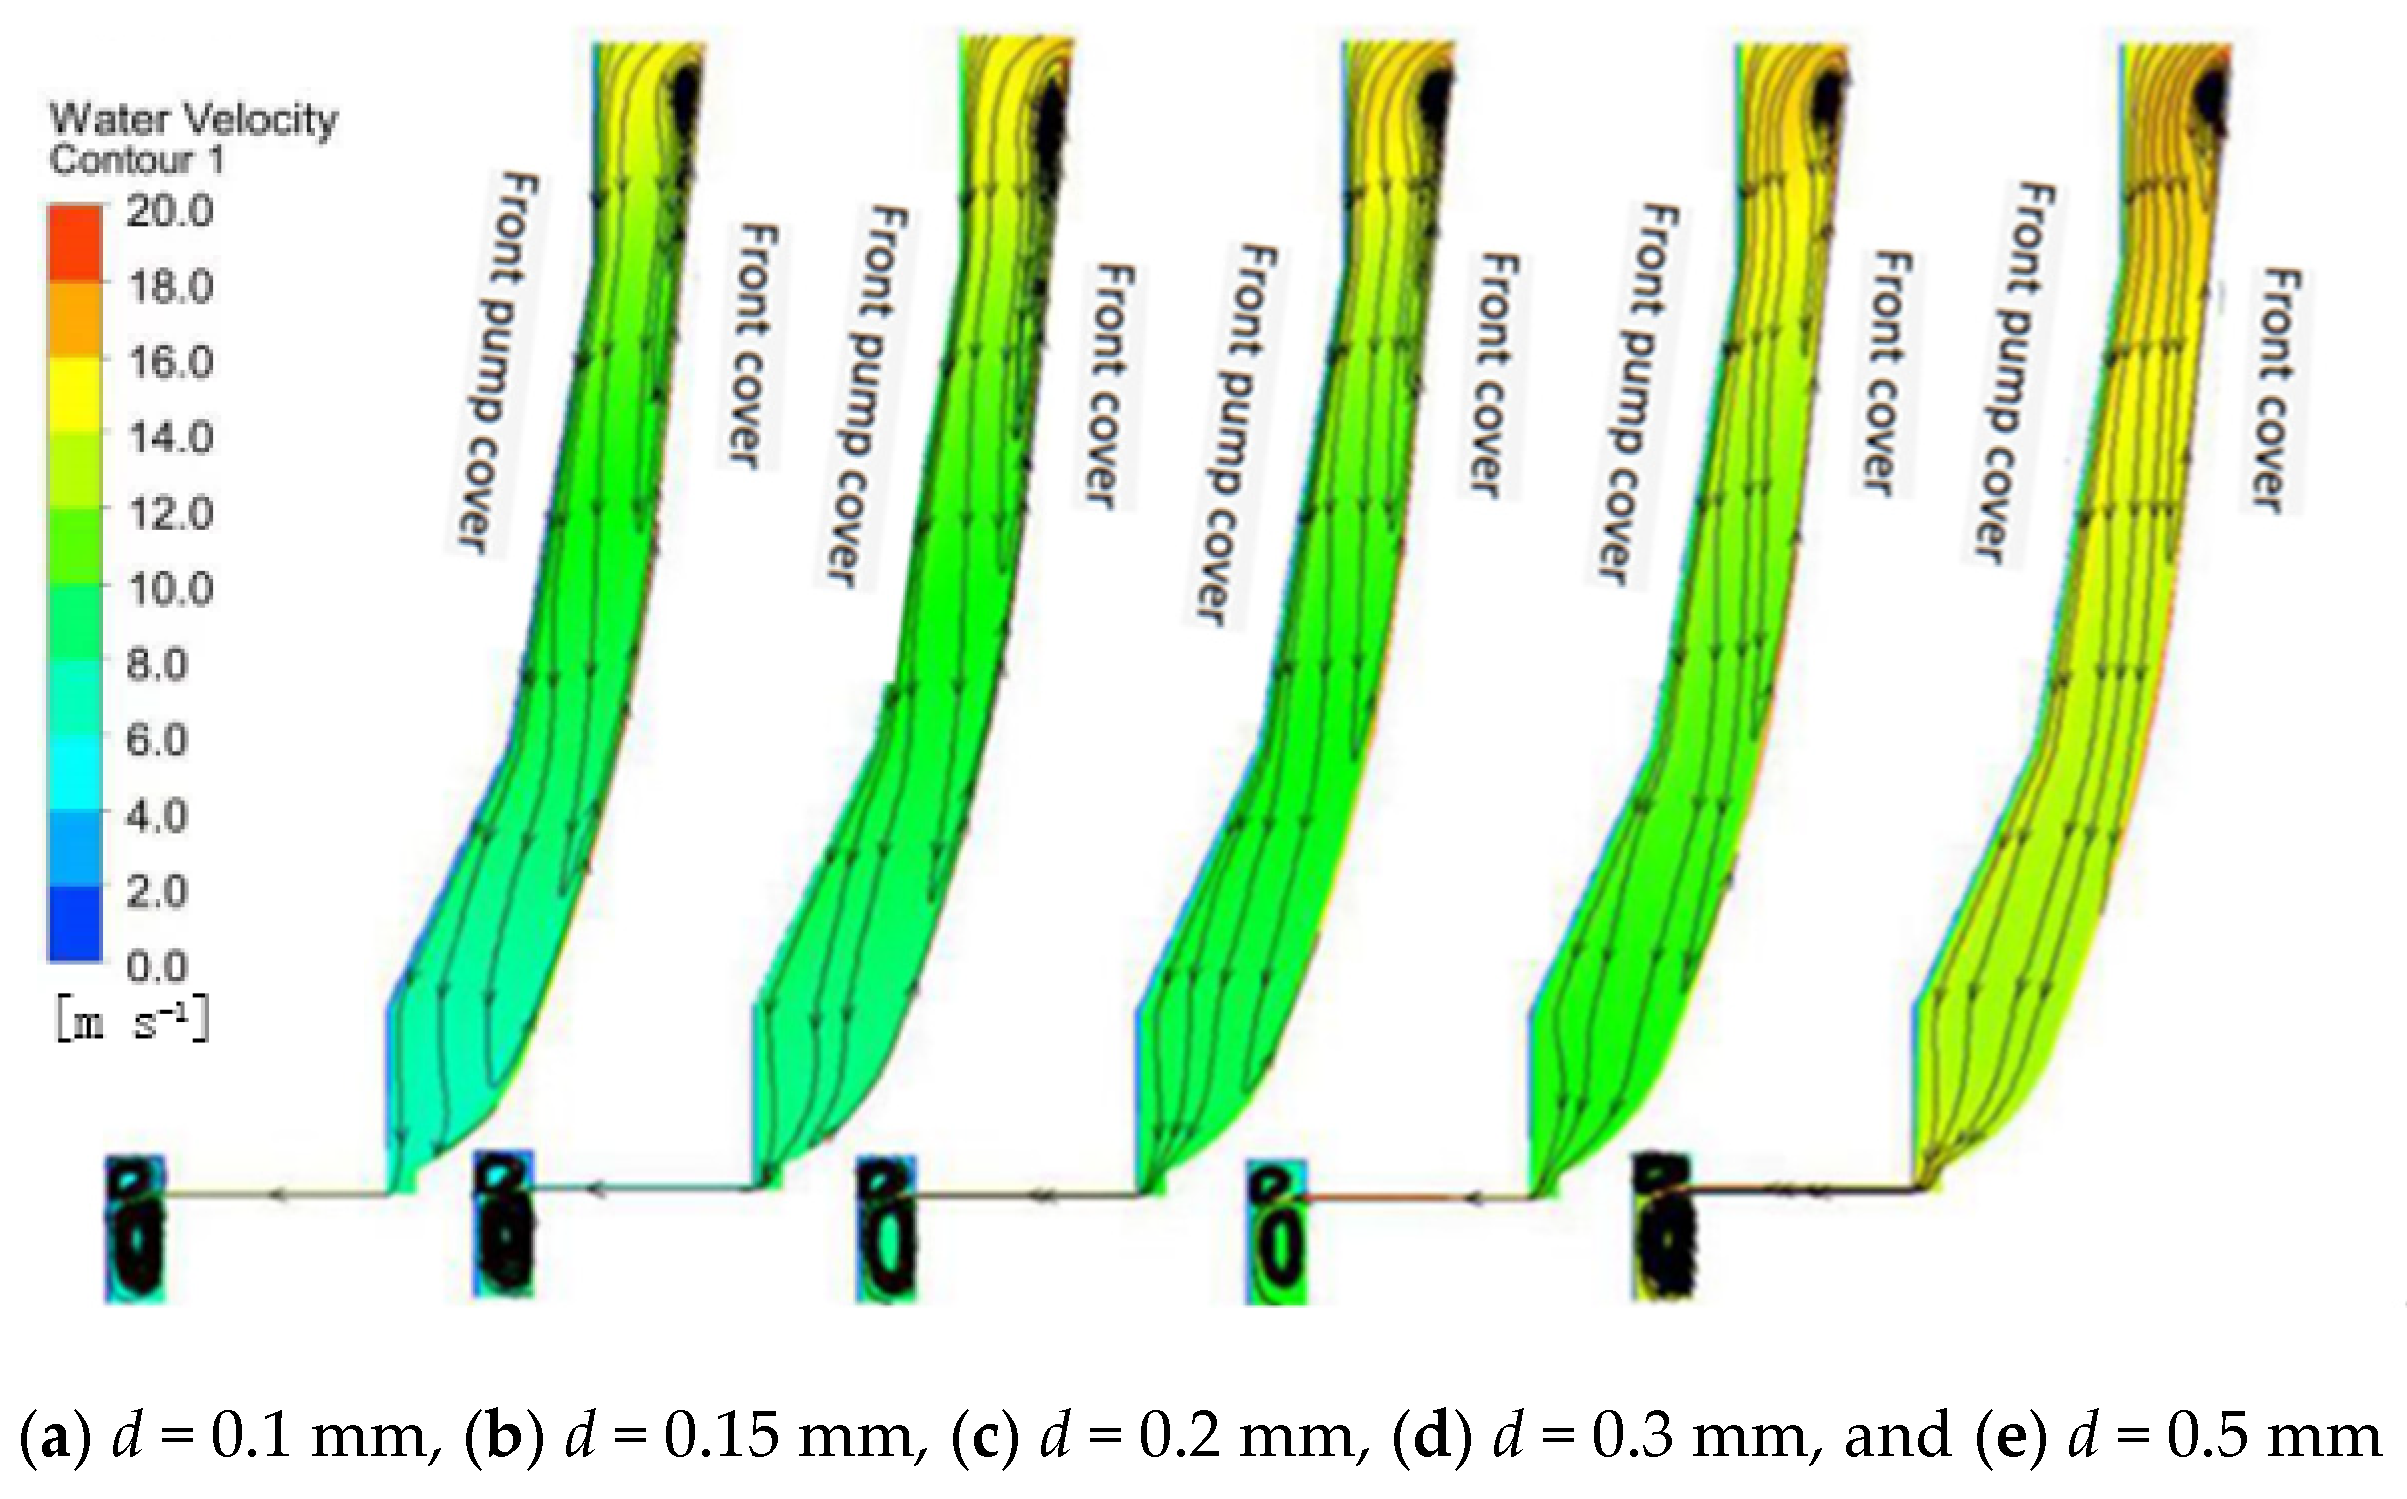
The axial direction of the centrifugal pump is the z-axis. In order to study the flow state of the front cavity when the clearance size changes, the circumferential axial surface at z = −15 mm in the front pump cavity is intercepted. Figure 11 shows the velocity cloud diagram of the front cavity axial surface when the clearance size is different. It can be seen from the figure that the clearance of the wear-rings affects the velocity distribution of the liquid in the front chamber of the centrifugal pump. When the clearance d is 0.1 mm, the velocity gradient changes greatly and the average velocity is low. With the gradual increase of clearance, the change of velocity of the axial plane tends to be stable. When the maximum clearance value is 0.5 mm, the change of velocity gradient is minimal, and the average velocity increases. On the whole, the velocity distribution is relatively uniform and increases along the radius. However, due to the asymmetry of the volute structure, a low speed zone will appear.
Figure 12 shows the flow diagram at the anterior cavity. It can be seen that vortexes tend to appear near the front cover plate because the front pump cover is a stationary surface while the front cover plate is a rotating surface. The influence of the centrifugal force on the media near the rotating surface is relatively large. Therefore, the velocity at the cover plate is relatively greater than that of the front pump cover at the same radius. As a result, vortexes are more likely to form on the front cover. With the increase of the gap, it can be seen that the vortexes in the front cavity tend to decrease. When the clearance is 0.5 mm, the vortex at the front cover plate is the smallest, and the average velocity increases, making the leaking medium flow more into the inlet of the impeller through the wear-rings, causing energy loss.

3.3. Wear Characteristics Analysis of the Impeller with a Different Clearance

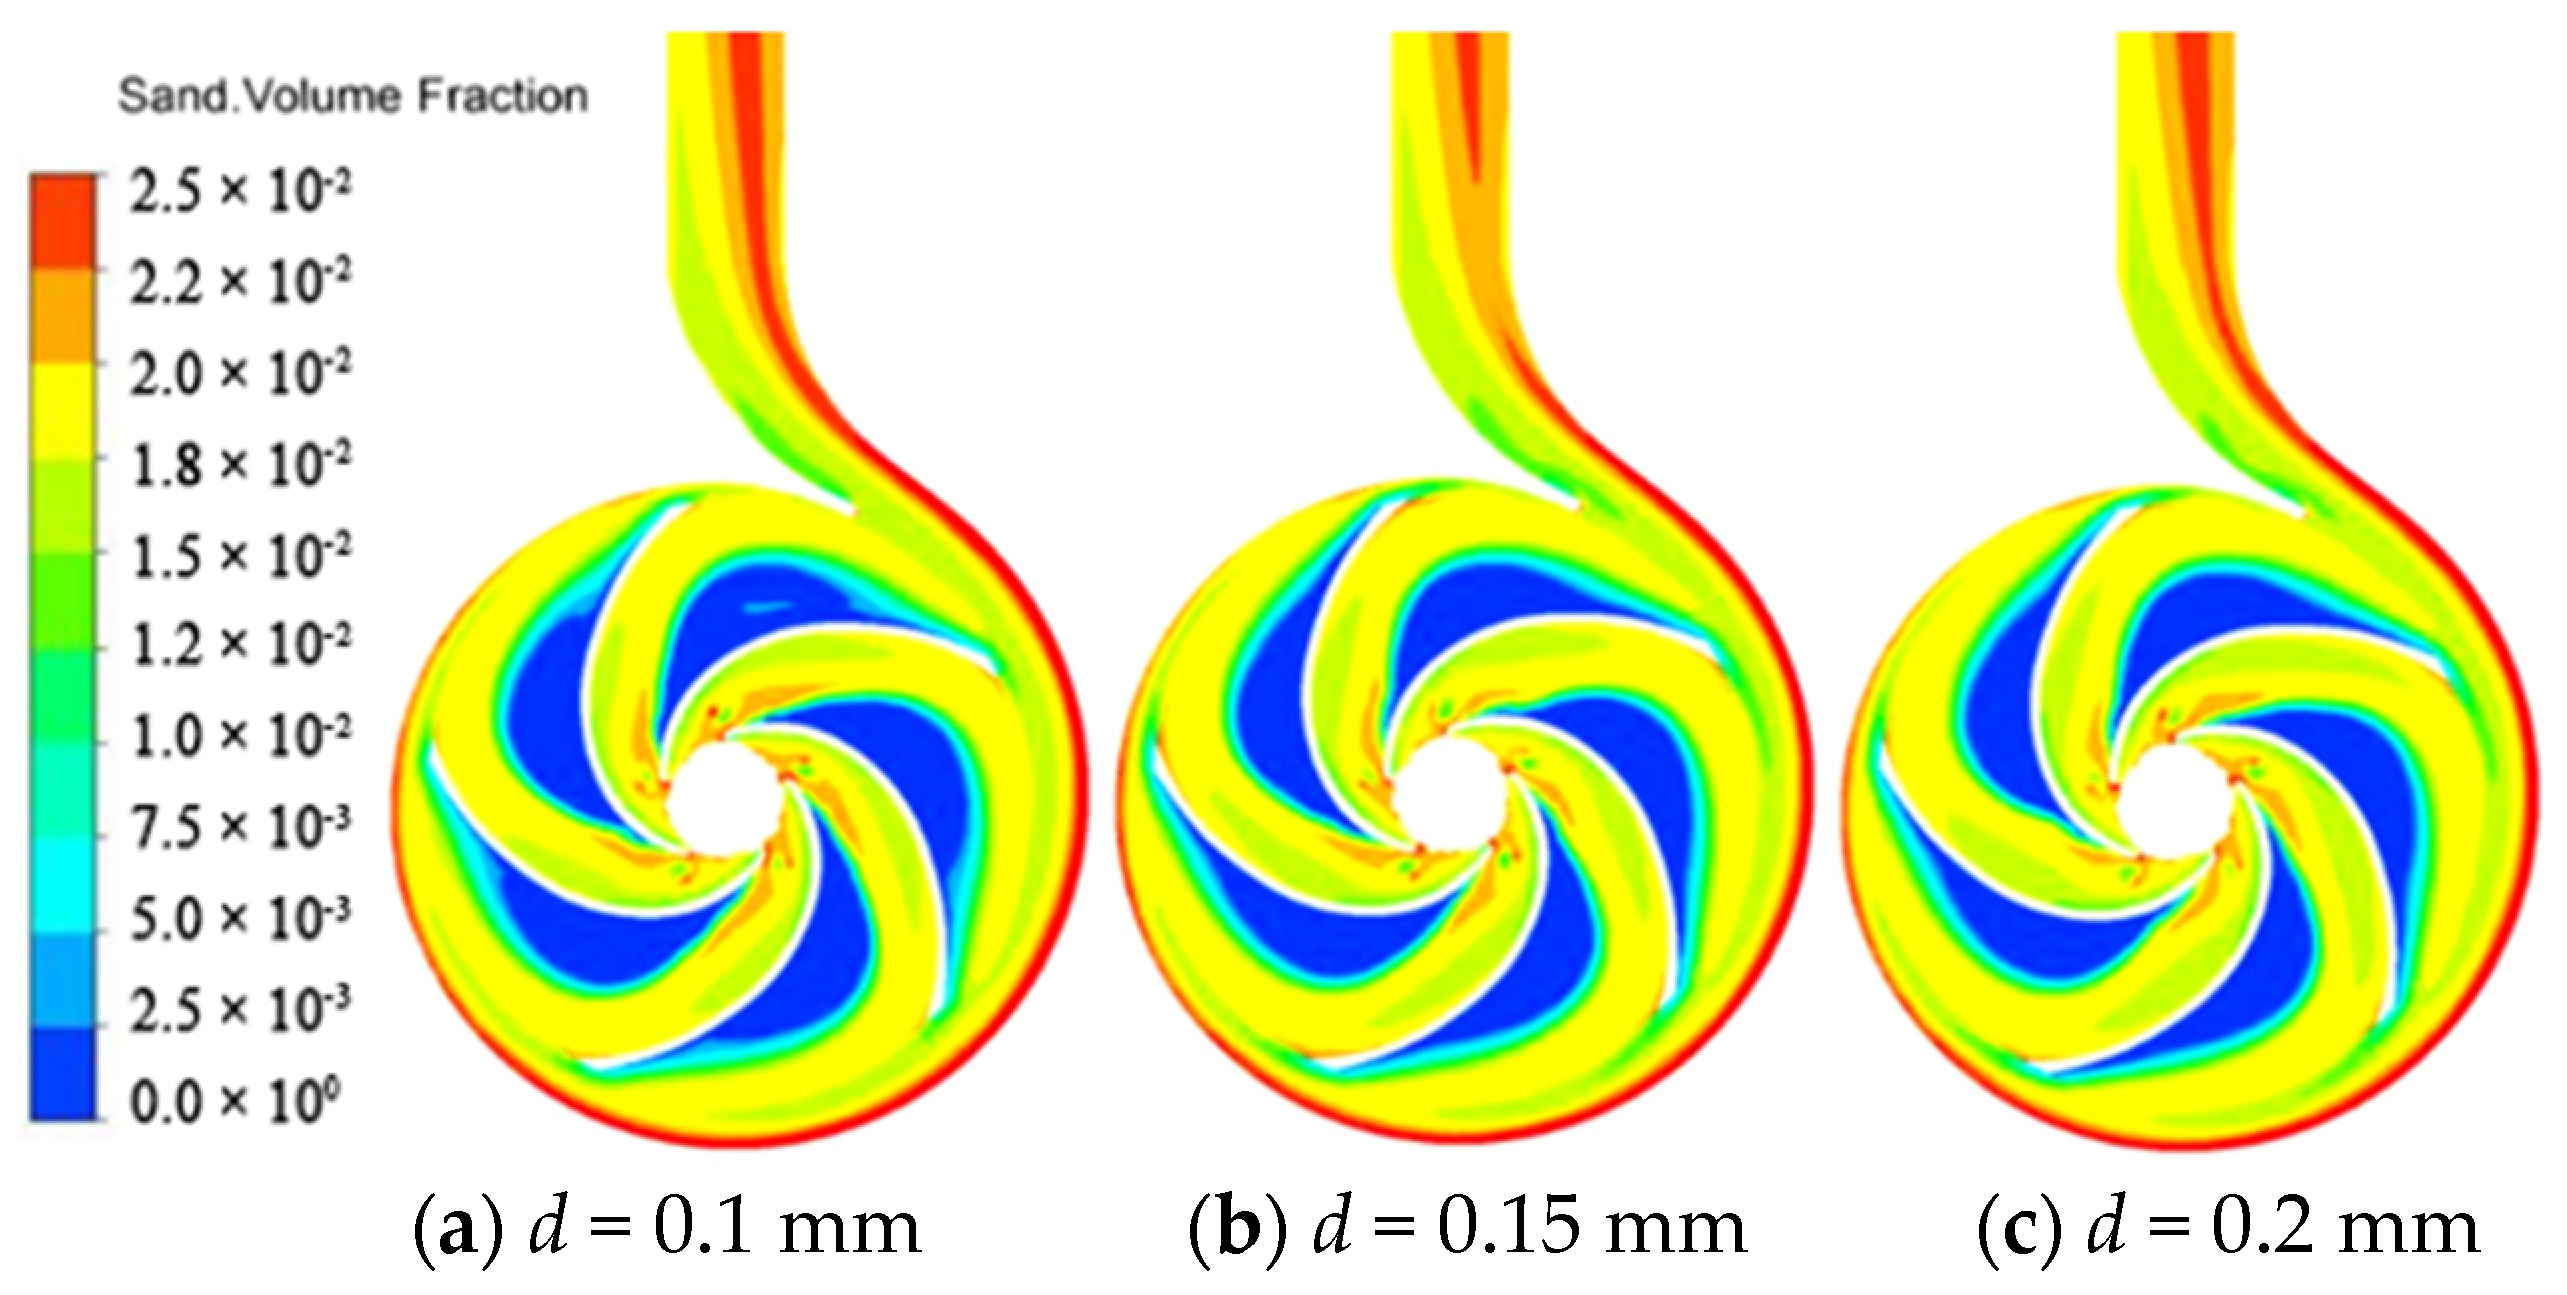
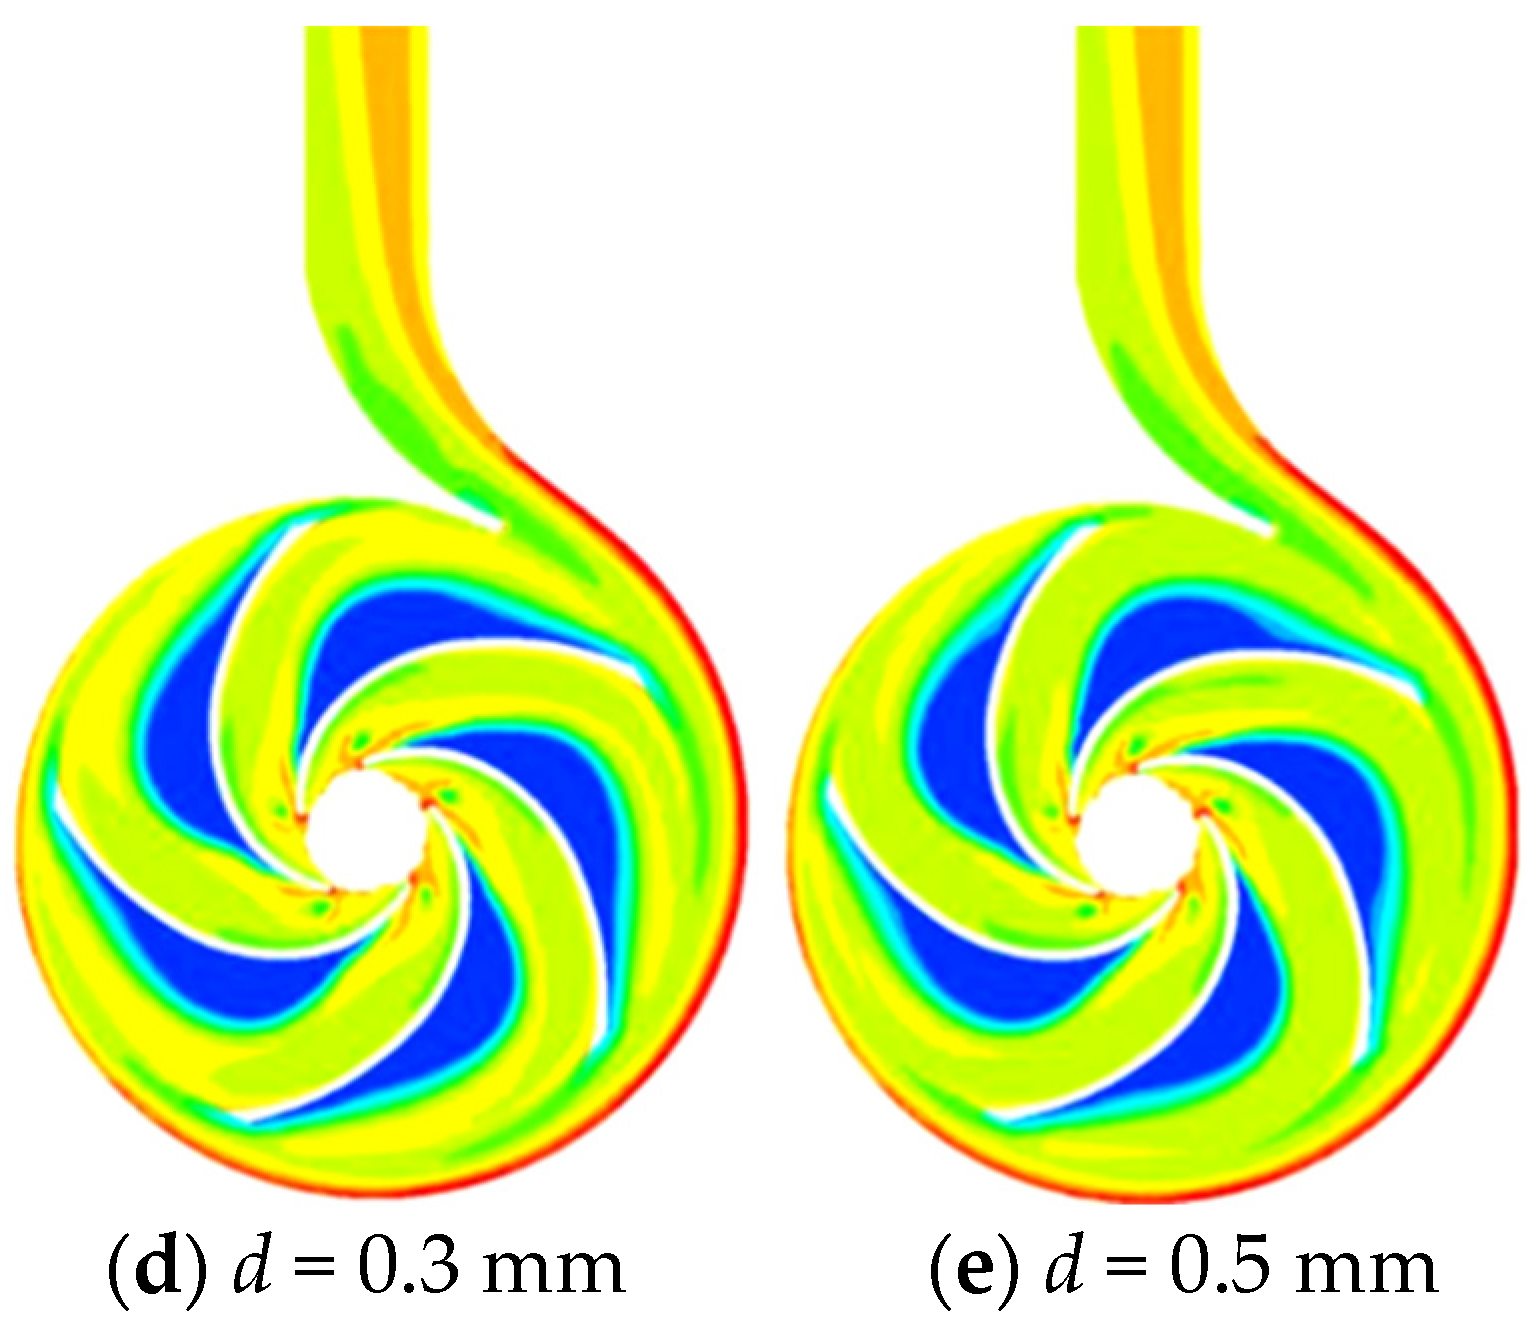
Figure 13 below shows the distribution diagram of the solid content inside the centrifugal pump at the same time under different wear-rings clearance. As shown in the figure, the sand accumulates in the inlet area of the blade, especially near the head of the blade. With the increase of clearance, the sediment concentration in the inlet area tends to decrease gradually. Due to the large proportion of sand, under the action of centrifugal force and fluid reflux on the blade working face, the volume fraction of sand in the flow passage of the impeller is almost 0 in a certain range near the middle of the blade working face. However, the sand content in a small part of the tail of the working face is significantly higher than that in the middle. The average sediment concentration near the non-working face of the blade is higher, among which, the surface of the non-working face has a relatively low sediment concentration, while the tail of the non-working face has a higher sediment concentration. When the clearance becomes larger, the average content of sand near the non-working face decreases and the low content area becomes larger. The sand in the volute accumulates in the outermost edge of the volute, and the content increases gradually from the first section to the eighth section. The sand concentration near the tongue of the volute is low, and the average content of sand is higher the closer the diffusion tube of the volute is to the outlet. When the clearance of the wear-rings increases, the sand concentration near the tail of the non-working face of the volute tongue and blade decreases, and the volume fraction of sand from the diffusion tube to the outlet decreases significantly when the clearance is 0.3 mm and 0.5 mm.
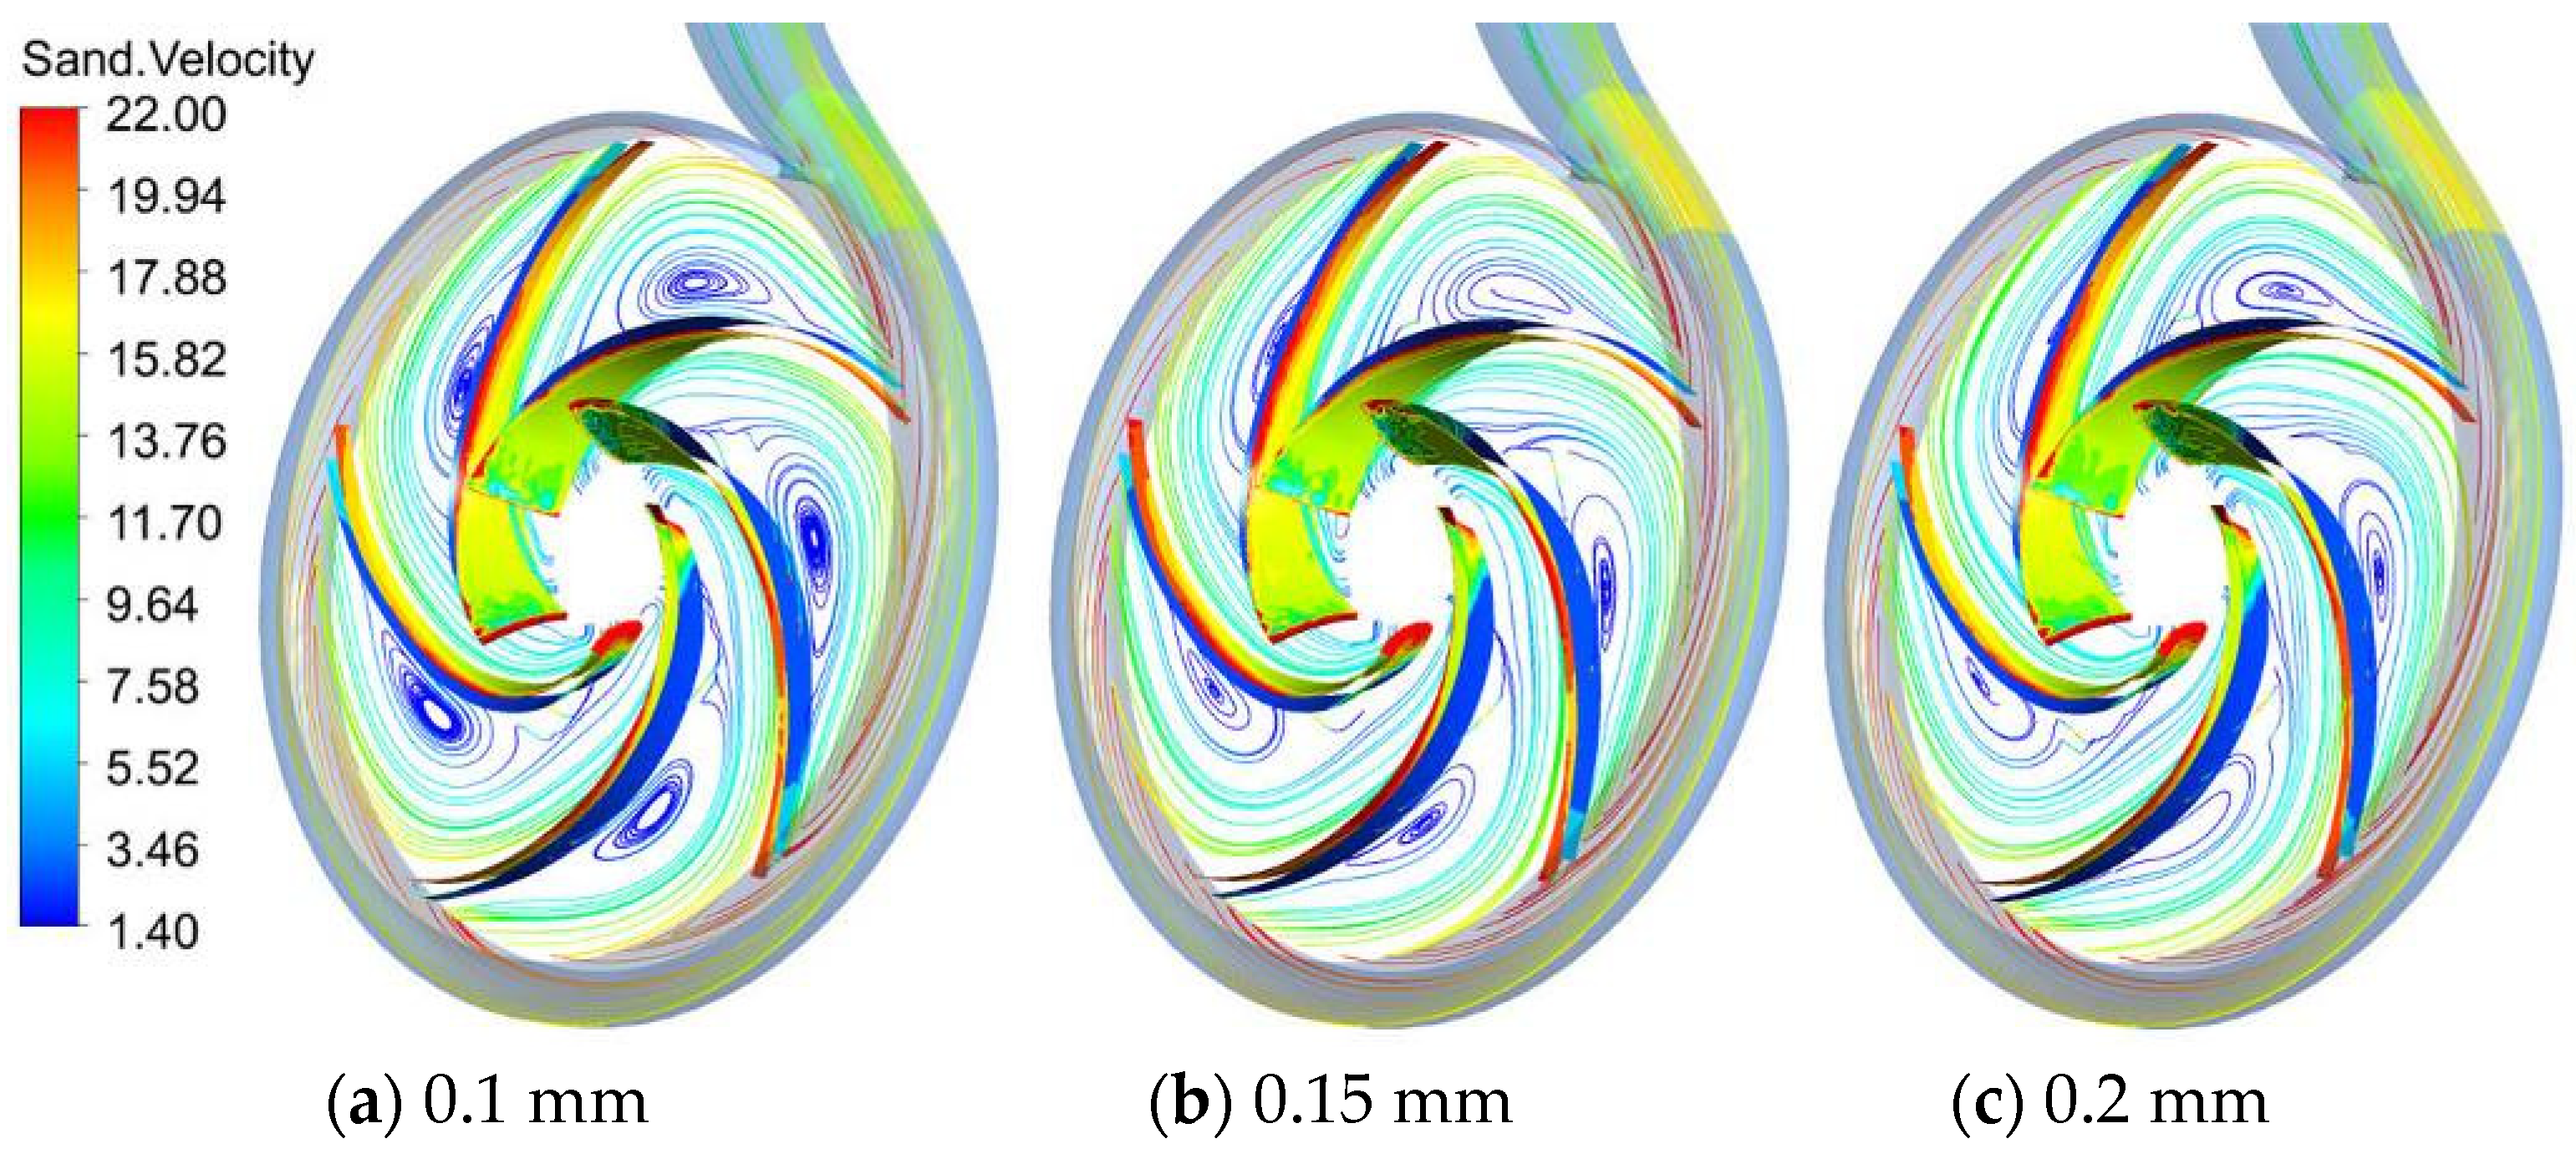
Figure 14 below shows the distribution of the solid phase of the blade and the velocity flow diagram of the middle section of the impeller under different clearance conditions when the solid phase concentration is 50 kg/m3 under rated conditions. It can be seen from the solid phase volume distribution of the blade in the figure that the solid phase is more distributed in the blade head, upper edge, and tail of the blade suction surface. The solid distribution on the pressure surface is much smaller than that on the suction surface. This is related to the flow state inside the centrifugal pump. According to the velocity flow diagram of the middle section of the impeller, it can be seen that the solid phase flow velocity at the blade head is small, while the velocity increases along the radial direction, and the velocity at the blade tail reaches the maximum. As the area becomes larger after entering the diffusion tube, the solid phase velocity decreases. Where the solid phase volume fraction is small, there is a vortex in the impeller passage. It can be speculated that the vortex causes the solid particles to be affected by centrifugal force, resulting in the decrease of solid phase particle concentration. The distribution range of the solid phase volume fraction of the blade increases when the clearance of the wear-rings increases from 0.1 mm to 0.15 mm. When the gap of the wear-rings continues to increase to 0.2 mm, 0.3 mm, and 0.5 mm, it is clear that the distribution range of the solid phase significantly decreases.
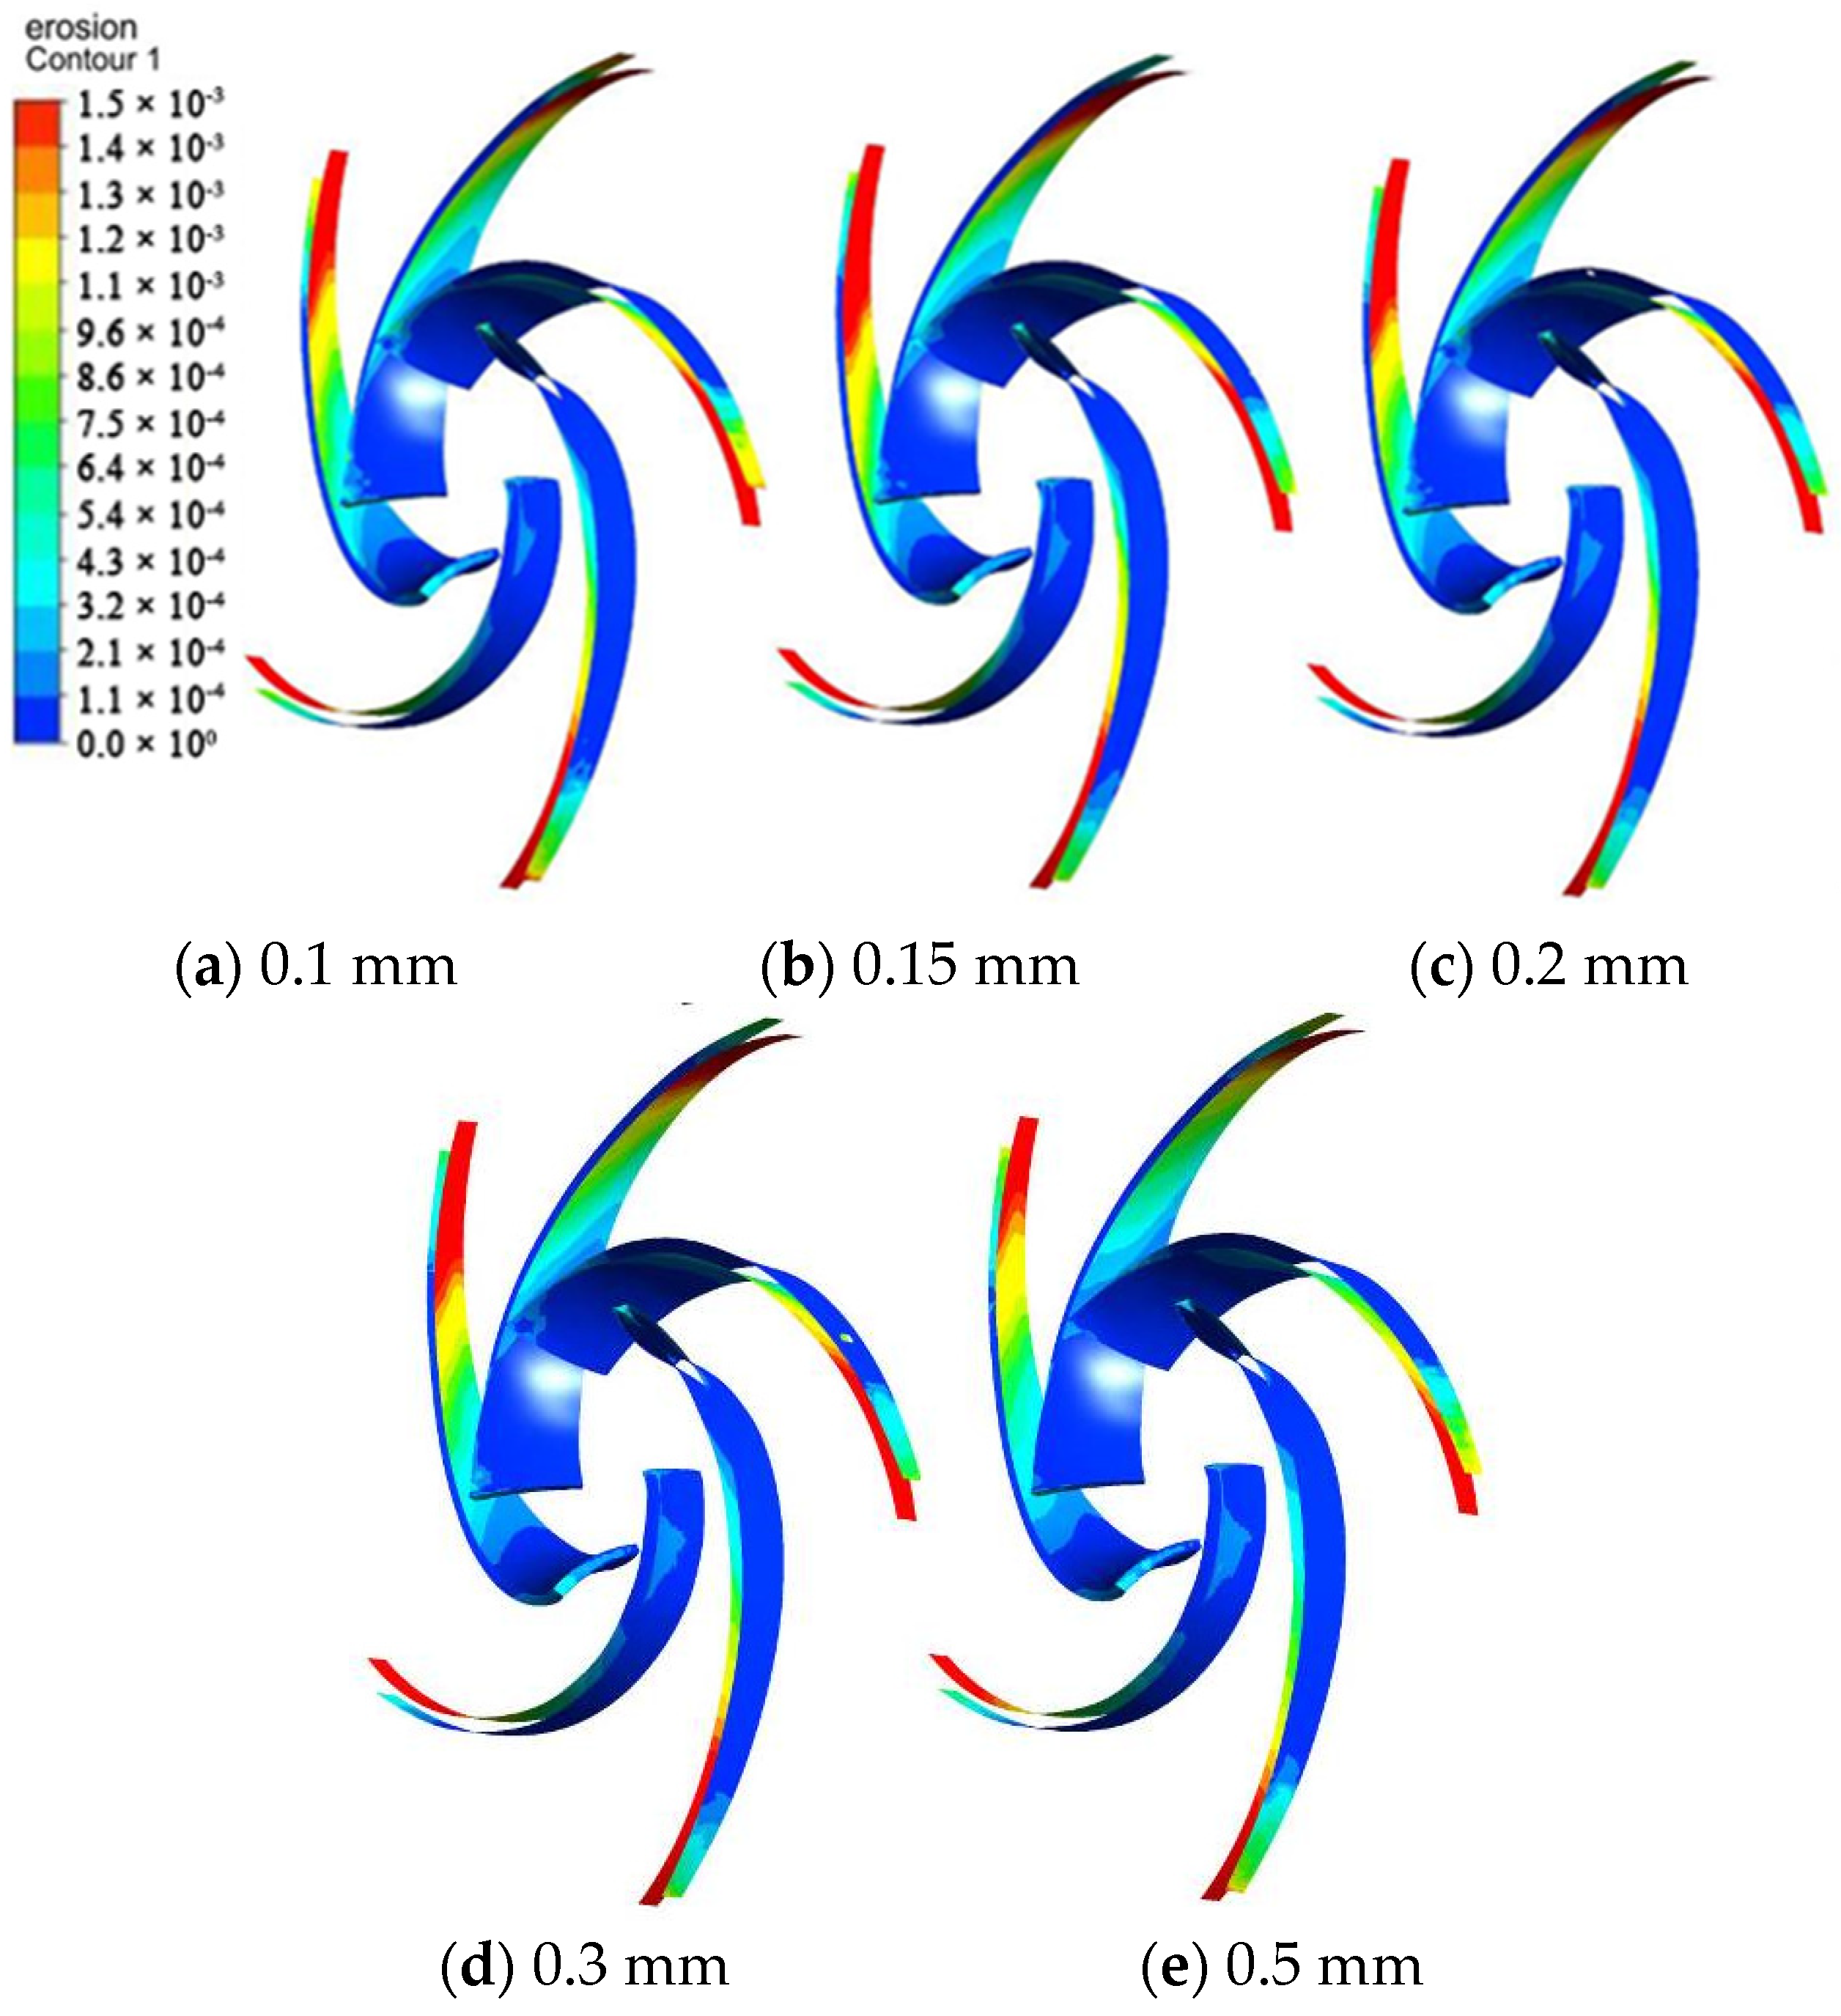
Figure 15 shows the wear rate distribution of the impeller under different wear-rings clearances under standard working conditions and soli d concentration of 50 kg/m3. It can be seen that the wear on the suction surface of the blade is more serious than that on the pressure surface. The wear on the suction surface is mainly concentrated in the head, middle, and tail of the blade, while the wear on the pressure surface is mainly concentrated in the tail. The severe wear at the tail of the blade may be due to the greater absolute velocity of the fluid, and the mutual interference is more significant. The blade head is significantly worn because of the positive impact angle of solid particles accompanied by fluid flow. When the clearance of the wear-rings changes from 0.1 mm to 0.15 mm, the blade shows more wear. When it increases from 0.15 mm to 0.2 mm, 0.3 mm, and 0.5 mm, the wear degree tends to decrease. The maximum wear rate of the clearance from 0.4 mm to 1.2 mm is 4.16 × 10⁻³ kg/(m2·s), 5.67 × 10⁻³ kg/(m2·s), 5.58 × 10⁻³ kg/(m2·s), 5.34 × 10⁻³ kg/(m2·s), and 3.55 × 10⁻³ kg/(m2·s), respectively.
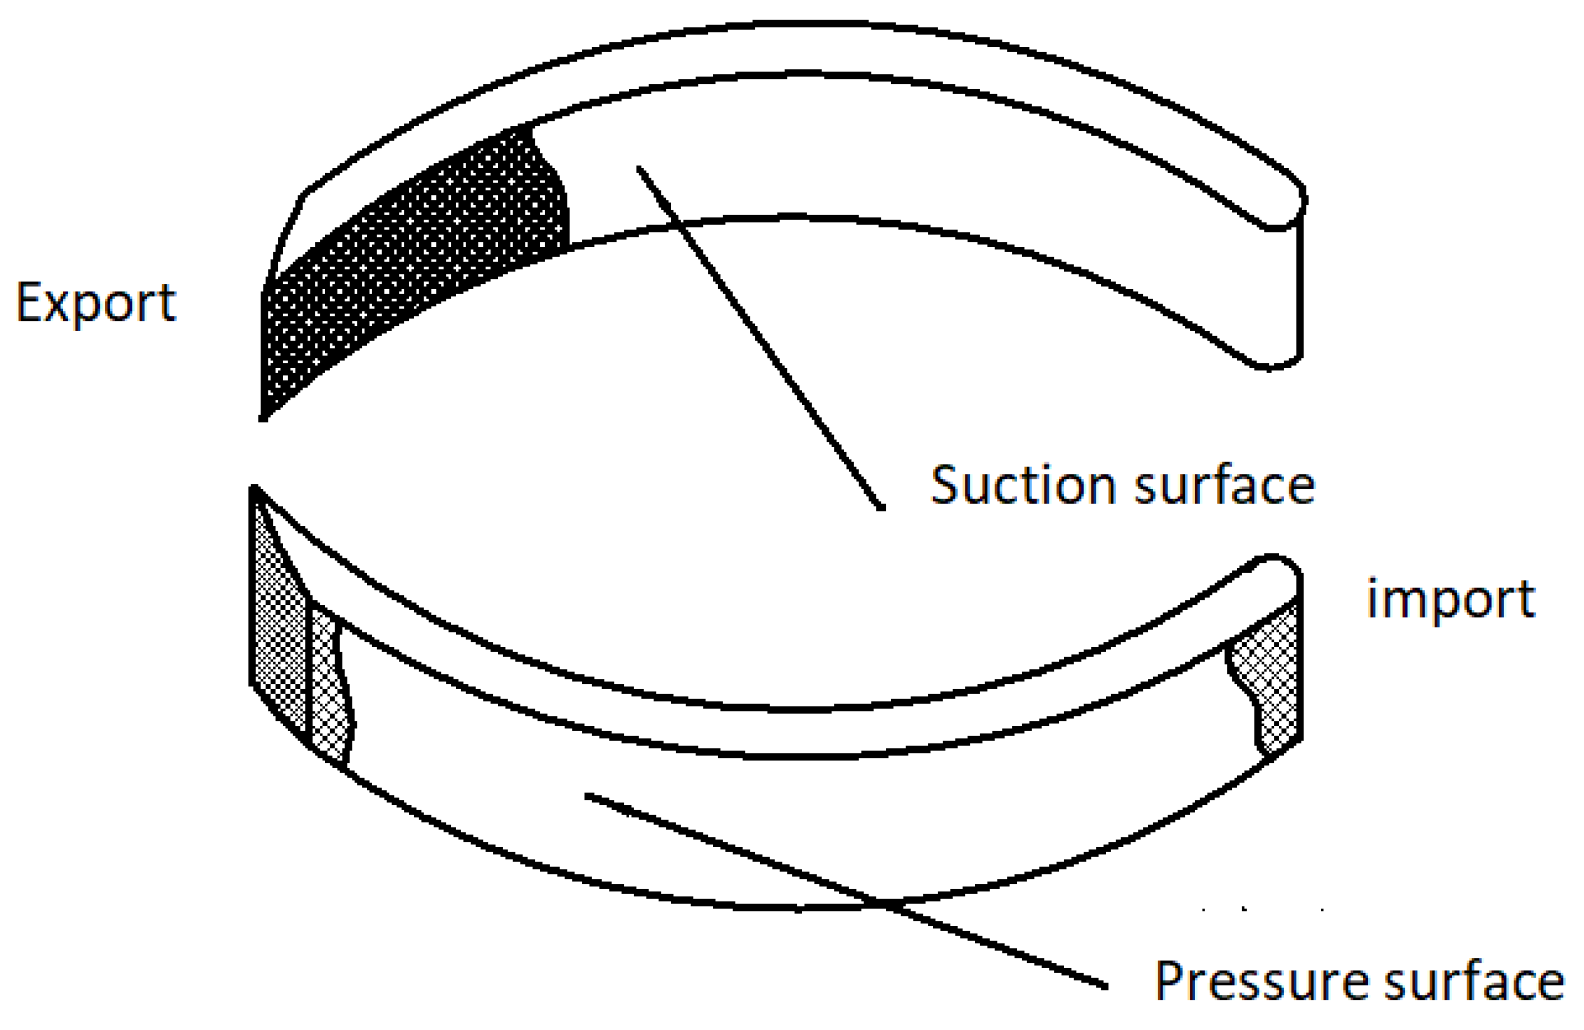
Figure 16 shows the experimental results of blade wear in the same type of the centrifugal pump by other researchers [28], which are like the numerical simulation results in this paper. The wear is mainly distributed in the tail of the suction surface, the tail of the pressure surface, and the head of the blade as well as the wear on the suction surface that is more severe than that on the pressure surface.

3.4. Wear Characteristics’ Analysis of the Volute Wall under a Different Clearance

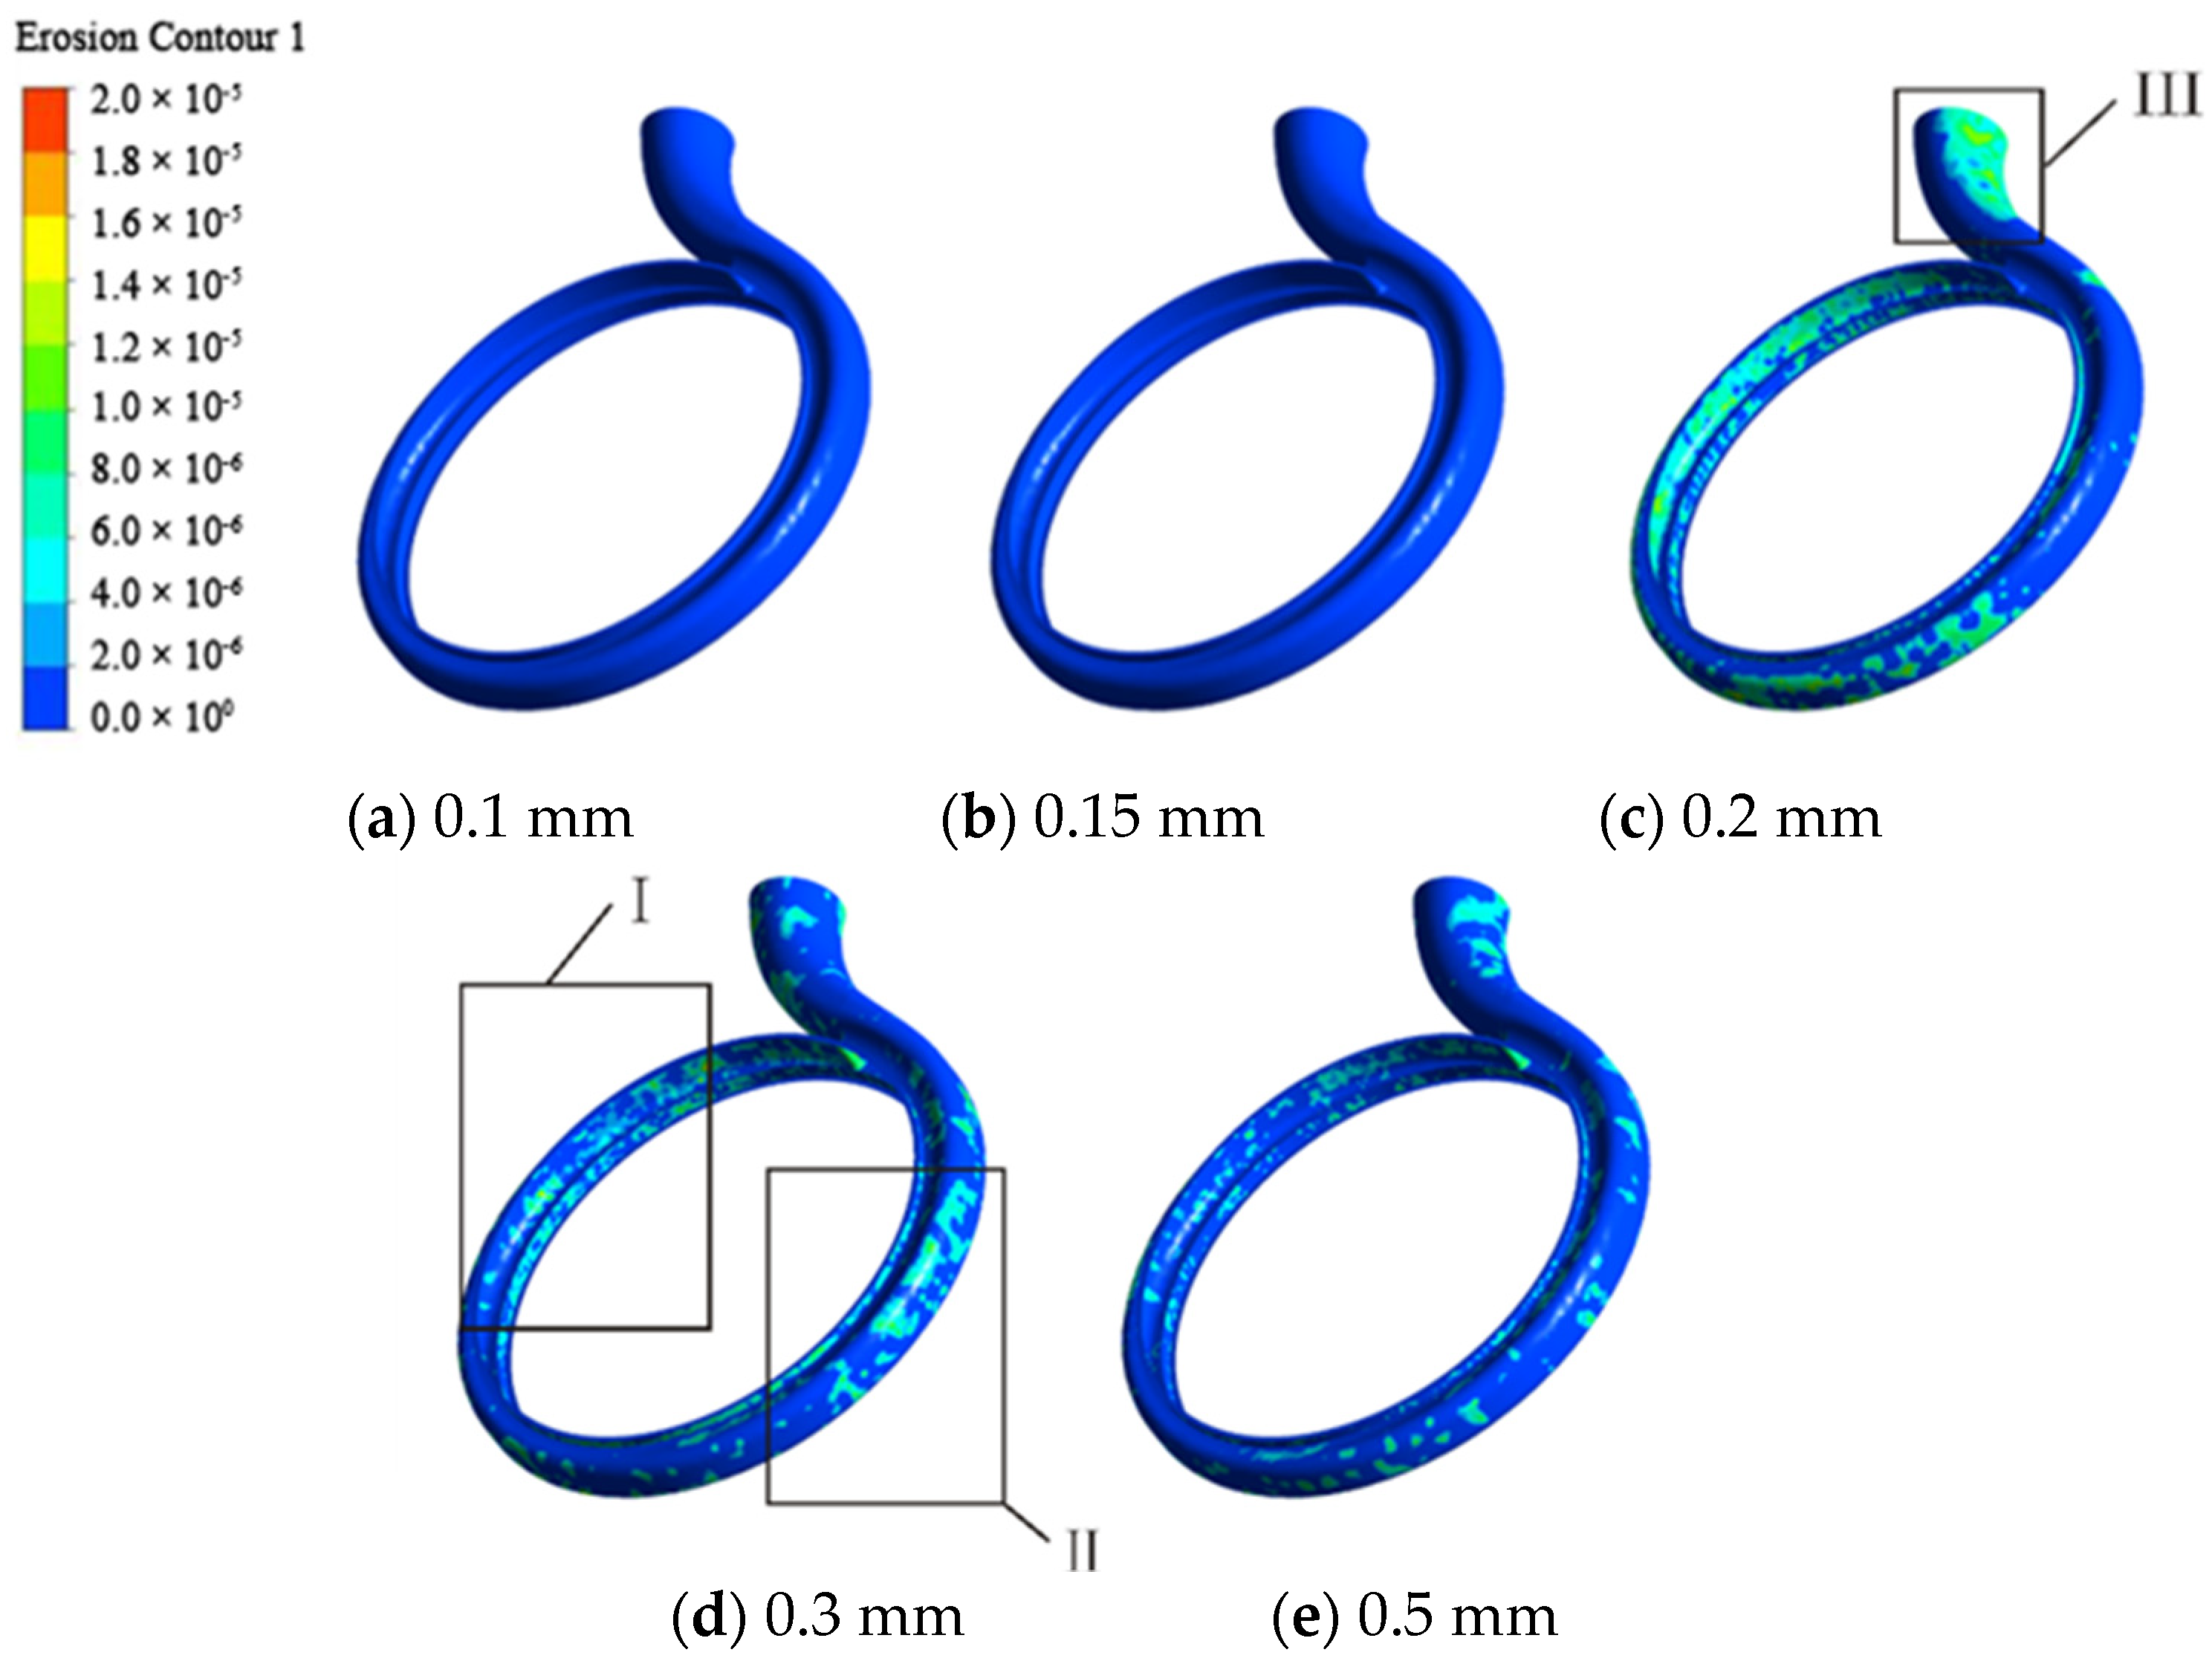
Figure 17 shows the wear rate distribution of the volute wall under different wear-rings clearance in standard working conditions with the solid concentration of 50 kg/m3. The volute wall surface is basically free of wear when the clearance of the wear-rings is 0.1 mm and 0.15 mm with only a slight erosion at the tongue. When the clearance of the mouth ring is 0.20 mm, the wear of the volute wall becomes very clear. The wear rate is at a high level, and the wear damage is dense and significant. The areas with a higher wear rate are mainly three parts: areas I and II, which are symmetrically distributed on the volute wall surface, and the outer wall area III of the outlet flow section of the volute. In these areas, especially area III, there are a large number of turbulent states and high-pressure regions. The motion of particles shows a disordered and a random motion state. The collision between particles and the wall surface, the collision between particles and particles, and the interaction between particles and fluid make the wear more severe on the wall. As the clearance increases from 0.20 mm to 0.50 mm, the peak wear rate ranges from 2.03 × 10⁻⁵ kg/(m2·s), 1.78 × 10⁻⁵ kg/(m2·s), 1.40 × 10⁻⁵ kg/(m2·s). In turn, the size of areas I, II, and III was significantly reduced, and the wear changes from sheet to a random pitting corrosion with a high wear rate.

3.5. Wear Characteristics Analysis of Wear-Rings under Different Clearances

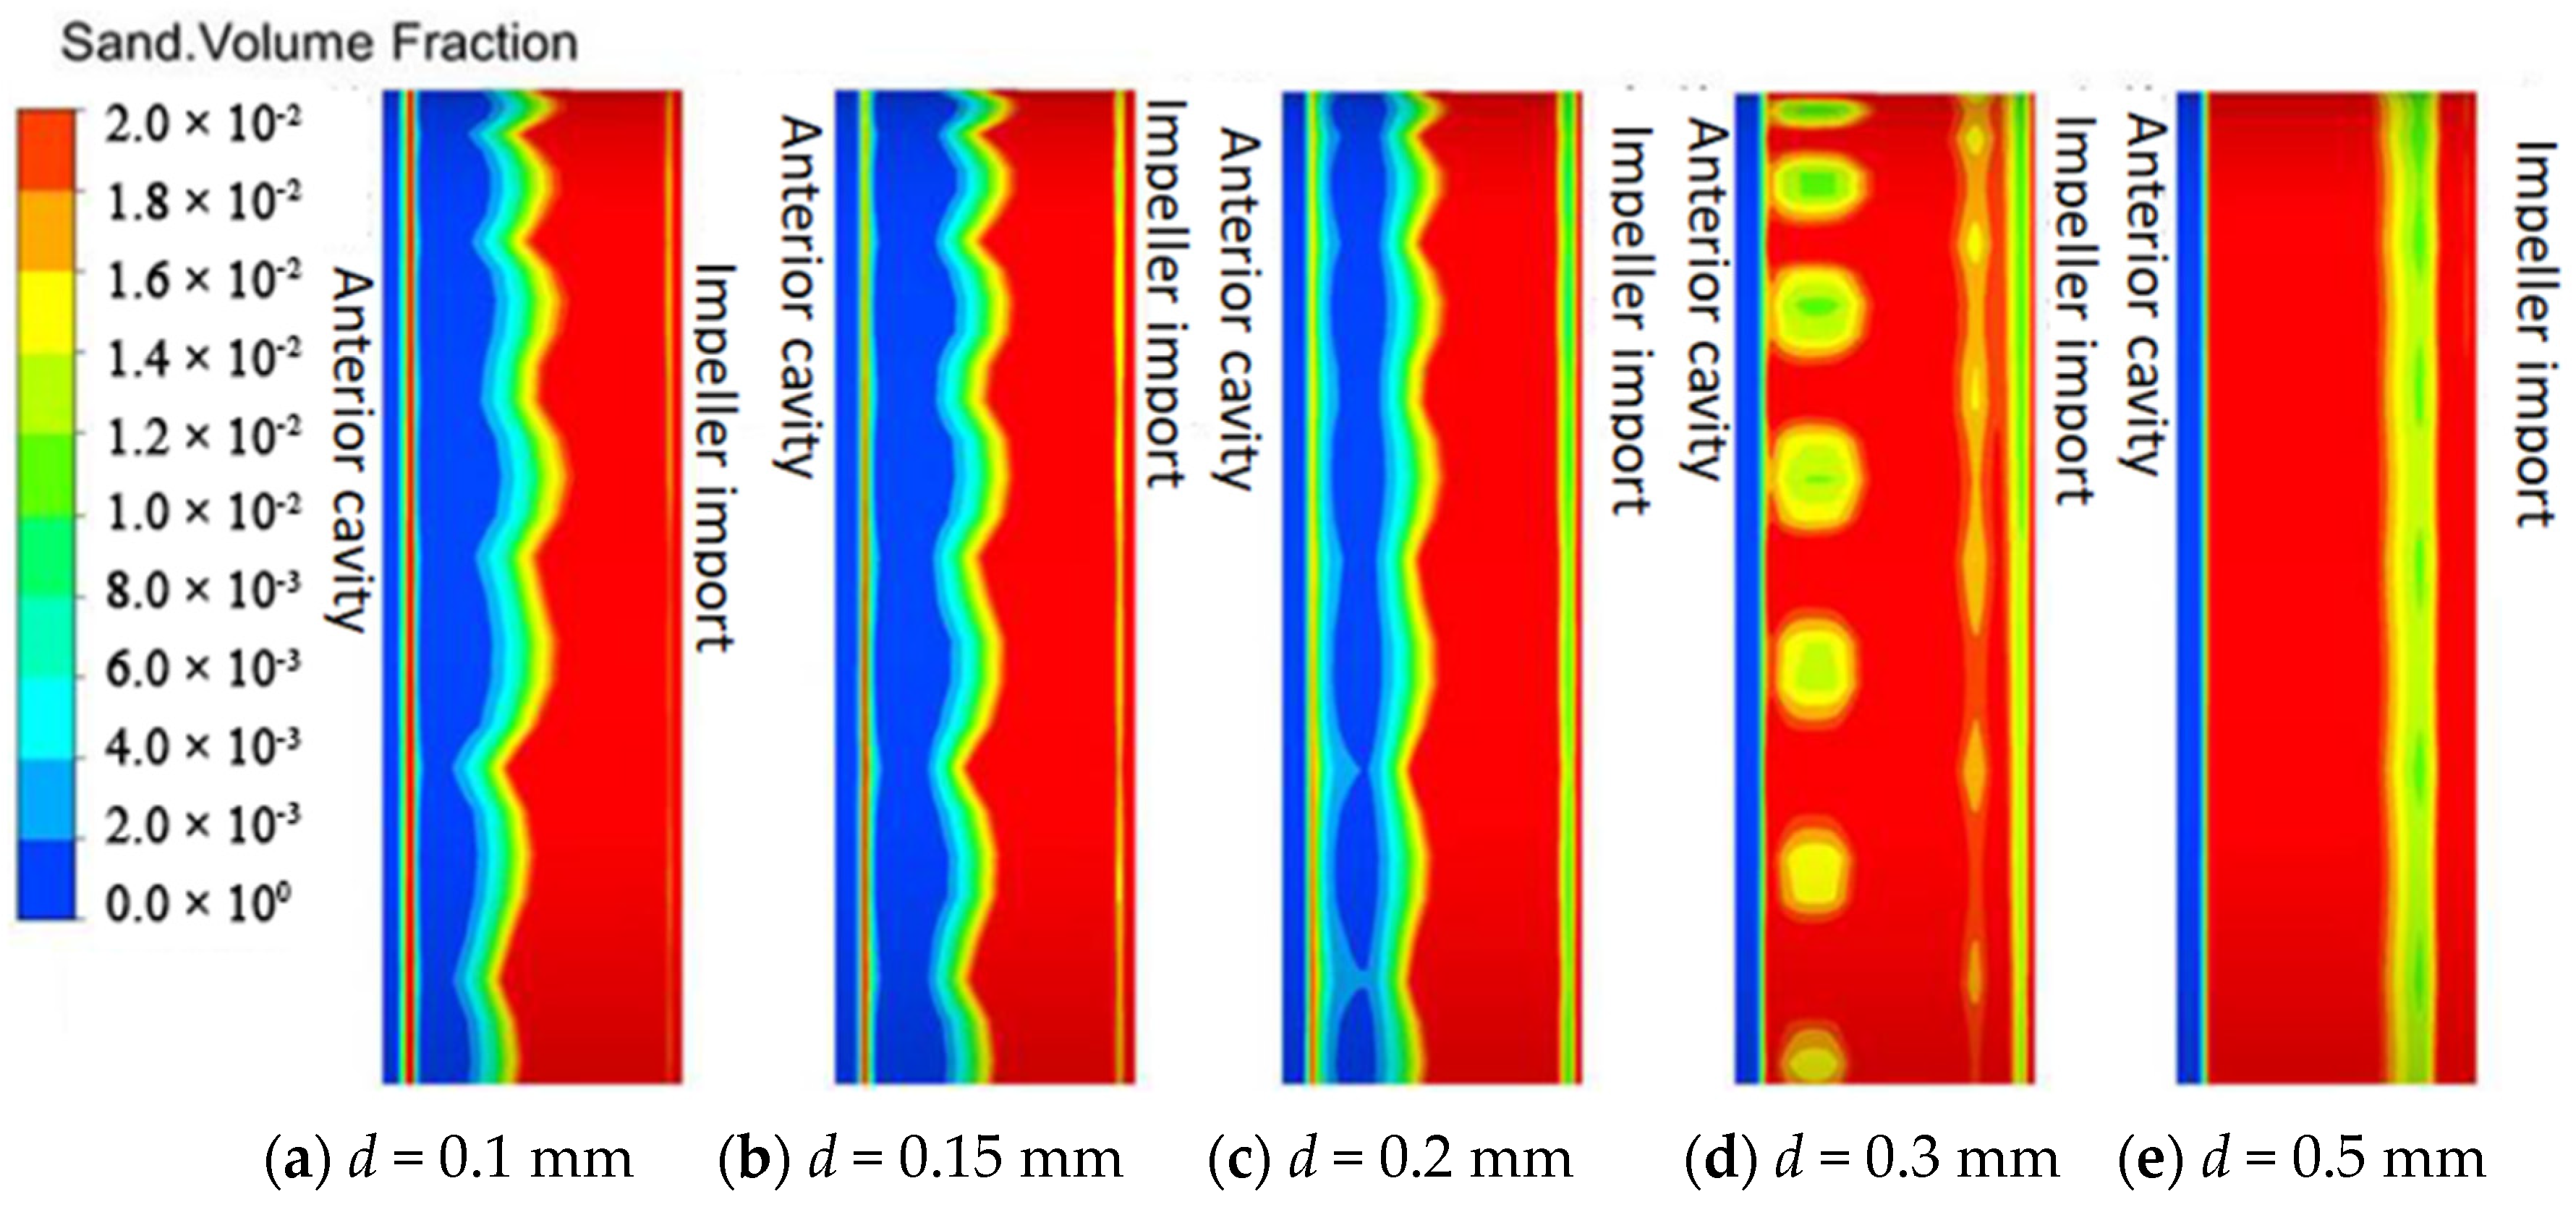
Figure 18 shows the distribution diagram of a solid phase volume fraction of the wear-rings at the same time. The solid at the wear-rings is mainly formed by the accumulation of fluid leaking from the front cavity of the volute to the inlet of the impeller. By analyzing the volume fraction distribution diagram of a solid, the leakage of the inlet fluid from the front cavity of the volute through the wear-rings to the impeller can be more intuitively understood.
According to the pressure distribution state at the wear-rings in Figure 10, it can be clearly seen from the solid phase volume fraction distribution diagram of the wear-rings when the clearance is 0.1 mm, the solid phase volume fraction at the inlet of the wear-rings and the impeller is higher, and the solid phase volume fraction at the left wear-ring in the interface is also relatively high. The solid phase concentration of the connected part of the wear-rings and the front cavity is higher, but the volume fraction of the solid phase in the left anterior cavity of the connected part is lower. This is because, when the clearance of the wear-rings is small, the pressure difference between the front cavity of the volute and the inlet of the impeller is large, and the fluid flow rate is fast, so that the solid particles cannot be taken away to accumulate. Then, before the liquid in the front cavity of the volute enters the wear-rings, there is a process of a sudden reduction of the flow area. Due to the great difference in flow velocity, solid particles accumulate on the boundary of the suddenly narrowed wear-rings, resulting in a high solid phase concentration and linear shape between the wear-rings and the front cavity. With the increase of clearance, the pressure difference between the wear-rings near the front cavity and the inlet of the impeller decreases, the flow rate slows down, and the solid volume fraction at the junction of the wear-rings and the front cavity decreases. The solid volume fraction at the wear-rings near the front cavity increase gradually, while the solid volume fraction at the junction of the wear-rings and the inlet decrease clearly. This is because, when the fluid flows out of the wear-rings after a sudden expansion tube, the flow rate here compared to the junction of the impeller inlet and the wear-rings is greater. When the clearance increases and the flow rises, it significantly takes away the solid particles that should have accumulated there, so that the solid particle concentration decreases. When the clearance of the wear-rings is 0.5 mm, the solid volume fraction at the junction of the wear-rings and the inlet of the impeller is significantly smaller and shows a banded distribution, while the solid phase concentration near the front cavity of the wear-rings is significantly higher.
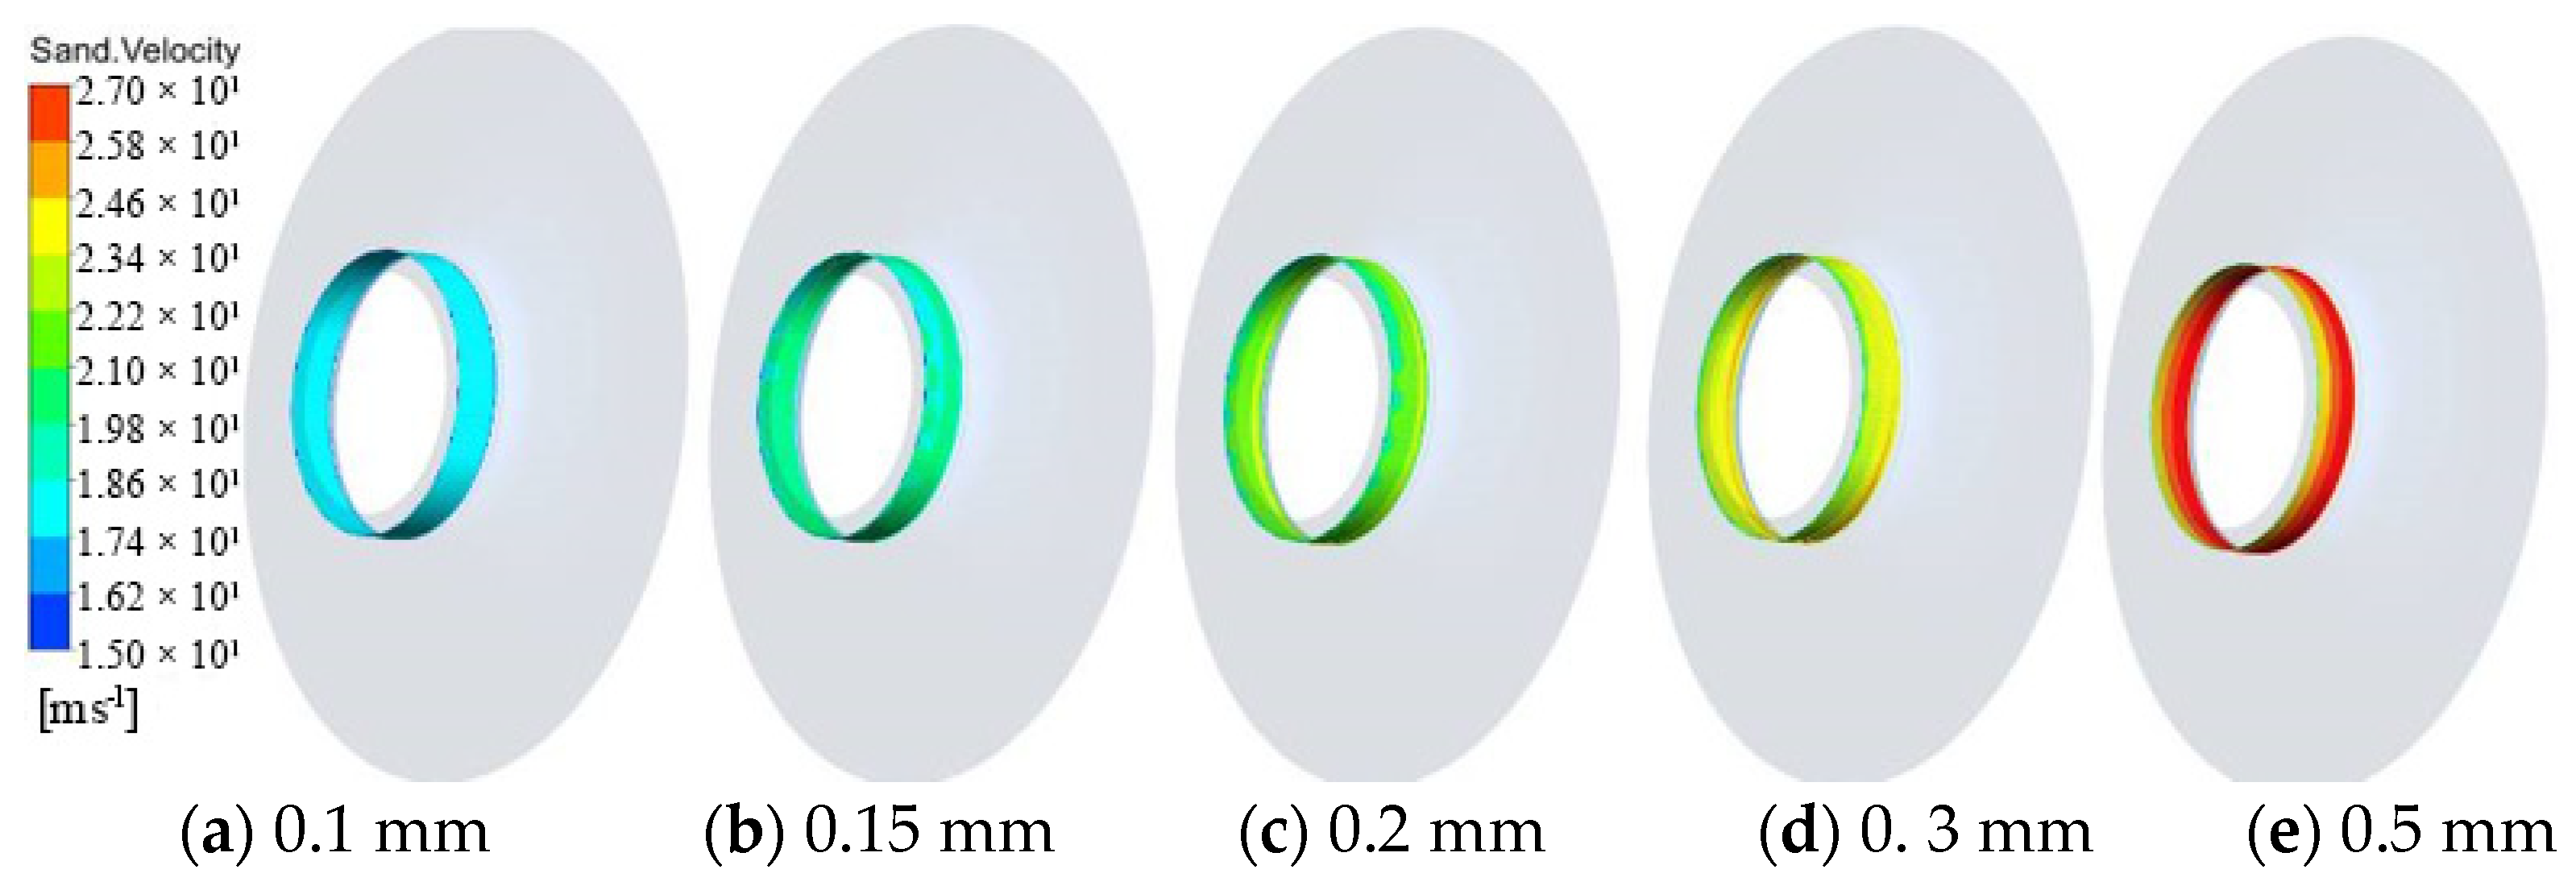
Figure 19 below shows the velocity cloud diagram at the wear-rings under rated conditions and different clearance conditions when the solid concentration is 50 kg/m3. When the clearance is 0.1 mm, the velocity distribution is relatively uniform. With the clearance of the wear-rings increasing, the velocity at the wear-rings increases gradually, and the velocity gradient near the front cavity is relatively fast. However, the velocity distribution in the front cavity is not uniform, which is caused by the asymmetry of the volute structure. It can be seen from Figure 10 that vortexes are likely to occur in the front cavity, and the vortexes decrease when the clearance increases. When the vortex decreases, the solid phase back-flow can be reduced, so that the mass flow through the clearance increases, and the velocity finally increases.
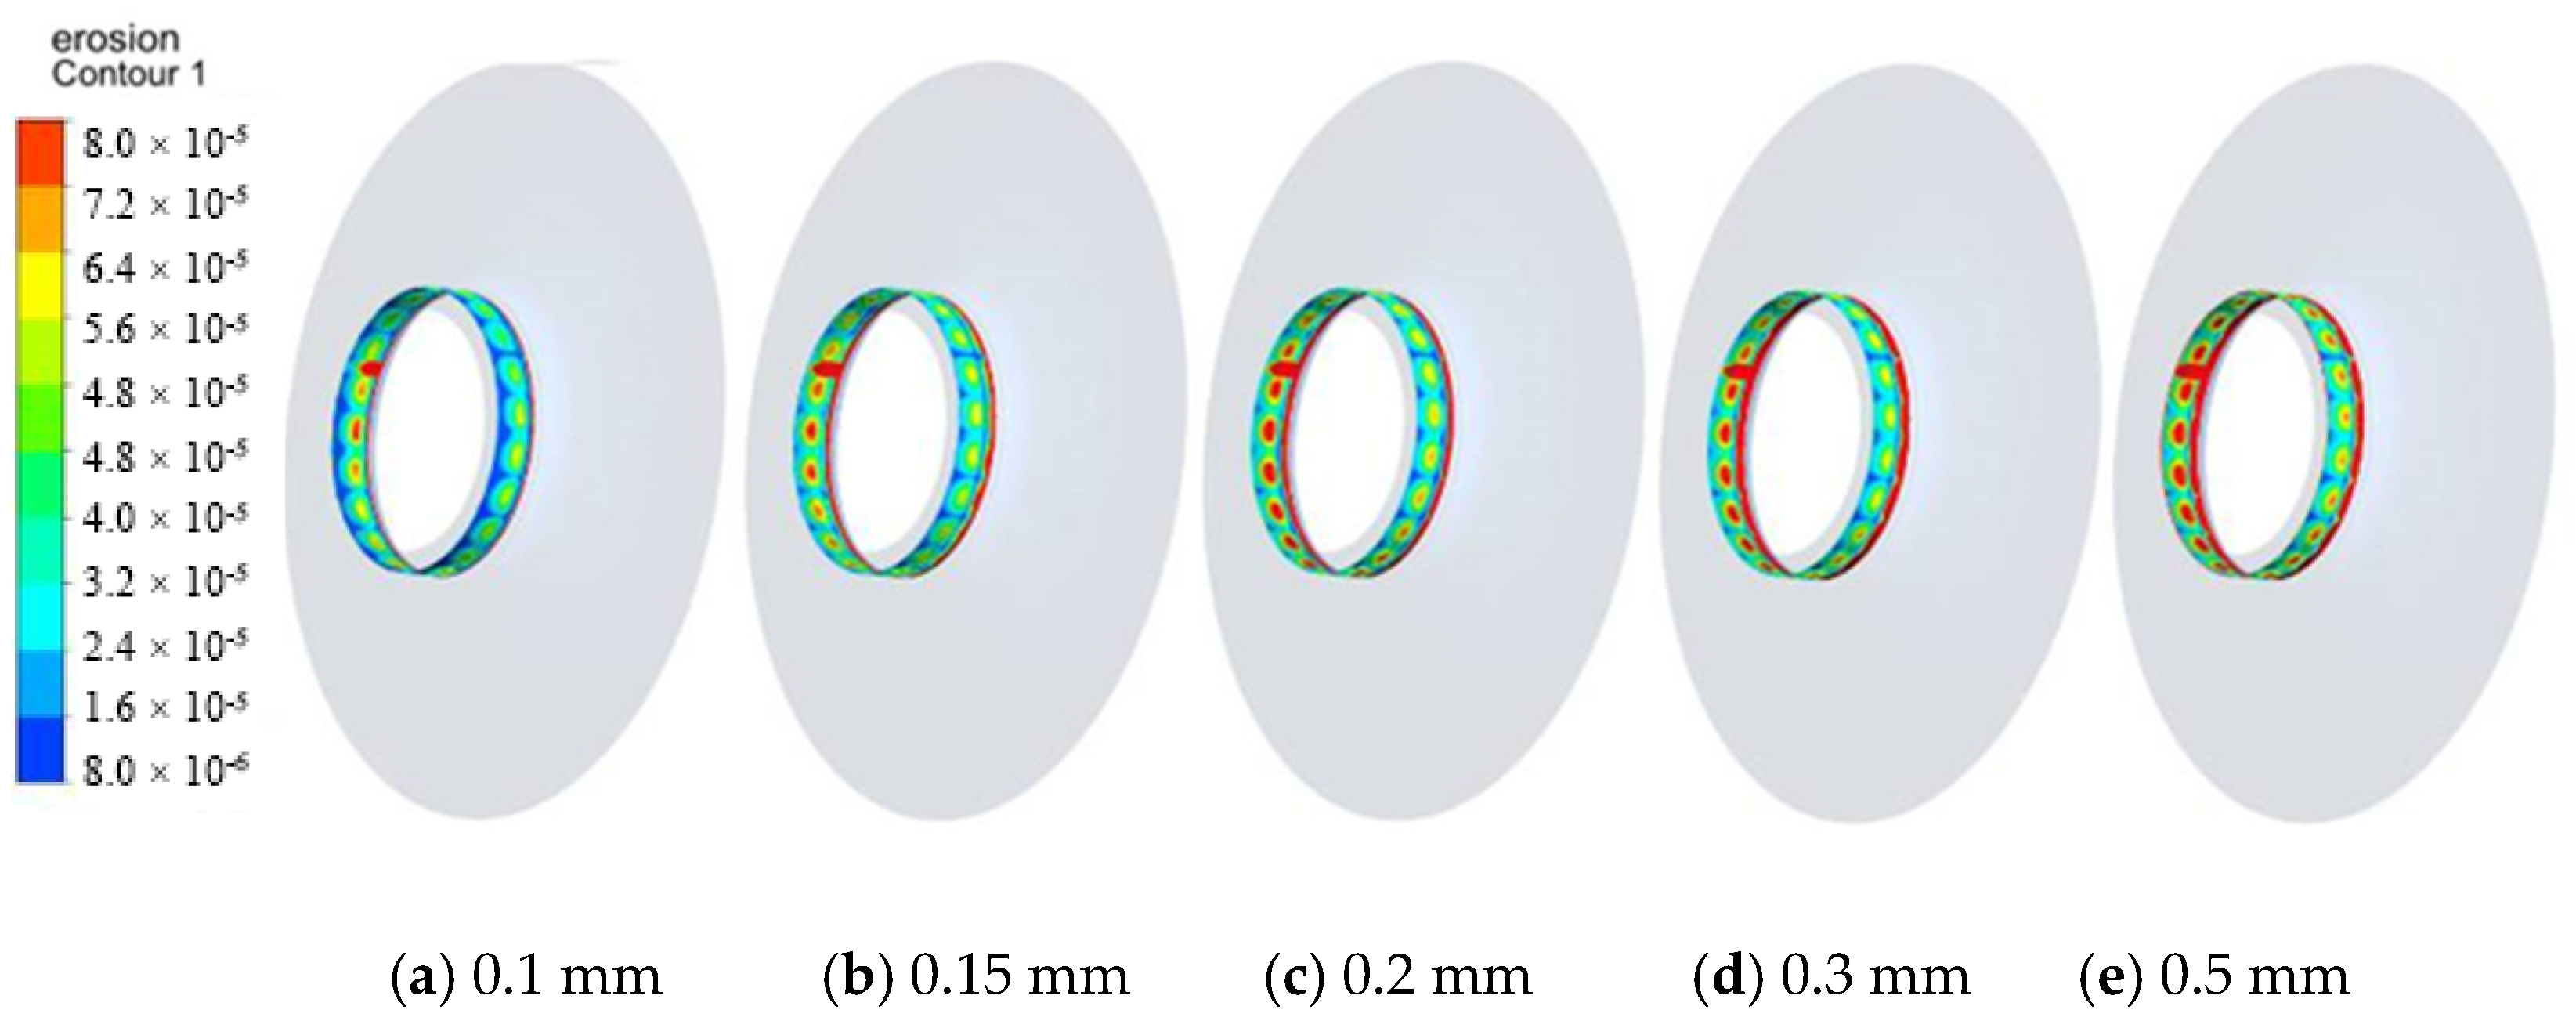
Figure 20 below shows the wear distribution at the wear-rings in rated conditions with the solid phase concentration of 50 kg/m3 and under different clearance conditions of the wear-rings. It can be seen from the figure that, when the clearance is 0.1 mm, the area with severe wear is the wear-rings near the front cavity, which is linearly distributed. In the middle of the wear-rings, there is a point-like circumferential distribution with severe wear at the center of the point and uneven distribution. With the increase of the clearance, the wear area near the front cavity gradually widens and presents a zonal distribution, and the severe wear area in the middle of the wear-rings expands from a point-like circumferential distribution to a round-like circumferential distribution.

4. Conclusions

Based on the combination of theoretical analysis and numerical simulation, the reliability of the numerical calculation method was verified by comparing the experimental data with the numerical simulation results. Euler two-phase flow mixing model, k-ε turbulence model, and the McLaury wear model were used to calculate the wear rate of the centrifugal pump, and the flow lines and particle velocity of the impeller are studied under the conditions of different wear-rings clearance and fluid medium particle concentration. In addition, the wear of the impeller blade and wear-rings are also studied by the velocity of the distribution of solid particles. The conclusions are as follows.
(1)
The wear of the centrifugal pump blade is mainly concentrated in the end and the inlet of the blade because the tip of the blade is moving at a higher speed and the solid particles at the front of the blade have a better positive impact angle. Under the influence of vortexes, the wear at the end of the blade suction surface is very severe, while, that at the front of blade, is more serious.
(2)
With the clearance changing, the maximum wear of the blade changes. When the clearance increases from 0.1 mm to 0.15 mm, the maximum wear in the impeller increases. When the clearance increases from 0.15 mm to 0.5 mm, the maximum wear in the impeller decreases because of the leakage of the wear-rings and energy loss.
(3)
It can be found through the analysis of the solid distribution and pressure distribution at the wear-rings that the solid distribution presents different distribution states with the change of the clearance. In general, the larger the clearance is, the higher the solid concentration is. The analysis of the impeller’s front cavity shows that the pressure of the front cavity is affected by the change of the clearance, which influences the flow of the fluid and the movement of solid particles in the front cavity.
(4)
As the clearance of the wear-rings increases, the wear of the centrifugal pump becomes more significant, and the severe wear area presents a point-like circumferential distribution.
The conclusions are also limited to centrifugal pumps similar in structure and purpose to the model pumps studied in this article. Other types of pumps need to be further studied for their related characteristics, which can provide a certain method reference for other types of centrifugal pump-related research.

Author Contributions

Writing—original draft preparation, writing—review and editing, visualization, C.Y.; software, J.L.; project administration, funding acquisition, S.Z.; methodology, B.H.; resources, J.D. All authors have read and agreed to the published version of the manuscript.

Funding

The authors gratefully acknowledge the financial supports given by the National Nature Science Foundation of China (No. 51976193).

Conflicts of Interest

The authors declare no conflict of interest.

References

  1. Xie, N.; Battaglia, F.; Pannala, S. Effects of using two- versus three-dimensional computational modeling of fluidized beds: Part II, budget analysis. Powder Technol. 2008, 182, 14–24. [Google Scholar] [CrossRef]
  2. Wu, B.; Yan, H.Z.; Duan, Y.Q. 3D Numerical Simulation of Turbulent Flow and Wear Characteristics of Slurry Pump. China Mech. Eng. 2009, 20, 719–722. [Google Scholar]
  3. Liu, J.R.; Xu, Y.G.; Wang, D.M. Numerical analysis of solid-liquid two-phase flow and centrifugal pump impeller. Trans. Chin. Soc. Agric. Mach. 2010, 41, 86–90. [Google Scholar]
  4. Tao, Y.; Yuan, S.Q.; Zhang, J.F.; Zhang, F.; Tao, J.Q. Numerical Simulation and Experiment on Wear of Slurry Pump Impeller. Trans. Chin. Soc. Agric. Eng. 2014, 30, 63–69. [Google Scholar]
  5. Li, Y. Numerical Study of Suspended Sediment Movement Near Shore Based on Solid-Liquid Two-Phase Turbulence Theory; Tsinghua University: Beijing, China, 2007. [Google Scholar]
  6. Annaland, M.V.S.; Bolckers, G.A.; Goldschmidt, M.J.V. Development of a mufti-fluid model for poly-disperse dense gas solid fluidized beds, Part II: Segregation in binary particle mixtures. Chem. Eng. Sci. 2009, 64, 4237–4246. [Google Scholar] [CrossRef]
  7. Zhang, Z.C. Study on Sediment Wear Characteristics of Double Suction Centrifugal Pumps; Agricultural University: Beijing, China, 2016. [Google Scholar]
  8. Li, Y.S.; Wei, J.F. Numerical simulation of small particle size solid-liquid two-phase flow in swirl pump. Fluid Mach. 2010, 38, 20–24. [Google Scholar]
  9. Peng, G.J.; Wang, Z.W.; Fu, S.S. Wear characteristics of centrifugal mud pump overflow parts. J. Drain. Irrig. Mach. Engine 2015, 33, 1013–1018. [Google Scholar]
  10. Chen, S.; Wang, Z.C.; Lu, F.X. Numerical calculation of impeller wear based on discrete phase model. J. China Univ. Pet. Nat. Sci. Ed. 2015, 3, 143–148. [Google Scholar]
  11. Tabakoff, W.; Kotwal, R.; Hamed, A. Erosion study of different materials affected by coal ash particles. Wear 1979, 52, 161–173. [Google Scholar] [CrossRef]
  12. McLaury, B.S. A Model to Predict Solid Particle Erosion in Oil Field Geometries; The University of Tulsa: Tulsa, OK, USA, 1993. [Google Scholar]
  13. Oka, Y.; Okamura, K.; Yoshida, T. Practical estimation of erosion damage caused by solid particle impact. Part 1: Effect of impact parameters on a predictive equation. Wear 2005, 259, 95–101. [Google Scholar] [CrossRef]
  14. Oka, Y.; Okamura, K.; Yoshida, T. Practical estimation of erosion damage caused by solid particle impact. Part 2: Mechanical properties of materials directly associated with erosion damage. Wear 2005, 259, 102–109. [Google Scholar] [CrossRef]
  15. Qian, Z.D.; Wang, Y.; Xie, H. Analysis of the influence of auxiliary vane on the sand abrasion of double-suction centrifugal pump. J. Hydroelectr. Eng. 2012, 31, 232–237. [Google Scholar]
  16. Huang, J.D.; Zhang, K.T.; Chen, L. Experimental Study on the Wear of Centrifugal Pump Impeller by Water Containing Sand. J. Eng. Thermophys. 1999, 20, 448–452. [Google Scholar]
  17. Wang, J.Q.; Jiang, W.M.; Kong, F.Y. Numerical simulation of internal flow field and wear characteristics of solid-liquid two-phase flow centrifugal pump. J. Agric. Mach. 2013, 44, 53–66. [Google Scholar]
  18. Qiaorui, S.; Gérard, B.; Qifeng, J.; Wenting, H.; Asad, A.; Shouqi, Y. Investigation on the Handling Ability of Centrifugal Pumps under Air–Water Two-Phase Inflow: Model and Experimental Validation. Energies 2018, 11, 3048. [Google Scholar]
  19. Tarek, A.G.; Meftah, H. Gas–Liquid Two-Phase Upward Flow through a Vertical Pipe: Influence of Pressure Drop on the Measurement of Fluid Flow Rate. Energies 2018, 11, 2937. [Google Scholar]
  20. Wang, W.J.; Li, T.L. Numerical analysis of gas-liquid two-phase flow in jet centrifugal pump. Fluid Mach. 2020, 48, 53–57. [Google Scholar]
  21. Safa, R.; Goharrizi, A.S. CFD Simulation of an Industrial Hydrocyclone with Eulerian-Eulerian Approach: A Case Study. Int. J. Min. Sci. Technol. 2014, 24, 643–648. [Google Scholar] [CrossRef]
  22. Swain, S.; Mohanty, S. A 3-Dimensional Eulerian-Eulerian CFD Simulation of a Hydrocyclone. Appl. Math. Model. 2013, 37, 2921–2932. [Google Scholar] [CrossRef]
  23. Zare, M.; Ashtiani, F.Z.; Fouladitajar, A. CFD Modeling and Simulation of Concentration Polarization in Microfiltration of Oil-Water Emulsions; Application of an Eulerian Multi-phase Model. Desalination 2013, 324, 37–47. [Google Scholar] [CrossRef]
  24. Kubilay, A.; Derome, D.; Blocken, B.; Carmeliet, J. CFD Simulation and Validation of Wind-Driven Rain on a Building Fa- cade with an Eulerian Multiphase Model. Build. Environ. 2013, 61, 69–81. [Google Scholar] [CrossRef]
  25. Yu, X.; Hassan, M.; Ocone, R.; Makkawi, Y. A CFD Study of Biomass Pyrolysis in a Downer Reactor Equipped with A Novel Gas- Solid Separator-I: Hydrodynamic Performance. Fuel Process. Technol. 2014, 126, 366–382. [Google Scholar] [CrossRef] [Green Version]
  26. Zhang, C.; Zhao, T.C.; Liao, N.B.; Xu, S.Y. Numerical simulation study on the internal characteristics and particle distribution of centrifugal pumps under solid-liquid two-phase flow. J. Vac. Sci. Technol. 2019, 39, 870–875. [Google Scholar]
  27. Huang, S.; Su, X.; Guo, J.; Yue, L. Unsteady Numerical Simula-tion for Gas-Liquid Two-Phase Flow in Self-Priming Process of Centrifugal Pump. Energy Convers. Manag. 2014, 85, 694–700. [Google Scholar] [CrossRef]
  28. Liu, Z.L.; Zhang, N.; Cheng, X.R.; Shen, L.X.; Zhao, W.G. Analysis of blade wear characteristics of sand-contained underwater single-stage double-suction centrifugal pumps. J. Lanzhou Univ. Technol. 2014, 40, 56–61. [Google Scholar]
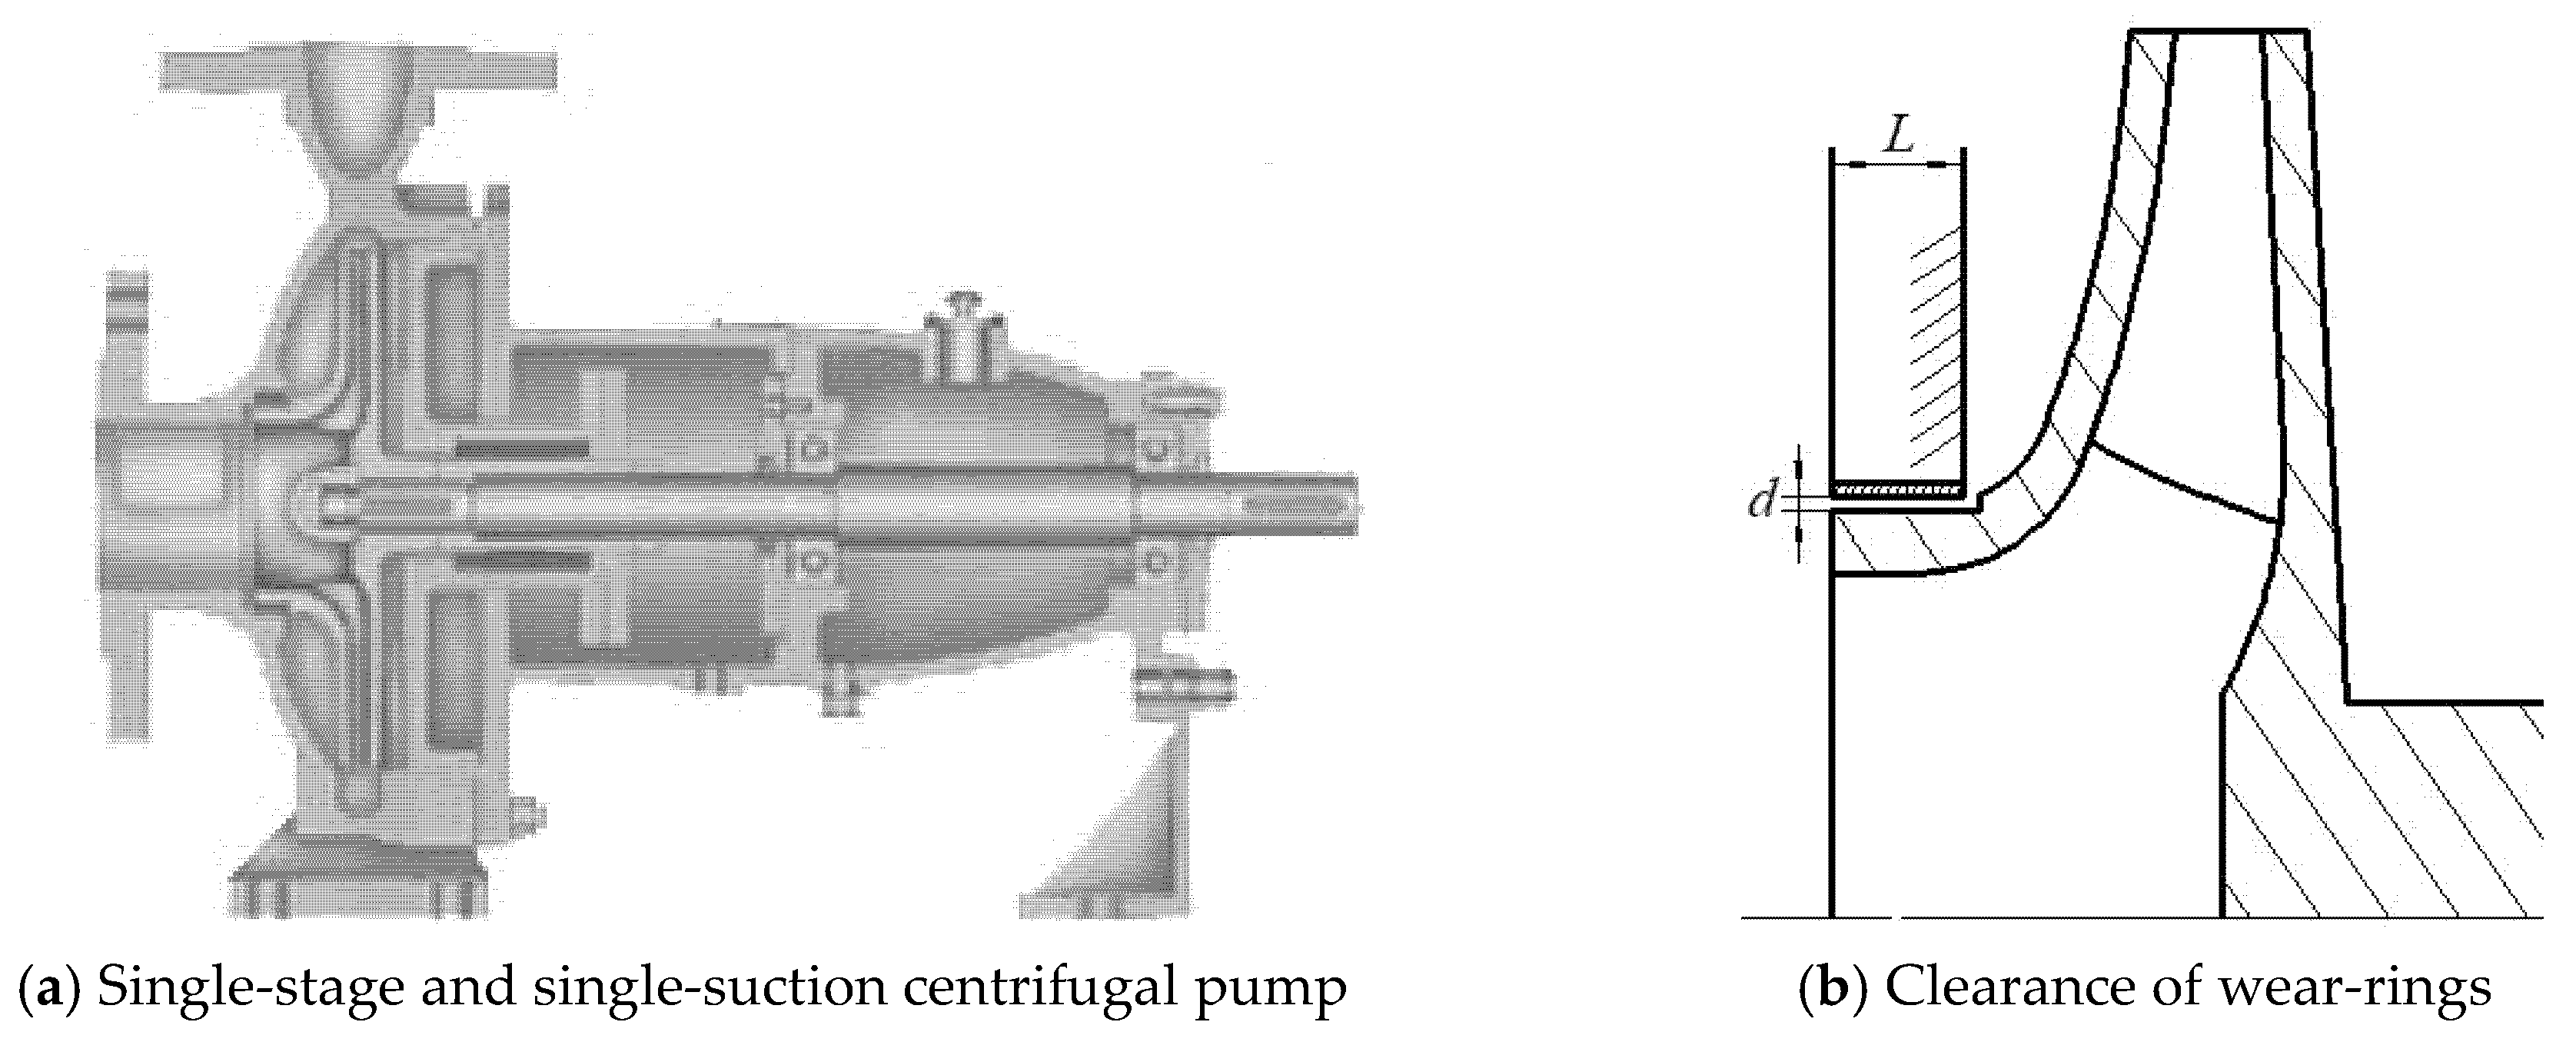
Figure 1. Schematic diagram of the model pump.
Symmetry 12 02003 g001
Figure 2. Three-dimensional modeling diagram of the fluid field in a centrifugal pump.
Symmetry 12 02003 g002
Figure 3. Grid of the computing model.
Symmetry 12 02003 g003
Figure 4. Grid independence verification.
Symmetry 12 02003 g004
Figure 5. Centrifugal pump test bench. 1-Water-sealed valve, 2-voltage stabilizer, 3-experimental pump, 4-torque meter, 5-motor, 6-flow meter, 7-Flow control valve, 8-water tank, 9-digital indicator, 10-pressure gauge, and 11-outlet valve.
Symmetry 12 02003 g005
Figure 6. Simulation of the external characteristics of the centrifugal pump-experimental value curve.
Symmetry 12 02003 g006
Figure 7. Performance of the centrifugal pump with sediment under different wear-rings clearances.
Symmetry 12 02003 g007
Figure 8. Instantaneous static pressure distribution of centrifugal pumps under a different clearance.
Symmetry 12 02003 g008
Figure 9. Static pressure distribution diagram of section y = 0 under different clearances.
Symmetry 12 02003 g009aSymmetry 12 02003 g009b
Figure 10. Pressure distribution of the circumferential section under a different clearance.
Symmetry 12 02003 g010
Figure 11. Distribution of liquid velocity on the axis of the front pump cavity under a different clearance.
Symmetry 12 02003 g011
Figure 12. Streamline of liquid velocity at y = 0 cross-section in the front cavity under a different clearance.
Symmetry 12 02003 g012
Figure 13. Solid volume fraction at z = 0 cross section of the centrifugal pump.
Symmetry 12 02003 g013aSymmetry 12 02003 g013b
Figure 14. Distribution of solid volume and flow velocity in the middle section under a different clearance.
Symmetry 12 02003 g014aSymmetry 12 02003 g014b
Figure 15. Wear rate distribution of the impeller under a different clearance.
Symmetry 12 02003 g015
Figure 16. A sketch map of the actual wear of a blade at a high concentration.
Symmetry 12 02003 g016
Figure 17. Wear rate distribution of the volute wall under a different clearance.
Symmetry 12 02003 g017
Figure 18. Solid volume fraction of a circumferential section of wear-rings.
Symmetry 12 02003 g018
Figure 19. Velocity nephogram under a different clearance.
Symmetry 12 02003 g019
Figure 20. Distribution map of the wear rate under different clearances.
Symmetry 12 02003 g020
Table 1. Main parameters of the model pump.
ParameterValue
Impeller inlet diameter D180 mm
Impeller outer diameter D2250 mm
Number of blades Z5
Angle of the tongue β24°
Impeller outlet width b6.5 mm
Base circle diameter D3260 mm
Outlet diameter D450 mm
Publisher’s Note: MDPI stays neutral with regard to jurisdictional claims in published maps and institutional affiliations.