1. Introduction
Aesthetic experience is essential to our quality of life. Philosophers, psychologists, and artists have searched for the essence of aesthetic experience for centuries [
1]. Recently, psychologists and neuroscientists have approached this issue from the perspective of image properties and their links to the functions of the visual system. For instance, in the Fourier domain, scholars know the amplitude spectrum of a natural image, when averaged across orientation, is inversely proportional to spatial frequencies,
f [
2,
3,
4]. That is, the amplitude is proportional to
f−α and in turn is a linear function of frequency with spectrum slope −
α. In some studies, researchers discuss spectrum slope in the context of fractals, a mathematical construct that can characterize the complexity of an image. The fractal dimension (FD) of an image has a monotonic relationship with spectrum slope [
5].
The relationship between spectrum slope and human aesthetic preference for an image is well established. Human observers show a strong aesthetic preference for images with a spectrum slope near −1 [
6,
7,
8,
9], and less preference for images with either steeper or shallower slopes. Analyses of the Fourier spectrum of artworks have shown that paintings also have a spectrum slope of −1 [
1,
10,
11,
12]. In particular, Western portraits since the Renaissance also tend to have a spectrum slope of −1, whereas the photos of human faces do not [
1]. Thus, in the process of increasing the aesthetic appeal of their works instead of creating a faithful imagery of their subjects, artists actually represent the image in a way that fits their works into the −1 spectrum slope. The −1 spectrum slope is also typical of a scene in a natural environment [
2,
3,
4]. Thus, the aesthetic preference for a spectrum slope of −1 may be due to its similarity to the image statistics of a natural scene [
6,
8,
9] as the human visual system, after a long history of evolution, is optimized to process this information [
13,
14,
15].
Furthermore, symmetry can also influence visual aesthetic preferences [
16,
17,
18,
19,
20]. Human observers generally prefer symmetric faces or bodies to asymmetric ones [
21,
22,
23]. Such a preference for symmetry has also been found for abstract patterns that have no immediate biological significance [
18,
24,
25,
26,
27]. Thus, an image’s properties, rather than the object it represents, should induce such a preference.
The relationship between the preference for spectrum slope and symmetry is not clear. In the context of Fourier analysis, the spectrum slope is a property of the amplitude spectrum, whereas symmetry manifests itself in the cosine component of the phase spectrum. One can independently manipulate these two factors. However, in aesthetic preference research, the result may suggest otherwise. Chen et al. [
19] investigated human aesthetic preferences for several kinds of images, including scrambled images and symmetric patterns with different numbers of symmetry axes. They found that the human aesthetic preference for symmetric patterns increased with the number of symmetry axes. However, they also noticed that the edges at symmetry axes led to an energy increment at high spatial frequencies and, in turn, a shallower spectrum slope for symmetric images. The effect is more pronounced as the number of symmetry axes increases, and thus it increases in the same direction as preference. Other researchers have also noticed the co-occurrence between symmetric structure and fractal dimension [
28], which, as discussed above, is a monotonic function of the spectrum slope. Bies et al. [
29] showed the preference to mirror symmetric fractal pattern increased with fractal dimension. Studies of other aspects of human visual performance, such as detection, have also shown that an interaction exists between symmetry and spectrum slope [
30]. Hence, spectrum slope may influence the preference for symmetric patterns.
In this study, we aimed to separate the spectrum slope from symmetry effects on aesthetic preference. Here, we used an algorithm to control the exact spectrum slope of an image, independent of its number of symmetry axes, to separate their effects on aesthetic preference. If the preference for symmetry were entangled with spectrum slope, as discussed above, then we would expect the spectrum slope to determine the preference for an image, regardless of its number of symmetry axes. Otherwise, the number of symmetry axes should affect preferences, as controlled by the spectrum slope. In this case, we should observe either an additive effect, if the effects of the two factors were independent from each other, or a modulation effect of symmetry on the relationship between spectrum slope and preference, if the two factors interact.
2. Materials and Methods
2.1. Ethics Statement
The Institutional Review Board of National Taiwan University approved this study (#201505EM020). The use of human observers followed the guidelines of the Declaration of Helsinki. We obtained written informed consent from each participant prior to the experiment.
2.2. Participants
In total, 43 participants participated in this experiment as follows: 26 females and 17 males between the ages of 18 and 30 (M = 21.74, SD = 2.79). The observers were recruited through Internet advertisements. All of the observers had corrected-to-normal (20/20) visual acuity.
2.3. Apparatus
The stimuli were presented on a 24-inch Eizo LCD monitor with 1920 (H) × 1200 (V) spatial resolution, controlled by a Macintosh G5 computer via a Radeon 7200 graphics card, which provided 10-bit digital-to-analog converter depth. The LCD monitor was calibrated with a PhotoResearch PR655 radiometer for luminance. The display had a mean luminance of 8.85 cd/m
2 and mean chromaticity of (0.33, 0.33) in CIE 1931-xy coordinates. The monitor’s refresh rate was 60 Hz. The viewing distance was set such that each pixel made up 1′ of visual angle. The experimental control and the stimulus generation were written in MATLAB with the Psychophysics Toolbox 3 [
31].
2.4. Stimuli
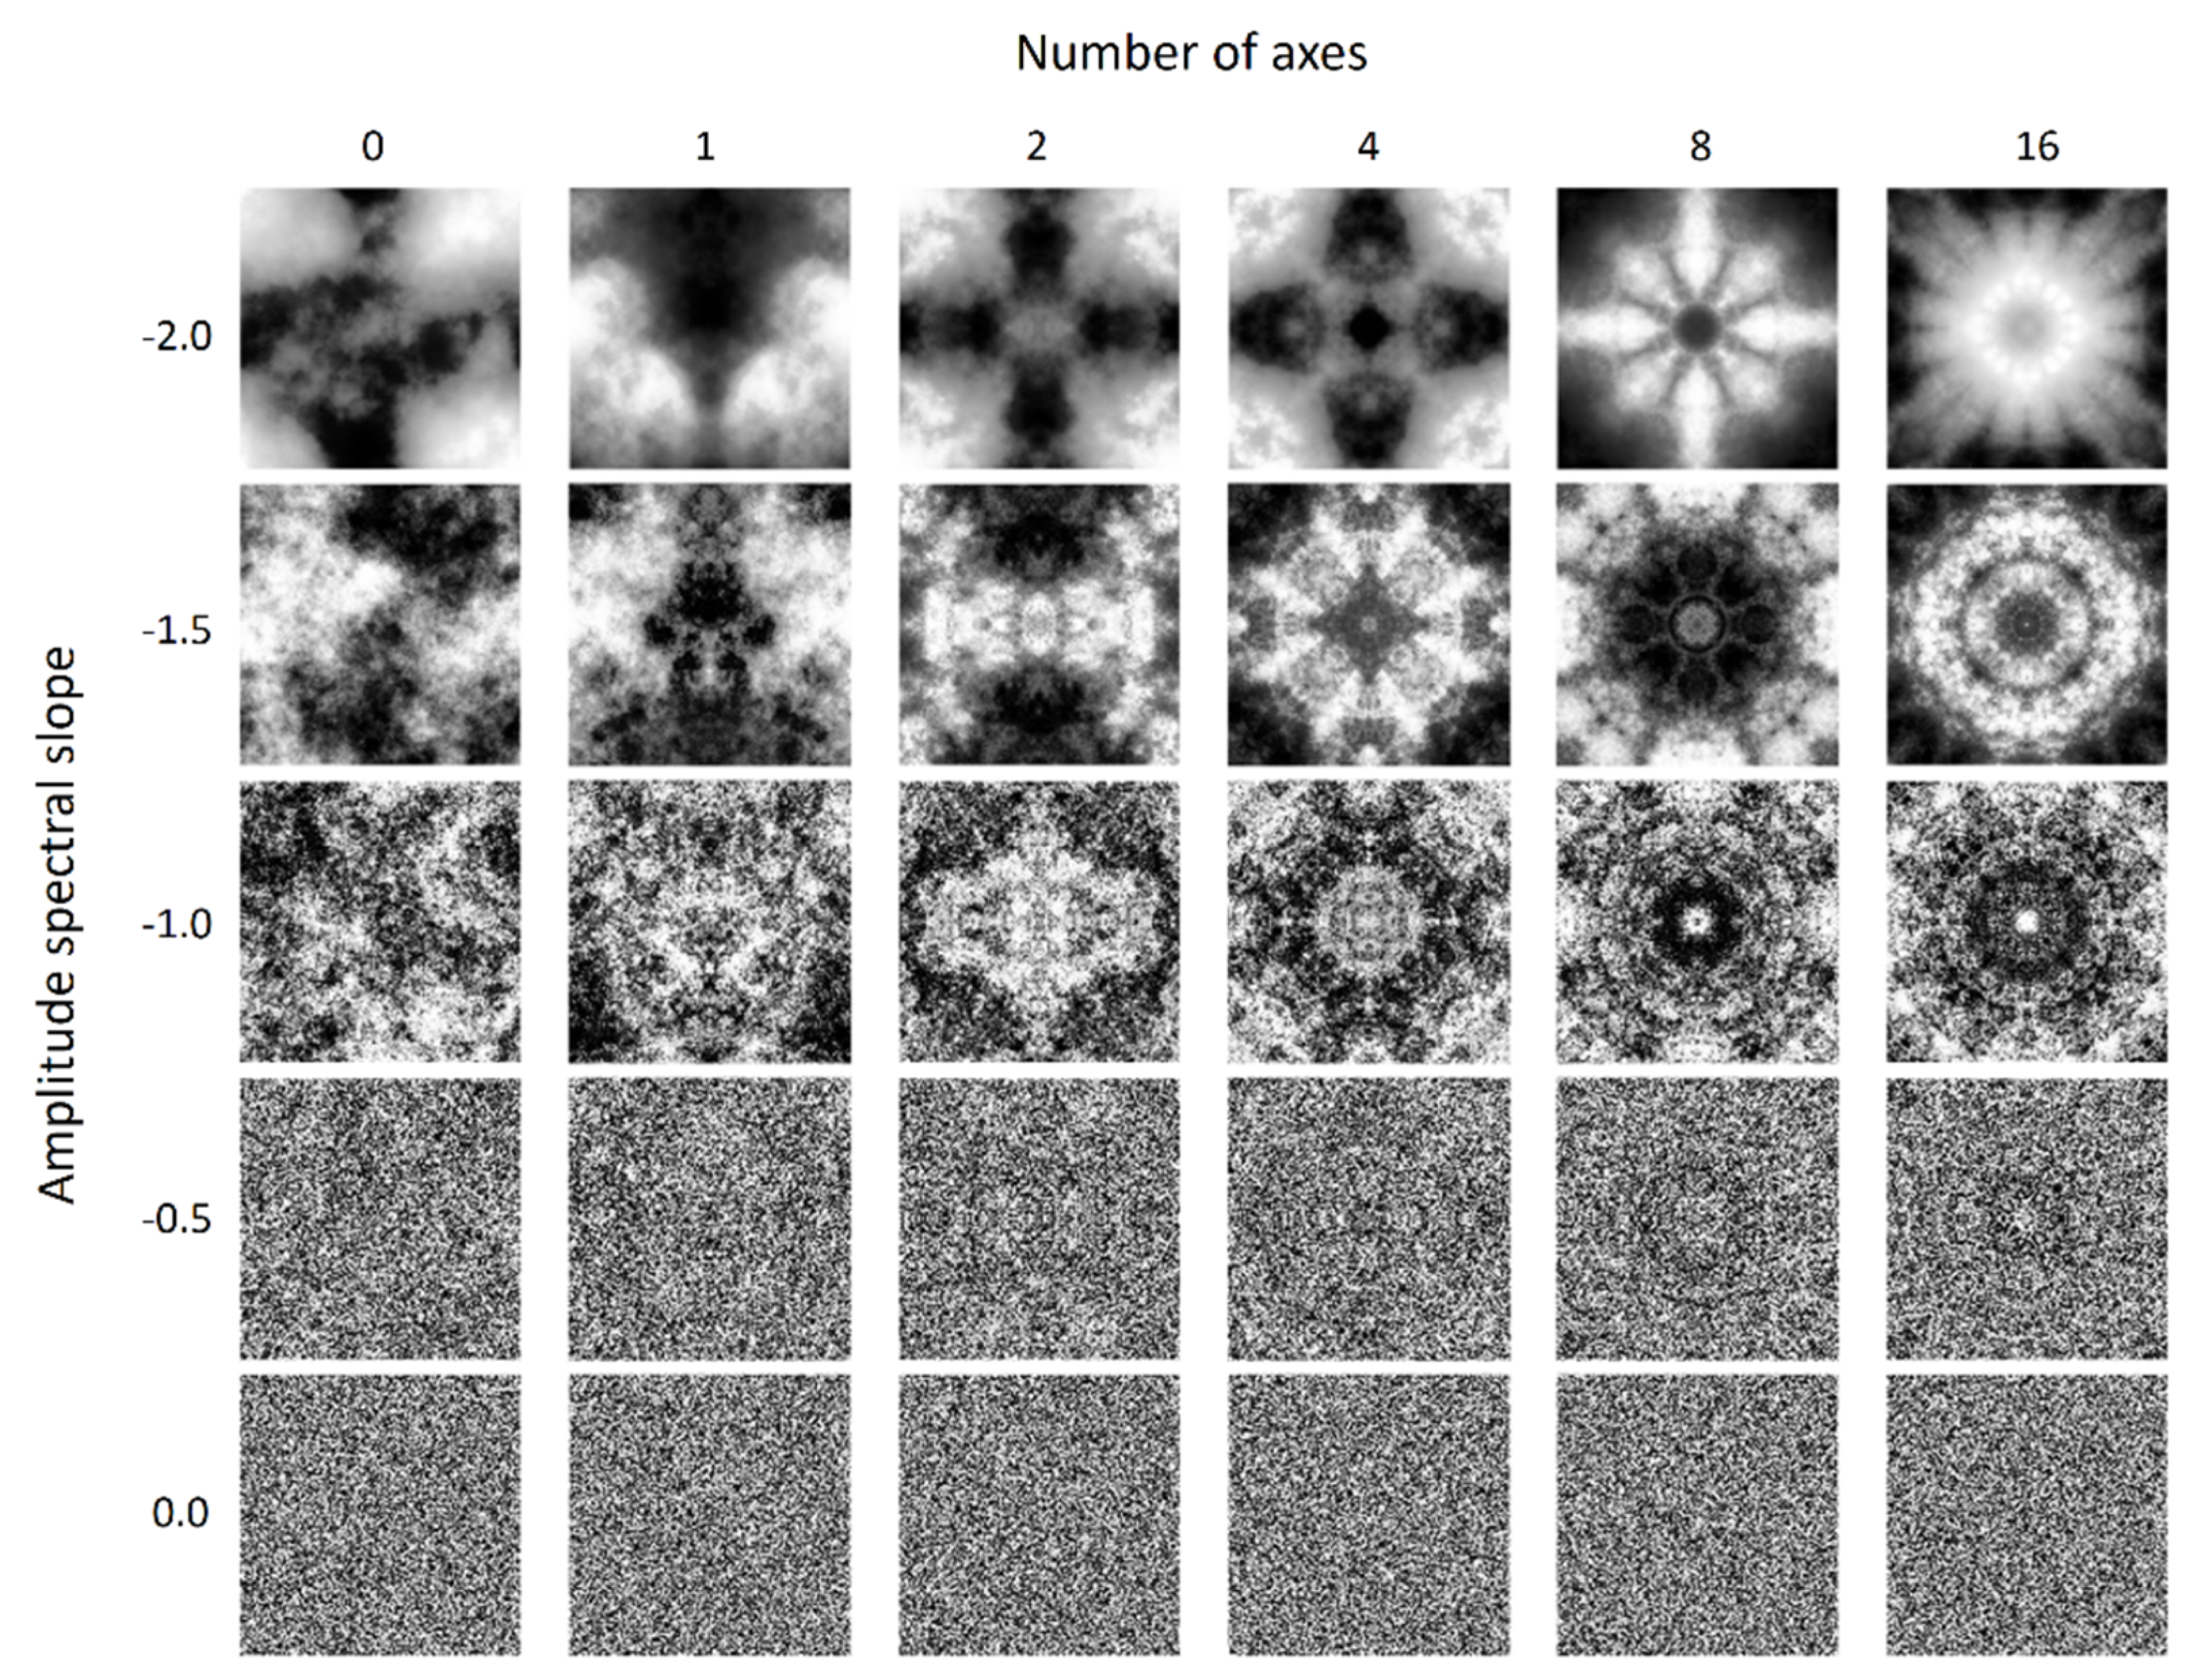
The stimuli were scrambled grayscale images (
Figure 1) with various spectral and symmetric properties. For each asymmetric stimulus, we first created white noise spanning an 8° (H) × 8° (V) visual angle, with the luminance of each pixel randomly drawn from a uniform distribution ranging from 0.51 to 135.94 cd/m
2. We then extracted the image’s phase spectrum with a Fourier transform. We next paired this phase spectrum with a preassigned radially averaged amplitude spectrum with a predetermined slope and then applied inverse Fourier transform to convert them back to an image. The amplitude spectrum slope, −
α, of the image was from −2 to 0 with steps of 0.5. This spectrum slope range was equivalent to a fractal dimension range of 1.1 to 2 as computed by applying a box-counting algorithm on our stimuli. The relationship between the spectrum slope and fractal dimension was similar to that reported by Spehar and colleagues [
32,
33] with the synthetic noise patterns.
To create symmetric images with multiple symmetric axes, we started with scrambled images with a desired slope as created above. Then, we made symmetric versions of them with the following procedure. Let f(r, θ) be the luminance of a point on an image, where r is the distance from that point to the image’s center and θ is the angle (in radiance) between the horizontal axis that passes through the image’s center and the line connecting that point and the center. In the symmetric patterns, one part of the image is a reflection of another part about the symmetry axis. Hence, the luminance of a point L(r, Φ − ∆θ) on the image is the same as that of the point L(r, Φ + ∆θ), where Φ defines the orientation of the axis of symmetry and ∆θ defines the angle difference between a pixel and the axis. For a pattern with n symmetric axes, Φ = i/n × π + z, where i = 0, 2, …, n − 1, and z determines the orientation offset of the axis of symmetry. For instance, if n = 1, then z = 0 would give a horizontally symmetric pattern, whereas z = π/2 would give a vertically symmetric one. In this experiment, we set n = 1, 2, 4, 8, and 16, in which z = π/2 for n = 1, whereas z = 0 for other values of n, to create five types of symmetric patterns (from 1 to 16 axes). Because the rotation of a square image would create a blank space and redundancy near the edge, we started with an 11.67° (H) × 11.67° (V) image and used the central 8° (H) × 8° (V) for the stimuli. We then reassigned the amplitude spectrum slope again to prevent the spectrum slope from changing due to the rotation and cropping operations.
The stimuli contained 30 types of image, which were combinations of five amplitude spectrum slopes and six types of symmetry levels. The five slopes were from −2 to 0 by steps of 0.5, whereas the six symmetry levels contained one asymmetric and five symmetric levels, of which the number of axes was 1, 2, 4, 8, and 16.
We repeated the above procedure to create 50 sets of images for these 30 types of stimulus. Hence, this experiment included 1500 images.
Figure 1 shows examples of our stimuli.
2.5. Procedures
In each trial, a test stimulus was presented at the center of the display, which then disappeared after the observer made a response. The observers’ task was to press a key to indicate their aesthetic judgment of the test stimulus on a 6-point Likert scale (1 = not beautiful, 6 = most beautiful). The observers were instructed to use the whole scale to rate their preferences for all of the images in the stimulus set and to avoid making judgments based on their personal experience with other images. The aim was to encourage the observers to anchor the extreme values of the Likert scale to the stimuli in this experiment, rather than to other images, whose aesthetic values might span a much greater range than our stimuli did. The intertrial interval (ITI) was 800 ms.
There were 20 blocks in this experiment, each containing one set of images randomly selected from 50 pregenerated image sets, each of which contained 30 types of images, without repetition. Hence, each participant was required to rate 600 images. The images of each block were randomly presented.
4. Discussion
In this study, we manipulated the spectrum slope and the number of symmetry axes to investigate the effects of amplitude spectrum and spatial structure on aesthetic preference. We measured the preference ratings of images with different combinations of spectrum slopes and numbers of axes. Overall, aesthetic preference increased monotonically as the number of symmetry axes increased but was an inverted U-shaped function of amplitude spectrum slope. Furthermore, the effect of amplitude spectrum slope was enhanced as the number of symmetry axes increased. That is, symmetry modulated the amplitude of the spectrum slope effect on aesthetic preference.
Overall, the maximum preference ratings were located at slope −1 for all symmetric conditions. This is consistent with the previous findings measured with natural scenes or art works [
6,
7,
8,
9,
34]. Thus, even on scrambled symmetric images, observers still prefer the images with a spectrum slope familiar to that of natural scenes [
2,
3,
4]. The preference ratings for the asymmetric condition appeared flat. This may due to a compression of response dynamic range as discussed later in the paper.
The preference ratings increased with the number of symmetry axes, which Chen et al. [
19] also reported. This effect may be due to a reduction of complexity in a symmetric pattern as the number of symmetry axes increases. The argument is as follows: a symmetric pattern can be viewed as composed of parts that are either reflections or replications of each other. As the number of symmetry axes increases, the parts become smaller and thus contain fewer unique image elements. This reduction of the quantity of image elements allows an observer to infer the whole image from fewer samples. That is, a symmetric image with more symmetry axes is easier to process than the one with few axes. Indeed, detecting a symmetric pattern becomes easier [
35,
36] and faster [
37] for an observer as the number of symmetry axes increases. Our result is thus consistent with the fluent theory of aesthetic preference [
38], which states that an object would produce a hedonic response in an observer if the information it carries is easy for a human mind to process.
Because the relationship between preference and spectrum slope had an inverted U shape (
Figure 2), we therefore used a quadratic function to fit our data. The function has a basic form
p =
b × (
s −
a)
2 +
c, where
p is the preference rating,
s is the spectrum slope, and
b,
a, and
c are parameters that determine the shape, horizontal displacement, and vertical displacement of the function, respectively. The values of the parameters in the function are a function of the number of symmetry axes, and they can therefore help with assessing its effects. The parameter
c determines the function’s vertical displacement and thus represents an additive effect. Hence, on the one hand, if the effect of the number of symmetry axes is independent from that of spectrum slope, then we should expect that only parameter
c would change with the number of axes. On the other hand, if the two factors interact, then we should expect at least one of the parameters
a and
b to change with the number of symmetry axes because each could multiply
s in the function to produce a modulation effect.
Both parameters b and c were exponential functions of the number of symmetry axes, n, whereas the parameter a was independent from n. Optimizing the curve fitting, we found that fixing a at −1, while b = −1.56 × exp(−1/n) and c = 3.05 × exp(−1.56/n) + 1.97, provided an excellent fit to the data. The model accounted for 97.2% of the variance in the averaged data. The RMSE of the model, 0.15, is close to the mean standard error of the data (0.16).
The parameter
a = −1 indicates that the observers most preferred images with a spectrum slope of −1. This −1 slope is common among natural scenes [
2,
3,
4]. Hence, this may reflect the fact that human observers prefer stimuli whose image statistics resemble those of a typical natural scene [
2,
3,
4].
The parameter
b reflects the modulation magnitude of the quadratic function. Because
b = −1.56 × exp(−1/
n), this negative exponent function suggested a decelerating nature of the axis number effect (
Figure 4a). That is, the greatest change occurred when the number of axes
n was small and became asymptotic to −1.56 when
n was large. In addition, the value of
b was always negative. This gave us an inverted U-shaped relationship between preference and spectrum slope for all numbers of axes (
Figure 5). Another effect of
b was the speed of preference reduction as the spectrum slope deviated from −1. As shown in
Figure 5, the decrease in preference, say, from a spectrum slope of −1 to −2, was in a faster rate as the number of axes increased. Such a shape change of the preference function is shown as an interaction in the ANOVA above.
The parameter
c is the intercept of the quadratic function. Because
c is also a function of
n, it represents the symmetry axis effect by itself. The effect of
c is to shift the preference functions for different numbers of axes vertically by different magnitudes. Hence, the increment of parameter
c reflects the increment of peak rating as the number of axes increases. The parameter
c is a negative exponential function of the number of the symmetry axes (
Figure 4b). Thus, the speed of preference increase decelerates with the number of axes.
Visually, the preference rating for slope −0.5 was higher than that for slope −1.5 in all symmetric conditions. One may wonder whether this difference was significant and signaled the asymmetric preference rating as the spectrum slope moved away from −1. To test this, we fit our data to an alternative model, p = b × (s + 1)2 + d × s + c, in which d is a free parameter. The linear term d × s reflects the asymmetry effect on the inverted U-shaped function. Hence, if asymmetry indeed exists in the inverted U-shaped preference function, then one should expect the parameter d to be significantly large. However, the model-fitting results showed that the parameter d for each curve was between −0.079 and 0.052, quite close to zero. Including this linear term did not significantly improve the fitting results, F(2,19) = 0.51, p = 0.81. Thus, a linear term is not necessary to account for our result. Hence, the preference function for spectrum slope is symmetric.
To summarize, aesthetic preference is a quadratic function of amplitude spectrum slope, whose modulation depth (b) and intercept (c) are modulated by the number of symmetry axes. The quadratic part of the function can explain the inverted U-shaped relation between preference and spectrum slope. The increment of the intercept with the number of symmetry axes mainly contributes to the increment of preference with the number of symmetry axes. The modulation depth’s change with the number of symmetry axes, then, explains the interaction effect between spectrum slope and the number of symmetry axes on aesthetic preference.
Overall, the preference ratings notably peaked at spectrum slope −1 for all symmetry conditions. However, we did not find a slope effect in the asymmetric or scrambled image conditions. This seems inconsistent with the previously reported inverted U-shaped function between preference and spectrum slope [
2,
3,
4,
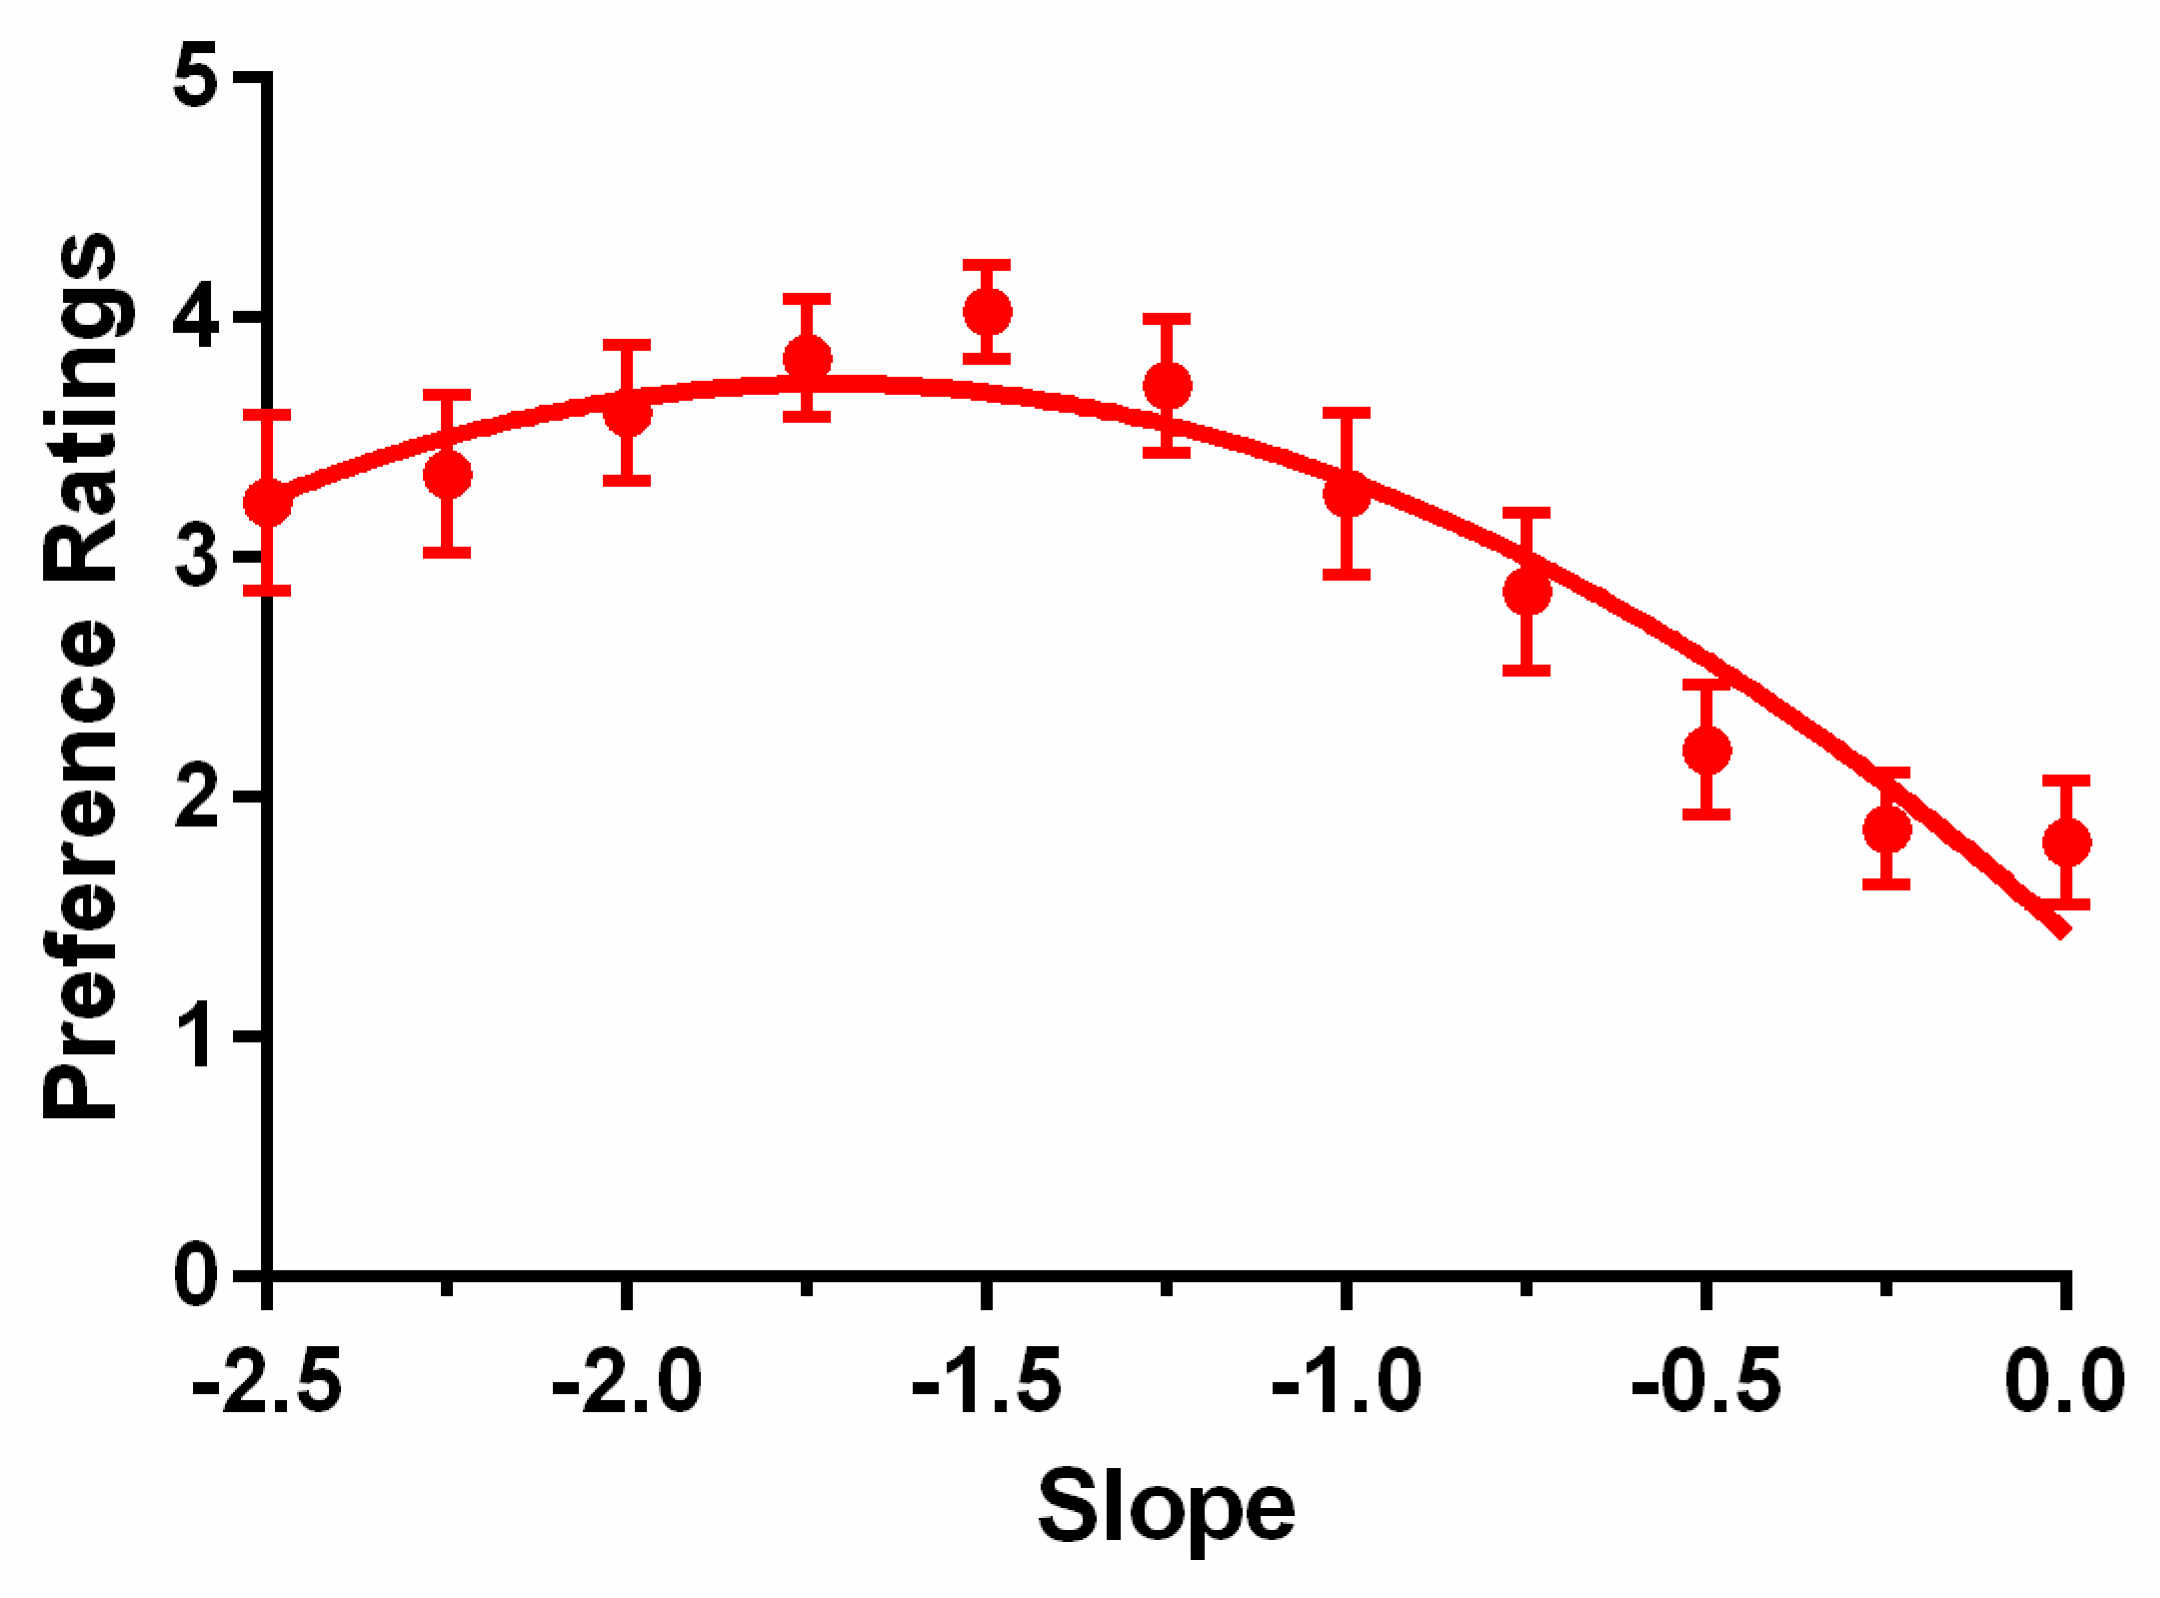
39]. The inconsistency may be due to the range of the images used in this and other studies. Because our stimuli contained both highly aesthetically appealing symmetric images and unappealing scrambled ones, the former could compress the preference ratings for the latter. To test this hypothesis, we repeated our experiment solely using asymmetric phase-scrambled images with amplitude spectrum slopes ranging from −2.5 to 0 by steps of 0.25. Similarly, the observers were instructed to use a 6-point Likert scale to indicate their aesthetic judgment of each image.
The preference ratings averaged across the 17 observers (aged 19 to 37 years) are shown in
Figure 6. The red symbols represent the data points, and the error bars show the standard errors. The smooth curve is the fit of a quadratic function. As
Figure 6 shows, the preference ratings became an inverted U-shaped function, as reported in previous results [
33,
39,
40]. Visually, the maximum preference rating is located at slope −1.5. This was higher than Juricevic et al.’s [
40] −1 peak result, but was consistent with the values Spehar and colleagues [
32,
33,
39] reported, which showed that the peak preference was at about −1.25 to −1.5 spectrum slope. A one-way repeated ANOVA, after Greenhouse–Geisser correction, showed that the spectrum slope had a significant effect on preference,
F(1.913, 30.614) = 7.71,
p = 0.002,
ηp2 = 0.325. The pairwise comparisons showed significant effects between all medium slope (−1.75 to −1.25) and shallower slope (−0.5 to 0; all
ps < 0.05) pairs, except for between −1.75 and −0.5 slopes. No other pairwise comparisons were significant. This result was fitted by the quadratic function
p =
b(
s −
a)
2 +
c, where
s is the spectrum slope,
p is the preference rating, and
a,
b, and
c are constants. We empirically found that the function
p = −0.78 (
s + 1.71)
2 + 3.73 can fit our data well. This showed that the relationship between preference ratings and the images with different spectrum slopes was an inverted U shape that peaked at about −1.7.
Thus, when only phase-scrambled images are in the stimulus set, preferences clearly follow an inverted U-shaped spectrum slope function. However, when the stimulus set contained both symmetric and asymmetric images, symmetry dominated the aesthetic preference ratings; as a result, the preference ratings for the asymmetric images were always at the lowest level, regardless of the spectrum slope. This implies previous research that only focused on the images’ amplitude domain and claimed the importance of amplitude spectrum on aesthetic preferences had overestimated the role of amplitude spectrum. The symmetric structure, which was coded as the cosine component of the phase spectrum in the Fourier domain, has an enormous influence on aesthetics, as compared to amplitude spectrum.
Although image properties related to symmetric structure and spectrum slope usually co-occur [
19,
28], our study showed that the two components of an image have individual effects on aesthetic preferences. Symmetry can even amplify the amplitude spectrum slope’s effects. Hence, the spectrum slope’s effects on aesthetic preference observed in the symmetric patterns are not completely due to the coincidence of spectrum slope changes as the number of symmetry axes increases, as Chen et al. [
19] claimed. The observed symmetry effect on aesthetics is not merely an artifact of the spectrum slope’s effect.
The visual cortex processes symmetry and spectrum slope differently. On the one hand, images with different spectrum slopes produce differential Blood oxygen-level dependent (BOLD) activations in the V1, V2, and V3 cortical areas [
41,
42] and different event-related potentials at around 100 ms [
43] or 170 ms and 250 ms [
44] after stimulus onset. On the other hand, symmetric patterns produce greater BOLD activation than asymmetric ones do in the lateral occipital (LO), V3A, V4d/v, and V7 but not in the early visual cortical areas such as the V1 and V2 areas [
45,
46,
47,
48,
49,
50]. The event-related potential waveform showed a sustained negativity starting around 300 ms after stimulus onset [
51]. Thus, different brain mechanisms clearly handle symmetry and spectrum slope. Our results showed a substantial interaction between the two factors, which may suggest either a downstream mechanism that takes inputs from both mechanisms and thus integrates these two pieces of information for making aesthetic judgments, or a profound link between these brain mechanisms.


