Abstract
We conducted a field test on Huitougou (HTG) Tunnel, which is a typical shallow-buried and unsymmetrically loaded tunnel. The on-site monitoring data indicated that the surrounding rock pressure and lining stress on both sides of the tunnel were indeed asymmetrical and that the pressure ratios (original unsymmetrical coefficient) of each corresponding monitoring point were different. According to the tunnel design principle, we proposed the unsymmetrical coefficient (UC) to characterize the asymmetrical degree of the tunnel, and verified and compared the UC of the field test and numerical simulation results. The effects of different factors on the UC such as the slope angle of the ground, the thickness of the overburden cover, the physical and mechanical properties of the surrounding rock, and the construction method were studied and analyzed. The research results reveal that the bias coefficient calculated by the numerical simulation was close to the monitoring results. The results of the factor analysis indicate that the slope angle, overburden thickness, and elastic modulus significantly affected the bias degree, while other factors had little effect. The concise and clear UC accurately described the unsymmetrical degree of any unsymmetrical-loaded tunnel and provided more accurate judgment regarding the safety of the tunnel design phase and construction phase.
1. Introduction
In recent years, the development of tunnel engineering in China has been improving, and it is inevitable that tunnel engineering will cause biased tunnels due to the contradiction between route selection and topographical conditions [1,2,3]. Shallow bias tunnels typically occur at the entrance and exit of the tunnel. The tunnel support structure is subjected to asymmetric surrounding rock pressure, which will lead to asymmetric deformation and can easily cause cracks and other hazards (i.e., landsides, collapse, instability of the initial liner, and cracked linings) [4,5]. These hazards occur not only due to improper operation during construction, but also because there is no accurate judgment of the bias degree during the tunnel design phase.
At present, the research on bias tunnels mainly focuses on four research methods: field monitoring, numerical simulation, model tests, and theoretical calculation. Many studies use a combination of two or more methods. In terms of field monitoring, Xia et al. [6] analyzed the deformation and stress properties of surrounding rocks and supporting system based on the field data. Xue et al. [7] found that the piles on both sides of the umbrella arch were subject to large bending moments and axial force through the monitoring data of the umbrella arch. Wang et al. [8] proposed that the deformation behavior of the surrounding rock mass was controlled by unsymmetrical loadings during the process of construction.
As for the theoretical analysis, Zhang et al. [9] calculated the stability coefficient and the supporting force of shallow bias tunnels based on the principle of virtual power from the viewpoint of energy. Yang et al. [10] investigated the load model of bilateral tunnels and calculated the stresses of three tunnels and analyzed the distribution characteristics of a single tunnel. According to the principle of virtual power, the upper bound solution for the surrounding rock pressure of a shallow unsymmetrical loading tunnel was derived and verified using an example [11]. Based on the nonlinear failure criterion and the upper bound theorem, Yang et al. [12] proposed a modified tangential technique method to derive the expression of supporting pressure acting on a shallow tunnel.
Xiao et al. [13] found that a pipe roof at the entrance could effectively reduce the stresses and asymmetric loading between the tunnel support elements and enhance the tunnel safety during construction. Guo et al. [14] found the thickness limits of large-span bias tunnels under different slopes based on different soil thickness research and three kinds of slope effects through the analysis of finite element numerical simulation results. Yang et al. [15] performed a numerical simulation of soft rock tunnel excavation in large sections and investigated the stress and displacement of surrounding rock and the plastic area distribution and size. Xiao et al. [16] found that the main reasons for cracking in the secondary lining were the increasing overburden depth and the stress concentration at the spring level as well as an increase in the horizontal deformation in the secondary lining.
However, there are certain problems in the research addressing the degree to which the tunnel bears pressure. Most previous studies took the ratio of the stress values at the same horizontal height on both sides of the tunnel to the unsymmetrical degree [17]. At the same time, this stress ratio only represents the asymmetry of the corresponding points of the tunnel but not the degree of bias of the whole tunnel.
In this paper, we relied on the typical shallow unsymmetrical-loaded tunnel section of Huitougou (HTG) Tunnel to monitor various stress values and to calculate the stress ratio of the corresponding monitoring points. We propose a new unsymmetrical coefficient (UC). We established a numerical calculation model to calculate the UC to compare and verify with the monitoring results. In addition, we investigated the influence of the terrain factors, surrounding rock quality, and lining factors on the UC.
2. Field Test
2.1. Engineering Background
This paper is based on the HTG Tunnel, which is a vital part of Hegang–Dalian Highway that is in the boundary between Tonghua City and Baishan City in the Jilin Province of China [18]. This tunnel involves building two separate tunnels [19]. The left tunnel is 720 m long (from LK315 + 655 to LK316 + 375), and the right tunnel is 660 m long (from RK315 + 680 to RK316 + 340). The topography of the tunnel exit is shown in Figure 1.
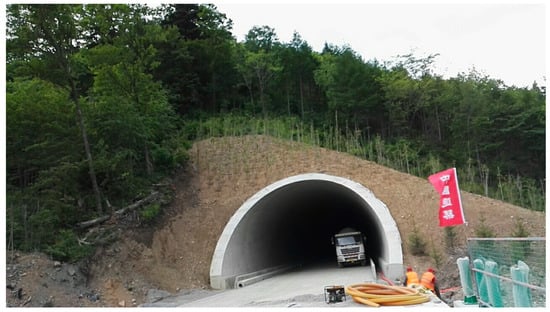
Figure 1.
Huitougou (HTG) Tunnel exit.
A shallow buried section (RK315 + 710) of the tunnel entrance was selected as the monitoring section, as shown in Figure 1. The reports of site investigation showed that the lithology of the surrounding rock along the tunnel section is primarily granitic gneiss. The granitic gneiss is fully and intensely weathered with very developed joint fissures and low strength. The evaluated classes of surrounding rock along the tunnel route was grade V, according to the Chinese Code for the Design of Road Tunnels [20].
The span and height of the excavation profile were 12.76 m and 10.26 m, respectively. It is a large cross-section highway tunnel. In the first monitoring tunnel section, the ring cut method was adopted. As shown in Figure 2, the ring cut method consists of eight steps.
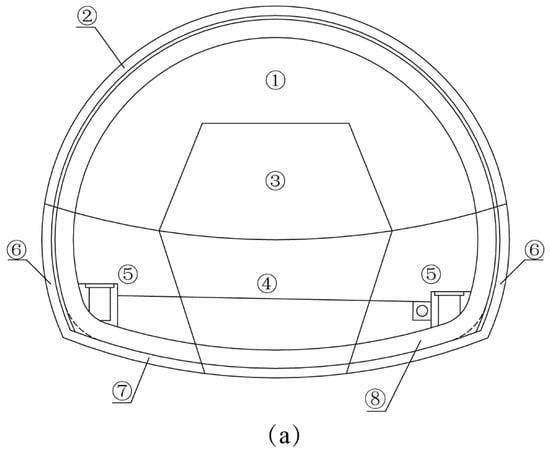
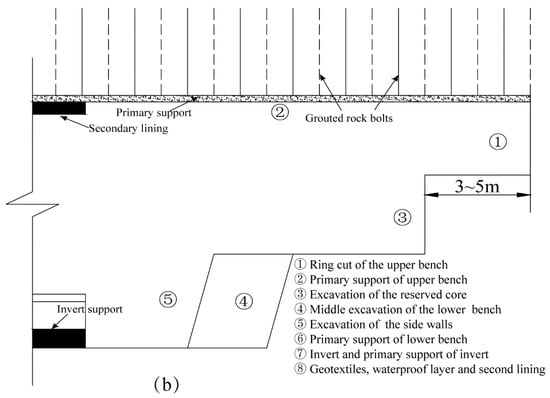
Figure 2.
Construction sequence diagram of the ring cut method. (a) Front view. (b) Side view.
The advance support adopted a small pipe roof with a diameter of 89 mm. The primary lining included shotcrete, an I-shape steel arch, mesh reinforcement, and grouted rock bolts. As shown in Figure 3, the shotcrete was 26 cm thick, and the grouted rock bolts were 3.5 m long. The second lining was 50-cm-thick grouted concrete.
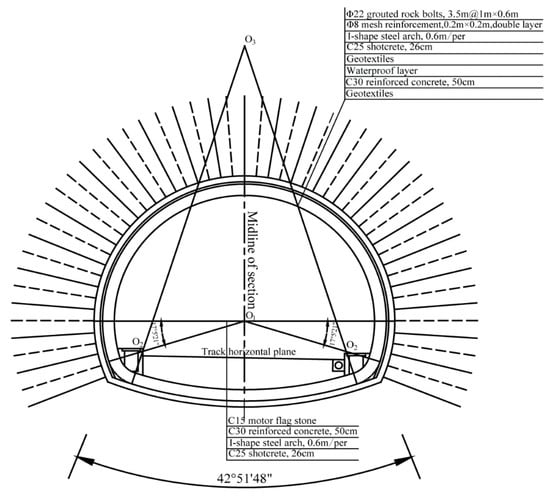
Figure 3.
Schematic diagram of tunnel support structure.
2.2. Monitoring Arrangement
We aimed to determine the distribution of pressure after the excavation of the tunnel. Experts typically use stress boxes and strain gauges to monitor the stress and strain of tunnels [21,22,23], as we did. The pressure between the surrounding rock and the primary support, the strain of the support steel arch, the pressure between the primary support and the secondary lining, and the strain of secondary lining were measured during the construction. The locations of the pressure cells and strain gauges are illustrated in Figure 4.
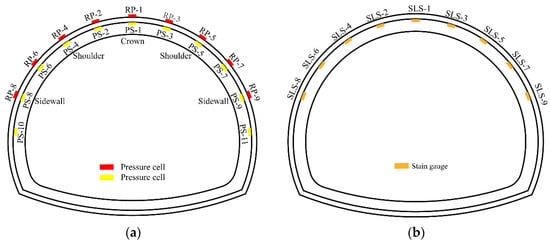
Figure 4.
Layout of monitoring points. (a) Pressure cells. (b) Strain gauges.
The monitoring machine was produced by the Changcha Yituo Sensing Technology Company. The pressure cell was a steel-string sensor with a measuring range of 300 kPa. The strain gauge was an embedded concrete strain gauge with a measuring range of 3000 με. The pressure cells were installed between the surrounding rock and steel arch. The strain gauges were tied to the steel bars inside the second lining to measure the tangential strain of the second lining. All the data were read by the manual reader.
The monitoring points were arranged on the upper step, as shown in Figure 4. On the one hand, the lining of the upper step directly withstood most of the surrounding rock pressure, after the upper step was excavated and the cross section was not closed. On the other hand, due to the shallow burial of the tunnel, the force and related displacement of the upper step lining would directly affect the safety of the tunnel. Therefore, we mainly arranged monitoring points on the upper step of the tunnel.
The pressure between the surrounding ground and the primary lining was obtained by the double capsule pressure cells that were fixed on the steel beam. The pressure cells between the primary and secondary linings were nailed on the primary lining intrados surface. The monitoring data were collected by manual readings, which was found to be the most reliable method.
2.3. Monitoring Results
2.3.1. Pressure between the Surrounding Rock and Primary Support
As shown in Figure 5, the stress was positive in the entire section, revealing that the primary support of the upper bench section was under compressed. The maximum stress between the primary lining and the surrounding rock at the crown was 47.6 kPa. The minimum stress was 9 kPa at the shallow buried side of the shoulder.
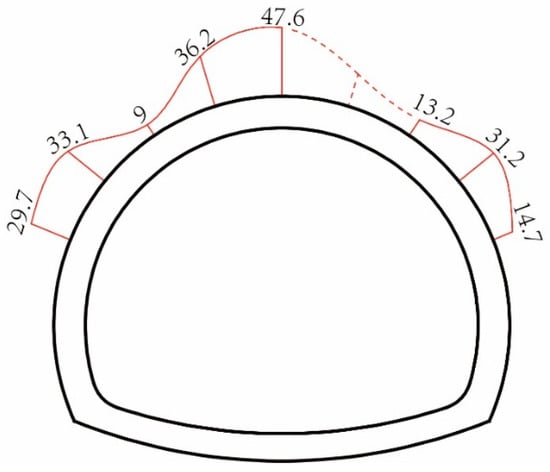
Figure 5.
Distribution of the pressure between the surrounding rock and primary support.
The distribution of the surrounding rock pressure tunnel on the shotcrete was not greatly different. The maximum surrounding rock pressure of the deep-buried side was 36.2 kPa while that of the shallow-buried side was 31.2 kPa. The stress ratios of the corresponding points on both sides of the tunnel are listed in Table 1.

Table 1.
Stress ratios of the pressure between the surrounding rock and primary support.
2.3.2. Pressure between the Primary Support and Second Lining
Figure 6 depicts the historical curve of the stress between the primary support and second lining. We can see that the pressure changes over time consisted of two stages roughly. Once the second lining was grouted, the contact pressure increased rapidly and tended to be gentle 10 days later.
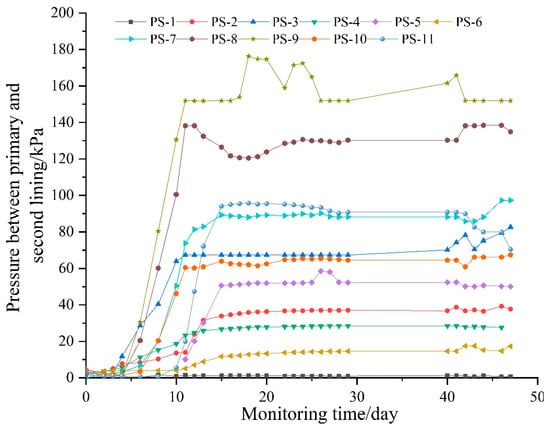
Figure 6.
Development of the contact pressure between the primary support and second lining.
The distribution of the stress on the second lining is shown in Figure 7. The maximum contact pressure was 151.9 kPa, which was located at the haunch of the deep-buried side, and the minimum pressure was 1.1 kPa, which was located on the crown. The above distribution characteristic is very distinct from the surrounding rock pressure on the primary lining.
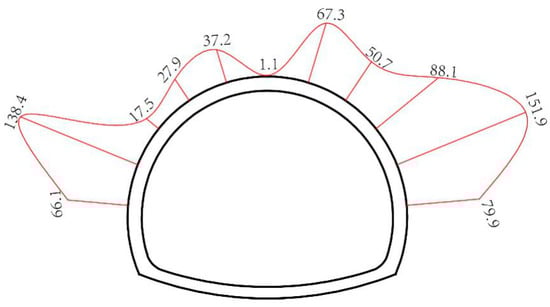
Figure 7.
Distribution of the pressure on the second lining.
Table 2 lists the stress ratios of the pressure on the secondary lining. The maximum of 5.03 was situated in the shoulder. The minimum of 1.1 was located in the haunch.
Table 2.
Stress ratios of the pressure on the secondary lining.
2.3.3. Strain of the Second Lining
Figure 8 illustrates the time–history curve of the strain of the second lining. After the completion of the second lining, the strain gradually increased and began to stabilize after 10 days. This is the same trend as the pressure change between the primary support and second lining, indicating that the strain of the secondary lining stabilized as the pressure on the secondary lining stabilized.
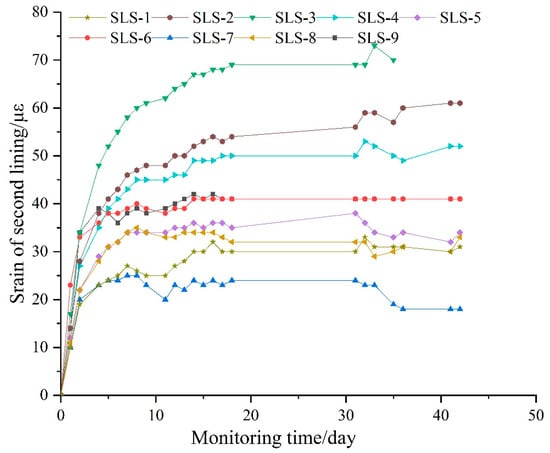
Figure 8.
Time–history curve of the strain of the second lining.
Figure 9 shows the distribution of the strain of the secondary lining. Among the monitoring points, the strain of the left shoulder at the shallow-buried side (SLS-3) was the largest, with the value of 69 με, and the minimum was at SLS-6, with a value of 8 με. The strain of the shallow side was generally larger than the deep-buried side, which indicates that the axis stress for the shallow side was larger than the deep-buried side. According to the linear relationship between strain and stress, the strain ratio is equal to the stress ratio. The stress of the second lining force is shown in Table 3.
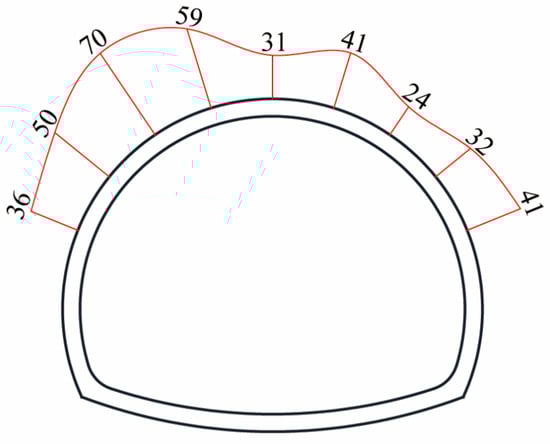
Figure 9.
Distribution of the strain of the second lining (με).
Table 3.
Strain ratios of the second lining.
3. Unsymmetrical Coefficient and Application
3.1. Unsymmetrical Coefficient
As shown in Table 1, Table 2 and Table 3, through the analysis of the monitoring data in this article, we determined that the traditional bias coefficient (stress ratio) only represents the asymmetry of the pressure or stress distribution on the same horizontal position of the tunnel. The same tunnel will have different unsymmetrical coefficients at different heights, and these stress ratios have a large variation range, which cannot accurately represent the overall degree of bias of the tunnel.
The UC proposed in this paper is based on the design principle. Since the most unfavorable load combination is considered in the design process, the designed lining parameters must meet the structural safety under the most unfavorable load combination. According to the tunnel’s central axis and topography, the tunnel is divided into deep and shallow sides. Considering the difference in the surrounding rock pressure on the lining of the deep and shallow sides, the UC is defined as the maximum pressure on the lining of the deep side of the tunnel. The ratio of the maximum and minimum of the maximum pressure on the shallow buried side is calculated as follows.
In the formula, UC is the unsymmetrical coefficient, is the maximum stress (internal force) of the deep-buried side of the tunnel, and is the maximum stress (internal force) of the shallow-buried side of the tunnel.
The new biased pressure coefficient is a dimensionless value of ≥1. If the ground is flat, the UC equals 1 when the usual method is adopted.
3.2. Application in HTG Tunnel
3.2.1. Numerical Model
Based on the section of RK315 + 710 of the HTG Tunnel described above, the original terrain line is simplified. As shown in Figure 10, the slope angle α was 21°, and the thickness t of the cover layer t was 11.6 m.
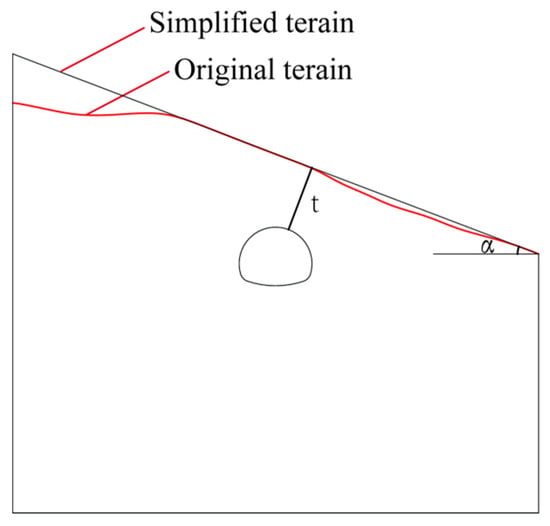
Figure 10.
Initial model.
To reduce the influence of boundary effects on the accuracy of the numerical results, the distance between the bottom of the numerical model and the tunnel was set to approximately three times the height of the tunnel. The distances between the boundary of the numerical model and the tunnel center was set to approximately three times the width of the tunnel. Then, the total width of the model was 93 m.
The built-in plane strain unit was used to simulate the surrounding rocks, primary support, and second lining. The interface element was adopted to simulate the pressure between the surrounding rock and primary support and the pressure between the initial lining and second lining. For the boundary conditions, the side boundary was fixed by roller, the bottom boundary was fixed by hinges, and the top surface was free.
The surrounding rock was assumed to obey the Mohr–Coulomb failure criterion. Since the tunnel running through and above are highly weathered granite gneiss, we assumed that the surrounding rocks in the study are homogeneous and isotropic materials. An elastic model was adopted for the initial lining and second lining.
We adopted an elastic model for the primary support and secondary lining, and the Mohr–Coulomb model for the surrounding rock in the numerical simulation. The boundaries between the different materials in the calculation were continuous boundary. We converted the elastic modulus of steel arch to jet concrete in the primary lining concrete [16] based on the following equation:
where E is the elastic modulus of primary lining concrete, in MPa; E0 is the elastic modulus of jet concrete, in MPa; Eg is the elastic modulus of the steel arch, in MPa; Sg is the cross-sectional area of the steel arch, in m2; and Sc is the cross-sectional area of jet concrete in m2.
The calculation parameters of the tunnel surrounding rock and the supporting material are shown in Table 4 according to the geotechnical investigation report. The parameters of the interfaces are shown in Table 5 according to the empirical value.
Table 4.
Parameters of the materials.
Table 5.
Parameters of the interfaces.
3.2.2. Simulation Results
- (1)
- Distribution of the Stress and Strain
The interface axis stress between the surrounding rock and primary support is shown in Figure 11a. The positive value meant that the positive value indicated that the stress direction was inward. Except for the invert, the pressure on the upper arch was mainly concentrated on the vault. The calculated stress value was greater than the monitored value. It was because the actual construction usually waited for the surrounding rock to release some pressure before performing the initial support construction, which was the characteristic of the New Austrian Method.
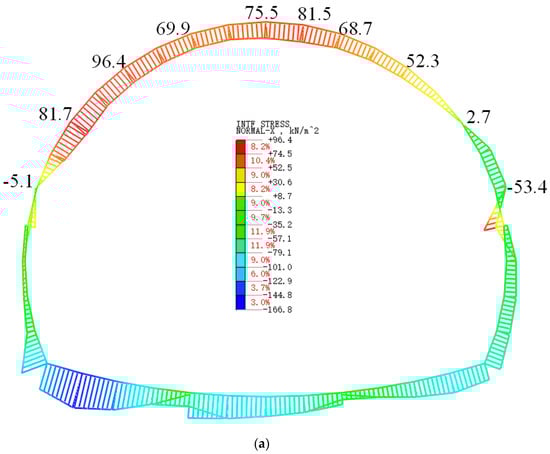
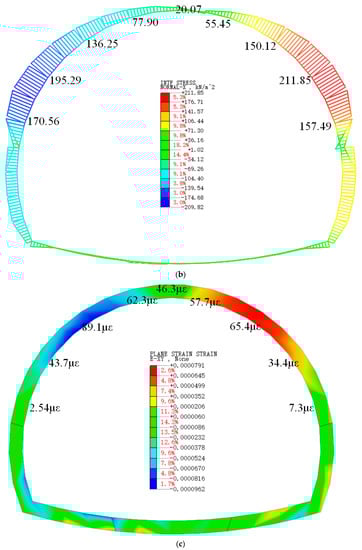
Figure 11.
Stress and strain distributing graph. (a) Stress between the surrounding rock and primary support. (b) Stress between the primary support and second lining. (c) Strain of the second lining.
As shown in Figure 11b, the axis stresses between the primary support and second lining distributed agree with the monitoring results. At the same time, the numerical simulation results were bigger than the monitoring values, which was because of the delay between the construction of primary support and second lining.
The tangential strain of the second lining is illustrated in Figure 11c. The difference between the distribution of numerical results and monitoring consequences was little in the upper step, and the numerical values of stains were close to the monitoring results.
- (2)
- Comparation of Unsymmetrical Coefficient
According to the monitoring results of the selected tunnel section and the calculation formula of the above UC, the calculation results of the different monitored stresses of this section are shown in Table 6. The UC calculated by the numerical simulation is shown in Table 7.
Table 6.
Unsymmetrical coefficient (UC) of the monitoring result.
Table 7.
UC of the numerical results.
As shown in Table 6, the type of monitored stress or strain was different, and the calculated UC was also different. The UC of the axial strain of the second liner was much larger than the other two. The UC of the pressure between the primary lining and the surrounding rock was close to the UC of the pressure between the primary lining and the second lining.
As reveled in Table 7, The UC of the pressure between the primary lining and the surrounding rock was close to the UC of the pressure between the primary lining and the second lining, which was close to the results of monitoring data. There was some gap between the calculated strain of the second lining and the monitoring data, which leads to the certain disparity in UC.
Overall, the numerical calculation results were very close to the monitoring data in terms of stress values, stress distribution characteristics, and calculated UC. This showed that we could carry out further research based on the feasible numerical simulation.
4. Single Factor Analysis
In this paper, it was necessary to study the variation law of the improved UC when the influencing factors changed, because the UC was exceedingly different from previous instances. In previous studies [24,25], many scholars explored the influence of various factors on biased tunnels. This paper summarizes these factors into three main categories, including topographic factors, surrounding rock properties, and construction. The topographic factors were the slope angle of the ground and the thickness of the cover layer. The surrounding rock properties mainly included the bulk density, elastic modulus, Poisson′s ratio, cohesion, and internal friction angle. The construction factors were mainly divided into two categories. One category is the design factors, such as the size and location of the tunnel, the choice of construction methods and steps, and the choice of design parameters of support measures. The other is technical problems that may arise during construction.
4.1. Influence of Topographic Factors
We examined the variation law of the tunnel UC when the slope angle range was 5–45°, and the thickness of the cover layer varied between 5 and 25 m.
4.1.1. Impact of Slope Angle
The curve shape of the UC as a function of the slope angle is parabolic, which is plotted in Figure 12. When the thickness of the overburden layer remains unchanged with the increase in the slope angle of the terrain, the tunnel UC first increases rapidly and then slowly increases. This is not an imagined linear change but a parabolic change. This shows that the existence of tunnel lining can limit the growth of the tunnel UC.
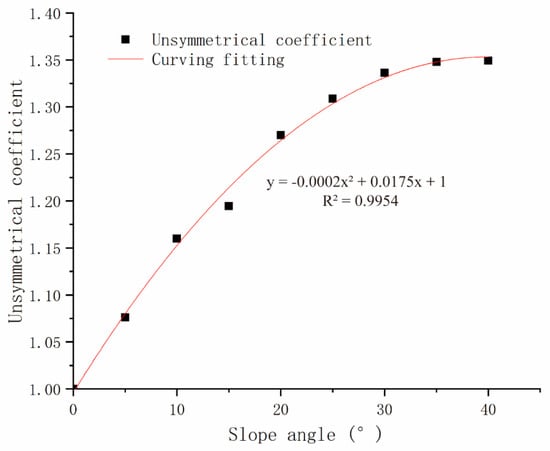
Figure 12.
Curve of UC with the slope angle.
4.1.2. Influence of the Cover Thickness
As shown in Figure 13, the curve of the UC with the thickness of the cover layer changes approximately linearly. The UC decreases as the thickness of the cover layer increases. The curve in the figure is linearly fitted to obtain the relationship between the UC and the thickness of the cover layer. According to this relationship, under the initial slope angle, when the cover layer reaches 73 m, the UC is 1.
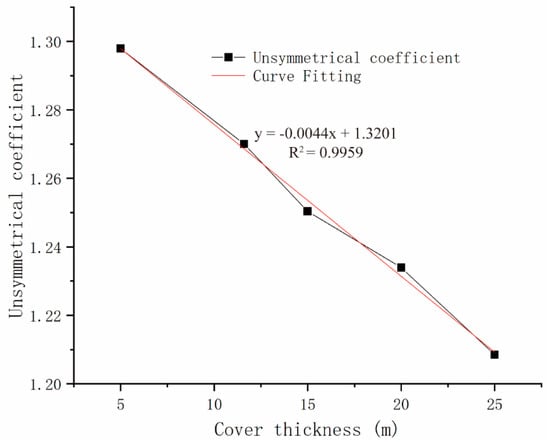
Figure 13.
Curve of UC with the thickness of the cover layer.
4.2. Effects of the Surrounding Rock Properties
4.2.1. Single Property of the Surrounding Rock
The physical and mechanical properties of the surrounding rocks directly affect the stability after tunnel excavation. Therefore, it is indispensable to examine the influence of the surrounding rock properties on the tunnel displacement coefficient. Generally, the tunnel bias section only occurs at the entrance of the tunnel, and the surrounding rock level at the entrance is mostly V or even VI. The range of the physical and mechanical properties of Class V surrounding rocks is shown in Table 8 according to the Specifications for the Design of Highway Tunnels. The change law of the tunnel UC was tested when the five important physical and mechanical properties (the elastic modulus E, Poisson′s ratio μ, bulk density γ, cohesion c, and internal friction angle φ) changed.
Table 8.
Range of surrounding rock parameters.
The changes of the tunnel UC when the physical and mechanical parameters of the surrounding rock of the tunnel are changed individually are plotted in Figure 14. As shown in Figure 14a, the tunnel UC and the deformation modulus are roughly negatively linearly related. When the deformation modulus increases, the tunnel UC becomes smaller.
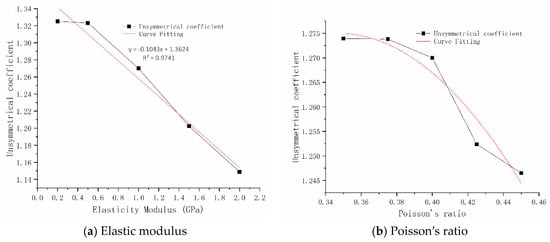
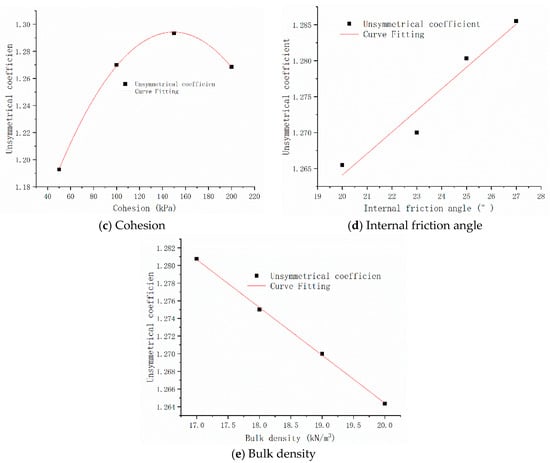
Figure 14.
Variation curve of the UC when the physical and mechanical parameters change under the condition of V-level surrounding rock. (a) Modulus of elasticity. (b) Poisson′s ratio. (c) Cohesion. (d) Internal friction angle. (e) Bulk density.
As shown in Figure 14b, the relationship curve between Poisson’s ratio and the tunnel UC is roughly parabolic, and as the Poisson’s ratio increases, the UC decreases. When the parameter selection range changes, the UC changes very little.
As shown in Figure 14c, the relationship between the cohesion and tunnel UC is roughly parabolic. As the cohesion increases, the UC first increases and then decreases.
As shown in Figure 14d, the relationship between the internal friction angle and the UC is positively linear, and the UC increases with the increase in the internal friction angle. This may be due to the limitation of the value interval, as the tunnel UC changes little.
As shown in Figure 14e, the relationship between the bulk density and UC is negatively linear. As the bulk density increases, the UC decreases. The reduction is very small, which is related to the range of the bulk density.
4.2.2. Effect of Rock Quality
The study in the previous section only analyzed the changes in the tunnel UC when the individual physical and mechanical indicators of the rock mass changed. The most important aspect in this engineering is the change of rock mass, and the change of rock mass is typically not the change of a factor. When the quality of the rock mass is higher, this typically indicates a larger deformation modulus, larger bulk density, larger cohesion, and internal friction angle, as well as a smaller Poisson′s ratio. The opposite is true when the rock mass is low in quality.
According to the range of physical and mechanical properties of the Grade V surrounding rock in Table 7, the quality of Grade V surrounding rock is divided into three grades: high quality, medium quality, and low quality. High quality takes the optimal value of the value range, low quality takes the opposite, and medium quality takes the average of the best value and the worst value. The specific values are listed in Table 9.
Table 9.
The physical and mechanical parameters of different surrounding rock qualities.
The tunnel UC under three different surrounding rock quality conditions is shown in Figure 15. As the tunnel surrounding rock quality changes from low to high, the tunnel UC first increases and then decreases significantly, which is not the negative linear relationship that we originally expected. The main reason is that the deformation modulus and cohesive force in the physical and mechanical parameters of the rock mass mechanics have a greater influence on the UC. Going from low to high rock mass, the modulus of deformation and cohesion also increase, but the influence on the UC is different. The superimposition of the two effects shows the relationship curve in Figure 15.
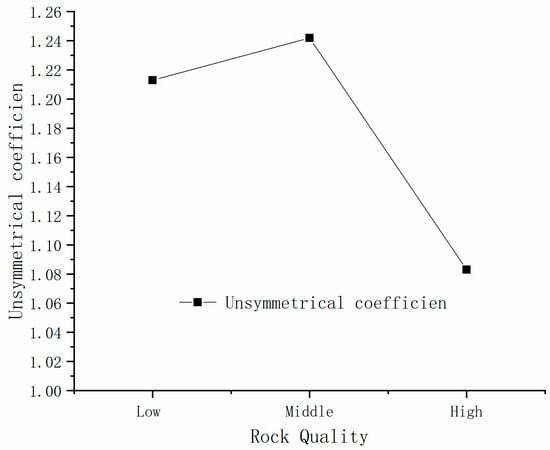
Figure 15.
Relationship between the rock quality and UC.
5. Conclusions
In this paper, a field test was conducted in the HTG Tunnel, which was shallow-buried and influenced by the slant terrain. The pressure between the surrounding rock and the primary lining, the pressure between the primary lining and the secondary lining, and the strain of the secondary lining were measured to study the UC of the tunnel.
- (1)
- Through the analysis of the stress and strain monitoring results of the YK315 + 710 section of the HTG tunnel, the stress values of certain monitoring points were small, while the strain ratio was large, according to the calculation method of the original UC. The calculated bias factor is meaningless.
- (2)
- After analyzing the root cause of the bias tunnel hazard, we proposed a new practical bias factor. This bias factor clearly indicates the degree of asymmetry of the maximum pressure on both sides of the tunnel design.
- (3)
- Numerical simulation calculations were performed on the target section, and the numerical simulation results and the variable coefficients calculated from the field monitoring data were compared and verified. We found that the variable coefficients were very close.
- (4)
- The influences of the terrain factors (slope angle and cover thickness) and rock properties (single rock property and rock quality) on the UC were studied using numerical simulations. The results indicate that the slope angle, overburden thickness, and elastic modulus significantly affected the bias degree, while other factors had little effect.
Author Contributions
Investigation, T.Z., S.D. and C.D.; Software, T.Z. and Y.H.; Data Curation, M.Z. and X.R.; Writing—Original Draft Preparation, T.Z.; Writing—Review and Editing, T.Z.; Supervision, L.N., M.Z. and Y.X.; Project Administration, L.N.; Funding Acquisition, L.N., Y.X. and M.Z. All authors have read and agreed to the published version of the manuscript.
Funding
This research was funded by the National Natural Science Foundation (Grant No. 41702300, 41502272 and 41502322) and Science and technology development project of Jilin Province, China (Grant No. 20180520073JH).
Conflicts of Interest
The authors declare no conflict of interest.
References
- Wang, J.X.; Li, K.; Guo, H.Y.; Cui, X.Y. Study on the Outburst Scheme of a Shallow Buried Bias Tunnel in Yunnan. IOP Conf. Ser. Mater. Sci. Eng. 2020, 711, 12073. [Google Scholar] [CrossRef]
- Liu, Y.Y.; Lai, H.P. Experimental Study on Lining Cracking of Shallow Buried Loess Tunnel under the Simulation of Effect of Slide Surface Immersion. Appl. Sci. 2020, 10, 6080. [Google Scholar] [CrossRef]
- Qiao, S.F.; Cai, Z.Y.; Tan, J.K.; Xu, P.; Zhang, Y.G. Analysis of Collapse Mechanism and Treatment Evaluation of a Deeply Buried Hard Rock Tunnel. Appl. Sci. 2020, 10, 4294. [Google Scholar] [CrossRef]
- Wang, H.; Jiang, C. Numerical analysis of a collapsed portal for shallow tunnel under asymmetrical pressure and its treatment. Rock Soil Mech. 2009, 30, 3481–3485. (In Chinese) [Google Scholar]
- Liu, X.J.; Zhang, Y.X. Analysis of reasonable excavation sequence and stress characteristics of portals section of shallow tunnel with unsymmetrical loadings. Chin. J. Rock Mech. Eng. 2011, 30, 3066–3073. (In Chinese) [Google Scholar]
- Xia, C.C.; Gong, J.W.; Tang, Y.; Zhu, H.H. Study on site monitoring of large-section highway tunnels with small clear spacing. Chin. J. Rock Mech. Eng. 2007, 26, 44–50. (In Chinese) [Google Scholar] [CrossRef]
- Xue, X.H.; Sun, Z.J.; Su, Z.M.; Song, F. Study on Mechanical Properties of Compound-Umbrella Arch in Bias Tunnel Entrance. Appl. Mech. Mater. 2013, 438–439, 987–990. [Google Scholar] [CrossRef]
- Wang, X.Q.; Yang, L.D.; Gao, W.H. Dyanamic monitoring and FEM simulation analysis of an expressway tunnel with unsymmetrical loadings. Chin. J. Rock Mech. Eng. 2005, 24, 284–289. (In Chinese) [Google Scholar]
- Zhang, J.H.; Li, Y.X.; Zhang, B.; Xu, J.S.; Yang, Z.H. Stability analysis of shallow bias tunnels based on nonlinear failure criterion. J. South China Univ. Technol. (Nat. Sci. Ed.) 2014, 8, 97–103, 121. [Google Scholar]
- Yang, X.L.; Zhang, J.H.; Jin, Q.Y.; Ma, J.Q. Analytical solution to rock pressure acting on three shallow tunnels subjected to unsymmetrical loads. J. Cent. South Univ. 2013, 20, 528–535. [Google Scholar] [CrossRef]
- Lei, M.F.; Peng, L.M.; Shi, C.H.; Xie, Y.J.; Tan, L.X. Upper bound analytical solution for surrounding rock pressure of shallow unsymmetrical loading tunnels. J. Cent. South Univ. 2015, 22, 2339–2347. [Google Scholar] [CrossRef]
- Yang, X.L.; Yang, Z.H.; Li, Y.X.; Li, S.C. Upper bound solution for supporting pressure acting on shallow tunnel based on modified tangential technique. J. Cent. South Univ. 2013, 20, 3676–3682. [Google Scholar] [CrossRef]
- Xiao, J.Z.; Dai, F.C.; Wei, Y.Q.; Xing, Y.C.; Cai, H.; Xu, C. Analysis of mechanical behavior in a pipe roof during excavation of a shallow bias tunnel in loose deposits. Environ. Earth Sci. 2016, 75, 1–18. [Google Scholar] [CrossRef]
- Guo, H.Y.; Liu, X.R.; Like; Cui, X.Y. Study on the Limit Value of Safety Overburden Layer Thickness of Large-Span Bias Tunnel. IOP Conf. Ser. Mater. Sci. Eng. 2020, 741, 12062. [Google Scholar] [CrossRef]
- Yang, C.; Hu, Z.X.; Huang, D.; Guo, F. Failure Mechanism of Primary Support for a Shallow and Asymmetrically Loaded Tunnel Portal and Treatment Measures. J. Perform. Construct. Facil. 2020, 34, 04019105. [Google Scholar] [CrossRef]
- Xiao, J.Z.; Dai, F.C.; Wei, Y.Q.; Min, H.; Xu, C.; Tu, X.B.; Wang, M.L. Cracking mechanism of secondary lining for a shallow and asymmetrically-loaded tunnel in loose deposits. Tunn. Undergr. Space Technol. 2014, 43, 232–240. [Google Scholar] [CrossRef]
- Wang, L.C. Limit Analysis Method of Surrounding Rock Pressure and Excavation Progress Optimiztation of Unsymmetrical Pressure and Shallow Tunnel. Ph.D. Thesis, Central South University, Changsha, China, 2011. [Google Scholar]
- Dai, S.L.; Hou, J.S.; Li, Y.M.; Guo, Y.C.; Guo, H.Y. Study on Excavation Method of Shallow Buried Bias Section in Huitougou Tunnel Portal. Subgrade Eng. 2018, 5, 171–174. (In Chinese) [Google Scholar]
- Dai, S.L.; Xin, Y.L.; Gao, J. Study on pressure monitoring in unsymmetrical loading section of huitougou tunnel and the construction scheme. Subgrade Eng. 2018, 6, 177–181. (In Chinese) [Google Scholar]
- Chongqing Transportation Research and Design Institute. Code for Design of Road Tunnel; JTG D70-2004; Chin Comm Press: Beijing, China, 2010. [Google Scholar]
- Du, M.Q.; Wang, X.C.; Zhang, Y.J.; Li, L.; Zhang, P. In-situ monitoring and analysis of tunnel floor heave process. Eng. Fail. Anal. 2020, 109, 10423. [Google Scholar] [CrossRef]
- Li, Y.; Wang, H.P.; Cai, W.B.; Li, S.C.; Zhang, Q.Y. Stability monitoring of surrounding rock mass on a forked tunnel using both strain gauges and FBG sensors. Measurement 2020, 153, 107449. [Google Scholar] [CrossRef]
- Qiu, J.L.; Lu, Y.Q.; Lai, J.X.; Guo, C.X.; Wang, K. Failure behavior investigation of loess metro tunnel under local-high-pressure water environment. Eng. Fail. Anal. 2020, 115, 104631. [Google Scholar] [CrossRef]
- Luo, W. Staility Analysis and Reliability Research on the Shallow Tunnel under Unsymmetrical Pressure; Central South University: Changsha, China, 2014. (In Chinese) [Google Scholar]
- Zhong, X.Q. An analysis of model tests on earth tunnel under unsymmetrical loading. J. Southwest Jiaotong Univ. 1996, 31, 602–606. (In Chinese) [Google Scholar]
Publisher’s Note: MDPI stays neutral with regard to jurisdictional claims in published maps and institutional affiliations. |
© 2020 by the authors. Licensee MDPI, Basel, Switzerland. This article is an open access article distributed under the terms and conditions of the Creative Commons Attribution (CC BY) license (http://creativecommons.org/licenses/by/4.0/).