Abstract
The vibrating flip-flow screen (VFFS) is a high-efficiency device currently used for deep screening of moist fine-grained materials. During VFFS operation, the normal operation of the screen is affected by fatigue damage to the shear springs arranged symmetrically on both sides of the screen, leading to equipment failures and disruption production. In this paper, the shear spring’s static and dynamic characteristics in different operation conditions were studied using the INSTRON 8801 fatigue test system and Dynacell dynamic sensors. Using an experimental test of shear spring stiffness and damping coefficients, the effects of some factors, i.e., temperature, hardness, amplitude and frequency, were studied. The results show that the temperature of the shear spring on the left side of the flip-flow screen was higher than that of the right side (driving side). With an increase in temperature, the stiffness of the shear spring decreased. With the increase in amplitude, the dynamic stiffness decreased and the damping coefficients did not change; with the increase in frequency, the dynamic stiffness increased and the damping coefficient decreased. At the same amplitude, with the increase in hardness of the shear spring, the dynamic stiffness increased. Finally, the stiffness and damping coefficients of the shear spring before and after tearing were obviously reduced. These research results reveal the relationship of the characteristics of a shear spring with operational conditions, and could provide a theoretical reference for the design of the VFFS and the selection of the shear spring.
1. Introduction
Vibrating screens have been widely applied in materials preparation for activities such as classification and dewatering [1]. The vibrating flip-flow screen (VFFS) is an efficient device for screening moist and fine materials because it has characteristics of high acceleration of screen mesh and no blinding apertures [2,3,4,5,6]. In particular, the application of the VFFS in the coal industry improves screening efficiency, enhances the productivity of the slack coal separation system, and decreases slime content in the lump coal system by 70%, thus increasing the economic benefits [7]. The application of the VFFS in the building of solid waste resources overcomes the problem of damp construction waste blocking, thereby improving the cleanness of soil under the screen.
The VFFS consists of two screen frames, a main screen frame and a floating screen frame. The floating screen frame is connected to the main screen frame through shear springs, using their resonance, and the two vibrating frames move relative to each other. Therefore, the elastic screen mesh mounted on the main and floating screen frames is tensioned and released periodically to achieve high acceleration values (30~50 g). Because of this advantage, plugging particles can easily pass through the screen, and thus increase screening capability and efficiency [8,9,10]. In a previous study, the motion of the screen mesh of a flip-flow screen was investigated by considering the screen mesh as a simply supported beam [11]. The simple construction of the driving mechanism of the centralized-driving flip-flow screen (CFS) reduces mounting deviation and improves operation stability [12]. Xiong analyzed the rotation speed of exciters, and the inclination angle, the slack length, and the characteristics of the screen, which have significant effects on the vibrations of an inclined flip-flow screen mesh, and optimized these parameters [13]. Hamid optimized the Liwell flip-flow screen for fine particle dry separation, which can effectively be used to screen the SIU (Southern Illinois University) air table feed or products at 1 mm or 2 mm sizes to produce a dry clean coal product [14]. The Kolmogorov–Smirnov test was used to analyze the material mass statistical distribution characteristics during the screening process, and can well reflect the working state of the flip-flow screen [15]. The classification effect of the 3 mm flip-flow screen was affected by the working frequency and tension; adjusting the working frequency and tension can significantly improve the 3 mm flip-flow screening effect [16]. Yu found that when the mass of materials, relative amplitude, and operating frequency have values of 107 kg, about 6 mm, and 80.79 rad/s, respectively, the VFFS had good screening performance in screening 3mm iron ore, with a screening efficiency of up to 89.06% [17]. Gong used the method of the global sensitivity to analyze the newly VFFS dynamic model to calculate the sensitivities of model outputs caused by the input parameters [18]. Jiang studied the accelerations of the measuring points that increased with increasing total excitation force and frequency, and the mathematical relationships between the acceleration and these two variables were found to be linear and quadratic for the total excitation force and frequency, respectively [19].
Shear springs, one of the core components of the VFFS, are symmetrically arranged on the side plate of the screen, and affect the screen’s performance parameters. However, research on the shear spring of the VFFS has mainly focused on static analysis. Cveticanin analyzed the dynamic response of the system when the spring connecting the two masses was strongly nonlinear and weakly damped [20]. Wang obtained the stress–strain curve and stress nephogram of the shear spring under the condition of shear and compression by numerical simulation, and analysis of the change in compression stiffness and shear stiffness of the shear spring was conducted using an experimental test, which provided the theoretical basis for the design and selection of the spring [21]. Gong analyzed the relationship between nonlinear springs and suitable system parameters; the results were beneficial for the performance of the vibrating flip-flow screens [22]. Hong used ANSYS software to analyze the mode of the shear spring and obtained the spring’s first-order natural frequency in the shear direction. The reliability of data was verified by experiments, which provided a new method for researching the dynamic characteristics of the shear spring [23]. T. Rey found that the stabilized behaviors of silicone rubber depended quasi-linearly on temperature [24]. Tang used the viscoelasticity of rubber spring to adjust the flip-flow screen vibration intensity, which was a valid solution to the contradiction between vibration strength and structural reliability [25].
Numerous previous studies have been conducted on the screen structure and dynamics of the vibrating flip-flow screen, the dynamics of the elastic screen mesh, and the particle movements on the mesh surface. Based on the background outlined above and previous research, the focus of this work is to analyze the static and dynamic characteristics of the shear spring of the vibrating flip-flow screen. The results of the experiments showed that the main factors influencing the stiffness and damping coefficients of the shear spring were amplitude, frequency, temperature, and hardness. As these factors changed, the stiffness and damping coefficients varied. The motivation for this work arose from there being few studies on the influence of static and dynamic characteristics of the shear spring related to the VFFS operation on an experimental basis; this work will be helpful to the optimization of parameters in the design of the VFFS.
2. Materials and Methods
2.1. Experimental Apparatus
This study was based on the VFFS1848, which are widely used in the classification of moist fine-grained materials in coal, non-metallic mines, construction waste recycling treatment, metal mines and other industries, and which can effectively prevent moist materials from blocking the screen holes and reducing screening efficiency. As shown in Figure 1, shear springs of the VFFS1848 contained a total of 44 pieces, and were symmetrically located between the main screen frame and the floating screen frame. The shear springs were connected to the main screen frame by bolts on one side and the floating screen frame on the other side, and the parameters of the prototype are shown in Table 1; a flowchart for describing the whole of the research work is provided in Figure 2.
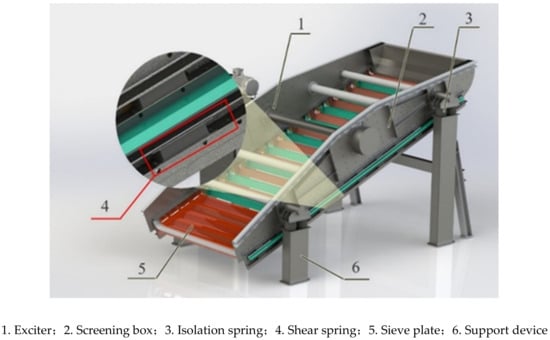
Figure 1.
Schematic diagram of the structure of the vibrating flip-flow screen.

Table 1.
Parameters of the vibrating flip-flow screen.
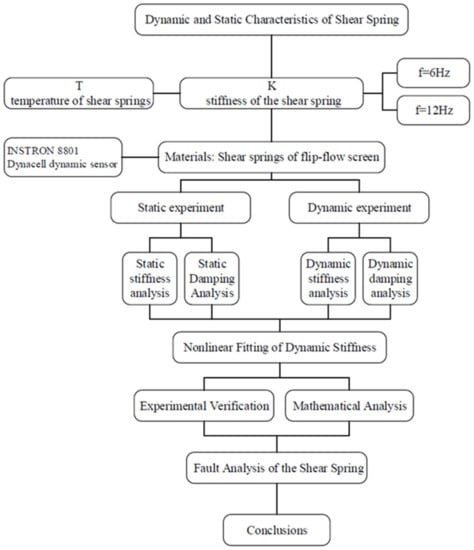
Figure 2.
A flowchart for describing the whole research.
The shear spring test system is shown in Figure 3 and Figure 4. The test equipment includes an INSTRON 8801 fatigue test system and a Dynacell dynamic sensor.
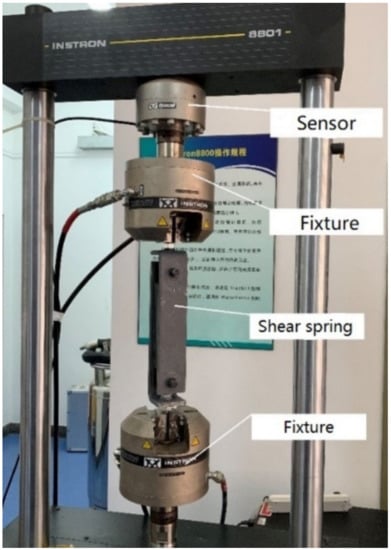
Figure 3.
Test system.
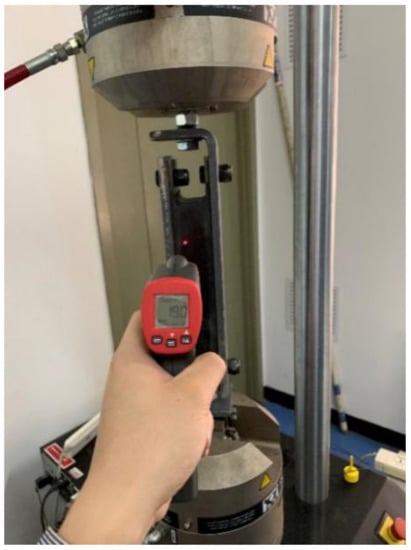
Figure 4.
Temperature measurement of shear spring.
Three different sizes of rubber springs were selected. The material of the shear springs is natural rubber, of which the main component is polyisoprene ((C5H8) n), and 91%~94% of the natural rubber composition is rubber hydrocarbon. These three springs were applied in practice on the VFFS; they are as shown in Figure 5, and the relevant parameters are shown in Table 2.

Figure 5.
Rubber shear spring.

Table 2.
Relevant parameters of shear springs.
Shore hardness was tested using a Shore hardness tester, into which the shear spring was first inserted. The pointer on the dial was connected to a puncture needle through a spring, and the needle was used to penetrate the surface of the object to be measured. The value displayed on the dial was the hardness value. Using the Shore hardness tester, three points were selected, namely the two end points of the shear spring and a point in the middle. The average value of the measured results was taken as the hardness of the spring.
2.2. Experimental Evaluation
The shear spring is made of rubber, and the system of which it is a part can be understood as a parallel system of a spring and viscous damper [26], as shown in Figure 6.
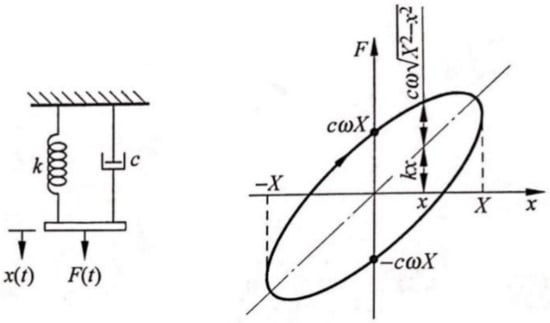
Figure 6.
Spring viscous damper system.
According to the force calculation formula [27] of a viscous damping free vibration system, the force required to cause amplitude x (t) is F:
The area of the hysteresis curve is the work consumed in a cycle of spring stiffness, and according to the literature, the formula [28] for the energy dissipated by the damper in a period is as follows:
The formula [28] for calculating the damping coefficient is:
where ∆W is the energy consumed for the damper in one cycle; F is the force required for displacement x; K is the stiffness of the shear spring; ω is the angular frequency; c is the damping of the shear spring; is the velocity and t is the time.
Rubber is a typical viscoelastic material, and the static stiffness of rubber is the ability to resist deformation under static load. Under the action of alternating load, the alternating deformation of the rubber material lags behind the alternating load, which is called the hysteresis effect of the rubber material [29]. The hysteresis curve, also known as the restoring force curve, is the load–deformation curve of the structure under the cyclic action of force, and the slope of the line connecting the maximum amplitude and the minimum amplitude in the hysteresis curve represents stiffness [30]. The stiffness is the value of the external force required to generate a unit deformation of the structure, and static stiffness is the ability to resist deformation under static load. Dynamic stiffness is the ability to resist deformation under dynamic load, and represents each hysteresis loop curve of the shear spring under different conditions.
In this study, when only damping was considered, the hysteretic curve was a horizontal ellipse. When damping and stiffness were taken into account simultaneously, the hysteretic curve was an inclined ellipse with a certain inclination. Therefore, based on previous research, it can be approximated that the slope of the hysteresis curve represents the stiffness, as the following formula [31]:
where is stiffness, (kN/m); Fmax,i and Fmin,i indicate the maximum and minimum force of each hysteresis loop curve, respectively, (N); xmax,i and xmin,i represent the maximum and minimum amplitude of each hysteresis loop curve, respectively, (mm); n is the number of hysteresis loop curves obtained in the steady state.
2.3. Experiment Steps
The installation steps were as follows:
- Step 1:
- Fixing bolts at the upper and lower ends of the fixture were tightened to ensure they were concentric.
- Step 2:
- The shear spring and the test fixture were tightly connected by the bolts.
- Step 3:
- The experimental device was loaded into the system for testing.
Before the test, the hardness of the shear springs were tested using the hardness tester. Three points, namely at the two ends and the middle of the shear springs, were selected for each spring; the average hardness of the measured results are shown in Table 2.
3. Results and Discussion
3.1. Temperature Analysis
3.1.1. Operating Temperature
The stress process of the shear spring as follows: the eccentric block in the exciter is driven by the motor, so that the main screen frame is subjected to the exciting force, which is transmitted to the floating screen frame through the shear springs. When the exciting frequency reaches the frequency domain of the working condition of the VFFS, and the relative motion between the main screen frame and the floating screen frame occurs, the polyurethane screen mesh is able to undergo both relaxation and tension.
According to the arrangement, the springs are arranged from 1 to 11 (from the feed end to the discharge end) on the screen. Ui-R, Ui--L, Di--R, and Di--L represented the upper right shear spring, upper left shear spring, lower right shear spring and lower left shear spring, respectively. As shown in Figure 7, the intermediate shear springs are those installed in the middle of the screen frame, as shown in positions 5, 6, and 7.
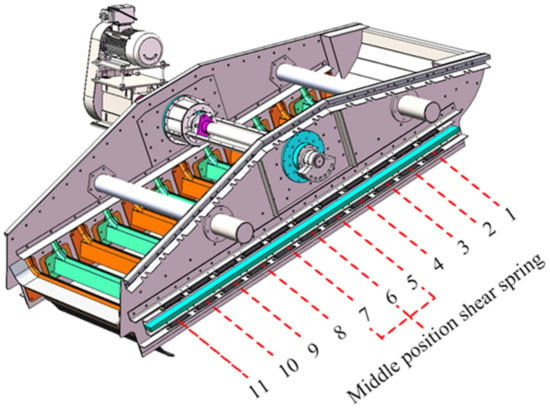
Figure 7.
Schematic diagram of shear spring arrangement on the flip-flow screen
The research object of this experiment was the shear springs of the VFFS1848, which ran without a load for 1, 2, and 3 h. Relevant working condition parameters are shown in Table 3. The temperature of each shear spring under different working conditions was measured and the relationship between temperature and position are shown in Figure 8a–d.

Table 3.
Relevant parameters of the VFFS1848 under different working conditions.
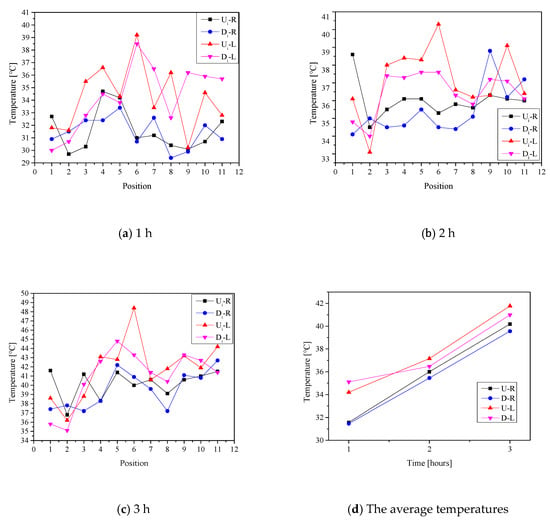
Figure 8.
The temperature of the shear springs of the VFFS without a load.
In this study, the temperature measurement of the shear spring was finished in the factory, and tested without a load. The measurement steps of the working condition (without a load) temperature on the shear springs were as follows:
- (1)
- Eleven sets of shear springs on the left and right sides of the screen body were numbered, respectively, from the feeding direction of the vibrating flip-flow screen;
- (2)
- The measuring instruments were prepared and the VFFS was started without a load;
- (3)
- After running for 1 h, the ambient temperature of the factory and the surface temperature of the shear springs were measured. The three points were measured for each spring, and the average value was calculated as the working temperature of the spring. The temperature of the motor and isolation springs, the vibration frequency and the amplitude were measured at the same time.
- (4)
- After running for 2 h, the ambient temperature of the factory and the surface temperature of the shear springs were measured. The three points were measured for each spring, and the average value was calculated as the working temperature of the spring. The temperature of the motor and isolation springs, and the vibration frequency and amplitude, were measured at the same time.
- (5)
- After running for 3 h, the ambient temperature of the factory and the surface temperature of the shear springs were measured. The three points were measured for each spring, and the average value was calculated as the working temperature of the spring. The temperature of the motor and isolation springs, and the vibration frequency and amplitude, were measured at the same time.
- (6)
- At the same time on the following day, the relevant parameters were measured again according to the steps (1)–(5).
- (7)
- Because the measurements were taken in the factory, the equipment was tested twice before leaving the factory.
- Ran for 1 h:As shown in Figure 8a, when the VFFS ran for 1 h without a load, and the surface temperatures of the shear springs were measured with an infrared thermometer, it was found that:
- 1)
- The shear spring with the highest temperature was U6-L (39.2°C), and that with the lowest temperature was D8-R (29.4°C).
- 2)
- The average temperatures of Ui-L and Ui-R shear springs were 34.2 and 31.6 °C, respectively.The average temperatures of Di-L and Di-R shear springs were 35.1 and 31.5°C, respectively. The order of the average temperature of the shear springs was Di-L > Ui-L > Ui-R > Di-R.
- 3)
- The average temperature of all shear springs was 33.1 °C.
- Ran for 2 h:As shown in Figure 8b, when the VFFS ran for 2 h without a load, and the surface temperatures of the shear springs were measured with an infrared thermometer, it was found that:
- 1)
- The highest temperature shear spring was U6-L (40.3 °C), and the lowest temperature was U2-L (33.1 °C)
- 2)
- The average temperatures of the Ui-L and Ui-R shear springs were 37.2 and 36.0 °C, respectively. The average temperatures of Di-L and Di-R shear springs were 36.5 and 35.4 °C. The order of the average temperature of the shear springs was Ui-L > Di-L > Ui-R > Di-R.
- 3)
- The average temperature of all shear springs was 36.3 °C.
- Ran for 3 h:As shown in Figure 8c, when the VFFS ran for 3 h without a load, and the surface temperatures of the shear springs were measured with an infrared thermometer, it was found that:
- 1)
- The highest temperature shear spring was U6-L (48.4°C), and the lowest temperature was D2-L (35.1 °C);
- 2)
- The average temperatures of Ui-L and Ui-R shear springs were 41.8 and 40.2 °C, respectively. The average temperatures of Di-L and Di-R shear springs were 41.0 and 39.6 °C, respectively. The order of the average temperature of the shear springs was Ui-L> Di-L> Ui-R> Di-R.
- 3)
- The average temperature of all shear springs was 40.6 °C.
Figure 8d exhibits the variation of the average temperatures of the U-L, U-R, D-L, and D-R shear springs on the VFFS with the running time.
- 1)
- The temperatures of the shear springs on the left side of the VFFS were higher (2.6 °C) than those of the right side. Because the driving motor was installed on the right side of the screen (from feeding to discharge direction), the deformation of the shear springs on the left of the screen was slightly larger than that of the springs on the right, thus, the temperatures of the left shear springs were higher than those of the right shear springs.
- 2)
- The temperature difference of the shear springs between the left and right of the flip-flow screen was reduced from 3.15 °C (running for 1 h) to 1.51 °C (running for 3 h). This is mainly due to the fact that under stable operation of the VFFS, the amplitudes of the main frame and the floating screen frame were gradually stable, and the deformation of the shear springs connecting the main screen frame and the floating screen frame tended to be stable.
3.1.2. Analysis of Temperature on Stiffness
Figure 9 shows that the stiffness of the shear spring decreases with the increase in the working temperature. When the vibration frequency f = 6 Hz, the stiffness K of the shear spring decreased by 13% in the range of 36~45 °C; when the temperature was greater than 45 °C, the stiffness decreased by 5%. When the vibration frequency was f = 12 Hz, the stiffness K of the shear spring decreased by 9% in the range of 54~56 °C, and the decrease was 3% when the temperature was above 56 °C. Thus, at low frequencies, the stiffness change in the low temperature range was obvious, and at high frequencies, the stiffness change in the high temperature range was marked; when the temperature of the shear spring stabilized, the stiffness of the shear spring approached 270 N/mm.
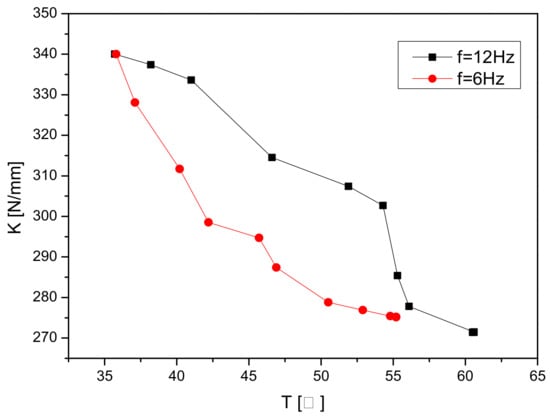
Figure 9.
The curve of shear spring stiffness with temperature at different frequencies.
3.2. Static Experiment
The experimental conditions were as follows: a static experiment with a constant room temperature of 19 ± 0.1 °C, frequency of 0.1 Hz (static), and an amplitude of 1~8 mm was carried out at a 20 min interval. As shown in Figure 4, the surface temperature of springs was measured using an infrared thermometer.
3.2.1. Amplitude-Load Analysis
At a static frequency (0.1 Hz), the amplitude load change data of 1, 4 and 8mm were selected for analysis, and the results are shown in Figure 10a–c, respectively.
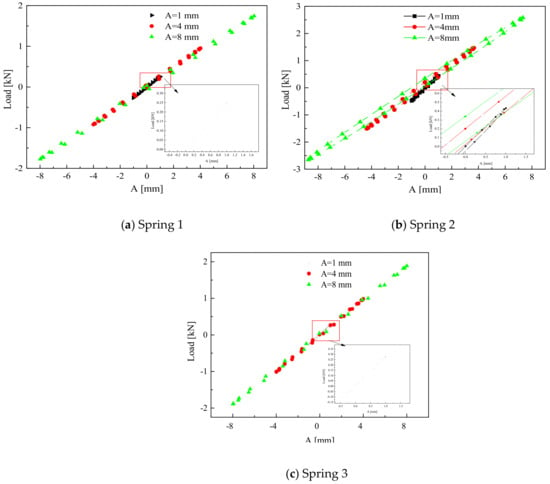
Figure 10.
The amplitude load curve of shear springs at 0.1 Hz.
With the increase in amplitude, the area of the hysteretic loops of the three kinds of shear spring increased gradually, but the diagonal slope of the hysteretic loops decreased gradually; that was, the static stiffness of shear springs decreased gradually.
3.2.2. Static Stiffness Analysis
To thoroughly explore the influence of shear spring amplitude on stiffness characteristics, the diagonal slope of the hysteretic curve was calculated. When the frequency of shear spring 1 was 0.1 Hz, the functional relationship between position and load was as follows: y = 0.22x − 3.036, with a high fitting degree, R2 of 0.999. The slope of 0.22 represents the stiffness, as shown in Figure 11.
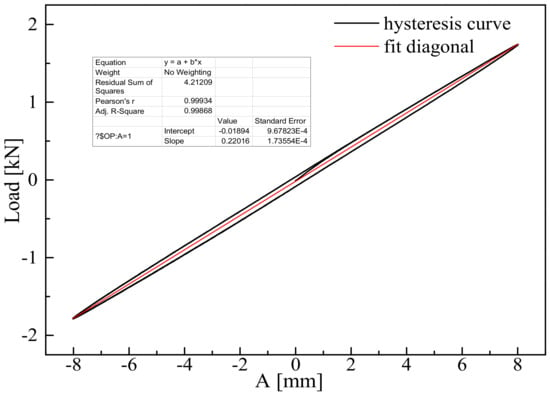
Figure 11.
Spring 1 fitting of the diagonal curve with a hysteretic curve of amplitude 8 mm at 0.1 Hz.
To reduce the test error and avoid contingency, several groups of cyclic data were selected for fitting, and the mean value was taken as the test result under this condition. The data of shear springs 1, 2, and 3 were used to draw the static stiffness curves, as shown in Figure 12.
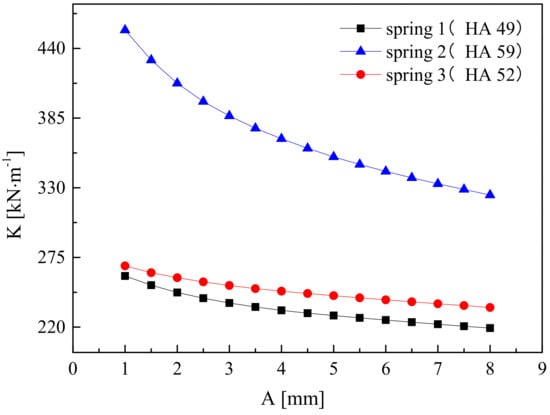
Figure 12.
The static stiffness–amplitude curve of the shear springs.
The static stiffness of the three kinds of shear springs decreased with the increase in amplitude, and the spring 2 decreasing trend was more distinct with the increase in Shore hardness.
3.2.3. Static Damping Analysis
To show the effect of amplitude on the area of the hysteretic curve (energy consumption caused by the structural plasticity of the rubber shear spring) more intuitively and clearly at the frequency of 0.1 Hz, the experimental results were plotted as a curve, as shown in Figure 13.
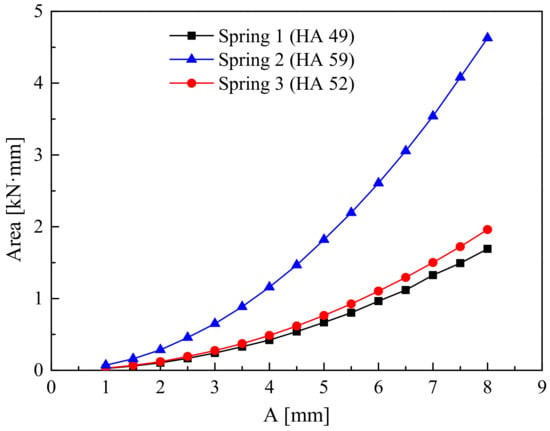
Figure 13.
The relationship between amplitude and hysteresis curve area at the frequency of 0.1 Hz.
When the frequency of the three shear springs was 0.1 Hz, the area of the hysteresis curve increased with the increase in amplitude. Thus, the internal energy consumption increased with the increase in amplitude. Of the three springs, the area of the hysteretic curve of spring 2 was the most significantly affected by amplitude.
According to the formula for calculating the damping coefficient of a rubber shear spring, the amplitudes of springs 1, 2, and 3, corresponding to the area of the hysteretic curve, were substituted to calculate the corresponding damping coefficients under different amplitudes. The influence of amplitude on the damping coefficients of the rubber shear springs were plotted at the frequency of 0.1 Hz, the experimental result was shown in Figure 14.
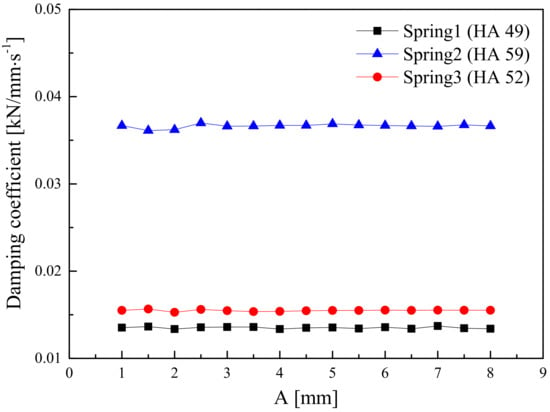
Figure 14.
Rubber shear springs damping coefficient–amplitude curve.
The damping coefficients of the three shear springs changed little with the amplitude, thus, it can be concluded that the damping coefficients were independent of the amplitude at a certain frequency. In Figure 14, the damping coefficients of shear spring 2 were the largest of the three, which indicated that the damping coefficient increases with the increase in Shore hardness.
3.3. Dynamic Experiment
3.3.1. Amplitude-Load Analysis
In this section, the influence of various factors on the dynamic stiffness and damping coefficients of the shear springs were systematically analyzed, and the significance of each parameter on its dynamic characteristics was determined. In this study, the principle of the single factor experiment was used to establish a number of experimental schemes, and the corresponding experimental analysis was carried out. Three shear springs were selected as experimental schemes, hysteretic curves were drawn, and the effects of frequency and amplitude on the diagonal slope and area of the hysteretic curves were analyzed, as shown in Figure 15, Figure 16 and Figure 17.
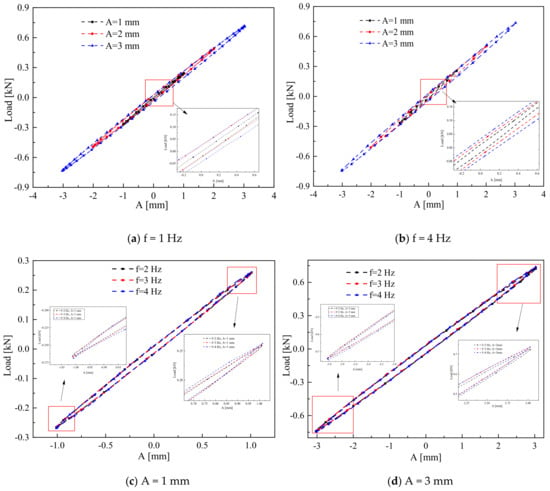
Figure 15.
The hysteretic curve of shear spring 1 under different working conditions.
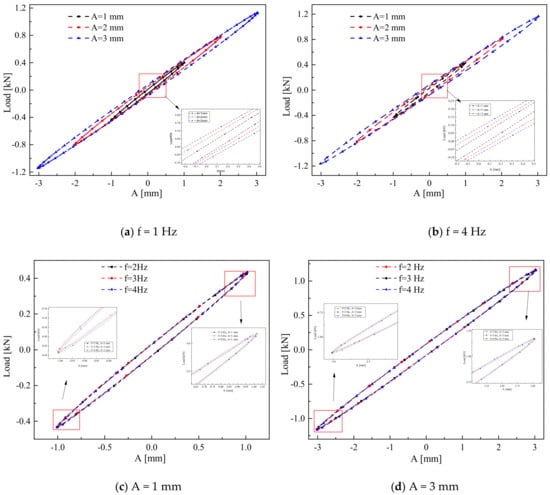
Figure 16.
The hhysteretic curve of shear spring 2 under different working conditions.
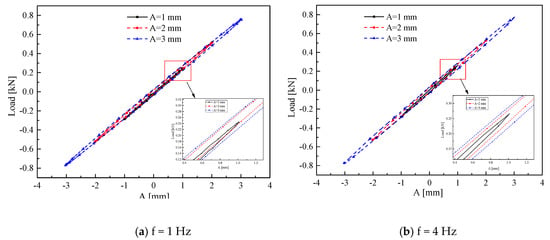
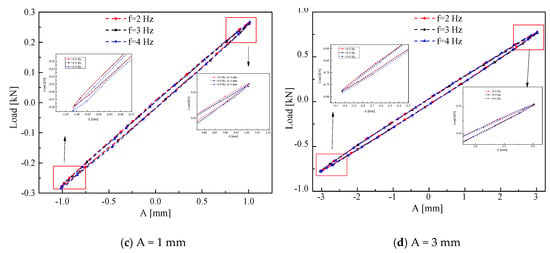
Figure 17.
The hysteretic curve of shear spring 3 under different working conditions.
The slope of the hysteretic curves of the three shear springs decreased evidently with the increase in amplitude and increased slightly with the increase in frequency. Thus, the dynamic stiffness was negatively correlated with amplitude and positively correlated with frequency; the area of the hysteretic curve increased with the increase in amplitude, and the frequency had little influence on it. Thus, the energy consumption caused by damping increased with the increase in amplitude and increased slightly with the increase in frequency.
3.3.2. Dynamic Stiffness Analysis
In this experiment, the steady motion of the fatigue test system after a period of time was selected. Thirty cycles were collected and fitted, and the result was averaged as the experimental result corresponding to that working condition. To understand the influence of amplitude and frequency on dynamic stiffness and its significance, a three-dimensional curve of dynamic stiffness varying with amplitude and frequency was drawn using the fitting results of shear springs 1, 2, and 3 at frequency f = 1~4 Hz and amplitude A = 1~3 mm, as shown in Figure 18.
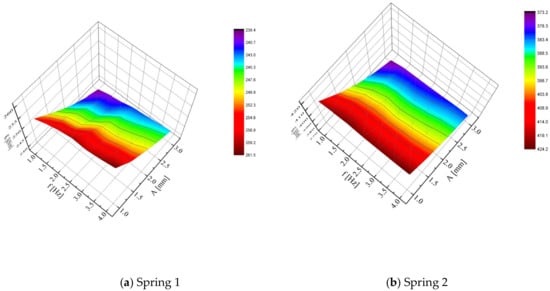
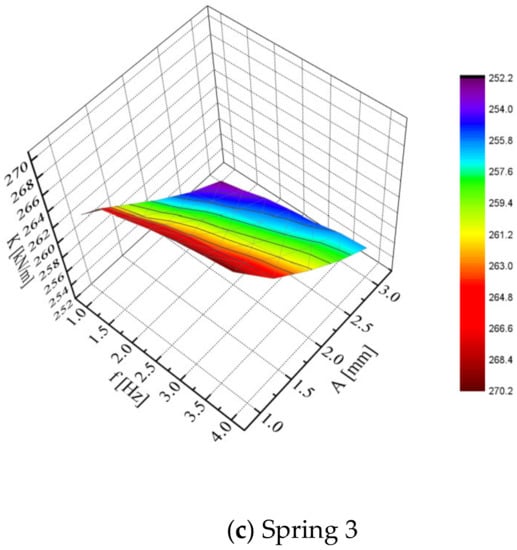
Figure 18.
The curve of dynamic stiffness of shear springs with amplitude and frequency.
According to Figure 18, the dynamic stiffness of the shear springs decreased with the increase in amplitude, and increased with the increase in frequency; the effect of the amplitude on the dynamic stiffness was greater than that of the frequency.
The influence of amplitude and frequency on dynamic stiffness was studied; stiffness–frequency curves under different amplitudes and stiffness–amplitude curves under different frequencies were drawn, as shown in Figure 19. The dynamic stiffness curve of the springs tends to be parallel between different levels of amplitude and frequency, which indicated that there was no impact of frequency and amplitude on dynamic stiffness, and the influences of amplitude and frequency on dynamic stiffness were independent of each other.

Figure 19.
Stiffness–frequency and stiffness–amplitude curves of springs under different amplitudes.
3.3.3. Dynamic Damping Analysis
To systematically analyze the influence of frequency and amplitude on the damping characteristics of shear springs, simple harmonic motion in the frequency of 1 ~ 4 Hz and amplitude of 1~3 mm were studied, as shown in Figure 20.
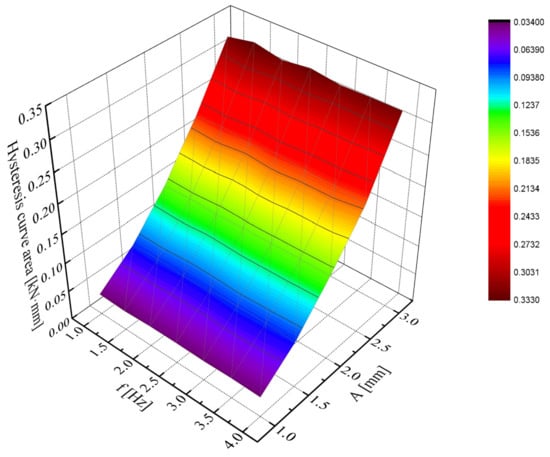
Figure 20.
The area–frequency curve of the hysteretic curve under different amplitudes of spring 1.
It can be seen from Figure 20 that the area of the hysteretic curve increased with the increase in amplitude. Furthermore, the curve was approximately a power function, but did not change with the increase in frequency.
According to the formula of the damping coefficient, the damping coefficients of spring 1, 2, and 3 were calculated, and the three-dimensional curve of the damping coefficients varying with frequency and amplitude were drawn, as shown in Figure 21.
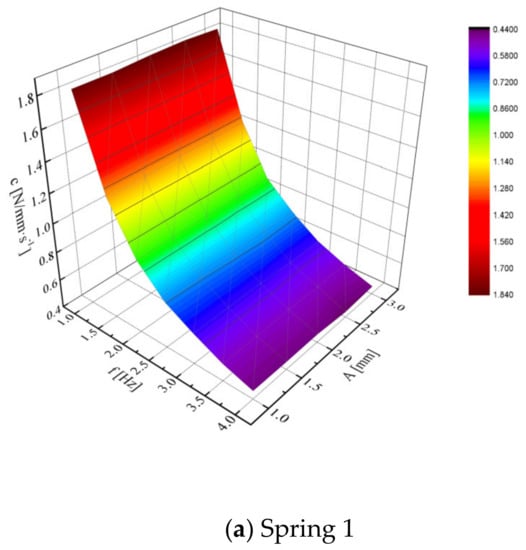
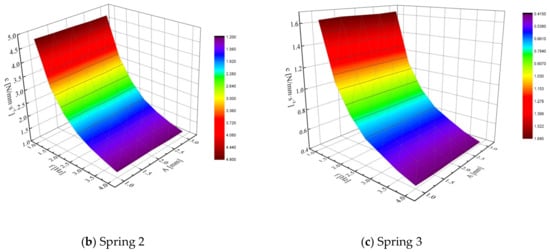
Figure 21.
Curves of the damping coefficients of the springs with frequency and amplitude.
Under the condition of a constant temperature of 19 ± 0.1 °C, frequency of 1~4 Hz, and amplitude of 1~3 mm, the damping coefficients of the three shear springs decreased with the increase in frequency, but did not change with the increase in amplitude. That is, amplitude was not a significant factor affecting the damping coefficients. Shear spring 2 had the largest damping coefficient of the three springs, which indicated that the damping coefficients increased with the increase in hardness. The energy consumption caused by damping was proportional to the square of the amplitude, and changed little with the increase in frequency; thus it can be neglected. The damping coefficients decreased with the increase in frequency and did not change with the change in amplitude.
3.4. Nonlinear Fitting of Dynamic Stiffness
Using the non-linear fitting function in MATLAB, the function form is given as follows:
where K stands for stiffness, kN/m; f represents frequency, Hz; A represents amplitude, mm; a, b, c, d are constants, respectively.
The dynamic stiffness of the shear springs of the vibration flip-flow screen with HA = 50 and shape size of 203 × 70 × 48 (mm × mm × mm) were calculated, and the function was obtained as follows:
The error analyzed by the data showed that: the error of dynamic stiffness obtained by fitting was less than 1% compared with that measured by experiment, so the fitting formula was believed to be credible.
The three-dimensional curves of dynamic stiffness with frequency and amplitude were obtained by fitting, as shown in Figure 22. By comparing the experimental curve with the fitting curve, it can be found that the fitting degree was good.
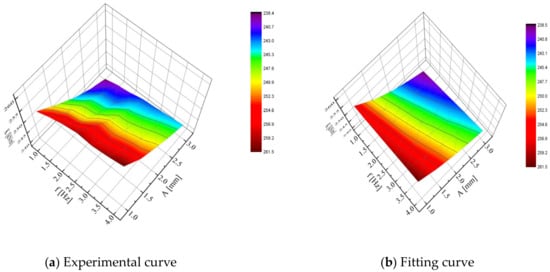
Figure 22.
Comparison between the experimental curve and fitting curve.
3.5. Experimental Verification
To verify the accuracy of this formula, a dynamic experiment with a frequency of 5 Hz and amplitude of 2 mm was carried out, as shown in Figure 23.
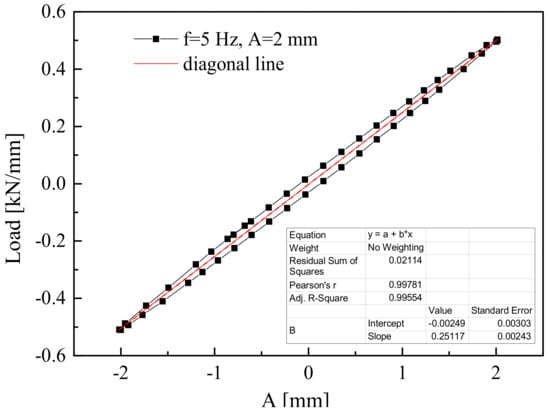
Figure 23.
Hysteretic curve of spring 1 at frequency 5 Hz and amplitude 2 mm.
From Figure 23, under the condition of frequency 5 Hz and amplitude 2 mm, it can be seen that the diagonal slope of the hysteretic curve of the spring was 0.25117, which indicated that the stiffness was 251.17 kN/m.
This was calculated by the fitting formula (6):
△K = 1.95 kN/m and the error was 0.7%, which can be neglected. Therefore, it was considered that this formula can be used for the stiffness calculation.
3.6. Mathematical Analysis
In this paper, the influence of amplitude and frequency on the stiffness of the shear spring was systematically analyzed using the methods of range analysis and variance analysis, and the significance of each factor on the stiffness of the shear spring was determined.
3.6.1. Range Analysis of Dynamic Stiffness
Range analysis is a simple, intuitive, and effective analysis method, using the following formula [32]:
The larger the range, the more significant and important the influence of this factor on the test index.
The result of the range analysis of dynamic stiffness of shear spring 1 was Rd > Rf, as shown in Figure 24, a similar result to those of spring 2 and spring 3. For spring 1, spring 2, and spring 3, when the amplitude changed from 1 mm to 3 mm, the dynamic stiffness deceased by 6.6%, 11.1%, and 5.2%, respectively; when the frequency varied from 1 Hz to 4 Hz, the dynamic stiffness increased by 2.8%, 3.6%, and 1.9%, respectively.
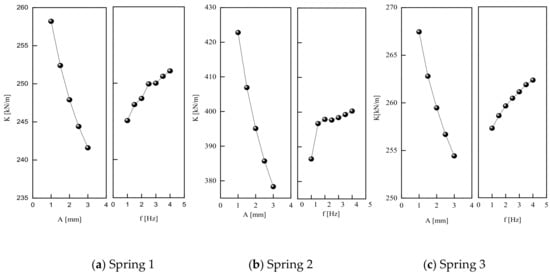
Figure 24.
The trends of factors and indicators.
In the horizontal range, the dynamic stiffness of shear spring was approximately linear with amplitude and frequency: the dynamic stiffness decreases linearly with the increase in amplitude. The dynamic stiffness increases with the increase in frequency. Of these, the amplitude has a greater influence on the dynamic stiffness of the shear spring, followed by frequency.
3.6.2. Variance Analysis of Dynamic Stiffness
Analysis of variance is a significant test of the difference between the averages of two or more samples. In this paper, the F-value of two-factor analysis of variance was used to test and compare.
According to Table 4, if the variance result was Fd > F0.99 (4, 24), the amplitude was a highly significant factor; if Ff > F0.99 (6, 24), the frequency was a highly significant factor. The order of significant factors was amplitude > frequency, which was the same as the result of the range analysis. The results for spring 2 and 3 were the same as spring 1.

Table 4.
Spring 1 dynamic stiffness variance analysis table.
Within the range of a constant temperature of 19 ± 0.1 ℃, amplitude of 1~3 mm, and frequency of 1~4 Hz, amplitude and frequency were highly significant factors for the dynamic stiffness of shear springs, and Fd > Ff. In addition, amplitude had a greater impact on the dynamic stiffness of shear springs and the influence of frequency was relatively small.
3.7. Fault Analysis of the Shear Spring
As a key part of the vibrating flip-flow screen, during operation the shear springs were prone to be torn, degumming of vulcanization and other problems, which led to a sharp drop in stiffness, directly affecting the working stability of the VFFS.
3.7.1. Static Experiment
To clearly study the change in stiffness and damping of the shear spring before and after being torn in the static test, two groups of shear springs test data were selected for comparative analysis under the same working conditions. Because of the large amount of test data, the hysteresis curves were drawn at the frequency of 0.1 Hz and the amplitude of 1, 3, 5, and 8 mm.
According to Figure 25, the stiffness and damping of shear springs before and after being torn decreased significantly. The stiffness–amplitude and damping coefficient–amplitude curves were plotted as shown in Figure 26 and Figure 27, which compared the ripped and normal shear springs at the frequency of 0.1 Hz. It can be concluded that the static stiffness and damping coefficients of the ripped shear spring decreased sharply under the same working conditions.
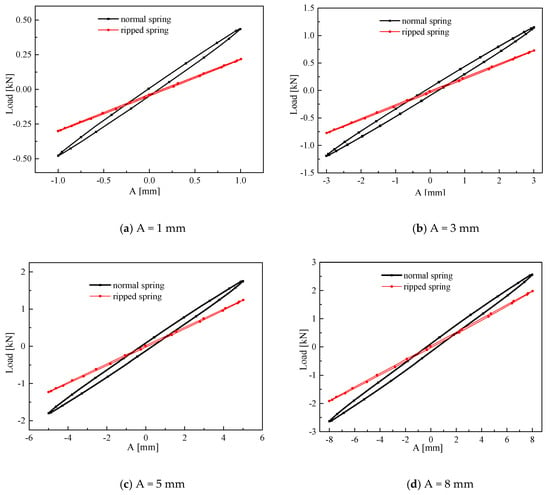
Figure 25.
The hysteretic curves of shear springs before and after tearing at frequency 0.1 Hz.

Figure 26.
Static stiffness–amplitude curve.
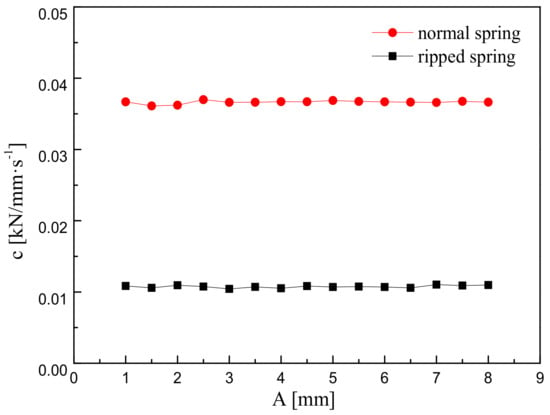
Figure 27.
Damping coefficient–amplitude curve.
3.7.2. Dynamic Experiments
To analyze the changes of stiffness and damping of the shear springs before and after being torn in dynamic experiments, two groups of shear spring test data were selected for comparison under the same working conditions. Three groups of tested data were selected to draw hysteretic curves, as shown in Figure 28.
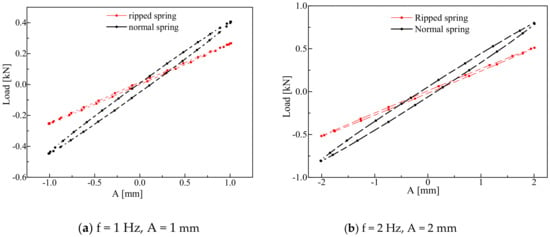
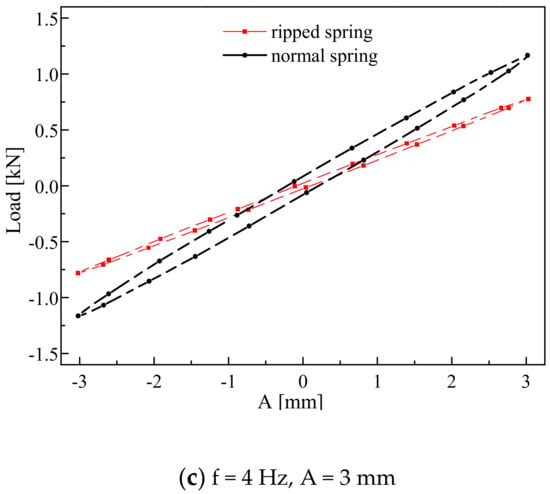
Figure 28.
The hysteretic curves of shear springs before and after being torn under different working conditions.
According to Figure 28, the diagonal slope of the hysteresis curve of the ripped shear spring was less than that of the normal spring, and the curvature of the hysteresis curve was greater than that of the normal spring. Thus, the stiffness and damping of the shear springs before and after being torn obviously decreased. To better understand the difference in stiffness and damping before and after being torn, the experimental data of the ripped shear spring was processed and the curves were drawn.
In this experiment, experimental data was selected to draw curves, as shown in Figure 29. The dynamic stiffness and damping coefficients of shear springs after being torn were quite different from the normal spring. For a given working condition, the stiffness and damping coefficients of the shear spring before and after being torn were quite different, which seriously affected the stability of the operation of the VFFS. Furthermore if the shear spring was torn during operation, not located and replaced quickly, a wide range of damage could be caused, resulting in serious equipment failure and accident.
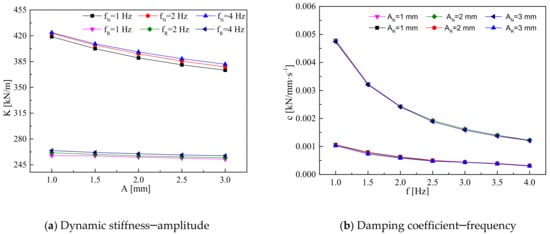
Figure 29.
The dynamic stiffness–amplitude and damping coefficient–frequency curves of shear springs with different frequencies before and after being torn.
4. Conclusions
In summary, this work describes the static and dynamic characteristics of the shear springs of a vibrating flip-flow screen under different influencing factors, such as amplitude, frequency, temperature, and hardness. Based on the results, the following observations can be made:
- (1)
- The temperatures of the shear spring symmetrically installed on both sides of the flip-flow screen were different during operation, and the left side of the shear springs was higher than that of the right side. In addition, the stiffness of the shear spring decreased with the increase in their working temperature. When the temperature of the shear springs stabilized, the stiffness of the shear spring approached 270 N/mm.
- (2)
- The static stiffness decreased when the amplitude and Shore hardness of the shear spring increased. The damping coefficient of the shear spring changed little with the increase in amplitude, and increased with the increase in Shore hardness.
- (3)
- Based on the fitting formula and the experimental results, amplitude and frequency were found to be highly significant factors for the dynamic stiffness of shear springs. Moreover, the amplitude had a greater impact on the dynamic stiffness of shear springs than frequency.
- (4)
- The dynamic stiffness and damping coefficient of shear springs after being torn were quite different from those of normal springs. A torn shear spring will affect the stable operation of the flip-flow screen, even resulting in serious equipment failure and accident.
Author Contributions
Author Contributions: Conceptualization, G.Z. (Guofeng Zhao) and X.W.; methodology, G.Z. (Guofeng Zhao); software, G.Z. (Guohui Zhu) and C.Y.; validation, X.W; formal analysis, G.Z. (Guohui Zhu); investigation, G.Z. (Guohui Zhu), J.Z and G.Z. (Guohui Zhu); resources, X.W.; data curation, G.Z. (Guofeng Zhao) and S.L.; writing—original draft preparation, G.Z. (Guofeng Zhao); writing—review and editing, G.Z. (Guofeng Zhao); visualization, G.Z. (Guofeng Zhao); supervision, J.Z.; project administration, C.Y.; funding acquisition, X.W. All authors have read and agreed to the published version of the manuscript.
Funding
This research received no external funding.
Conflicts of Interest
The authors declare no conflict of interest.
References
- Jiang, H.; Zhao, Y.; Duan, C. Kinematics of variable-amplitude screen and analysis of particle behavior during the process of coal screening. Powder Technol. 2017, 306, 88–95. [Google Scholar] [CrossRef]
- Dietz, G. 25 years of polyurethane screen planets in mineral processing. Aufbereit. Tech. 1994, 35, 404–412. [Google Scholar]
- Hirsch, W. Flip-flow screens of the third generation. Aufbereit. Tech. 1992, 33, 686–690. [Google Scholar]
- Wu, M. Stability Theory of Elastic Stick; Academic Education Press: Beijing, China, 1988; Volume 8, pp. 127–135. [Google Scholar]
- Schmit, H. Discussing on screen theory of flip-flow screen. Aufbereit. Tech. J. 1977, 18, 118. [Google Scholar]
- Zhao, Y.; Liu, C. Research on polytechnic parameters of flip-flow screen. In Proceedings of the 14th Annual International Pittsburgh Coal Conference, Pittsburgh, PA, USA, 14–18 September 1998. [Google Scholar]
- Filter Media. Banana flip-flow screen benefits coal preparation. Filtr. Sep. J. 2016, 7/8, 38–41. [Google Scholar]
- Zheng, G.; Zhu, J.; Xia, W.; Wang, P. Banana flip-flow screen benefits coal preparation. Filtr. Sep. 2016, 43, 38–41. [Google Scholar]
- Akbari, H.; Ackah, L.; Mohanty, M. Performance optimization of a new air table and flip-flow screen for fine particle dry separation. Int. J. Coal Prep. Util. 2017, 39, 1–23. [Google Scholar] [CrossRef]
- Guo, Q.; Gong, G. Application of flip flow screen in Sihe coal preparation 1 plant. Proceedins of the XVIII International Coal Preparation Congress, Saint-Petersburg, Russia, 28 June 2016; Springer: Cham, Germany, 2016; pp. 913–918. [Google Scholar]
- Zhang, J.; Huang, Y.; Chen, Z. The basic dynamics study of flip-flow screen and particles based on MATLAB. Appl. Mech. Mater. 2013, 444–445, 1340–1344. [Google Scholar] [CrossRef]
- Peng, L.; Li, F.; Dong, H.; Liu, C.; Zhao, Y.; Duan, C. Characteristics analysis of a novel centralized-driving flip-flow screen. Int. J. Min. Sci. Technol. 2014, 24, 195–200. [Google Scholar] [CrossRef]
- Xiong, X.; Niu, L.; Gu, C.; Wang, Y. Vibration characteristics of an inclined flip-flow screen panel in banana flip-flow screens. J. Sound Vib. 2017, 411, 108–128. [Google Scholar] [CrossRef]
- Hamid, A.; Louis, A.; Manoj, M. Performance Optimization of a New Air Table and Flip-flow Screen for Fine Particle Dry Separation. Int. J. Coal Prep. Util. 2020, 40, 581–603. [Google Scholar]
- Wu, J.; Liu, C.; Jiang, H.; Zhang, B. A vibration-test-based calculation method of screening material mass of a mining crank-link type flip-flow screen. Energy Sources Part A 2020, 1–21. [Google Scholar] [CrossRef]
- Zhou, E.; Yan, G.; Weng, X.; Zhang, Z.; Zhao, P.; Zhang, B. A novel and low cost coal separation process: Combination of deep screening classification and gravity separation. Powder Technol. 2020, 367, 568–575. [Google Scholar] [CrossRef]
- Yu, C.; Wang, X.; Pang, K.; Zhao, G.; Sun, W. Dynamic Characteristics of a Vibrating Flip-flow Screen and Analysis for Screening 3 mm Iron Ore. Shock Vib. 2020, 7, 1–12. [Google Scholar] [CrossRef]
- Gong, S.; Sebastian, O.; Wang, X. An experimentally validated rubber shear spring model for vibrating flip-flow screens. Mech. Syst. Signal Process. 2020, 139, 106619. [Google Scholar] [CrossRef]
- Jiang, H.; Yu, S.; Pan, M.; Duan, C.; Zhao, Y.; Zhou, Z.; Liu, C.; Wu, J.; Song, B. Effect of excitation parameters on motion characteristics and classification performance of rigid-flexible coupled elastic screen surface for moist coal. Adv. Powder Technol. 2020, 31, 1196–1208. [Google Scholar] [CrossRef]
- Cveticanin, L. Vibration of a coupled two-degree-of-freedom system. J. Sound Vib. 2001, 247, 279–292. [Google Scholar] [CrossRef]
- Wang, H.; Chen, Z. Research and application of shear spring of double mass vibrating relaxation screen. Coal Eng. 2018, 50, 149–156. [Google Scholar]
- Gong, S. Non-linear Analysis of Vibrating Flip-flow Screens. In Proceedings of the MATEC Web of Conferences, Melbourne, Australia, 29 October 2018; Volume 221, pp. 1–3. [Google Scholar]
- Hong, R.; Liu, C.; Wu, J.; Qiu, W. Modal analysis and test of rubber for vibrating relaxation screen. Coal Technol. 2019, 38, 168–171. [Google Scholar]
- Rey, T.; Chagnon, G.; Le Cam, J.B.; Favier, D. Influence of the temperature on the mechanical behavior of filled and unfilled silicone rubbers. Polym. Test. J. 2013, 32, 492–501. [Google Scholar] [CrossRef]
- Tang, J.; Niu, L.; Xiong, X.; Jie, S. Viscoelasticity of Rubber Springs Affects Vibration Characteristics of a Flip-flow Screen With the High G Value. IEEE Access J. 2020, 8, 26950–26965. [Google Scholar] [CrossRef]
- Li, S.; Zhang, W.; Hou, J.; Duan, W.; Chi, S.; Guo, B. Study on dynamic stiffness characteristics of shock absorber. J. China Ordnance. 2017, 38, 2274–2279. [Google Scholar]
- Wen, B.; Liu, S.; Chen, Z.; Li, H. Theory of Mechanical Vibration and Its Applications; Higher Education Press: Beijing, China, 2009; pp. 32–33. [Google Scholar]
- Singiresu, S.R. Mechanical Vibrations, 5th ed.; Li, X., Yang, L., Eds.; Tsinghua University Press: Beijing, China, 2016; pp. 99–100. [Google Scholar]
- Lin, H.; Song, M. Research on the Stress Softening Effect and Hysteresis Effect of Vulcanized Rubber. J. Rubber Ind. 1989, 12, 735–741. [Google Scholar]
- Wang, X. Modern Coal Preparation Screening and Dewatering Equipment; China Coal Industry Publishing House: Beijing, China, 2014; Volume 12, pp. 45–50. [Google Scholar]
- Polach, O. Modelling of rubber components using estimated parameters. In Proceedings of the 24th International Symposium on Dynamics of Vehicles on Roads and Tacks, Graz, Austria, 17–21 August 2015. [Google Scholar]
- Tang, J.; Xu, Z. Range analysis and variance analysis in orthogonal experiment. Second Math J. 2017, 9, 31–34. [Google Scholar]
© 2020 by the authors. Licensee MDPI, Basel, Switzerland. This article is an open access article distributed under the terms and conditions of the Creative Commons Attribution (CC BY) license (http://creativecommons.org/licenses/by/4.0/).