Article

A New Model for Defining the Criteria of Service Quality in Rail Transport: The Full Consistency Method Based on a Rough Power Heronian Aggregator

1
MC Transport Design and Simulation, Kadinjača 44a, 11000 Belgrade, Serbia
2
Faculty of Technical Sciences, University of Novi Sad, Trg Dositeja Obradovića 6, 21000 Novi Sad, Serbia
3
Faculty of Transport and Traffic Engineering Doboj, University of East Sarajevo, Vojvode Mišića 52, 74000 Doboj, Bosnia and Herzegovina
4
Department of Logistics, University of Defence in Belgrade, Pavla Jurišića Sturma 33, 11000 Belgrade, Serbia
5
Department for Architecture and Urban Planning, Institute of transportation CIP, Nemanjina 6/IV, 11000 Belgrade, Serbia
*
Author to whom correspondence should be addressed.
Symmetry 2019, 11(8), 992; https://doi.org/10.3390/sym11080992
Submission received: 27 June 2019 / Revised: 18 July 2019 / Accepted: 23 July 2019 / Published: 2 August 2019

Abstract

:
The European standard on transport logistics and services in public passenger transport EN 13816 is based on a relationship between the perception of users and transport carriers throughout the groups of criteria taken as a basis for observation in this paper. The constant development and improvement of services in order to achieve sustainability of passenger transport is an imperative on the one hand and a challenge on the other. This is highly evident in persons with disabilities who are faced with many physical and social barriers related to access to rail transport. In this paper, a new model for the selection of criteria for the quality of passenger service in rail transport, from the perspective of persons with disabilities as the main category of passengers, has been created. The survey has covered 168 criteria classified in several groups and the entire territory of Serbia. In order to select the most important criteria, a new model that implies the integration of Full Consistency Method and a Rough Power Heronian aggregator has been developed. The development of a new aggregator enables more accurate decision-making in the process of group decision-making. The results obtained in this paper show that the most important criteria according to importance are Accessibility, Availability, Security, Time, Customer care, Information, Comfort, Environmental impact. Based on the criteria obtained for the service quality of rail transport for persons with disabilities, railway carriers will be able to change and improve the existing services, content, characteristics, equipment of railway stations and vehicles.

Graphical Abstract

1. Introduction

Insufficient activity in recognizing persons with disabilities as passengers in most modes of transport including rail transport, which can contribute to the increase in revenues, points to the necessity of carrying out the research that puts the focus of this category of passengers. Although there has been a lot of progress in improving the position of people with disabilities, it can still be said that these people are exposed to discrimination in their everyday lives.
The main obstacles they face include: mobility to jobs, visits to the doctor, shopping, performing other social and recreational activities that are directly conditioned by inaccessible transport, which is at the same time the first barrier when leaving the house [1,2,3,4]. Therefore, in understanding the needs of persons with disabilities it is necessary to determine their required, desired and unfulfilled activities.
In order to observe the mobility of this population, it should be taken into account individual behaviour in travel, personality characteristics, lifestyle and previous experience, socioeconomic and demographic characteristics that may have an impact on individual requirements.
There are a significant number of studies and strategies analysing the position of people with disabilities, which tells us that this issue is becoming increasingly important and that more attention is being paid to it. In addition to the Convention on the Rights of Persons with Disabilities of the United Nations (UN) accepted and adopted in Serbia in 2006, other laws and documents for the improvement of the rights of persons with disabilities are being regulated in parallel. The strategy for improving the position of persons with disabilities in Serbia for the period 2007–2015 [5] and until 2020 [6] continues to make improvements in general objectives defining solutions for providing access to the built environment, affordable transport, information, communications and services for the public. At a local level of municipalities, the activities [7] that are the result of the long-standing efforts of the associations of persons with disabilities, NGOs and support of local authorities have been undertaken.
In the territory of Serbia, people with disabilities mainly use road transport services for their daily or periodic needs. They use transport services of rail transport far less, primarily due to the inadequate quality of services provided, although rail transport has well-known comparative advantages. In regular annual reports on the quality of services provided in rail passenger transport, persons with reduced mobility, that is, disabilities, as well as accessibility to facilities and vehicles, are not recognized [8]. According to the records of the only passenger transport operator on the railway network of the Republic of Serbia “Srbija voz” JSC, in 2016, the participation of passengers with disabilities in rail transport at all stations was less than 1%, of which 75% of passengers started from the Belgrade station (the capital), while this number was less than 10% for other stations. This picture is even worse on the rest of the railway network of the Republic of Serbia. Although some works have already been carried out and are still being carried out on the railway network in Serbia, the number of passengers with disabilities in rail transport does not increase. There is one important reason for this—most of the reconstructed stations and sections are not adapted for the reception and dispatch of passengers with disabilities. Other reasons for not using rail transport are not known and recognizable because they are not being examined.
Observing experiences in other research it is possible to identify similar elements that arise from the practical problems faced by people with disabilities in rail transport. The lack of universal and unique analyses conducted in different countries and with different bases supports this research.
Studies conducted in developed countries, such as the UK, have found that additional information needs to be collected for better use by hard-to-reach groups [9]. In this paper, certain elements of the service quality of public transport have been recognized and considered throughout the open answers of respondents. Public transport testing throughout the assessment of a number of criteria describing the quality of service provided [10]‚ is useful and important information for different stakeholders and decision-makers [11,12,13].
Comparing planned and provided, that is, expected and verified services, it is possible to measure the efficiency of service quality. For the purpose of uniformizing and promoting the service quality of public transport, the expectation of users is placed first. The European standard CEN 320/TC-EN 13816:2002 on transport logistics and services in passenger transport is based on the perception of the criteria of service quality provided by transport carriers as well as according to Reference [14].
The aim of the paper is to point out the necessity for creating a model that will provide an insight into defining necessary criteria of the service provided for persons with disabilities in rail passenger transport. Based on the dimensioned criteria of the level of service quality in rail transport for persons with disabilities, railway carriers will be able to change and improve the existing services for this category of passengers. In addition to suggestions in the normative sense, the introduction of the necessary standardization of services in passenger transport, which is closely related to the network of railway lines, content, characteristics and equipment of railway stations, vehicles and connections with other modes of transport, is expected to be implemented. This approach will enable greater integration with similar transport systems in Europe.
To evaluate the quality of service provided, some of mathematical models, such as Servqual [15], regression tree [16,17], structural equation modelling [18,19], have been used. Different approaches to evaluation show that it is possible to obtain good quality information in a decision-making process.
Making decisions in real systems requires a rational understanding of the relationship between attributes and eliminating the impact of data representing extreme values. For this purpose, the Heronian mean [20] operator is proposed, which enables the presentation of interconnections between elements and their fusion into a unique utility function. On the other hand, the Power aggregation (PA) operator [21] eliminates the influence of unreasonable arguments taking into account the degree of support between input arguments. Apparently, Heronian and Power aggregators can successfully achieve this goal. In order to unify the common advantages of the Heronian and Power aggregators, in this paper, we propose a new rough Power-Heronian aggregator, which is created by combining the Heronian and Power aggregators. The Power-Heronian aggregator uses all the benefits of the Heronian and Power aggregators. So far, there is no research on how to use the Power-Heronian aggregator for rough number (RN) aggregation. Therefore, the logical aim and motivation for this study is to demonstrate the application of a hybrid Power-Heronian aggregator in a rough environment. In addition, since the use of RNs makes it easier to describe inaccurate information, the need for combining the Heronian and Power aggregators to solve the MCDM problem is imposed.
In addition to the aforementioned motivation for carrying out this research, this paper fills the gap that exists in the literature related to the provision of good quality service for persons with disabilities in rail transport using an integrated model.
According to our findings, this is the first model that is considering this issue and we think that it will significantly help in identifying key parameters in evaluation for providing good quality services for people with disabilities in rail transport.
In addition to the introductory considerations that define the importance and need for the research and its main goals, the paper is structured throughout several sections. In the second section, a literature review is given. The third section presents the steps of the methodology applied. The fourth section presents a case study with the structure and criteria selected for evaluation and with the basic data of respondents. The fifth section provides the results of the research.

2. Literature Review

In Reference [22], the authors emphasize that improved transport enables people with disabilities to live independently. The study describes their perceptions of transport, the existing discrimination they face and the obstacles they meet. It also mentions possible ways of approaching transport to this population. Taking into account the concept of social inclusion of persons with disabilities, it can be seen that it is strongly connected with the use of transport. According to this basic concept, providing a better environment provides more opportunities and a basis for participation in a larger number of activities for all persons with disabilities. The basis for ensuring a better quality of life in urban conditions is recognized to be in transport [23].
In different studies, the needs for both the entire population of persons with disabilities and certain groups with specificities were examined: needs of persons with disabilities [3]; assessment of the basic indicators that determine the problems faced by persons with disabilities in transport [9]; monitoring an accessible and inclusive transport system for evaluation and improvements in public transport [24]; research on mobility factors for persons with disabilities for employment [25]; understanding the barriers faced by persons with disabilities and the way of planning travel by people with disabilities in peak and off-peak hours in traffic [26]; the reasons for selecting certain modes of transport [27]; understanding a general picture, providing information with the possibility of time tracking, involving users and decision-makers in order to improve the accessibility of transport [28]; more complex behavioural analysis, prioritization, prevention and identification of necessary measures with the implementation and improvement of transport for people with disabilities [29]; observation of global parameters in a wider area in order to increase mobility for all [30]; analyses of the realization of health, social, cultural, spatial aspects in interaction with transport and increased mobility [31]; general approach and strategy setting in the analysis of problems in order to achieve and overcome the problems of travel for tourist purposes by persons with disabilities [32].
Improvements to be made to increase social inclusion, the quality of engagement, effective regulations and strategies were identified on the basis of the study of best practice examples in Europe and presented in Reference [33]. Some of the tools identified in this research are the development of new technologies for assessing regulations grouped in three areas: accessibility of public transport, social impact on transport and transport sector. The conclusion is that an inclusive environment provides much better opportunities and a basis for participation in all activities. In order to ensure better quality of life in urban form, transport is also recognized according to Reference [34]. In this sense, improving accessibility for people with disabilities and those with reduced mobility is recognized as a life opportunity. Recognizing the way to contribute to better inclusion of urban transport, a European methodology for measuring accessibility of transport is made [35].
In transport planning, accessibility is not always at the first place [23]. Therefore, offered transport services are unable to satisfy all users due to the existence of certain barriers. In this case, transport can become adapted to person with disabilities only if there is understanding of planning and construction process, which can cause better mobility. When referring to barriers, it can be said that they are various [36]. Today, an increasing number of obstacles also include providing a variety of information related to transport. By following the good solutions applied in practice, an example for contributing to a better society can be given. The basic concept is to give answers that will improve the conditions of rail travel, recognize certain criteria that should be met by people with disabilities in order to provide railway travelling conditions that will be as easy as possible for everyone, regardless of age and type of disability. This research is focused on some challenges in order to identify and understand what opinion can be formed through presented criteria to persuade people with disabilities that there are a lot of benefits of using rail travel. It is hard to take one and only specified criteria just for railway transport and there are general transport requirements to be fulfilled. Taking this into consideration, objective criteria which can be related to railway transport service and people with disabilities are presented in Table 1. Simple observation of problems can start from recognition that some passengers may need additional support at a station or to get on/off the train or they just do not have experience with this type of transport mode.
The approach to improving the customer service with the interaction of decision-makers and service providers is increasingly being regulated by the Public Service Obligation Model. In the paper [37], a new model, in which the main approach is a sustainable public transport system at both a local and regional level, is described.
Different analyses of quality depend on the way of how criteria are observed. Thus, there are studies related to the choices of transport modes; general description of the system; description of the desired quality of the system; description of the desired service quality; comparison of certain groups of users; comparison of the quality of service and users’ satisfaction according to different requirements in different areas looking for the information on how and on which criteria is possible to have influence.
In the paper [38], the criteria based on which users decide on the means of transport choosing between the public bus transport and a mini-bus taxi vehicle are compared and ranked using the Servqual model. The most significant criteria (improvement of the communication system, accuracy, comfort, reduction of travel time) for improving the service provided are presented as the basis for informing decision-makers that it is possible to reduce the number of private car users. To monitor and control the quality of service provided in rail transport using the Servqual model, three dimensions (service products, social responsibility and service provided) are considered to assess the most important factors for providing better service and passenger satisfaction [15]. Also, in this paper in observing three dimensions of service quality (comfort, connection and convenience) for the analysis of rail transport model for assessing Service quality “zones of tolerance” is used and for the identification of the most significant attributes. A service quality analysis (service provided, access, availability, time and environment) and their interconnection with user satisfaction in public bus transport is performed using the Servqual model [39].
For the consideration of potential and existing users of new services regarding high-speed lines, user satisfaction methods applying factor analyses are used [40]. A factor analysis in Reference [41] identifies the components of rail system specifically related only to the service provided on platforms which is very important for local conditions.
The paper uses the EN 13816 standard [14] based on various aspects of the assessment of quality of service provided, which is analysed using the composite indicators and cluster analysis of users’ assessment.
The analysis between different users and how this reflects on the assessment of the most important attributes in rail transport regarding the perception of service quality is carried out in Reference [16] using the methodology based on a classification and regression tree (CART) approach. The analysis of service quality perceptions is conducted by the CART non-parametric method [17] for the analysis of Granada transport system together with the analysis of the socioeconomic characteristics of public transport users. The test is performed in order to determine the most important characteristics and to determine the homogeneity of responses. The study in Reference [42] is carried out to reveal the weaknesses and advantages of changing different modes of transport throughout customer satisfaction with the quality of services using the CART model.
The problem of environmental impact, along with the attractiveness of the public transport of the city of Thessaloniki, is measured using the basic components of service quality by the Exploratory Factor Analysis [43]. The paper highlights the issues of improving the service provided, the frequency and the use of transport.
The assessment of the quality provided in rail transport and its rating is carried out using linguistic variables with the improved PROMETHEE-II method [44]. In Reference [45], a statistical analysis, fuzzy trapezoidal numbers and TOPSIS method is applied and in Reference [46], a fuzzy analytic hierarchy process, trapezoidal fuzzy sets and Choquet integral method for evaluating rail transport and the service quality in the city of Istanbul are used.
The AHP method and the Fuzzy Sets Theory are used to identify the structure of the service quality provided in the city of Palermo [47]. The research identifies limitations in assessing an existing approach in order to propose to regulatory authorities and decision-makers how the interaction between the market and users can be organized in a better way.
The evaluation of the way of behaviour and intentions for loyalty of public transport users of the city of Kaohsiung is carried out throughout the quality of service provided and users’ satisfaction using structural equation modelling [48]. To understand the presence of rail transport and the possibility of replacing passenger cars with it, understanding of customer satisfaction with service quality is performed using structural equation modelling [18]. The evaluation of critical factors for the use of high-speed rail in Taiwan and Korea is carried out throughout the service quality related to their satisfaction and possible loyalty using structural equation modelling [19]. Such an analysis can provide a very good rating among different groups and very good answers to all decision-makers for creating marketing strategies and setting up continuous improvement.
Most of the models used in the quality service analysis can apply to different needs. Some of the representative models observed only for rail traffic at the level of general criteria are shown in Table 2. These models do not only mention disabled people as a group of users but with some criteria adaptation, they can be used for that purpose. The experience from the observed research has been taken into account for the final selection of criteria for the purposes of this work.

3. Methodology

3.1. Full Consistency Method

One of the newer models, based on the principles of pairwise comparison and validation of results through deviation from maximum consistency is the Full consistency method (FUCOM) [49]. FUCOM is a model that to some extent eliminates the stated deficiencies of the BWM and AHP models. Benefits that are determinative for the application of FUCOM are a small number of pairwise comparisons of criteria (only n − 1 comparison), the ability to validate the results by defining the deviation from maximum consistency (DMC) of comparison and appreciating transitivity in pairwise comparisons of criteria. As with other subjective models for determining the weights of criteria (AHP, BWM, etc.), the FUCOM model also has a subjective influence of a decision-maker on the final values of the weights of criteria. This particularly refers to the first and second steps of FUCOM in which decision-makers rank the criteria according to their personal preferences and perform pairwise comparisons of ranked criteria. However, unlike other subjective models, FUCOM has shown minor deviations in the obtained values of the weights of criteria from optimal values [49]. Additionally, the methodological procedure of FUCOM eliminates the problem of redundancy of pairwise comparisons of criteria, which exists in some subjective models for determining the weights of criteria.
Assume that there are n evaluation criteria in a multi-criteria model that are designated as wj, j = 1, 2, …, n and that their weight coefficients need to be determined. Subjective models for determining weights based on pairwise comparison of criteria require a decision-maker to determine the degree of impact of the criterion i on the criterion j. In accordance with the defined settings, the next section (Algorithm 1) presents the FUCOM algorithm [49].
Algorithm 1 FUCOM
Input: Expert pairwise comparison of criteria
Output: Optimal values of the weight coefficients of criteria/sub-criteria
Step 1: Expert ranking of criteria/sub-criteria.
Step 2: Determining the vectors of the comparative significance of evaluation criteria.
Step 3: Defining the restrictions of a non-linear optimization model.
     
Restriction 1:
The ratio of the weight coefficients of criteria is equal to the comparative significance among the observed criteria, i.e., w k / w k + 1 = φ k / ( k + 1 ) .
Restriction 2:
The values of weight coefficients should satisfy the condition of mathematical transitivity, i.e., φ k / ( k + 1 ) φ ( k + 1 ) / ( k + 2 ) = φ k / ( k + 2 ) .

Step 4: Defining a model for determining the final values of the weight coefficients of evaluation criteria:
min χ s . t . | w j ( k ) w j ( k + 1 ) φ k / ( k + 1 ) | χ ,   j | w j ( k ) w j ( k + 2 ) φ k / ( k + 1 ) φ ( k + 1 ) / ( k + 2 ) | χ ,   j j = 1 n w j = 1 w j 0 ,   j
Step 5: Calculating the final values of evaluation criteria/sub-criteria ( w 1 , w 2 , , w n ) T .

3.2. Some Power Heronian Aggregation Operators with Rough Numbers

In group decision-making problems, the priorities are defined based on multiple experts aggregated subjective evaluation. The RNs consist of upper approximation, lower approximation and boundary interval. It has been pointed out that the logic of rough set theory is entirely based on the original data, without the requirement of any additional information. According to Reference [50]. a RN can be defined as follows:
Let Ω be a universe containing all objects and X be a random object from Ω. It is assumed that there exists a set built with k classes representing the DM’s preferences, R = (J1, J2, …, Jk) with condition J1 < J2 < … < Jk. Then, if X Ω ,   J q R , 1 ≤ qk, the lower approximation A p r _ ( J q ) = { X Ω / R ( X ) J q } , upper approximation A p r ¯ ( J q ) = { X Ω / R ( X ) J q } and boundary interval B n d ( J q ) = { X Ω / R ( X ) J q } = { X Ω / R ( X ) > J q } { X Ω / R ( X ) < J q } are determined. An object can be presented with RN defined with lower limit L i m _ ( J q ) and upper limit L i m ¯ ( J q ) as follows:
L i m _ ( J q ) = R ( X ) / M L | X A p r _ ( J q )
L i m ¯ ( J q ) = R ( X ) / M U | X A p r ¯ ( J q )
where ML and MU represent the numbers of objects contained in the lower and upper object approximations of Jq respectively. For object Jq, the rough boundary interval (RBnd(Jq)) presents the interval between upper and lower limits as: R B n d ( J q ) = L i m ¯ ( J q ) L i m _ ( J q ) . The value of rough boundary interval presents a measure of uncertainty. A higher RBnd(Jq) value shows that variations in the experts’ preferences do exist, while a lower value denotes that the experts have harmonized opinions without major deviations in their preferences. Finally, RN(Jq) can be presented using lower and upper limits as:
R N ( J q ) = [ L i m _ ( J q ) , L i m ¯ ( J q ) ]
The power aggregation (PA) operator proposed by [21] is a very significant aggregation operator that eliminates the influence of unreasonable arguments taking into account the degree of support between input arguments. The traditional PA operator is defined in the following section.
Definition 1
([21]). Let ( ξ 1 , ξ 2 , , ξ n ) be a set of non-negative numbers and p,q ≥ 0. If
P A ( ξ 1 , ξ 2 , , ξ n ) = i = 1 n ( 1 + T ( ξ i ) ) ξ i i = 1 n ( 1 + T ( ξ i ) )
where T ( ξ i ) = j = 1 , j i n S u p ( ξ i , ξ j ) . With S u p ( ξ i , ξ j ) we indicate the degree of support that ξ i obtains from ξ j , where S u p ( ξ i , ξ j ) satisfies the following axioms:
S u p ( ξ i , ξ j ) = S u p ( ξ j , ξ i )
S u p ( ξ i , ξ j ) = [ 0 , 1 ]
S u p ( ξ i , ξ j ) > S u p ( ξ i , ξ k ) , i f | ξ i ξ j | < | ξ i ξ k |
ref. [51] has proposed first the Heronian mean (HM) operator, which enables the display and processing of the interrelationship of input arguments [52]. The HM operator is defined in the following section.
Definition 2
([20]). Let p,q ≥ 0, ( ξ 1 , ξ 2 , , ξ n ) be a set of non-negative numbers. If
H M p , q ( ξ 1 , ξ 2 , , ξ n ) = ( 2 n ( n + 1 ) i = 1 n j = i n ξ i p ξ j q ) 1 p + q
then HMp,q is called the Heronian mean (HM) operator.
Based on the settings defined, traditional PA and HM operators, Equations (1) and (2), in the following section, a hybrid rough power Heronian aggregation (RPHA) operator is developed.
Definition 3.
Set ξ i = [ L i m _ ( ξ i ) , L i m ¯ ( ξ i ) ] (i = 1, 2, …, n) as a collection of RNs in Ψ , then RPHA can be defined as follows:
R P H A p , q ( ξ 1 , ξ 2 , , ξ n ) = ( 2 n ( n + 1 ) i = 1 n j = i n ( n ( 1 + T ( ξ i ) ) t = 1 n ( 1 + T ( ξ t ) ) ξ i ) p ( n ( 1 + T ( ξ j ) ) t = 1 n ( 1 + T ( ξ t ) ) ξ j ) q ) 1 p + q
where T ( ξ i ) = j = 1 , j i n S u p ( ξ i , ξ j ) . With S u p ( ξ i , ξ j ) we indicate the degree of support that ξ i obtains from ξ j , where S u p ( ξ i , ξ j ) satisfies the following three axioms:
S u p ( ξ i , ξ j ) = S u p ( ξ j , ξ i )
S u p ( ξ i , ξ j ) = [ 0 , 1 ]
S u p ( ξ i , ξ j ) > S u p ( ξ i , ξ k ) , i f d ( ξ i , ξ j ) < d ( ξ i , ξ k )
where d ( ξ i , ξ j ) represents the distance between the rough numbers ξ i and ξ j .
Then RPHAp,q represents a rough power Heronian aggregation (RPHA) operator. RPHA combines the benefits of PA and HM operators and is a powerful tool with the following features: (1) it eliminates the impact of unreasonable arguments; (2) it takes into account the degree of support between the input arguments; and (3) it takes into account the interrelationship of input arguments.
Theorem 1.
Set ξ i = [ L i m _ ( ξ i ) , L i m ¯ ( ξ i ) ] as a collection of RNs in Ψ , then according to Equation (3), the aggregation results are obtained for RNs and the following aggregation formula can be developed:
R P H A p , q ( ξ 1 , ξ 2 , , ξ n ) = ( 2 n ( n + 1 ) i = 1 n j = i n ( n ( 1 + T ( ξ i ) ) t = 1 n ( 1 + T ( ξ t ) ) ξ i ) p ( n ( 1 + T ( ξ j ) ) t = 1 n ( 1 + T ( ξ t ) ) ξ j ) q ) 1 p + q = [ ( 2 n ( n + 1 ) i = 1 n j = i n ( n ( 1 + L i m _ ( T ( ξ i ) ) ) t = 1 n ( 1 + L i m _ ( T ( ξ t ) ) ) L i m _ ( ξ i ) ) p ( n ( 1 + L i m _ ( T ( ξ j ) ) ) t = 1 n ( 1 + L i m _ ( T ( ξ t ) ) ) L i m _ ( ξ j ) ) q ) 1 p + q , ( 2 n ( n + 1 ) i = 1 n j = i n ( n ( 1 + L i m ¯ ( T ( ξ i ) ) ) t = 1 n ( 1 + L i m ¯ ( T ( ξ t ) ) ) L i m ¯ ( ξ i ) ) p ( n ( 1 + L i m ¯ ( T ( ξ j ) ) ) t = 1 n ( 1 + L i m ¯ ( T ( ξ t ) ) ) L i m ¯ ( ξ j ) ) q ) 1 p + q ]
Proof. 
By the operational rules of RNs defined in Reference [50] we have
(a)
( n ( 1 + T ( ξ i ) ) t = 1 n ( 1 + T ( ξ t ) ) ξ i ) p = [ ( n ( 1 + L i m _ ( T ( ξ i ) ) ) t = 1 n ( 1 + L i m _ ( T ( ξ t ) ) ) L i m _ ( ξ i ) ) p , ( n ( 1 + L i m ¯ ( T ( ξ i ) ) ) t = 1 n ( 1 + L i m ¯ ( T ( ξ t ) ) ) L i m ¯ ( ξ i ) ) p ]
(b)
( n ( 1 + T ( ξ j ) ) t = 1 n ( 1 + T ( ξ t ) ) ξ j ) q = [ ( n ( 1 + L i m _ ( T ( ξ j ) ) ) t = 1 n ( 1 + L i m _ ( T ( ξ t ) ) ) L i m _ ( ξ j ) ) q , ( n ( 1 + L i m ¯ ( T ( ξ j ) ) ) t = 1 n ( 1 + L i m ¯ ( T ( ξ t ) ) ) L i m ¯ ( ξ j ) ) q ]
(c)
( n ( 1 + T ( ξ i ) ) t = 1 n ( 1 + T ( ξ t ) ) ξ i ) p ( n ( 1 + T ( ξ j ) ) t = 1 n ( 1 + T ( ξ t ) ) ξ j ) q = [ ( n ( 1 + L i m _ ( T ( ξ i ) ) ) t = 1 n ( 1 + L i m _ ( T ( ξ t ) ) ) L i m _ ( ξ i ) ) p ( n ( 1 + L i m _ ( T ( ξ j ) ) ) t = 1 n ( 1 + L i m _ ( T ( ξ t ) ) ) L i m _ ( ξ j ) ) q , ( n ( 1 + L i m ¯ ( T ( ξ i ) ) ) t = 1 n ( 1 + L i m ¯ ( T ( ξ t ) ) ) L i m ¯ ( ξ i ) ) p ( n ( 1 + L i m ¯ ( T ( ξ j ) ) ) t = 1 n ( 1 + L i m ¯ ( T ( ξ t ) ) ) L i m ¯ ( ξ j ) ) q ]
(d)
( 2 n ( n + 1 ) i = 1 n j = i n ( n ( 1 + T ( ξ i ) ) t = 1 n ( 1 + T ( ξ t ) ) ξ i ) p ( n ( 1 + T ( ξ j ) ) t = 1 n ( 1 + T ( ξ t ) ) ξ j ) q ) 1 p + q = [ ( 2 n ( n + 1 ) i = 1 n j = i n ( n ( 1 + L i m _ ( T ( ξ i ) ) ) t = 1 n ( 1 + L i m _ ( T ( ξ t ) ) ) L i m _ ( ξ i ) ) p ( n ( 1 + L i m _ ( T ( ξ j ) ) ) t = 1 n ( 1 + L i m _ ( T ( ξ t ) ) ) L i m _ ( ξ j ) ) q ) 1 p + q , ( 2 n ( n + 1 ) i = 1 n j = i n ( n ( 1 + L i m ¯ ( T ( ξ i ) ) ) t = 1 n ( 1 + L i m ¯ ( T ( ξ t ) ) ) L i m ¯ ( ξ i ) ) p ( n ( 1 + L i m ¯ ( T ( ξ j ) ) ) t = 1 n ( 1 + L i m ¯ ( T ( ξ t ) ) ) L i m ¯ ( ξ j ) ) q ) 1 p + q ]
So, Theorem 1 is true. □
Theorem 2.
(Idempotency): Set ξ i = [ L i m _ ( ξ i ) , L i m ¯ ( ξ i ) ] as a collection of RNs in Ψ , if ξ i = ξ , then R P H A p , q ( ξ 1 , ξ 2 , , ξ n ) = R P H A p , q ( ξ , ξ , , ξ ) .
Proof. 
Since ξ i = ξ , that is, L i m _ ( ξ i ) = L i m _ ( ξ ) , L i m ¯ ( ξ i ) = L i m ¯ ( ξ ) , then
R P H A p , q ( R N ( ξ 1 ) , R N ( ξ 2 ) , , R N ( ξ n ) ) = R P H A p , q ( R N ( ξ ) , R N ( ξ ) , , R N ( ξ ) ) = [ ( 2 n ( n + 1 ) i = 1 n j = i n ( n ( 1 + L i m _ ( T ( ξ i ) ) ) t = 1 n ( 1 + L i m _ ( T ( ξ t ) ) ) L i m _ ( ξ i ) ) p ( n ( 1 + L i m _ ( T ( ξ j ) ) ) t = 1 n ( 1 + L i m _ ( T ( ξ t ) ) ) L i m _ ( ξ j ) ) q ) 1 p + q , ( 2 n ( n + 1 ) i = 1 n j = i n ( n ( 1 + L i m ¯ ( T ( ξ i ) ) ) t = 1 n ( 1 + L i m ¯ ( T ( ξ t ) ) ) L i m ¯ ( ξ i ) ) p ( n ( 1 + L i m ¯ ( T ( ξ j ) ) ) t = 1 n ( 1 + L i m ¯ ( T ( ξ t ) ) ) L i m ¯ ( ξ j ) ) q ) 1 p + q ] = [ ( 2 n ( n + 1 ) i = 1 n j = i n ( n ( 1 + L i m _ ( T ( ξ ) ) ) t = 1 n ( 1 + L i m _ ( T ( ξ ) ) ) L i m _ ( ξ ) ) p ( n ( 1 + L i m _ ( T ( ξ ) ) ) t = 1 n ( 1 + L i m _ ( T ( ξ t ) ) ) L i m _ ( ξ ) ) q ) 1 p + q , ( 2 n ( n + 1 ) i = 1 n j = i n ( n ( 1 + L i m ¯ ( T ( ξ ) ) ) t = 1 n ( 1 + L i m ¯ ( T ( ξ t ) ) ) L i m ¯ ( ξ ) ) p ( n ( 1 + L i m ¯ ( T ( ξ ) ) ) t = 1 n ( 1 + L i m ¯ ( T ( ξ t ) ) ) L i m ¯ ( ξ ) ) q ) 1 p + q ] = [ ( 2 n ( n + 1 ) i = 1 n j = i n ( n 1 n L i m _ ( ξ ) ) p ( n 1 n L i m _ ( ξ ) ) q ) 1 p + q , ( 2 n ( n + 1 ) i = 1 n j = i n ( n 1 n L i m ¯ ( ξ ) ) p ( n 1 n L i m ¯ ( ξ ) ) q ) 1 p + q ] = [ ( 2 n ( n + 1 ) i = 1 n j = i n ( L i m _ ( ξ ) ) p + q ) 1 p + q , ( 2 n ( n + 1 ) i = 1 n j = i n ( L i m ¯ ( ξ ) ) p + q ) 1 p + q ] = ξ
The proof of Theorem 2 is completed. □
Theorem 3.
(Boundedness): Set ξ i = [ L i m _ ( ξ i ) , L i m ¯ ( ξ i ) ] as a collection of RNs in Ψ , let ξ = [ min L i m _ ( ξ i ) , min L i m ¯ ( ξ i ) ] and ξ + = [ max L i m _ ( ξ i ) , max L i m ¯ ( ξ i ) ] , then
ξ R P H A p , q ( ξ 1 , ξ 2 , , ξ n ) ξ + .
Proof. 
Let ξ = min ( ξ 1 , ξ 2 , , ξ n ) = [ min L i m _ ( ξ i ) , min L i m ¯ ( ξ i ) ] and ξ + = max ( ξ 1 , ξ 2 , , ξ n ) = [ max L i m _ ( ξ i ) , max L i m ¯ ( ξ i ) ] . Then, it can be stated that L i m _ ( ξ ) = min i ( L i m _ ( ξ i ) ) , L i m ¯ ( ξ ) = min i ( L i m ¯ ( ξ i ) ) , L i m _ ( ξ + ) = max i ( L i m _ ( ξ i ) ) and L i m ¯ ( ξ + ) = max i ( L i m ¯ ( ξ i ) ) . Based on that, the following inequalities can be formulated:
ξ ξ i ξ + ; min i ( L i m _ ( ξ i ) L i m _ ( ξ i ) max i ( L i m _ ( ξ i ) ) ; min i ( L i m ¯ ( ξ i ) ) L i m ¯ ( ξ i ) max i ( L i m ¯ ( ξ i ) ) .
According to the inequalities shown above, it can be concluded that ξ R P H A p , q ( ξ 1 , ξ 2 , , ξ n ) ξ + holds. □
Theorem 4.
(Commutativity): Let the rough set ( ξ 1 , ξ 2 , , ξ n ) be any permutation of ( ξ 1 , ξ 2 , , ξ n ) . Then R P H A p , q ( ξ 1 , ξ 2 , , ξ n ) = R P H A p , q ( ξ 1 , ξ 2 , , ξ n ) .
Proof. 
This property is obvious. □
Primer 1. Let ξ 1 [ 3 , 5 ] , ξ 2 [ 4 , 7 ] and ξ 3 [ 3 , 4 ] be three rough numbers and let p = q = 1, then applying RPHA we obtain an aggregated rough number ξ ¯ = [ L i m _ ( ξ ¯ ) , L i m ¯ ( ξ ¯ ) ] using the following calculations:
Step 1: For the upper and lower limit of a rough number, the normalized functions of the lower and upper limits of rough numbers are calculated:
f ( L i m _ ( ξ 1 ) ) = 3 3 + 4 + 3 = 0.300 , f ( L i m _ ( ξ 2 ) ) = 4 3 + 4 + 3 = 0.400 , f ( L i m _ ( ξ 3 ) ) = 3 3 + 4 + 3 = 0.300 , f ( L i m ¯ ( ξ 1 ) ) = 5 5 + 7 + 4 = 0.313 ; f ( L i m ¯ ( ξ 2 ) ) = 7 5 + 7 + 4 = 0.438 , f ( L i m ¯ ( ξ 3 ) ) = 4 5 + 7 + 4 = 0.250 .
Step 2: Calculating the degree of support of the upper and lower limits of rough numbers:
S u p ( L i m _ ( ξ 1 ) , L i m _ ( ξ 2 ) ) = 0.1 , S u p ( L i m _ ( ξ 1 ) , L i m _ ( ξ 3 ) ) = 0.0 , S u p ( L i m _ ( ξ 2 ) , L i m _ ( ξ 3 ) ) = 0.1 , S u p ( L i m ¯ ( ξ 1 ) , L i m ¯ ( ξ 2 ) ) = 0.125 , S u p ( L i m ¯ ( ξ 1 ) , L i m ¯ ( ξ 3 ) ) = 0.063 and S u p ( L i m ¯ ( ξ 2 ) , L i m ¯ ( ξ 3 ) ) = 0.188 .
Step 3: By applying Expression (4), RPHA1,1 is calculated:
R P H A 1 , 1 ( [ 3 , 5 ] ; [ 4 , 7 ] ; [ 3 , 4 ] ) = = [ ( 2 3 ( 3 + 1 ) { ( 3 0.1 3 + 0.1 + 0.2 + 0.1 3 ) 1 ( 3 0.1 3 + 0.1 + 0.2 + 0.1 3 ) 1 + ( 3 0.1 3 + 0.1 + 0.2 + 0.1 3 ) 1 ( 3 0.2 3 + 0.1 + 0.2 + 0.1 4 ) 1 + ( 3 0.1 3 + 0.1 + 0.2 + 0.1 3 ) 1 ( 3 0.1 3 + 0.1 + 0.2 + 0.1 3 ) 1 + ( 3 0.2 3 + 0.1 + 0.2 + 0.1 4 ) 1 ( 3 0.2 3 + 0.1 + 0.2 + 0.1 4 ) 1 + ( 3 0.2 3 + 0.1 + 0.2 + 0.1 4 ) 1 ( 3 0.1 3 + 0.1 + 0.2 + 0.1 3 ) 1 + ( 3 0.1 3 + 0.1 + 0.2 + 0.1 3 ) 1 ( 3 0.1 3 + 0.1 + 0.2 + 0.1 3 ) 1 } ) 1 1 + 1 , ( 2 3 ( 3 + 1 ) { ( 3 0.188 3 + 0.188 + 0.313 + 0.25 5 ) 1 ( 3 0.188 3 + 0.188 + 0.313 + 0.25 5 ) 1 + ( 3 0.188 3 + 0.188 + 0.313 + 0.25 5 ) 1 ( 3 0.313 3 + 0.188 + 0.313 + 0.25 7 ) 1 + ( 3 0.188 3 + 0.188 + 0.313 + 0.25 5 ) 1 ( 3 0.25 3 + 0.188 + 0.313 + 0.25 4 ) 1 + ( 3 0.313 3 + 0.188 + 0.313 + 0.25 7 ) 1 ( 3 0.313 3 + 0.188 + 0.313 + 0.25 7 ) 1 + ( 3 0.313 3 + 0.188 + 0.313 + 0.25 7 ) 1 ( 3 0.25 3 + 0.188 + 0.313 + 0.25 4 ) 1 + ( 3 0.25 3 + 0.188 + 0.313 + 0.25 4 ) 1 ( 3 0.25 3 + 0.188 + 0.313 + 0.25 4 ) 1 } ) 1 1 + 1 ] = [ 3.367 , 5.414 ]
In the following section, specific cases of RPHAp,q operator are shown.
(a) If p , q = 1 , then the RPHAp,q operator (Expression (4)) transforms into a rough number neutrosophic number power line Heronian operator as follows:
R P H A 1 , 1 ( ξ 1 , ξ 2 , , ξ n ) = = [ ( 2 n ( n + 1 ) i = 1 n j = i n ( n ( 1 + L i m _ ( T ( ξ i ) ) ) t = 1 n ( 1 + L i m _ ( T ( ξ t ) ) ) L i m _ ( ξ i ) ) ( n ( 1 + L i m _ ( T ( ξ j ) ) ) t = 1 n ( 1 + L i m _ ( T ( ξ t ) ) ) L i m _ ( ξ j ) ) ) 1 2 , ( 2 n ( n + 1 ) i = 1 n j = i n ( n ( 1 + L i m ¯ ( T ( ξ i ) ) ) t = 1 n ( 1 + L i m ¯ ( T ( ξ t ) ) ) L i m ¯ ( ξ i ) ) ( n ( 1 + L i m ¯ ( T ( ξ j ) ) ) t = 1 n ( 1 + L i m ¯ ( T ( ξ t ) ) ) L i m ¯ ( ξ j ) ) ) 1 2 ]
(b) If p , q = 1 / 2 , then the RPHAp,q operator (Expression (4)) transforms into a rough number power basic Heronian operator as follows:
R P H A 1 2 , 1 2 ( ξ 1 , ξ 2 , , ξ n ) = = [ ( 2 n ( n + 1 ) i = 1 n j = i n ( n ( 1 + L i m _ ( T ( ξ i ) ) ) t = 1 n ( 1 + L i m _ ( T ( ξ t ) ) ) L i m _ ( ξ i ) ) 1 2 ( n ( 1 + L i m _ ( T ( ξ j ) ) ) t = 1 n ( 1 + L i m _ ( T ( ξ t ) ) ) L i m _ ( ξ j ) ) 1 2 ) , ( 2 n ( n + 1 ) i = 1 n j = i n ( n ( 1 + L i m ¯ ( T ( ξ i ) ) ) t = 1 n ( 1 + L i m ¯ ( T ( ξ t ) ) ) L i m ¯ ( ξ i ) ) 1 2 ( n ( 1 + L i m ¯ ( T ( ξ j ) ) ) t = 1 n ( 1 + L i m ¯ ( T ( ξ t ) ) ) L i m ¯ ( ξ j ) ) 1 2 ) ]
(c) If p = 0 , then the RPHAp,q operator (Expression (4)) transforms into a rough number power generalized linear ascending weight operator as follows:
R P H A 0 , q ( ξ 1 , ξ 2 , , ξ n ) = = [ ( 2 n ( n + 1 ) i = 1 , j = i n ( n ( 1 + L i m _ ( T ( ξ j ) ) ) t = 1 n ( 1 + L i m _ ( T ( ξ t ) ) ) L i m _ ( ξ j ) ) q ) 1 q , ( 2 n ( n + 1 ) i = 1 , j = i n ( n ( 1 + L i m ¯ ( T ( ξ j ) ) ) t = 1 n ( 1 + L i m ¯ ( T ( ξ t ) ) ) L i m ¯ ( ξ j ) ) q ) 1 q ]
(d) If q = 0 , then the RPHAp,q operator (Expression (4)) transforms into a rough number power generalized linear descending weight operator as follows:
R P H A p , 0 ( ξ 1 , ξ 2 , , ξ n ) = = [ ( 2 n ( n + 1 ) i = 1 n ( n ( 1 + L i m _ ( T ( ξ i ) ) ) t = 1 n ( 1 + L i m _ ( T ( ξ t ) ) ) L i m _ ( ξ i ) ) p ) 1 p , ( 2 n ( n + 1 ) i = 1 n ( n ( 1 + L i m ¯ ( T ( ξ i ) ) ) t = 1 n ( 1 + L i m ¯ ( T ( ξ t ) ) ) L i m ¯ ( ξ i ) ) p ) 1 p ]

4. Case Study

4.1. Basic Structure of Survey

For the purposes of this research, a survey, which included 99 respondents from the most of representative associations of persons with disabilities in the entire territory of the Republic of Serbia, was conducted. Out of the total number, 31 relevant experts, persons with disabilities, were selected. The physical data collection of a large number of respondents in one place is almost unfeasible. All questionnaires were submitted to associations, which were later sent by e-mail or the respondents were called in person. This type of communication must have been conducted primarily for the purpose of respecting the rights in relation to providing personal data prescribed by legal provisions on the protection of citizens. The research involved persons with the following disabilities: multiple sclerosis, muscular dystrophy, cerebral palsy and polio, paraplegia, hearing impaired persons and deaf people, impaired vision persons and blind people and people with intellectual disabilities. The surveyed population covered urban and rural areas on the territory of the Republic of Serbia. The study was conducted in the period from September 2017 to April 2019. Although the period of data collection is relatively long, the number of received responses in questionnaires is very satisfactory since this population due to the circumstances is not sufficiently available. Data collection was carried out in two phases. In the first phase, the correction of given formulations was made with a smaller number of respondents and then the questionnaire thus adapted was forwarded to other respondents. The structure of the questionnaire was divided into two sections. The first section provided the criteria describing the quality of service and the second section presented the socioeconomic characteristics of the respondents.

4.2. Service Quality Criteria

Because of the non-existent universal criteria of the service quality of public transport and especially for persons with disabilities in the territory of the Republic of Serbia, the standard EN 13816 [14] is used as the basis. The criteria of this standard are supplemented with a review of literature of similar research on the quality of service, classified into different groups and research on the specificities related to persons with disabilities, Table 3. Some data have also been taken over from research or studies where user satisfaction assessment was only performed through the observed concepts or the necessary equipment for improving the use of rail transport and then these data have been converted into criteria. For the purposes of the research in this paper, the criteria are divided into eight main groups showing different aspects of the service provided: (1) Availability, (2) Information (3) Accessibility, (4) Time, (5) Custom care, (6) Comfort, (7) Security and (8) Environmental impact. The main groups are subdivided into subgroups and criteria. There are no subgroups for some main groups. By the insight into additional literature, the main criteria are supplemented, Table 1 and subgroups and all criteria are defined in tables in Appendix A.
As this analysis considers people with disabilities and their opinion, special attention is focused on establishing general criteria that describe their needs, whether regarding problems related to accessibility, way of displaying information, specific needs referring to care for passengers or necessary comfort. Taking into account their needs, a description of necessary criteria is more or less taken for other main criteria, which define their basic needs.

4.3. Sample Characteristics

The general characteristics are shown in Table 4. The survey includes more male population with 61.3%. By percentage, the number of respondents by age up to 30 years is 32.3%, from 30 to 40 years is 16.1%, from 40 to 50 years is 22.6% and over 50 years is 29%. On the territory of the Republic of Serbia, this population is very financially dependent on others, so that according to the data it can be seen that only 22.6% are employed and 77.4% have financial assistance for care and pension. Regarding mobility, the majority of respondents are wheelchair users 42%, people with walking difficulties or needing assistance 32.4% and self-moving persons 25.8%. If data on sensory damage are observed, 67.7% or respondents do not have any, while 16.1% have visual impairment and 16.1% have combined impairment. In addition, 29.1% of the respondents have speech problems while others do not.

5. Results

5.1. Main Principles for the Analysis of Criteria

The analysis of criteria is based on the selection of the most important criteria of each group/subgroup. This approach has been established in order to obtain a general picture of the way of thinking and needs of general population of persons with disabilities. In total, there are eight main groups with their subgroups. A planned selection of criteria for each subgroup will provide a final list of criteria, based on the perception of the decision maker. This form will respond to what needs to be done when organizing the infrastructure, vehicles and services provided. The number of criteria considered under subgroups is 147. Thus, the total number together with the main group is 155 criteria observed for assessment.
The main group Availability has three subgroups, with a total of 22 criteria, the number of which by subgroups is as follows: Frequency and punctuality has 7 criteria, Mode of transport, network and infrastructure has 8 criteria and Passenger facilities and working hours has 7 criteria.
The main group Accessibility has four subgroups with a total of 29 criteria, the number of which by subgroups is as follows: Access for disabled public transport has 8 criteria, Communication, Colour, Contrast has 7 criteria, Corridors, free routes and paths has 7 criteria and Ticket office and machines has 7 criteria.
The main group Information has three subgroups, with a total of 22 criteria, the number of which by subgroups is as follows: Ticket office and machines has 8 criteria, Facilities has 7 criteria, Understandable has 7 criteria.
The main group Time does not have subgroups and contains 7 criteria.
The main group Custom care has five subgroups, with a total of 37 criteria, the number of which by subgroups is as follows: Assistance has 7 criteria, Service has 7 criteria, Staff has 7 criteria, Ticket has 7 criteria and Cleanliness and maintenance has 9 criteria.
The main group Comfort has two subgroups, with a total of 14 criteria, the number of which by subgroups is as follows: Ambient has 7 criteria and Comfortable has 7 criteria.
The main group Security does not have subgroups and contains 9 criteria.
The main group Environmental impact does not have subgroups and contains 7 criteria.
In order to establish the basic form for assessing, the idea of this paper is to evaluate the main groups by importance and to select one criterion in each subgroup from Figure 1. Therefore, the aim is to obtain a total of 20 approximately equal criteria presented in subgroups. By this approach, it is thought that the rating of the service quality provided for all persons with disabilities will be achieved, since by these mutual responses it is possible to obtain equal importance.
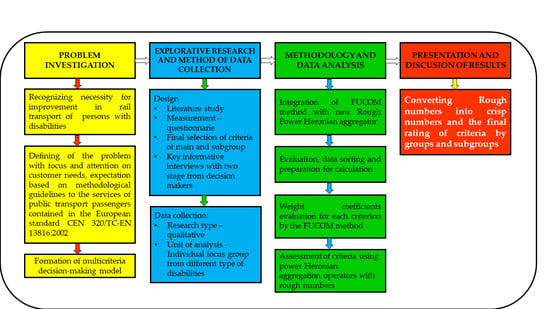
The calculation has started from the following steps:
  • The main groups are formed,
  • The subgroups are formed,
  • The criteria are formed,
  • The assessment of the main groups is carried out by their importance from 1 to 8,
  • The subgroups are considered as equal,
  • The criteria are evaluated by importance in relation to the number of criteria in a subgroup. The minimum number of criteria in a group is 7 and the largest number is 9. Analogously to the evaluation of the main group, the criteria are evaluated by importance from 1 to 7, from 1 to 8 and from 1 to 9,
  • The weight coefficients are evaluated by main groups and subgroups for each criterion by the FUCOM method,
  • The criteria are assessed using power Heronian aggregation operators with rough numbers,
  • Rough numbers are converted into crisp numbers and the final rating of criteria by groups and subgroups is obtained.

5.2. Calculation of the Coefficient Weight Values with FUCOM Method

The respondents evaluated the criteria in two steps and the calculation of the weight criteria was carried out in three steps.
The ratings of basic criteria were presented as an example of calculation. The respondent No. 31 did not evaluate the main criteria.
A detailed overview of determining weight coefficients of the first-level criteria is provided in the following section.
Step 1. In the first step, the decision makers ranked the criteria:
Basic Criteria (BC1)-first respondent: C3 > C7 > C2 > C4 > C5 > C6 > C1 > C8;
Step 2. In the second step, the decision makers compared in pairs the ranked criteria from the step 1. The comparison is made according to the first-ranked criterion, based on the scale [1,8]. This is how the importance of the criteria is obtained ( ϖ C j ( k ) ) for all the criteria ranked in the step 1 (Table 5).
Based on the obtained importance of criteria are calculated comparative importance values of criteria for every respondent:
DM 1 :   φ C 3 / C 7 = 1 1 = 1 ,   φ C 7 / C 2 = 1 1.5 = 0.7 ,   φ C 2 / C 4 = 1.5 1.5 = 1 ,   φ C 4 / C 5 = 1.5 1.5 = 1 , φ C 6 / C 1 = 1.5 2 = 0.7 ,   φ C 1 / C 8 = 2 2 = 1
Step 3. Final values of weight coefficient should satisfy two conditions:
(1) Final values of weight coefficient should satisfy the condition where:
DM 1 :   w 3 / w 7 = 1 ,   w 7 / w 2 = 0.7 ,   w 2 / w 4 = 1 ;   w 4 / w 5 = 1 ,   w 5 / w 6 = 1 ,   w 6 / w 1 = 0.7 ,   w 1 / w 8 = 1
(2) In addition to the defined relations, final values of weight coefficients should also satisfy the condition of mathematical transitivity, respectively
w 3 / w 7 = 1 0.7 = 0.7 ,   w 7 / w 4 = 0.7 1 = 0.7 ,   w 2 / w 5 = 1 1 = 1 ,
w 4 / w 6 = 1 1 = 1 ,   w 5 / w 1 = 1 0.7 = 0.7 ,   w 6 / w 8 = 0.7 1 = 0.7 .
By applying the equations from fourth and fifth step of FUCOM method can be defined the models for determining weight coefficients of the first-level criteria for every decision maker:
B C 1   ( F i r s t   l e v e l ) min χ s . t . | w 3 w 7 1 | = χ ,   | w 7 w 2 0.7 | = χ ,   | w 2 w 4 1 | = χ ,   | w 4 w 5 1 | = χ ,   | w 5 w 6 1 | = χ ,   | w 6 w 1 0.7 | = χ ,   | w 1 w 8 1 | = χ , | w 3 w 2 0.7 | , | w 7 w 4 0.7 | ,   | w 2 w 5 1 | ,   | w 4 w 6 1 | ,   | w 5 w 1 0.7 | ,   | w 6 w 8 0.7 | j = 1 8 w j = 1 ,   w j 0 , j
By solving the models presented, the values of weight coefficients of the first-level criteria for every decision-maker (DM) are obtained as shown in Table 6. For the first decision-maker for whom the example of calculation is presented above, the following values of the criteria are obtained: C1 = 0.088, C2 = 0.118, C3 = 0.176, C4 = 0.118, C5 = 0.118, C6 = 0.118, C7 = 0.176, C8 = 0.08. To confirm the reliability of the obtained weight criteria, the DFC value (deviation from maximum consistency) is used. The DFC value represents the deviation of the obtained values of weight coefficients from the maximum consistency. The optimal values of weight coefficients are obtained when the maximum consistency condition is satisfied, that is, when DFC is zero, that is, χ = 0.00.

5.3. Evaluation Criteria Using Power Heronian Aggregation Operators with Rough Numbers

First, the transformation of an individual into a group rough matrix is completed, Table 7, as follows:
c ˜ 1 L i m _ ( 0.088 ) = 1 3 ( 0.088 + 0.077 + 0.048 ) = 0.070
L i m _ ( 0.088 ) = 1 28 ( 0.088 + 0.150 + 0.232 + 0.216 + 0.122 + 0.128 + 0.182 + 0.172 + 0.172 + 0.182 + 0.184 + 0.182 + 0.194 + 0.136 + 0.273 + 0.125 + 0.158 + 0.164 + 0.225 + 0.206 + 0.158 + 0.151 + 0.149 + 0.214 + 0.193 + 0.095 + 0.206 + 0.184 ) = 0.170
R N ( c 1 1 ) = [ 0.070 , 0.170 ] ;

5.4. Final Results and Discusion

The final evaluation of the criteria is presented in two tables. Table 8 shows the estimates of the main groups by importance and in Table 9, the estimates of 21 most important criteria by the subgroups are presented. For the purpose of analysis and comparability of the evaluation of the most important criteria, the Power Rough Heronian Values are converted into Crisp values. Although the aim was to identify the 20 main criteria, due to the same estimate, in the main group Custom Care and the subgroup Cleanliness and Maintenance, two the most important criteria, were presented.
According to decision-makers, Accessibility is the most important criterion for people with disabilities. Taking into account that these are people with disabilities and knowing that their main problem is accessibility (0.164) to infrastructure facilities and vehicles, the selection of this main criterion indicates the current situation. Availability is estimated (0.159) as the second criterion the third criterion is Security (0.145), which shows a poor state of how people with disabilities feel in transport. The following ranked criterion is Time. Customer care and information are ranked as equally important. The worst ranking criteria is Comfort and Environmental impact.
The results in Table 8 and Table 9 indicate the weakest points that must be solved first so that rail passenger traffic becomes more attractive for people with disabilities. Pointing to the accessibility problem in Table 8, it can be seen that people with disabilities are not able to use the railways equally as other passengers. Table 9 presents a value description for each selected most significant criterion in groups and subgroups.
The sub-criteria values from Table 9 are described below. An overview of the most important criteria and a short comment were made in relation to the current services provided for people with disabilities.

5.4.1. Accessibility

In the subgroup Access for disabled public transport, the criterion Ramps are adopted with adequate slope (0.177) was selected. Other criteria were evaluated with less importance. The selection of this criterion tells us that the railway stations are very inaccessible.
In the subgroup Communication, Colour, Contrast, the criterion Obstacle free accessibility to all media (0.183) was selected. As in the Access criterion, it can be seen that information is not, in most cases, accessible to people with disabilities. In the sub criterion Corridors, free routes and paths, the criterion Accessibility input/output equipment in stations or stops (0.172) was selected. As an approximately similar criterion, Barrier free path from parking places (0.166) was selected. This selection shows that the area around railway stations is not adapted or accessible to people with disabilities. In the subgroup Ticket office and machines, the criterion Accessibility of tickets sales points (0.194) was selected. At railway stations, it is noticed that the ticket sale points are not adapted since they do not have sufficient height or do not have adequate communication equipment. In Figure 2, all other criteria according to their importance are shown by subgroups.

5.4.2. Availability

In the Frequency and punctuality subgroup, Punctuality of public transport to intercity bus and railway stations (0.165) was selected as the most important criterion. By approximately similar importance, the Frequency of public transport to bus or train station (0.164) and Accuracy of intercity buses or trains (0.163) criteria were determined. The first ranking criterion tells us that the arrival of people with disabilities to intercity stations is generally not achievable at all as well as to other users because this transport is not performed on a regular basis.
In the Mode of transport, network and infrastructure subgroup, Availability of seats on train/bus (0.148) was selected as the most important criterion. By approximately similar importance, Availability of other modes of transport (0.144), Ease of access to the interchange (0.142) were selected. The lack of sufficient number of seats for people with disabilities shows that there is still not enough financial resources, as well as general awareness to find a solution to solve this problem. Observing the other most important criteria, it can be seen that they are also not well approached by all aspects.
In the Passenger facilities and working hours subgroup, the criterion Availability of schedule information by phone/mail (0.172) was selected. By an approximately similar value, the criterion Availability of telephone signals and Wi-Fi (0.168) was selected. In this sub criterion, it is noticed that there are not enough new modern ways of delivering information. In addition to their disabilities, people with disabilities are not limited in applying new technologies but in this case, it can be seen that it does not apply enough to transport in Serbia. In Figure 3, all other criteria according to their importance are shown by subgroups.
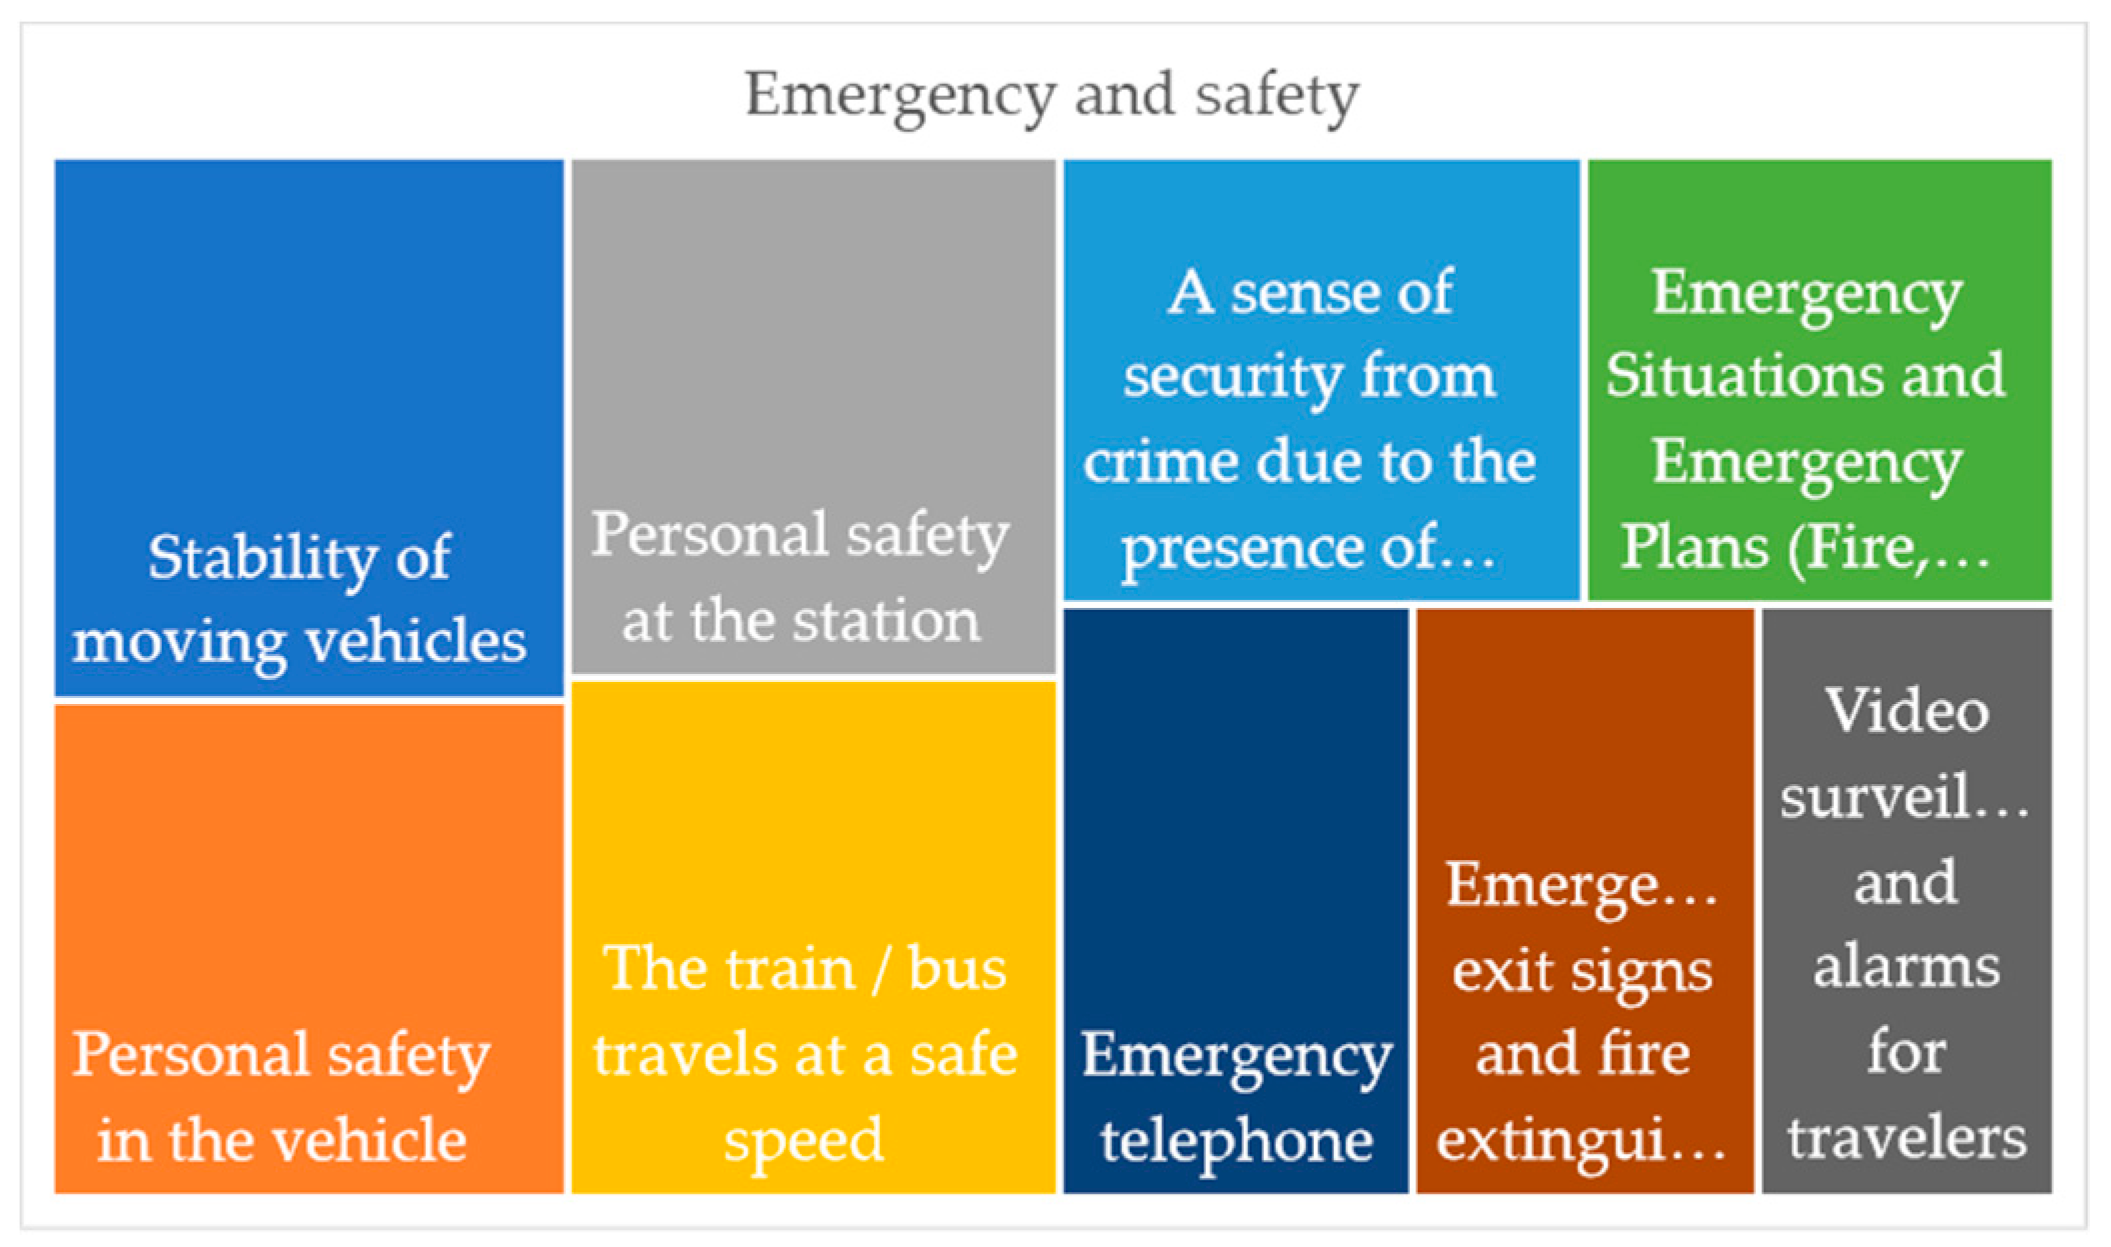
5.4.3. Security

In the Emergency and safety subgroup, the criterion Stability of moving vehicles (0.138) was selected. If a vehicle is not equipped with a separate space, a seat or equipment adapted for people with disabilities, the estimate of this criterion is clear, which tells us that there is a significant number of unsuitable vehicles. Figure 4 shows all other criteria in terms of their significance.

5.4.4. Time

In the Time group, only the main group was observed. The most important criterion was Travel time information in abnormal conditions (disruption, delay, eviction, …) (0.164). The following approximately similar criterion was Length of the actual travel time in the vehicle (0.161). The selection of the most important criterion tells that people with disabilities have most problems in emergencies since then new unplanned transport due to their specificity and requirements can be very difficult. Figure 5 shows all other criteria in terms of their importance.

5.4.5. Custom Care

In the Assistance subgroup, the criterion Assistance to/from connecting services (arrival, departure, buying tickets, moving) (0.172) was selected. This tells us that the existing way of serving people with disabilities at railway stations is insufficient or does not meet basic requirements.
In the Service subgroup, the criterion Customer Service (office, website, contact telephone, complaint handling, etc.) (0.175) was selected. In addition to the previous criterion, currently available services are not able to respond to all needs of people with disabilities.
In the Staff subgroup, the criterion Assistance provision for disabled persons and persons with reduced mobility (0.213) was selected. The observation for this criterion is the same as for the first subgroup.
In the Ticket subgroup, the criterion Better prices and benefits (0.177) was selected. This selection tells us that the population of people with disabilities, which is known to have much less income or financial assistance, is not able to achieve a sufficient number of rides with the discounts currently available.
In the Cleanliness and Maintenance subgroup, two criteria with the same significance, Maintenance and Vehicle Safety and Cleanliness of the toilet in the station (0.137) were selected. For these two criteria, it can be said that they would not differ from those referring to people without disabilities since it reflects the existing situation in the transport system. In Figure 6, all other criteria according to their significance are shown by subgroups.

5.4.6. Information

In the Ticket office and machines subgroup, the criterion Universal guidelines for movement over stations (0.148) was selected. The approximate criterion according to importance is Availability of information on accessibility of stations on the Internet (0.140). It is shown that there is insufficient awareness of the necessary guidelines referring to the area of railway stations and the contents provided there. The second criterion tells us that the use of the Internet is very useful for people with disabilities.
In the Facilities subgroup, the criterion Updated, precise and reliable information on vehicles (operating hours, stops, service interruptions, etc.) (0.175) was selected. The approximate criterion according to importance is Information available through other communication technologies (internet, phone, mobile applications, etc.) (0.172). Insufficiently updated information for people with disabilities is a major problem because they need to make a lot of planning for their movement and due to poor transport, any cancellation or unforeseen situation presents a major problem for them. Thus, the already mentioned new technologies are one of the advantages that can provide enough information in travel planning.
In the Understandable subgroup, the criterion Ease of understanding information in the booking confirmation (0.173) was selected. Providing information in the present way is not useful enough for people with disabilities, which in most cases can be confusing to them. In Figure 7, all other criteria according to their importance are shown by subgroups.

5.4.7. Comfort

In the Ambient subgroup, the criterion Drinking water and sanitation (0.185) was selected. Air-conditioning in the vehicle (0.170) was selected as the second most important criterion.
In the Comfortable subgroup, the criterion Comfort of intercity vehicles (0.174) was selected.
Observing this criterion, it can be concluded that existing vehicles do not meet the basic criteria related to persons with disabilities. Figure 8 shows all other criteria according to their significance.

5.4.8. Environmental Impact

In the Environmental impact group, only the main group was observed. The most important criterion is Unpleasant smell (0.176). This criterion describes the existing situation that tells us that there is no adequate care regarding hygienic conditions at certain railway stations. Figure 9 shows all other criteria according to their importance.

6. Conclusions

The use of public transport by persons with disabilities is a basic precondition for increasing their mobility and better inclusion of this population in all regular activities, increasing the possibilities of communication and meeting all social needs. The lack of appropriate statistical data, inadequate number of relevant research on the position of people with disabilities in traffic and in addition to many adopted regulations in practice, points to the inconsistency in the application and improvement of affordable transport infrastructure and means of transport. The insufficient consideration of the needs of persons with disabilities results in the fact that transport in Serbia is still inaccessible to a large part of this population.
The contribution of this paper is that for the first time in Serbia, a comprehensive survey of persons with disabilities and their perceptions regarding the assessment of the service provided in rail transport has been carried out. The developed Full Consistency Method and Rough Power Heronian aggregator is used to evaluate criteria in the area of passenger transport by using the EN 13816 standard. The applied criteria are adapted for people with disabilities. An additional contribution to the implementation of this model is the avoidance of the socioeconomic characteristics of decision-makers, especially when it is known that persons with disabilities are highly dependent on finances and that their income, pensions or assistance are very low.
The first three most important main criteria are Accessibility, Availability and Security. This research has confirmed the practical situation that the accessibility of rail passenger system is the most important criterion in the assessment of main groups. Therefore, this is the first place where it is necessary to intervene in order to be able to think about increasing the number of persons with disabilities in the public rail transport. In the Accessibility subgroup, the most important criteria describe that it is necessary to solve the problems of environment, through the most important criteria, Ramps must be adopted with adequate slopes, Free accessibility to all media, Accessibility input/output equipment in stations or stops and Accessibility of tickets sales points. In the second main group, the need for accuracy in departures/arrivals of public transport to railway stations, sufficient number of seats in railway vehicles and available information is highlighted. In the Security group, the stability of the vehicles required is indicated.
In other main groups, it is necessary to emphasize the following criteria: for Time (most importantly, Travel time information in abnormal conditions: disruption, delay, evacuation), for Customer care (most significant Assistance to/from connecting services: arrival, departure, buying tickets, moving, Customer service: office, website, contact telephone, complaint handling and so forth, Assistance provision to disabled people, better prices and benefits, maintenance and vehicle stability, Cleanliness of the toilet in the station) and for Information (emphasizing the absence of Universal guidelines for movement over stations, Update precise and reliable information on vehicles: operating hours, stops, service interruptions and so forth and Easy to understand information in the booking confirmation). In main groups Comfort and Environmental Impact, responses are approximately similar as regarding people without disabilities. The Ticket subgroup also indicates that the existing number of rail transport facilities is insufficient and that it is necessary to introduce new facilities for both disabled persons and their companions.
This way of tracking data can serve as a help to decision-makers at both local and regional levels to control the service provided for persons with disabilities. On the other hand, in addition to a unique proposal of criteria that must be considered, a selection of new criteria can be expanded and monitored by associations of people with disabilities. Taking into account the research results previously presented, we can summarize the following advantages of the multi-criteria model: (1) MCDM approach based on RN uses exclusively internal knowledge of crisp numbers; (2) The proposed model eliminates the defects of a traditional fuzzy approach that implies a subjective definition of the limits of interval numbers; (3) Interval limits of RN do not depend on a subjective assessment but are defined on the basis of data imprecision; (4) The hybrid RN multi-criteria model provides flexible decision-making and takes into account the interaction between decision attributes; (5) The model examines the interrelationship between attributes and eliminates the impact of extreme values that can undermine the rationality of traditional models.
The planned research will be presented to associations of people with disabilities with the aim of implementation and use in the regular annual survey of passengers in rail passenger traffic.
Future research in this area and the provision of more detailed information may refer to the ranking of criteria by processing data in different environments (regional, urban or rural) and individually for certain types of disabilities. Such research can bring new more detailed conclusions and point out the needs for certain types of equipment, service or the characteristics of the rail passenger system. In addition, with certain adjustments, the new model can also be applied to other modes of transport.

Author Contributions

Conceptualization, G.S.; Data curation, A.V.; Investigation, D.Đ.; Methodology, Ž.S., D.P. and V.M.; Project administration, A.V.; Validation, D.P.; Writing—original draft, D.Đ.; Writing—review & editing, G.S. and Ž.S.

Funding

This research received no external funding.

Acknowledgments

The authors would like to thank to all associations of people with disabilities in Serbia.

Conflicts of Interest

The authors declare no conflict of interest.

Appendix A

Table A1. Main group availability.
SubgroupCriteria
C11—Frequency and punctualityC11-1—Frequency of public transport to bus or train station, C11-2—Punctuality of public transport to intercity bus and railway stations, C11-3—Frequency of intercity buses or trains, C11-4—Accuracy of intercity buses or trains, C11-5—Short time to transfer from one vehicle to another in the same mode of transport (when passing on), C11-6—Short time to transfer from one vehicle to another in the different mode of transport (when passing on), C11-7—Regularity of the service (absence caused by interruptions-delay, cancellation) related to intercity transport (alternative transport)
C12—Mode of transport, network and infrastructureC12-1—Availability of other Modes of transport, C12-2—Availability Network area covered, C12-3—Connections with other public transport services, C12-4—Ease of access to the interchange, C12-5—Availability of seats on train/bus, C12-6—Number of elevators, escalators and moving walkways, C12-7—Parking spaces and facilities for car parking, C12-8—Availability of shelter and benches at stations/stops
C13—Passenger facilities and working hoursC13-1—Number and variety of shops, cafés and restaurants, C13-2—Availability of telephone signals and Wi-Fi, C13-3—Availability of schedule information by phone/mail, C13-4—Availability of schedules/maps at stations/stops, C13-5—Availability Operation operating hours during weekdays, C13-6—Price Integration with PT, C13-7—Availability of ticket machines
Table A2. Main group accessibility.
SubgroupCriteria
C21—Access for disabled public transportC21-1—Ramps are adopted with adequate slope, C21-2—External interfaces to private car and taxi users, C21-3—Internal interface transfer to other PPT modes, C21-4—Escalators and moving walkways, C21-5—Easy access to stations and platforms from the street, C21-6—Physical condition of vehicles and infrastructure, C21-7—Platform lifts for boarding trains, C21-8—Availability of handrails or grab bars on stations and trains/buses
C22—Communication, Colour, contrastC22-1—Orientation should be possible without verbal communication, C22-3—Obstacle free accessibility to all media, C22-4—Pedestrian crossing with audible or tactile signals, C22-5—All operating controls and communication systems should be within reach of sitting persons, C22-6—Text enlargement/W3C capabilities for websites, C22-7—Easy operation of communication system (information and emergency telephones) with visual echo, C22-8—Cleary contrasted and tactile way guidance system to identify path and the stopping place
C23—Corridors, free routes and pathsC23-1—Accessibility input/output equipment in stations or stops, C23-2—Barrier free path from parking places, C23-3—Corridors, storage places, seats, toilets and service areas are required to have sufficient manoeuvring and clear space, C23-4—Steps and stairs – handrail, C23-5—Way guidance to the toilet by use of visual signage, C23-6—Ease of movement inside the interchange due to the number of people, C23-7—Toilets provision and location of wheelchair accessible toilets
C24—Ticket office and machinesC24-1—Accessibility of tickets sales points, C24-2—Accessibility of ticketing machines in the height of persons sitting, C24-3—The availability of a text form for a ticketing machine, C24-4—Availability of voice mode information with for a ticketing machine, C24-5—The availability of a tactile way of information for a ticketing machine, C24-6—Possibility of buying and checking the availability of tickets over the Internet, C24-7—Ease of payment of tickets and purchase of tokens at stations/halts
Table A3. Main group information.
SubgroupCriteria
C31—DisabledC31–1—Universal guidelines for movement over stations, C31–2—Availability of information on accessibility of stations on the Internet, C31–3—Available signage documents in Braille or audio, C31–4—Available sound tags and guidance information, C31–5—Visual indicator in elevators to indicate help on way for use in emergency, C31–6—General information about the accessibility of public transport that arrives at intercity stations, C31–7—General way finding signage consistent in design and easily identifiable, C31–8—Information on travelling in v (absence, interruption, …) and available alternatives for the delivery of transport
C32—FacilitiesC32-1—Updated, precise and reliable information on vehicles (operating hours, stops, service interruptions, etc.), C32-2—Travel information abnormal conditions about suggestions and complaints, C32-3—Information available through other communication technologies (internet, phone, mobile applications, etc.), C32-4—Face-to-face at the information desk/office, C32-5—Printed layout of the station’s facilities and their contents, C32-6— General information about customer care, C32-7—Providing information for purchasing tickets (ticket offices, ticket machines, etc.)
C33—UnderstandableC33–1—Ease of understanding information in the booking confirmation, C33–2—Clear and timely announcements of stops, C33–3—Clear and simple notice boards with information and directions in stations, C33–4—Availability and clarity of travel information at the interchange, C33–5—Explanations and announcement of delays, C33–6—Clarity of information given in timetables, C33–7—Easily readable and big letters
Table A4. Main group time.
SubgroupCriteria
C41—GeneralC41–1—Duration of the planned trip, C41–2— Length of actual travel time in the vehicle, C41–3—Time of entry/exit to the vehicle on the stations, C41–4—Length of travel time between the point of entry into the station and the departure point, C41–5—Travel time information in abnormal conditions (disruption, delay, eviction, …), C41–6—The time required to provide information on the time of placement of the vehicle on the platforms, C41–7—Time required for selecting other modes of transport
Table A5. Main group custom care.
SubgroupCriteria
C51—AssistanceC51-1—Assistance to/from connecting services (arrival, departure, buying tickets, moving), C51-2—Help and information from the public transport point or parking place to the intercity station, C51-3—Help and information at the station, C51-4—Help and information in the vehicle, C51-5—Adjusted assistance (station and vehicle) when terminating the service, C51-6—Customized care for users who need medical help, C51-7—Help with booking and buying tickets
C52—ServiceC52-1—Customer service (office, website, contact telephone, complaint handling, etc.), C52-2—Consumer care to collect information about satisfaction through forms, C52-3—Taking care of customers receiving complaints about services, C52-4—Medical institution in the station and vehicles, C52-5—Overall dedication to travellers, C52-6—Application of innovations and initiatives in relation to passengers, C52-7—View clearly visible user service
C53—StaffC53-1—Assistance provision to disabled persons and persons with reduced mobility, C53-2—Help with luggage, C53-3—Getting in/out of the station, C53-4—Availability of staff in handling request for special services, C53-5—Courtesy and Competence on Board, C53-6—Courtesy and Competence in Station, C53-7—Scheduling staff to assist in the planned arrival/departure journey
C54—TicketC54-1—Flexibility of shopping options at different locations outside of the stations, C54-2—Flexibility of options for ordering tickets and making them at home, C54-3—Flexibility of options for ordering tickets and buying tickets in advance, C54-4—Options for purchasing tickets according to different tariffs during the week, C54-5—Different payment options when buying tickets, C54-6—Possibility to purchase tickets for multiple modes of transport in one place, C54-7—Better prices and benefits
C55—Cleanliness and maintenanceC55-1—Cleanliness of Vehicles, C55-2—Cleanliness of the station, C55-3—Cleanliness of the toilet in station, C55-4—Cleanliness of the toilet in vehicle, C55-5 Maintenance of ticket equipment, C55-6—Maintenance and correctness of platform infrastructure, C55-7—Maintenance and vehicle safety, C55-8—Maintenance and correctness of stable slopes, C55-9—Maintenance and correctness of elevators, escalators and platforms
Table A6. Main group comfort.
SubgroupCriteria
C61—AmbientC61-1—Pleasant environment, C61-2—Conditions of cleanliness of the environment, C61-3—Illumination of the environment, C61-4—Air conditioning in the station, C61-5—Air-conditioning in the vehicle, C61-6—Satisfaction with provision of meals, food and water, etc., C61-7—Drinking water and sanitation
C62—ComfortableC62-1—Comfort and adaptability of public transport to intercity stations, C62-2—Comfort and customization of the seats in the waiting rooms of the intercity bus/rail stations, C62-3—Comfort and adjustment of the seat on the platforms, C62-4—Comfort and customization of rooms for mothers and children, C62-5—Adjustment of the luggage space, C62-6—Comfort of station rooms with an increased number of users, C62-7—Comfort of intercity vehicles
Table A7. Main group security.
SubgroupCriteria
C71—Emergency and safetyC71-1—Emergency Situations and Emergency Plans (Fire, Earthquake, …), C71-2—A sense of security from crime due to the presence of station staff, C71-3—Emergency telephone, C71-4—Emergency exit signs and fire extinguishers, C71-5—Personal safety in the vehicle, C71-6—Personal safety at the station, C71-7—Video surveillance and alarms for travellers, Stability of moving vehicles, C71-8—The train/bus travels at a safe speed
Table A8. Main group Environmental impact.
SubgroupCriteria
C81—GeneralC81-1—Influence on the environment from garbage on the station area, C81-2—Pollution electromagnetic interference, C81-3—Pollution electromagnetic interference, C81-4—Pollution exhaust, C81-5—Pollution dust and dirt, C81-6—Visual pollution, C81-7—Unpleasant smell, Increased vibration influence on vehicle motion

References

  1. Mattson, J.; Hough, J.; Abeson, A. Assessing Existing and Needed Community Transportation for People with Disabilities in North Dakota Small Urban & Rural Transit Center, Upper Great Plains Transportation Institute North Dakota State University, Fargo. 2010. Available online: https://www.ugpti.org/resources/reports/downloads/dp-231.pdf (accessed on 16 June 2019).
  2. Transport for People with Mobility Handicaps Policy and Achievements in Europe© Ecmt. 1991. Available online: http://citeseerx.ist.psu.edu/viewdoc/download;jsessionid=E77E45997E333128DCEBD417DBA056CA?doi=10.1.1.589.5663&rep=rep1&type=pdf (accessed on 16 June 2019).
  3. Wasfi, R.; Levinson, D.; Geneidy, A. Measuring the transportation needs of people with developmental disabilities. Disabil. Health J. 2017, 10, 356–360. [Google Scholar] [CrossRef] [PubMed]
  4. Venter, C.; Savill, T.; Rickert, T.; Bogopane, H.; Venkatesh, A.; Camba, J.; Mulikita, N.; Khaula, C.; Stone, J.; Maunder, D. Enhanced Accessibility for People with Disabilities Living in Urban Areas Unpublished Project Report PR/INT/248/02, Department for International Development (UK) Engineering Knowledge and Research: Project R8016. Available online: http://www.globalride-sf.org/images/DFID.pdf (accessed on 16 June 2019).
  5. Strategija unapređenja položaja osoba sa invaliditetom u Republici Srbiji. Zakona o Vladi (“Službeni glasnik RS”, br. 55/05 i 71/05—Ispravka). 2005.
  6. Available online: http://www.noois.rs/o-nama/aktivnosti/123-zakoni-i-propisi-u-proceduri/strategija-unapredenja-polozaja-osoba-sa-invaliditetom-u-republici-srbiji-za-period-do-2020-godine/226-predlog-strategije-unapredenja-polozaja-osi-u-republici-srbiji-za-period-do-2020-godine (accessed on 16 June 2019).
  7. Vulevic, A.; Djordjevic, D.; Castanho, R.A.; Cabezas, F.J. Social Marketing and Their Related Challenges for the Limited Access for People Living with a Disability: A Serbian Case Study. In Case Studies on Social Marketing, Management for Professionals; Galan-Ladero, M., Alves, H., Eds.; Springer: Cham, Switzerland, 2019. [Google Scholar] [CrossRef]
  8. Đorđević, D.; Stojić, G.; Tanackov, I. The Accessibility to public transport for disabled people—Example of the city of Belgrade. In Proceedings of the 5th International Conference “Towards a Humane City” Urban Transport 2030—Mastering Change Novi Sad, Novi Sad, Serbia, 5–6 November 2015; pp. 93–98. [Google Scholar]
  9. Osmond, J.; Woodcock, A. The quality of the UK public transport journey experience for disabled travellers. In Proceedings of the 14th International Conference on Mobility and Transport for Elderly and Disabled Persons, Lisbon, Portugal, 28–31 July 2015. [Google Scholar]
  10. Grigoroudis, E.; Siskos, Y. Customer Satisfaction Evaluation Methods for Measuring and Implementing Service Quality; Springer: Berlin, Germany, 2010. [Google Scholar] [CrossRef]
  11. Mokonyama, M.; Venter, C. Incorporation of customer satisfaction in public transport contracts A preliminary analysis. Res. Transp. Econ. 2012, 39, 58–66. [Google Scholar] [CrossRef]
  12. Luigi, O.; Angel, I.; Patricia, C. The quality of service desired by public transport users. Transp. Policy 2011, 18, 217–227. [Google Scholar]
  13. Handbook for Implementing a Service Quality Program for Transit Agencies, Tcrp Report 47. 1999. Available online: http://www.trb.org/publications/tcrp/tcrp_rpt_47-a.pdf (accessed on 16 June 2019).
  14. EN 13816 Transportation—Logistics and Services—Public Passenger Transport—Service Quality Definition, Targeting and Measurement. 2002. Available online: https://ec.europa.eu/eip/ageing/standards/city/transportation/en-138162002_en (accessed on 16 June 2019).
  15. Cavana, Y.R.; Corbett, M.L.; Lo, Y.L.; Glenda, L. Developing zones of tolerance for managing passenger rail service quality. Int. J. Qual. Reliab. Manag. 2007, 24, 7–31. [Google Scholar] [CrossRef]
  16. Oñaa, J.; Oñaa, R.; Ebolib, L.; Mazzullab, G. Heterogeneity in Perceptions of Service Quality among Groups of Railway Passengers. Int. J. Sustain. Transp. 2015, 9. [Google Scholar] [CrossRef]
  17. Oñaa, R.; Oñaa, J. Analysis of transit quality of service through segmentation and classification tree techniques. Transp. A Transp. Sci. 2015, 11, 365–387. [Google Scholar] [CrossRef]
  18. Shen, W.; Xiao, W.; Wang, X. Passenger satisfaction evaluation model for Urban rail transit: A structural equation modeling based on partial least squares. Transp. Policy 2016, 46, 20–31. [Google Scholar] [CrossRef]
  19. Chou, J.S.; Kim, C. A structural equation analysis of the QSL relationship with passenger riding experience on high speed rail: An empirical study of Taiwan and Korea. Expert Syst. Appl. 2009, 36, 6945–6955. [Google Scholar] [CrossRef]
  20. Yu, D. Intuitionistic fuzzy geometric Heronian mean aggregation operators. Appl. Soft Comput. 2013, 13, 1235–1246. [Google Scholar] [CrossRef]
  21. Yager, R.R. The power average operator. IEEE Trans. Syst. Man Cybern. 2001, 31, 724–731. [Google Scholar] [CrossRef]
  22. Levin, L.; Ulleberg, P.; Siren, A.; Hjorthol, R. Measures to Enhance Mobility among Older People in Scandinavia—A Literature Review of Best Practice, VTI (VTI Rapport; No. 749A). 2012. Available online: http://vti.diva-portal.org/smash/get/diva2:670628/FULLTEXT01.pdf (accessed on 16 June 2019).
  23. Dejeammes, M. Urban Mobility Plans and Accessibility. J. Transp. Land Use 2009, 2, 67–78. [Google Scholar]
  24. Rickert, T. Transport for All: What Should We Measure? Executive Director Access Exchange International October 2003, Updated March 2005. Available online: http://globalride-sf.org/pdf/what_should_we_measure.pdf (accessed on 16 June 2019).
  25. Lubin, A.; DiPetrillo, S. Meeting the Employment Transportation Needs of People with Disabilities in New Jersey, Voorhees Transportation Centre Bloustein School of Planning and Public Policy Rutgers, The State University of New Jersey Prepared for: New Jersey Department of Human Services Division of Disability Services. 2012. Available online: http://vtc.rutgers.edu/wp-content/uploads/2014/05/CountyTransit2012.pdf (accessed on 16 June 2019).
  26. Exploring the Journey Experiences of Disabled Commuters 09074b; Transport for London: London, UK, 2010. Available online: http://content.tfl.gov.uk/Exploring-the-journey-experiences-of-disabled-commuters-report.pdf (accessed on 16 June 2019).
  27. Dobbie, F.; McConville, S.; Ormston, R. Transport Research Series Understanding Why Some People Do Not Use Buses, Scottish Centre for Social Research (Scot Cen), Scottish Government Social Research. 2010. Available online: https://www.gov.scot/publications/understanding-people-use-buses/pages/3/ (accessed on 16 June 2019).
  28. Williams, B.; Copestake, P.; John, E. Experiences and Expectations of Disabled People A Research Report for the Office for Disability Issues, GfK NOP Social Research, Office for Public Management, Pare, Icarus Collective and University of Nottingham. Available online: http://citeseerx.ist.psu.edu/viewdoc/download;jsessionid=37C4B0E89850828AD61580FAB548DEFA?doi=10.1.1.499.3150&rep=rep1&type=pdf (accessed on 16 June 2019).
  29. Improved Public Transport for Disabled People Volume I—Report, Transport Research Series, TNS System Three Social Research the Transport Research Institute, Napier University Transport and Travel Research Ltd., Scottish Executive Social Research. 2006. Available online: https://www2.gov.scot/resource/doc/117162/0028844.pdf (accessed on 16 June 2019).
  30. Improved Public Transport for Disabled People Volume II—Annexes 1–3, TNS System Three Social Research, Scottish Executive Social Research. 2006. Available online: https://www.webarchive.org.uk/wayback/archive/20180602123228/www.gov.scot/Publications/2006/05/16145330/7 (accessed on 16 June 2019).
  31. Taylor, Z.; Józefowicz, I. Intra-urban daily mobility of disabled people for recreational and leisure purposes. J. Transp. Geogr. 2012, 24, 155–172. [Google Scholar] [CrossRef]
  32. Yaua, M.K.S.; McKerchera, B.; Packerb, T.L. Traveling with a disability: More than an Access Issue. Ann. Tour. Res. 2004, 31, 946–960. [Google Scholar] [CrossRef]
  33. Accessibility, Social and Equity Impacts Communicating Transport Research and Innovation. Available online: https://trimis.ec.europa.eu/sites/default/files/thematic-analysis/20150430_170310_54997_TRS17_fin.pdf (accessed on 16 June 2019).
  34. Janković, S.; Mladenović, S.; Radonjić, V.; Kostić-Ljubisavljević, A.; Uzelac, A. Integration platform-as-a-service in the traffic safety area. In Proceedings of the Mosharaka International Conference on Communications, Networking and Information Technology (MIC-CNIT2011), Dubai, UAE, 8 October–2 December 2011; pp. 70–75. [Google Scholar]
  35. Mediate–Methodology for Describing the Accessibility of Transport in Europe. 2008. Available online: https://trimis.ec.europa.eu/project/methodology-describing-accessibility-transport-europe (accessed on 16 June 2019).
  36. Mackett, R. Overcoming the Barriers to Access for Older People, Centre for Transport Studies, University College London, Transport Working Group of the Age Action Alliance (AAA). 2014. Available online: http://ageactionalliance.org/wordpress/wp-content/uploads/2014/11/Overcoming-the-barriers-to-access-Nov-14.pdf (accessed on 16 June 2019).
  37. Stojić, G.; Mladenović, D.; Prentkovskis, O.; Vesković, S. Novel Model for Determining Public Service Compensation in Integrated Public Transport Systems. Sustainability 2018, 10, 2969. [Google Scholar] [CrossRef]
  38. Govender, K.K. Public transport service quality in South Africa: A case study of bus and minibus services in Johannesburg. Afr. J. Bus. Manag. 2014, 8, 317–326. [Google Scholar] [CrossRef]
  39. Islam, R.; Chowdhury, M.S.; Sarker, M.S.; Ahmed, S. Measuring customer’s satisfaction on bus transportation. Am. J. Econ. Bus. Adm. 2014, 6, 34–41. [Google Scholar] [CrossRef]
  40. Alpu, O. A methodology for evaluating satisfaction with high-speed train services: A case study in Turkey. Transp. Policy 2015, 44, 151–157. [Google Scholar] [CrossRef]
  41. Nandan, G.S. Determinants of Customer Satisfaction on Service Quality: A Study of Railway Platforms in India. J. Public Transp. 2010, 13, 6. [Google Scholar]
  42. Rodriguez-Valencia, A.; Rosas-Satizabal, D.; Paris, D. Importance-Performance Analysis in Public Transportation: Methodological Revision for Practical Implementation. Transp. Res. Rec. J. Transp. Res. Board 2019, 2673, 710–723. [Google Scholar] [CrossRef]
  43. Botzoris, G.; Galanis, A.; Profillidis, V.; Eliou, N. Commuters Perspective on Urban Public Transport System Service Quality. WSEAS Trans. Environ. Dev. 2015, 11, 182–192. [Google Scholar]
  44. Liu, P.; Guan, Z. Evaluation Research on the Quality of the Railway Passenger Service Based on the Linguistic Variables and the Improved Promethee-II method. J. Comput. 2009, 4, 265–270. [Google Scholar] [CrossRef]
  45. Aydin, N. A fuzzy-based multi-dimensional and multi-period service quality evaluation outline for rail transit systems. Transp. Policy 2017, 87–98. [Google Scholar] [CrossRef]
  46. Kaynarca, O.A.; Ekmekçi, İ. Service quality measurement model in urban public transportation: The case of Iett. J. Int. Trade Logist. Law 2017, 3, 1–10. [Google Scholar]
  47. Lupo, T. Strategic Analysis of Transit Service Quality Using Fuzzy AHP Methodology. European Transport\Trasporti Europei 2013. Available online: https://www.openstarts.units.it/bitstream/10077/8691/1/ET_2013_53_5_Lupo.pdf (accessed on 16 June 2019).
  48. Lai, W.T.; Chen, C.F. Behavioral intentions of public transit passengers—The roles of service quality, perceived value, satisfaction and involvement. Transp. Policy 2011, 18, 318–325. [Google Scholar] [CrossRef]
  49. Pamučar, D.; Stević, Ž.; Sremac, S. A new model for determining weight coefficients of criteria in mcdm models: Full consistency method (fucom). Symmetry 2018, 10, 393. [Google Scholar] [CrossRef]
  50. Song, W.; Ming, X.; Wu, Z.; Zhu, B. A Rough TOPSIS Approach for Failure Mode and Effects Analysis in Uncertain Environments”. Qual. Reliab. Eng. Int. 2014, 30, 473–486. [Google Scholar] [CrossRef]
  51. Beliakov, G. Aggregation Functions: A Guide for Practitioners. Stud. Fuzziness Soft Comput. 2007, 139–141. [Google Scholar] [CrossRef]
  52. Yubao, C.; Peide, L. HOWA operator and its application to multi-attribute decision making. J. Zhejiang Sci-Tech Univ. 2012, 25, 138–142. [Google Scholar] [CrossRef]
  53. Oña, R.; Oña, R.; Diez-Mesa, F.; Eboli, L.; Mazzulla, G. A Composite Index for Evaluating Transit Service Quality across Different User Profiles. J. Public Transp. 2016, 19, 128–153. [Google Scholar] [CrossRef] [Green Version]
  54. Oña, R.; Machado, J.L.; Oña, J. Perceived Service Quality, Customer Satisfaction and Behavioural Intentions: A Structural Equation Model for the Metro of Seville, Spain. Transp. Res. Rec. J. Transp. Res. Board 2015, 2538, 76–85. [Google Scholar] [CrossRef]
  55. Hernández, S.; Monzón, A.; Oña, R. Urban Transport Interchanges: Importance-Performance Analysis for Evaluating Perceived Quality, Conference: XVIII Congreso Panamericano de Ingeniería de Tránsito, Transporte y Logística, At Santander, Cantabria. 2014. Available online: http://oa.upm.es/36982/1/INVE_MEM_2014_198780.pdf (accessed on 16 June 2019).
  56. The Gallup Organization: Flash EB Series #326 Survey on Passengers’ Satisfaction with Rail Services. 2011. Available online: https://ec.europa.eu/transport/sites/transport/files/modes/rail/studies/doc/2011_06-survey-passengers-satisfaction-with-rail-services.pdf (accessed on 16 June 2019).
  57. Accent Scotland, Disabled Travellers Awareness of Rights Final Report, March 2014. Available online: https://orr.gov.uk/__data/assets/pdf_file/0010/11710/disabled-travellers-rights-awareness.pdf (accessed on 16 June 2019).
  58. Survey on Information for People with Reduced Mobility in the Field of Public Transport—Final Report. Available online: https://www.emta.com/IMG/pdf/FinalReport.pdf?341/6c9be6a1ac6ad3009ffeae23c46a8ceb39e075ce (accessed on 16 June 2019).
  59. Accessibility Planning—Strategy, Document Study Results, City of Saskatoon—Planning Stage, Accessibility Plan for Persons in Need of Accessibility Services. 2007. Available online: https://www.saskatoon.ca/sites/default/files/documents/city-clerk/boards-committees/accessibility_planning_strategy.pdf (accessed on 16 June 2019).
  60. Design Standards for Accessible Railway Stations, Department for Transport Scotland Railways for All March 2015. Available online: https://assets.publishing.service.gov.uk/government/uploads/system/uploads/attachment_data/file/425977/design-standards-accessible-stations.pdf (accessed on 16 June 2019).
Figure 1. The main principle of selecting the most important criterion.
Symmetry 11 00992 g001
Figure 2. Final assessment of the Accessibility criteria.
Symmetry 11 00992 g002
Figure 3. Final assessment of the Availability criteria.
Symmetry 11 00992 g003
Figure 4. Final assessment of the Security criteria.
Symmetry 11 00992 g004
Figure 5. Final assessment of the Time criteria.
Symmetry 11 00992 g005
Figure 6. Final assessment of the Custom care criteria.
Symmetry 11 00992 g006
Figure 7. Final assessment of the Information criteria.
Symmetry 11 00992 g007
Figure 8. Final assessment of the Comfort criteria.
Symmetry 11 00992 g008
Figure 9. Final assessment of the Environmental impact criteria.
Symmetry 11 00992 g009
Table 1. Basic description of the process for defining criteria by groups according to research of people with disabilities in several studies.
AuthorGeneral Observed TopicGeneral Criteria
[3,25,27]Explore, in depth, barriers, discrimination, reasons why people choose not to use some mode of transport, Expand disability service.Obstacle in transport for disabled, Availability of transport and connection within transport modes.
[22,23,24,26,30,35,36]Accessibility measures for public transport vehicles and infrastructure, equipment in stations, ramps, tactile paving.Access for disabled, Corridors, free routes and paths.
[24,25,30,35,36]Availability of assistance, staff training issues, satisfaction surveys and complaint procedures but also the presence of personal security measures, costs of transport, provision of information.Custom care, Assistance, Information, Security.
[24,26,29]Measuring system performance, service data level, on time performance, moving equipment, type of provided service.Frequency, punctuality, Reliability.
[25,27,35,36]Utilize new and existing technologies, Provision of tickets.Passenger facilities, Cost and type of ticket.
Table 2. Overview of service quality models in railway transport.
AuthorModelGeneral Criteria
[15]ServqualAssurance, Empathy, Reliability, Responsiveness, Tangibles, Comfort, Connection, Convenience
[16]Classification and regression tree (CART)Safety, Cleanliness, Comfort, Service, Other, Information, Personnel
[18,19]Structural equation modelling (SEM)Passenger expectation, Perceived quality, Direction and guidance, Cleanliness and comfort, Speediness and convenience, Safety and security, Ticket service, Equipment and facilities, Staff service, Information distribution/disclosure, Convenient facilities for passengers, Perceived value, Passenger satisfaction; Technical quality, Functional quality, Corporate image, Passenger satisfaction, Passenger complaint, Passenger loyalty.
[40,41]Factor analysesPhysical conditions, Food services, Information, Personnel behaviour; Refreshments, Behaviour towards passenger, Information system efficiency, Basic facilities, Security
[44]PROMETHEE-IITicketing service quality, waiting service quality, Punctuality, Comfortable indicator, Security indicators, Exit service degree.
Table 3. Basic description of the criteria by groups.
No.CriteriaDescription of Criteria
1AvailabilityThis aspect is described with the service offered in terms of geography, time, frequency and punctuality, regularity, transport mode and connections, passenger and parking facilities, bicycle transport on board, phone and WI-FI, number of elevators, escalators and mowing walkways, shops, café restaurants, cash machines, availability of information, shelters, seats, working hours. [13,14,15,16,40,53,54,55,56]
2AccessibilityThis aspect is described with interface in and with other transport modes, easy movement inside interchange, appropriate facilities at stations, colour contrast, tactile surfacing, easy recognition, barrier free path and entrance, glass doors with contrasting strip, emergency routes, TTY devices, Braille audio documents and facilities, ramps with adequate slope, easy sign and buttons, adequate handrails, slip resistance, parking, physical condition of station area, easy opening doors on vehicles, operations of moving equipment, easy access from street to station, standardized design, free corridors, marking operational control, ticket sales point adopted to PRM, seating places for wheelchair users, toilets. [13,14,43,53,54,55,57,58,59,60]
3InformationThis aspect is described with the systematic provision of knowledge about a PPT system to assist the planning, execution and length of journeys, type and form of given information, signposting to different facilities, distance between facilities and services and modes, clarification of travel interchange information, signage and symbols with Braille and contrast, indication of accessible services, printed documents, new technology, face to face information, clear announcements, performance of ticket machines and moving equipment, update of information, audio and video, sign font, maps, pre travel information. [13,14,15,40,43,54,55,57,59,60]
4TimeThis aspect is described with time relevant to the planning and execution of journeys, time to other modes and facilities, travel time satisfactory. [14,40,43,55,56]
5Customer careThis aspect is described with service elements introduced to affect the closest practicable match between the standard service and the requirements of any individual customer, special need and different kind of support, availability of staff, assistance for people with reduced mobility and disabled, price integration, provided services, behaviour and respond of staff, understanding, cheaper transport for PRM, Complaint, cost and tariffs, performance of service, food facilities, medical staff, handling service problems, effectiveness of response, prepare written messages. [13,14,15,16,40,43,54,56,57,58]
6ComfortThis aspect is described with service elements introduced for the purpose of making PPT journeys relaxing and pleasurable, smoothness of ride and stops, air conditioning, crowding on board, smoothness of ride, provision of internet service, comfort of journey. [13,14,15,16,40,55,57]
7SecurityThis aspect is described with sense of personal protection experienced by customers, derived from the actual measures implemented and from activity designed to ensure that customers are aware of those measures, behaviour of staff, safety from crime, safe speed, security of slipping and falling, aggression, sense against accidents. [13,14,15,16,40,43,54,57]
8Environmental impactThis aspect is described effect on the environment resulting from the provision of a PPT service, ear quality, absence of graffiti, level of noise and vibration in station and vehicles. [13,14,54,55]
Table 4. Sample characteristics.
CharacteristicsStatistics
GenderMale (61.3%), Female (38.7%).
AgeUp to 20 (3.2%), From 21 to 25 (6.5%), From 26 to 30 (22.6%), From 31 to 40 (16.1%), From 41 to 50 (22.6%), From 51 to 65 (25.8%), Over 66 (3.2%).
Employment StatusEmployed (22.6%), A dependent person (25.8%), Retired (51.6%).
MobilityWalking independently (25.8%), Walking alone or difficult (19.4%), Walking with the help of a gag (6.5%), Walking with the help of another person (6.5%), Wheelchair-drives independently (32.3%), Wheelchair-drive the other person (9.7%).
Damaged sensesDoes not have (67.7%), Sight (16.1%), Combined (16.1%).
SpeechNormal (71.0%), Not very difficult, understandable (22.6%), Difficult understandable (6.5%).
Table 5. Importance of main criteria—An example of the first decision-maker’s responses.
DM1
CriteriaC3C7C2C4C5C6C1C8
Importance ( ϖ C j ( k ) )111.51.51.51.522
Table 6. The assessment results of weight criteria for the main group using the FUCOM method.
Decision MakerC1C2C3C4C5C6C7C8
DM10.0880.1180.1760.1180.1180.1180.1760.088
DM20.1500.1500.1500.1500.1500.0750.1000.075
DM 30.2320.1550.1160.0770.1060.0930.1550.066
DM 40.2160.2160.0860.0980.1080.0720.1440.062
DM 50.1220.1820.0870.1010.1820.0760.1820.068
DM 60.1280.1680.0840.0750.1120.0990.2680.067
DM 70.1820.1820.0590.1300.1010.1010.1820.065
DM 80.1720.2490.0770.0590.1060.1380.1310.067
DM 90.1720.2490.0770.1310.1380.0670.1060.059
DM 100.1820.2730.0610.0780.0910.0680.1370.109
DM 110.1840.1840.1840.0660.0660.0660.1840.066
DM 120.1820.2730.0910.0780.1090.0680.1370.061
DM 130.1940.0970.1140.0780.1490.0780.1940.097
DM 140.1360.2050.1020.1360.1020.0680.2050.045
DM 150.2730.1820.0610.1090.0910.1370.0780.068
DM 160.1250.1250.1250.1250.1250.1250.1250.125
DM 170.1580.1580.0990.0560.0560.1580.1580.158
DM 180.1640.1640.1170.1170.1170.0630.1640.091
DM 190.0770.0670.1060.1380.2490.1310.1720.059
DM 200.2250.2250.1500.0900.0750.0640.1130.056
DM 210.2060.1370.1030.2060.0820.0690.0590.137
DM 220.1580.0770.1110.3000.0670.0880.1110.088
DM 230.1510.1510.1510.0750.0750.0940.1510.151
DM 240.1490.2080.1160.1490.0650.0580.2080.047
DM 250.2140.2140.2140.0540.0820.0710.0540.097
DM 260.0480.0580.0740.1930.0480.1930.1930.193
DM 270.1930.1930.1290.0960.0770.0640.1930.055
DM 280.0950.0820.0640.1150.2860.0950.1910.072
DM 290.2060.2060.1370.1370.1030.0820.0690.059
DM 300.1840.1840.1840.1230.0530.0460.1840.041
Table 7. Results for the main group after transformation into rough numbers.
Decision MakerC1C2C3C4C5C6C7C8
DM10.0700.1700.0800.1900.1000.1900.0900.1600.0900.1700.0800.1400.1200.2000.0600.120
DM20.1100.1900.1000.2000.1000.1700.1000.2100.1000.2200.0700.1100.0700.1600.0600.120
DM30.1600.2500.1100.2000.0900.1500.0700.1300.0800.1500.0700.1200.1100.1900.0600.100
DM40.1600.2400.1500.2500.0700.1300.0800.1400.0800.1500.0700.1100.1000.1800.0500.100
DM50.0900.1800.1300.2200.0700.1300.0800.1500.1000.2400.0700.1100.1300.2000.0600.110
DM60.1000.1800.1200.2100.0700.1300.0600.1200.0800.1600.0700.1300.1500.2680.0600.100
DM70.1300.2100.1300.2100.0590.1100.0900.1700.0700.1400.0800.1400.1300.2000.0600.100
DM80.1300.2000.1600.2600.0700.1200.0600.1200.0800.1500.0800.1600.0900.1800.0600.110
DM90.1300.2000.1600.2600.0700.1200.0900.1700.0900.1900.0600.1000.0800.1700.0500.090
DM100.1400.2100.1700.2730.0600.1200.0700.1300.0700.1300.0600.1000.1000.1800.0700.150
DM110.1400.2100.1400.2200.1100.1900.0600.1200.0600.1200.0600.1000.1300.2000.0600.100
DM120.1400.2100.1700.2730.0700.1300.0700.1300.0800.1600.0600.1000.1000.1800.0500.090
DM130.1500.2200.0800.1900.0900.1500.0700.1300.0900.2000.0700.1200.1400.2200.0700.130
DM140.1000.1900.1400.2300.0800.1400.1000.1800.0800.1400.0600.1000.1400.2300.0400.080
DM150.1700.2730.1300.2200.0600.1200.0800.1500.0700.1300.0800.1600.0600.1600.0600.110
DM160.0900.1800.0900.1900.0900.1600.0900.1600.0900.1800.0800.1500.0900.1700.0700.150
DM170.1200.1900.1100.2100.0800.1400.0500.1200.0500.1100.0900.1800.1100.1900.0800.180
DM180.1200.2000.1200.2100.0900.1600.0800.1500.0900.1700.0600.0900.1200.1900.0600.130
DM190.0600.1700.0600.1800.0800.1400.1000.1900.1000.2700.0800.1500.1200.1900.0500.090
DM200.1600.2400.1600.2500.1000.1800.0700.1400.0600.1200.0600.1000.0900.1700.0500.090
DM210.1500.2200.1000.2000.0800.1400.1100.2500.0700.1300.0600.1000.0600.1500.0700.160
DM220.1200.2000.0700.1800.0800.1500.1200.3000.0600.1200.0700.1200.0800.1700.0600.120
DM230.1200.1900.1100.2000.1000.1800.0600.1300.0600.1200.0700.1300.1100.1900.0800.170
DM240.1100.1900.1500.2400.0900.1500.1000.2000.0600.1200.0500.0900.1500.2400.0400.090
DM250.1500.2300.1500.2400.1100.2140.0540.1200.0700.1300.0600.1100.0540.1500.0700.140
DM260.0480.1700.0580.1700.0600.1200.1100.2300.0480.1100.0900.1930.1400.2100.0800.193
DM270.1500.2200.1400.2300.0900.1600.0700.1400.0600.1300.0600.0900.1400.2100.0500.090
DM280.0800.1800.0700.1800.0600.1200.0800.1500.1100.2860.0700.1300.1400.2100.0600.110
DM290.1500.2200.1500.2300.1000.1700.1000.1800.0800.1400.0700.1200.0600.1600.0500.090
DM300.1400.2100.1400.2200.1100.2000.0900.1600.0500.1100.0460.0900.1300.2000.0410.080
Table 8. Final assessment of the General criteria.
General CriteriaPower Rough Heronian Value
Accessibility0.1180.211
Availability0.1190.198
Security0.1050.185
Time0.0790.156
Customer care0.0740.152
Information0.0800.145
Comfort0.0660.118
Environmental impact0.0580.113
Table 9. Final assessment of the criteria.
General CriteriaSub CriteriaCriteriaPower Rough Heronian Value
AccessibilityAccess for disabled public transportRamps are adopted with adequate slope0.1160.238
Communication, Colour, contrastObstacle free accessibility to all media0.1400.226
Corridors, free routes and pathsAccessibility input/output equipment in stations or stops0.1270.218
Ticket office and machinesUniversal guidelines for movement over stations0.1400.249
AvailabilityFrequency and punctualityPunctuality of public transport to intercity bus and railway stations0.1230.208
Mode of transport, network and infrastructureAvailability of seats on train/bus0.0970.199
Passenger facilities and working hoursAvailability of schedule information by phone/mail0.1280.216
SecurityEmergency and safetyStability of moving vehicles0.0920.185
TimeGeneralTravel time information in abnormal conditions (disruption, delay, eviction, …)0.1120.216
Customer careAssistanceAssistance to/from connecting services (arrival, departure, buying tickets, moving)0.1160.228
ServiceCustomer service (office, website, contact telephone, complaint handling, etc.)0.1150.234
StaffAssistance provision to disabled persons and persons with reduced mobility0.1660.261
TicketBetter prices and benefits0.1240.231
Cleanliness and maintenanceMaintenance and vehicle safety0.0920.183
Cleanliness of the toilet in station0.1000.175
Ticket office and machinesUniversal guidelines for movement over stations0.0870.209
InformationFacilitiesUpdated, precise and reliable information on vehicles (operating hours, stops, service interruptions, etc.)0.1250.225
UnderstandableEase of understanding information in the booking confirmation0.1220.225
ComfortAmbientDrinking water and sanitation0.1250.245
ComfortableComfort of intercity vehicles0.1250.223
Environmental impactGeneralUnpleasant smell0.1280.224

