Article

Predicting Value of Binding Constants of Organic Ligands to Beta-Cyclodextrin: Application of MARSplines and Descriptors Encoded in SMILES String

Department of Physical Chemistry, Faculty of Pharmacy, Collegium Medicum of Bydgoszcz, Nicolaus Copernicus University in Toruń, Kurpińskiego 5, 85-950 Bydgoszcz, Poland
*
Author to whom correspondence should be addressed.
Symmetry 2019, 11(7), 922; https://doi.org/10.3390/sym11070922
Submission received: 29 June 2019 / Revised: 11 July 2019 / Accepted: 12 July 2019 / Published: 15 July 2019
(This article belongs to the Special Issue Applied Designs in Chemical Structures with High Symmetry)

Abstract

:
The quantitative structure–activity relationship (QSPR) model was formulated to quantify values of the binding constant (lnK) of a series of ligands to beta–cyclodextrin (β-CD). For this purpose, the multivariate adaptive regression splines (MARSplines) methodology was adopted with molecular descriptors derived from the simplified molecular input line entry specification (SMILES) strings. This approach allows discovery of regression equations consisting of new non-linear components (basis functions) being combinations of molecular descriptors. The model was subjected to the standard internal and external validation procedures, which indicated its high predictive power. The appearance of polarity-related descriptors, such as XlogP, confirms the hydrophobic nature of the cyclodextrin cavity. The model can be used for predicting the affinity of new ligands to β-CD. However, a non-standard application was also proposed for classification into Biopharmaceutical Classification System (BCS) drug types. It was found that a single parameter, which is the estimated value of lnK, is sufficient to distinguish highly permeable drugs (BCS class I and II) from low permeable ones (BCS class II and IV). In general, it was found that drugs of the former group exhibit higher affinity to β-CD then the latter group (class III and IV).

1. Introduction

Molecular complexes, such as inclusion adducts, clathrates, cocrystals and solvates, have been widely used in many fields, including pharmacy [1,2,3,4,5,6], agriculture [7], the food industry [1,8,9] and explosives [10,11]. In the past two decades, cyclodextrins (CDs) have been one of the most extensively studied complexation agents, especially as pharmaceutical excipients [12,13,14,15]. The CDs’ adducts with active pharmaceutical ingredients (APIs) are mainly used for solubility and bioavailability enhancement [12,13,14,15,16,17], stability improvement [13,18], stomach, skin and eye irritation reduction [13,17,19], and prevention of unpleasant odor and bitter taste [13,20]. Probably the most commonly used compounds in pharmaceutical formulations belonging to this class are alpha- (α-CD), beta- (β-CD), gamma- (γ-CD) cyclodextrins and their analogues such as (2-hydroxypropyl)-beta-cyclodextrin (HP-β-CD), sulfobutylether beta-cyclodextrin (SBE-β-CD) or randomly methylated-β-cyclodextrins (RM-β-CDs) [21]. The main criterion used for distinguishing different CDs (α-CD, β-CD and γ-CD) corresponds to six, seven and eight D-glucopyranose units, respectively. These excipients have been used for all main types of drug delivery systems (oral, nasal, rectal, dermal, ocular, parenteral) [13,21].
Apart from pharmaceutical applications, cyclodextrins are widely used in personal care products and perfumes manufacturing [20,22,23], which relies on their high stability, solubilizing abilities and vapor pressure reduction (fragrances industry). The unique properties of cyclodextrins are related to their specific structural features. These compounds are characterized by a symmetric toroidal shape. Due to the relatively hydrophobic cavity, cyclodextrins play the role of hosts in molecular inclusion complexes. On the other hand, they are hydrophilic on the outside surface, which results in strong interactions with water molecules. This characteristic structure is somewhat similar to biocatalysts [24,25,26]. An interesting example of the use of such cyclodextrin-based artificial enzymes is asymmetric and stereospecific synthesis (halogenation, hydrohalogenation, oxidation, reduction, photolysis, aldol reactions, hydrogenation, substitution and addition reaction) [25]. Noteworthy, the stereoselectivity of CDs was utilized for separation of racemic mixtures [27,28].
Quantitative structure–activity relationship (QSPR) methodology has been extensively used for evaluating the formation abilities of molecular complexes, and characterizing their properties [4,29,30,31,32,33,34,35,36,37,38]. Cyclodextrin binding constant modeling deserves special attention due to its practical importance. In recent years, several interesting approaches have appeared, such as application of molecular docking [38], conductor like screening model for real solvents (COSMO-RS) and quantum chemical-based descriptors [31], and topological indices [32,34,39]. Most of these models are simple regression equations. In general, better accuracy can be achieved when non-linear methods are applied. In our previous work, a novel approach of combining the non-linear MARSplines (multivariate adaptive regression splines) [40] methodology with common molecular descriptors calculated from simplified molecular input line entry specification (SMILES) code was applied for solubility modeling [41,42]. The major advantage of this procedure is its good predictive power and relatively simple model, which is a regression equation of new factors. The aim of this study was to apply a similar methodology for β-CD stability binding modeling.

2. Materials and Methods

The experimental values used for model development and validation were obtained from the datasets published by Suzuki et al. [43] and Mirrahimi et al. [38]. This collection comprises binding constants of 1:1 β-CD complexes with different organic compounds. In case of experimental values of the same compounds from different sources the mean value was taken into account. The list of all data is provided in the Supplementary Materials (Table S1).

2.1. Molecular Descriptors

Currently, a variety of molecular parameters are freely available for potential applications, which ensures that formulated models can be readily applied for predictions of compounds’ properties. Here two online tools were used for collecting the set of descriptors, namely ChemDes [44] and the BioCCl module of the BioTriangle platform [45]. The former provides a direct and integrated way of retrieving the sets of descriptors catalogued as Chemopy Descriptors (1135), CDK Descriptors (275), RDKit Descriptors (196), Pybel Descriptors (24), BlueDesc Descriptors (174) and PaDEL Descriptors 1875). The number of potential parameters is provided in parenthesis. All these indices can be calculated on-line [46]. The second source also offers a limited number of descriptors but offers sets suited for intermolecular interactions, which is the key advantage of this software. This is available using the BioTriangle webserver [47]. Since the BioTriangle allows for different geometrical transformations of descriptors calculated for pairs of molecules, the β-CD-ligand pairs descriptors were included.

2.2. Data Pre-Treatment

After completing the datasets of all descriptors, the standard pre-treatment procedure was implemented. It comprised elimination of descriptors not computable for the whole set of ligands and the remaining content across the whole population. Then, highly correlated and low-variance descriptors were also removed. Data curating was undertaken by taking advantage of the Data PreTreatment 1.2 module relying on the variable reduction Wootton, Sergent and Phan-Tan-Luu’s (V-WSP) algorithm [48,49]. Then, the dataset was divided into training and test sets using the activity division approach implemented in the Dataset Division 1.2 tool [50,51]. Both programs are written in Java and are freely available [52].

2.3. Model Development Using MARSplines

In this work, a MARSplines [40] methodology was applied as implemented in STATISTICA 12 [53]. This methodology leads to the following general regression formula, where Fi is the regression factor and ai are the regression parameters:
ln ( K b C D B e s t ) = a 0 + i = 1 n a i · F i
The left-hand side of this equation stand for the response variable, which is confronted with experimental values. Here it is defined by the value of the natural logarithm of a binding constant quantifying affinity of a ligand toward β–CD determined experimentally. The MARSplines method is the procedure designated for finding the analytical formula based on descriptors and so-called knots. Such relationships are termed basis functions. The values represent splitting of the set of values into sub-regions treated with alternative mathematical formula. The number of basis functions and factors in the model is controlled at an arbitrary level for balancing between accuracy and complexity of the model. To avoid model overfitting, the final model undergoes inspection of the regression coefficients by removing such factors for which statistical significance is not reached (p > 0.05). Additionally, the contribution to the model of each factor is inferred from the values of standardized regression coefficients (βi). Only such factors are included in the final model for which | β i | > 0.09 . Furthermore, the model was refined, internally validated and characterized in terms of fitting criteria using QSARINS software [54,55,56]. As a result of this procedure, the model was simplified by selecting the most important variables using a genetic algorithm (GA).
The simplest factor generated by the MARSplines procedure has a form identical to the classical QSPR approach and is expressed simply as multiplication of descriptor values by a coefficient, whose value is optimized for maximizing correlations between computed and estimated response values. The main improvement, however, comes from accounting for non-linearity by direct inclusion of more complex basis functions combined into factors. Hence, an advantage of the QSPR model formulation using the MARSplines procedure is the benefit of formally being in the multiple linear regression (MLR) format by including non-linear properties of considered datasets. Hence, the golden standard QSPR model development and validation procedures can be directly applied [41,42,57].

3. Results and Discussion
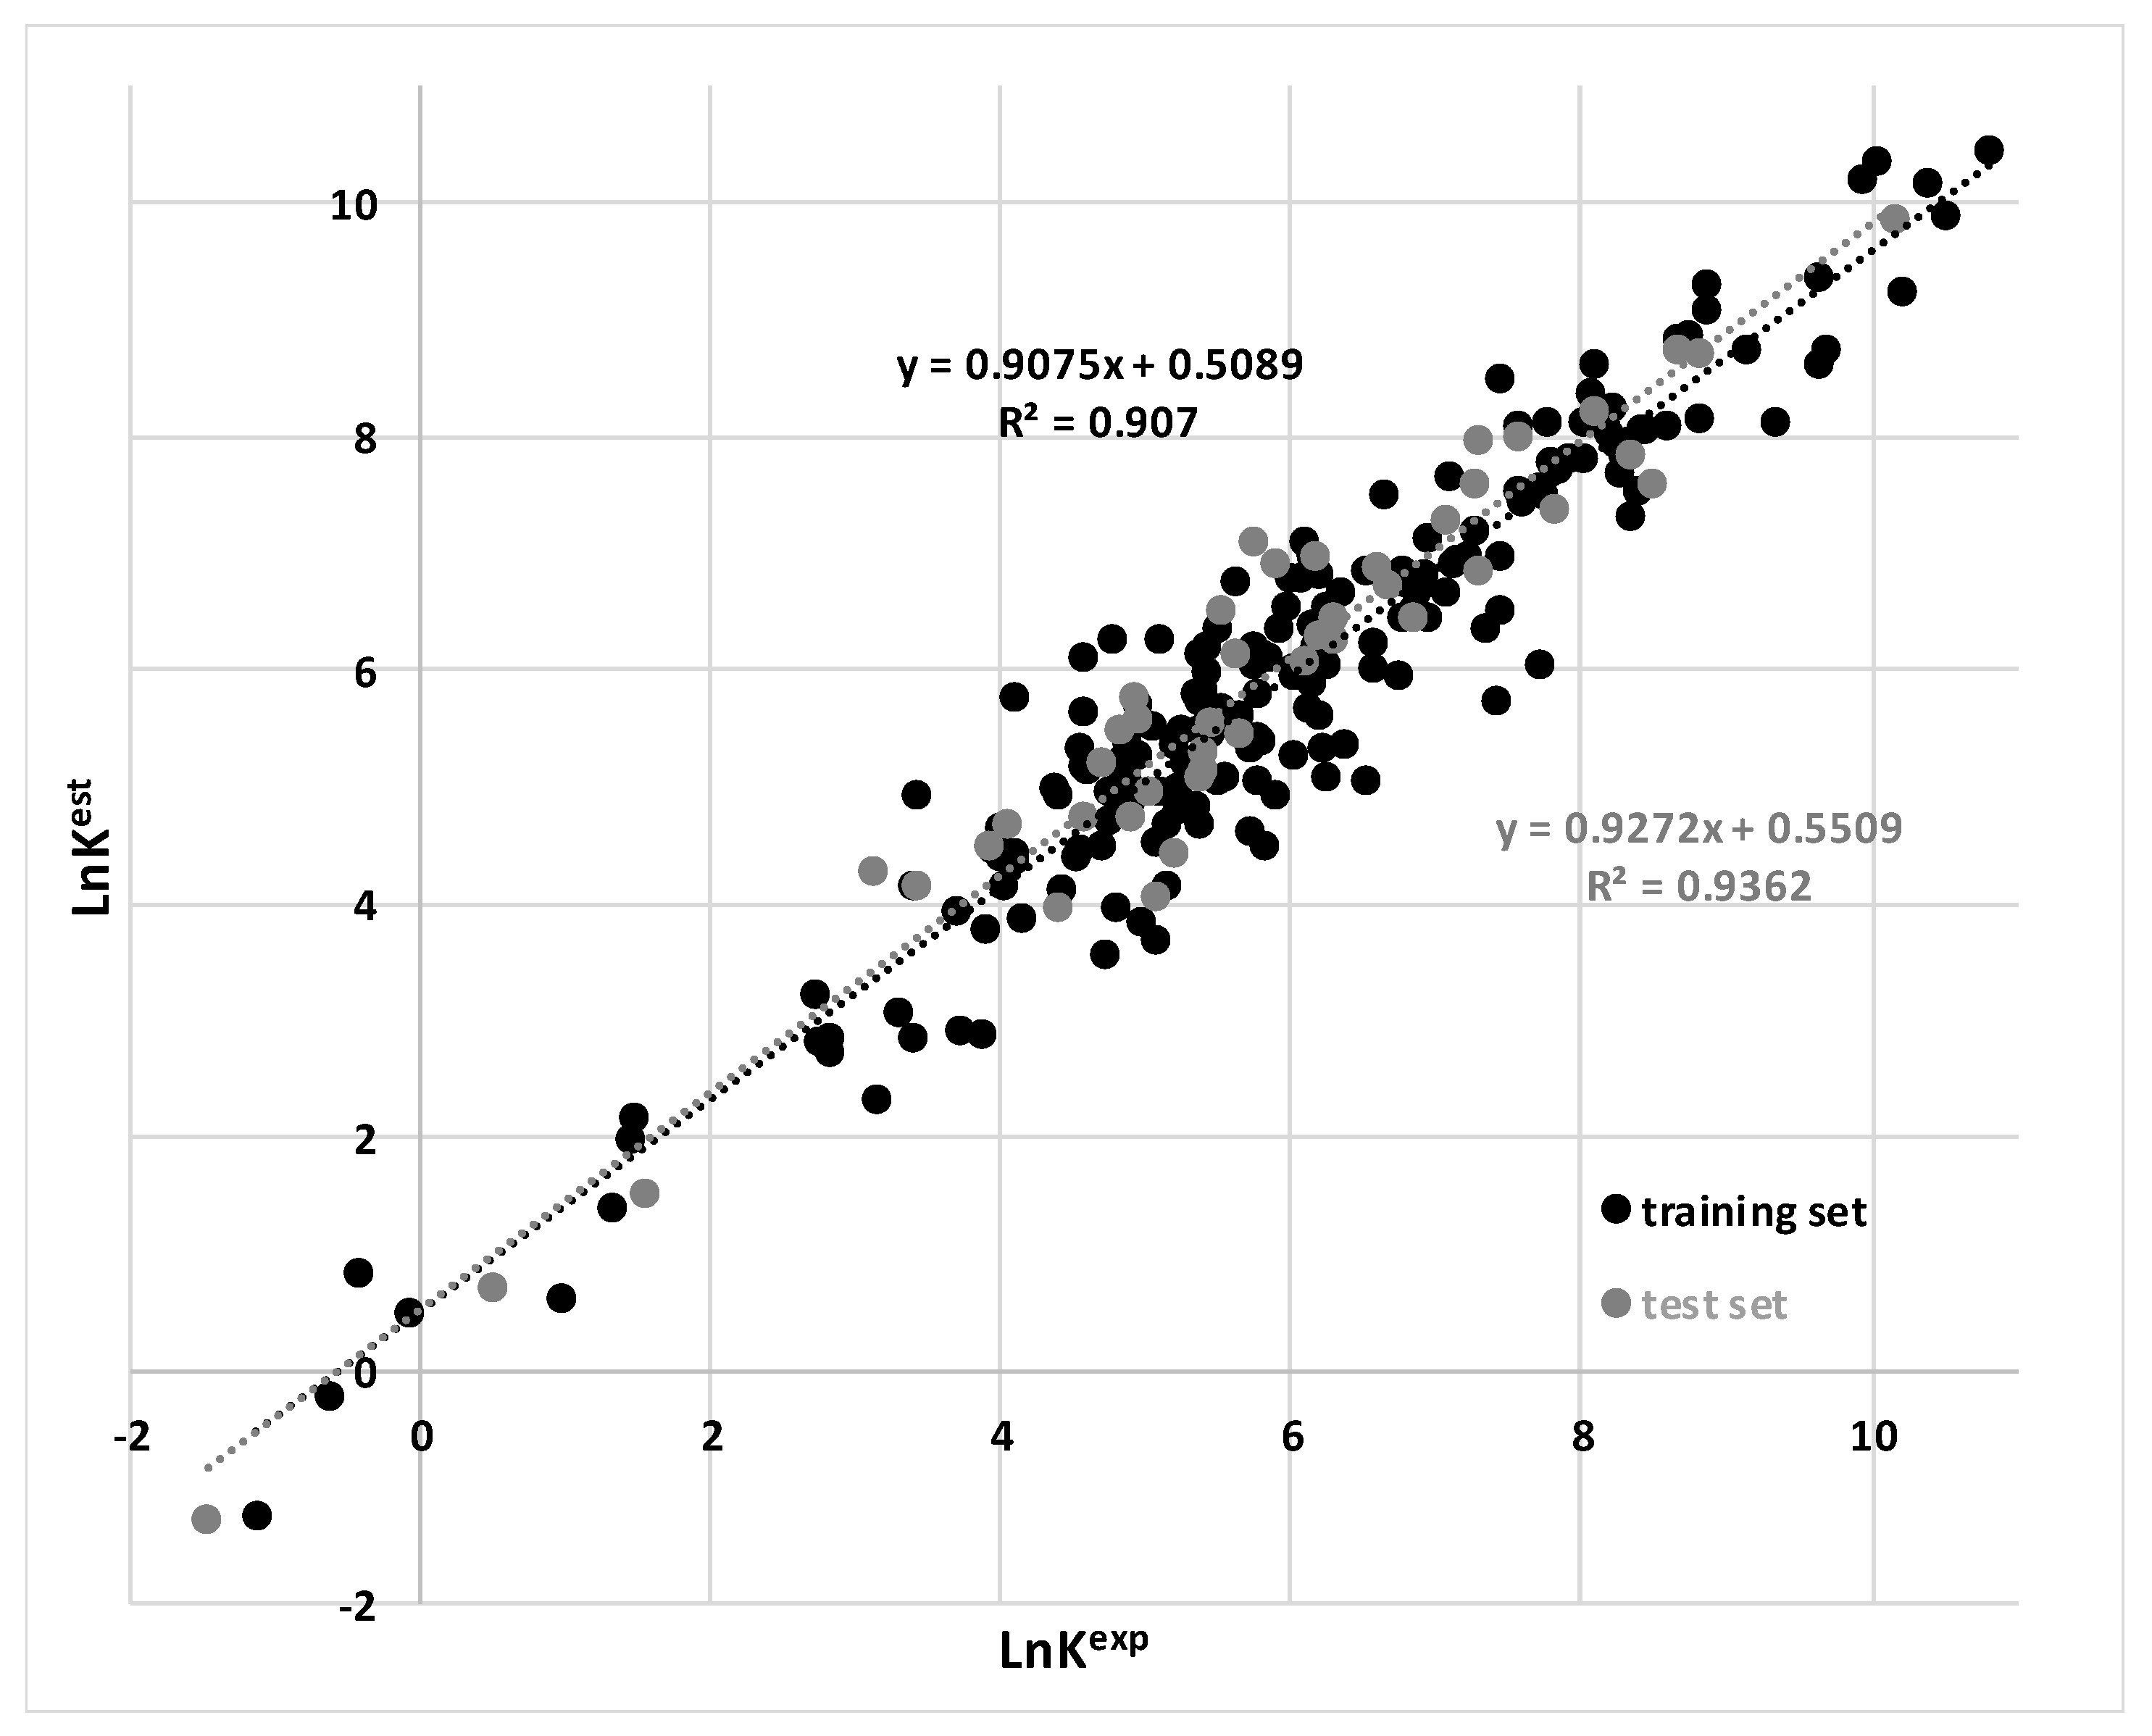
There are two main reasons that justify the efforts of the obtained model building. The first is obviously of substantive nature for deriving a model that is as accurate as possible and characterized by a low cost of applications. Hence, the screening of new potential ligands, or comparing a leading compound of an API and derivatives suggested by a drug design procedure, represent the immediate value of the obtained model. There is also a methodological reason for exploring the landscape of potential application in the chemistry domain of the MARSplines procedure. This is not explored deeply enough bearing in mind its high potential, effectiveness and ease of use.

3.1. Findings

Based on the MARSplines algorithm, the following descriptors were included in the model (Table 1): XLogP and Wlambda2.unity (source: BlueDesc); carbonTypes.8 (source: CDK), MLFER_A, AATS6m, AATS4i and PNSA-3 (source: PADEL); the tensor product of PEOEVSA9 descriptor vectors denoted as PEOEVSA9*PEOEVSA9; and, the vector sum of Chiv1 parameter denoted as Chiv1plusChiv1 (source: BioTriangle). Taking into account the relatively large training set population (n = 187), the number of variables seems to be reasonable fulfilling the general rules of acceptable QSPR model complexity, as documented in Table 1 and Figure 1. Internal validation, fitting criteria and external validation parameters, including R2 (determination coefficient), Radj2 (adjustment determination coefficient), F (Fisher ratio), SD (standard deviation), MAE (mean absolute error), MAPE (mean absolute percentage error), RMSE (root-mean-square error), PRESS (predicted residual error sum of squares) and Kxx (descriptors’ global correlation measure) [58,59], suggest that the model is well fitted to the training set and, most importantly, the external test set examples were well predicted. The results of external validation are presented in Figure 1. As one can see, the proposed model is characterized by high determination coefficients. Interestingly, R2, MAE and MAPE values are even slightly better for the external test set (0.936, 0.44, 9.3%, respectively) than for the training set (0.907, 0.49, 15.4%, respectively). This suggests that the model complexity is optimal. It is worth mentioning that the over-fitting problem should be taken into account when analyzing the quality of QSPR models, especially those that are non-linear. In the case of overly complex models, the training set data are exceptionally well fitted, but the test set prediction quality is far inferior. It is worth mentioning that the MARSplines protocol implemented in the STATISTICA software prevents overfitting by taking advantage from of the generalized cross validation (GCV) algorithm, which reduces the model to be as simple as possible.
Some of the parameters used in the model, such as like XLogP and MLFER_A, are quite intuitive and their physical meaning can be easily explained. The appearance of the hydrophilicity measure, namely the group contribution logP parameter (XlogP), confirms the role of the hydrophobic nature of the cyclodextrin cavity, while MLFER_A is the Abraham solubility parameter expressing the acidity. The role of polarity in β–CD molecular complexes formation was emphasized by PNSA-3 (charged partial surface area index [60]) and BioTriangle interaction descriptor PEOEVSA9*PEOEVSA9. This latter feature was calculated based on the MOE-type parameter involving the contributions of surface area and partial charge [61]. Another feature calculated using the BioTriangle platform, namely Chiv1plusChiv1, is associated with the Chiv1 descriptor belonging to the atomic valence connectivity indices class [62,63]. Of note, these descriptors were widely used in solving quite similar QSAR problems associated with target-ligand binding [64,65,66,67,68]. In the MARSplines model, there was also one topological descriptor characterizing carbon type (carbonTypes.8) [69] and the appearance of two autocorrelation indices, AATS6m and AATS4i [69]. Autocorrelation descriptors are probably one of the most extensively used quantitative structure–activity relationship/quantitative structure property relationship (QSAR/QSPR) descriptors Although the physical meaning of these parameters is not straightforward, our previous studies showed that this broad class of descriptors was found to be useful in the modelling of the affinity of compounds in the solid state [29,57].

3.2. Comparison to Existing Models

Comparison of the determination coefficient calculated for the obtained model with two regression models reported in recent years is presented in Table 2. Although these models were generated using similar datasets, it should be taken into account that depending on the validation procedure, different results can be obtained. Nevertheless, the correlation coefficients are lower or approximately equal to the MARSplines model. This suggests that the proposed approach is a good alternative for β-CD calculation. The major advantage of calculating molecular descriptors from the SMILES code is low computational cost. However, the proposed QSPR model has some limitations associated with ignoring the geometrical features of molecular complexes, such as conformation and solvation effects. These effects can be included using optimized 3D structures. Furthermore, it should be taken into account that in some cases, the stoichiometry of β-CD complexes is not 1:1 [70,71,72]. In such cases, molecular modelling methods such as molecular-dynamics docking or quantum-chemical binding constant calculations are more appropriate than the proposed approach.

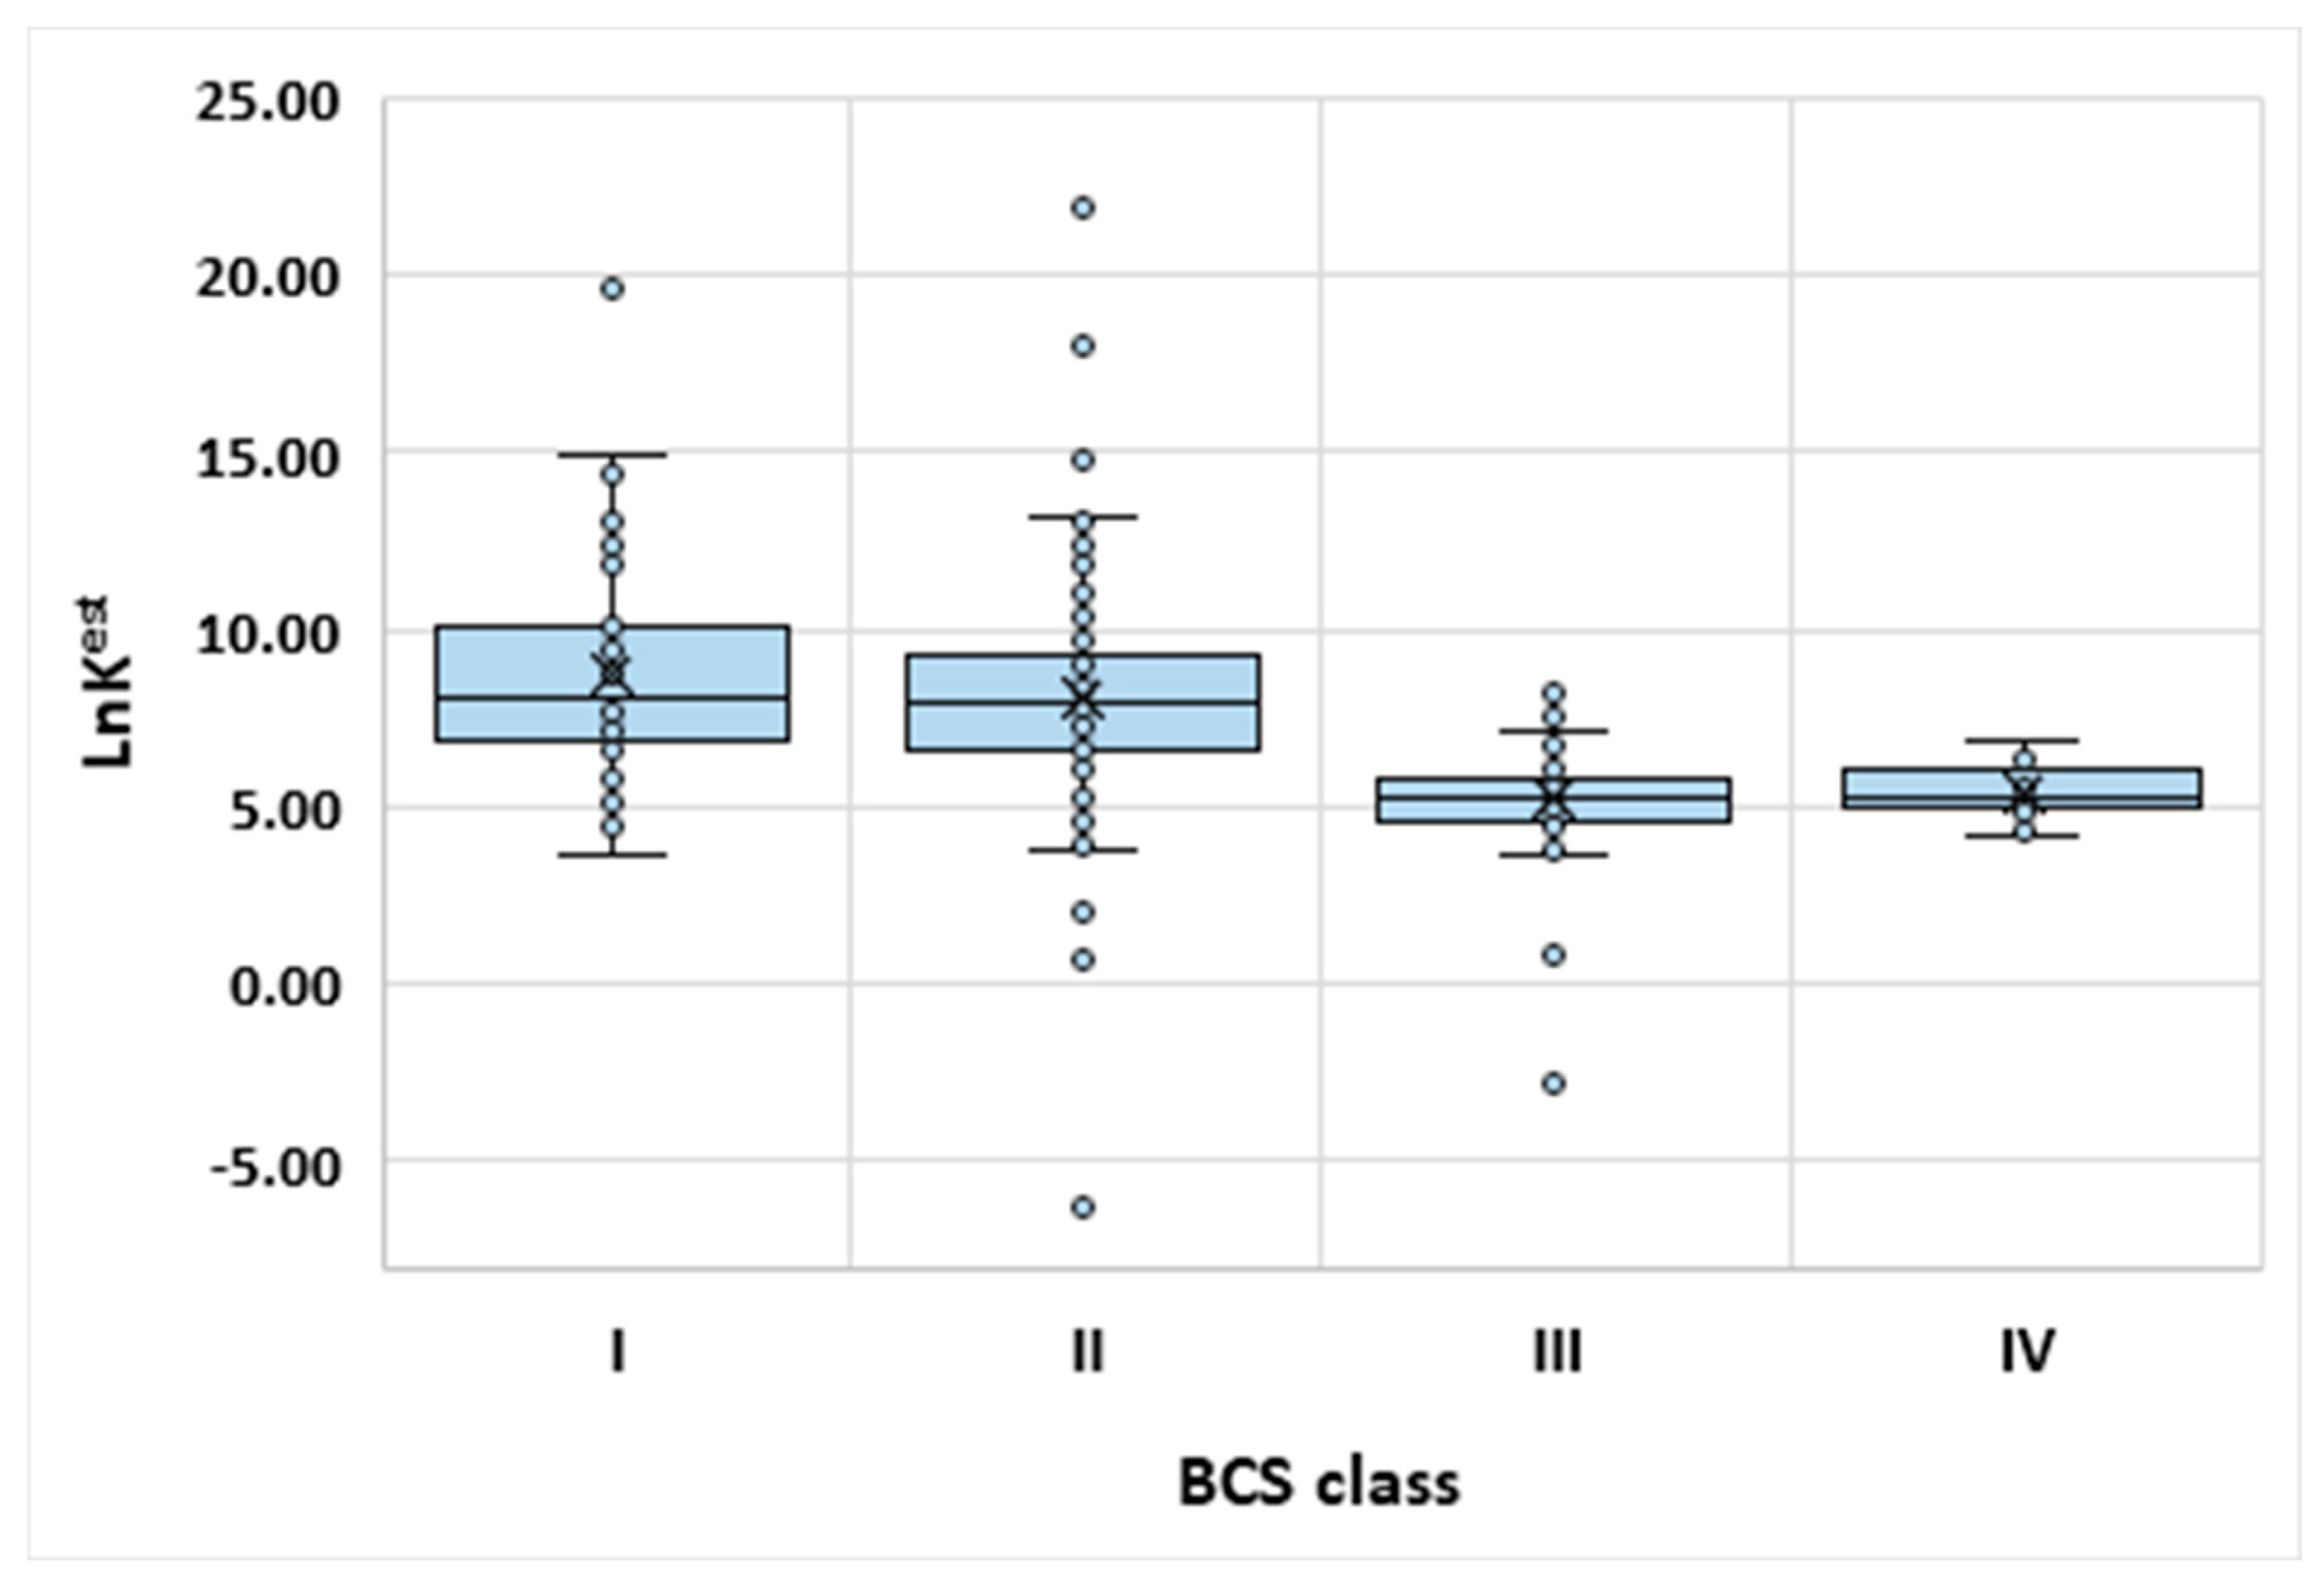
3.3. Exemplary Model Applications

The obvious application of the model provided by Equation (1) and Table 1 relates to its predictive power. Hence, it is possible to anticipate, before actual measurement, the probable affinity of the considered API toward β-CD. There is, of course, a limitation due to the applicability domain. For example, there are no organic and metalo-organic salts in the model. Hence, it is very unlikely that the model helps in situations where drugs are prepared in such forms. However, many drugs are, in principle, treatable by the model and at least the rational selection of the candidates for experimental measurements can be advised.
It is also possible to suggest alternative, less obvious applications of the formulated MARSplines model. For example, in the Biopharmaceutical Classification System (BCS) it is assumed that two measures such as solubility and permeability can be used for grouping drugs in respect of their bioavailability. In Table 3 this classification is shown [73]. Of note, cyclodextrins and their solubilizing abilities have been discussed in the context of BCS classification [74,75].
Hence, for proper bioavailability assessment, both water solubility and permeability must be known. It is interesting to see if there is any correlation between the BCS class of a given drug and its estimated affinity toward β-CD. For this purpose, information about the BCS classification was collected for 300+ drugs [76]. Those that are found to be outside of the applicability domain were excluded from the analysis. For the remaining drugs, the values of the molecular descriptors were collected. This, in turn, allowed for application of the MARSplines model and prediction of lnK values. The obtained results are presented in Figure 2 and Table S2. As can be seen from Figure 2, those APIs exhibiting good permeability (Class I and II) are characterized by higher affinity to cyclodextrin. This is understandable since the cyclodextrin cavity is rather hydrophobic, like for lipid biological barriers. The most important message coming from Figure 2 is that Class I and II have very similar distributions to each other and, at the same time, are distinct from Class III and IV. Indeed, application of a statistical non-parametrical test revealed that the medians are statistically the same (p = 0.27) for Class I and II but either combination with remaining classes reached statistical significance (p < 0.001). Similarly, the analysis of Classes III and IV versus the other two classes consistently confirms that low permeability can be distinguished from high values by predicted drug affinity to β-CD. In order to turn this qualitative conclusion into a practically useful formula, a second MARSplines model was formulated. However, the target of the modeling this time was the classification into low and high permeability cases. Hence, only one quantitative parameter was used for classification model formulation, namely, computed values of lnK. As a dependent value, the binary flag for permeability was declared. The obtained formulae are provided below:
ClassA = 0.1655   +   0.2510 × max ( 0 ;   LnK 4.8148 )   +   0.0734 × max ( 0 ;   4.8148 LnK )     0.2455 × max ( 0 ;   LnK 8.0157 )
ClassB = 0.8345     0.2510 × max ( 0 ;   LnK 4.8148 )     0.0734 × max ( 0 ;   4.8148 LnK )   +   0.2455 × max ( 0 ;   LnK 8.0157 )
If the value of the first equation for dependent variable ClassA is higher compared to the value provided by the second equation, then high permeability is predicted. This means that the analyzed drug belongs to Class I or II of the BCS. On the contrary situation, when ClassA < ClassB, then low permeability is predicted by the model and, consequently, the given drug should belong to Class III or IV of the BCS. It is interesting to note that such a simple model has quite an acceptable predictive power. Proper qualification of high permeability occurred in 88% of cases, with only 12% of misclassified drugs. The low permeability was classified with slightly lower precision of 73%, with 27% of failure. These observations indicate the potential applicability of binding constants for evaluating permeability.

4. Conclusions

Compounds exhibiting high symmetry, such as fullerenes or nanotubes, have been used in various branches of medicine and pharmacy, including drug delivery [77,78,79]. This also applies to cyclodextrins, which due to their specific shape features, have been widely used to increase API solubility. In this work, the QSPR model of the binding constant of different compounds to β-CD was developed based on the MARSplines methodology, and molecular descriptors were derived from the SMILES code. The internal and external validation indicated good accuracy of the model. The appearance of polarity-related descriptors, such as XlogP, indicated the hydrophobic nature of the cyclodextrin cavity, which is consistent with the nature of cyclodextrins. It is well known that the hydrophilicity/hydrophobicity of a drug can be used for evaluation of the drugs’ permeability. Therefore, the model was used for predicting affinity to β-CD of exemplary compounds belonging to different BCS classes. As was established, APIs exhibiting high permeability (I and II BCS Class) are generally characterized by higher lnK values than compounds revealing low permeability (class III and IV). This shows that β-CD complexation seems to offer an alternative for complex and expensive experimental permeability modeling studies.

Supplementary Materials

The following are available online at https://www.mdpi.com/2073-8994/11/7/922/s1, Table S1: Experimental and calculated LnK values, Table S2: LnK values predicted for compounds belonging to different classes according to Biopharmaceutical Classification System (BCS).

Author Contributions

Both authors contributed equally to the manuscript.

Funding

This research received no external funding.

Conflicts of Interest

The authors declare no conflict of interest.

References

  1. Wang, N.; Xie, C.; Hao, H.; Lu, H.; Lou, Y.; Su, W.; Guo, N. Cocrystal and its Application in the Field of Active Pharmaceutical Ingredients and Food Ingredients. Curr. Pharm. Des. 2018, 24, 2339–2348. [Google Scholar] [CrossRef]
  2. Korotkova, E.I.; Kratochvíl, B. Pharmaceutical Cocrystals. Procedia Chem. 2014, 10, 473–476. [Google Scholar] [CrossRef] [Green Version]
  3. Wang, Q.; Xue, J.; Hong, Z.; Du, Y. Pharmaceutical Cocrystal Formation of Pyrazinamide with 3-Hydroxybenzoic Acid: A Terahertz and Raman Vibrational Spectroscopies Study. Molecules 2019, 24, 488. [Google Scholar] [CrossRef] [PubMed]
  4. Cysewski, P.; Przybyłek, M. Selection of effective cocrystals former for dissolution rate improvement of active pharmaceutical ingredients based on lipoaffinity index. Eur. J. Pharm. Sci. 2017, 107, 87–96. [Google Scholar] [CrossRef] [PubMed]
  5. Przybyłek, M.; Ziółkowska, D.; Mroczyńska, K.; Cysewski, P. Applicability of Phenolic Acids as Effective Enhancers of Cocrystal Solubility of Methylxanthines. Cryst. Growth Des. 2017, 17, 2186–2193. [Google Scholar] [CrossRef]
  6. Sinha, A.S.; Maguire, A.R.; Lawrence, S.E. Cocrystallization of nutraceuticals. Cryst. Growth Des. 2015, 15, 984–1009. [Google Scholar] [CrossRef]
  7. Yang, R.; Xiao, C.F.; Guo, Y.F.; Ye, M.; Lin, J. Inclusion complexes of GA 3 and the plant growth regulation activities. Mater. Sci. Eng. C 2018, 91, 475–485. [Google Scholar] [CrossRef]
  8. Koontz, J.L.; Marcy, J.E.; Barbeau, W.E.; Duncan, S.E. Stability of Natamycin and Its Cyclodextrin Inclusion Complexes in Aqueous Solution. J. Agric. Food Chem. 2003, 51, 7111–7114. [Google Scholar] [CrossRef]
  9. Martina, K.; Binello, A.; Lawson, D.; Jicsinszky, L.; Cravotto, G. Recent Applications of Cyclodextrins as Food Additives and in Food Processing. Curr. Nutr. Food Sci. 2013, 9, 167–179. [Google Scholar] [CrossRef]
  10. Guo, C.; Zhang, H.; Wang, X.; Xu, J.; Liu, Y.; Liu, X.; Huang, H.; Sun, J. Crystal structure and explosive performance of a new CL-20/caprolactam cocrystal. J. Mol. Struct. 2013, 1048, 267–273. [Google Scholar] [CrossRef] [Green Version]
  11. Shen, J.P.; Duan, X.H.; Luo, Q.P.; Zhou, Y.; Bao, Q.; Ma, Y.J.; Pei, C.H. Preparation and characterization of a novel cocrystal explosive. Cryst. Growth Des. 2011, 11, 1759–1765. [Google Scholar] [CrossRef]
  12. Loftsson, T.; Brewster, M.E. Pharmaceutical applications of cyclodextrins. 1. Drug solubilization and stabilization. J. Pharm. Sci. 1996, 85, 1017–1025. [Google Scholar] [CrossRef]
  13. Tiwari, G.; Tiwari, R.; Rai, A. Cyclodextrins in delivery systems: Applications. J. Pharm. Bioallied Sci. 2010, 2, 72. [Google Scholar] [CrossRef] [PubMed]
  14. Archontaki, H.A.; Vertzoni, M.V.; Athanassiou-Malaki, M.H. Study on the inclusion complexes of bromazepam with β- and β-hydroxypropyl-cyclodextrins. J. Pharm. Biomed. Anal. 2002, 28, 761–769. [Google Scholar] [CrossRef]
  15. de Miranda, J.C.; Martins, T.E.A.; Veiga, F.; Ferraz, H.G. Cyclodextrins and ternary complexes: Technology to improve solubility of poorly soluble drugs. Brazilian J. Pharm. Sci. 2011, 47, 665–681. [Google Scholar] [CrossRef]
  16. Arima, H.; Yunomae, K.; Miyake, K.; Irie, T.; Hirayama, F.; Uekama, K. Comparative studies of the enhancing effects of cyclodextrins on the solubility and oral bioavailability of tacrolimus in rats. J. Pharm. Sci. 2001, 90, 690–701. [Google Scholar] [CrossRef] [PubMed]
  17. Rasheed, A.; Kumar C.K., A.; Sravanthi, V.V.N.S.S. Cyclodextrins as drug carrier molecule: A review. Sci. Pharm. 2008, 76, 567–598. [Google Scholar] [CrossRef]
  18. Arima, H.; Miyaji, T.; Irie, T.; Hirayama, F.; Uekama, K. Enhancing effect of hydroxypropyl-β-cyclodextrin on cutaneous penetration and activation of ethyl 4-biphenylyl acetate in hairless mouse skin. Eur. J. Pharm. Sci. 1998, 6, 53–59. [Google Scholar] [CrossRef]
  19. Shimpi, S.; Chauhan, B.; Shimpi, P. Cyclodextrins: application in different routes of drug administration. Acta Pharm. 2005, 55, 139–156. [Google Scholar] [PubMed]
  20. Sharma, N.; Baldi, A. Exploring versatile applications of cyclodextrins: An overview. Drug Deliv. 2016, 23, 739–757. [Google Scholar] [CrossRef]
  21. European Medicines Agencs. Cyclodextrins Used as Excipients Report; European Medicines Agencs: Amsterdam, The Netherlands, 2017.
  22. Numanoğlu, U.; Şen, T.; Tarimci, N.; Kartal, M.; Koo, O.M.Y.; Önyüksel, H. Use of cyclodextrins as a cosmetic delivery system for fragrance materials: Linalool and benzyl acetate. AAPS PharmSciTech 2008, 8, 34–42. [Google Scholar] [CrossRef] [PubMed]
  23. Buschmann, H. Eckhard Schollmeyer Applications of cyclodextrins in cosmetic products: A review. J. Cosmet. Sci. 2002, 53, 185. [Google Scholar] [PubMed]
  24. Tabushi, I. Cyclodextrin Catalysis as a Model for Enzyme Action. Acc. Chem. Res. 1982, 15, 66–72. [Google Scholar] [CrossRef]
  25. Macaev, F.; Boldescu, V. Cyclodextrins in asymmetric and stereospecific synthesis. Symmetry 2015, 7, 1699–1720. [Google Scholar] [CrossRef]
  26. D’Souza, V.T. Modification of cyclodextrins for use as artificial enzymes. Supramol. Chem. 2003, 15, 221–229. [Google Scholar] [CrossRef]
  27. Bicchi, C.; Balbo, C.; D’Amato, A.; Manzin, V.; Schreier, P.; Rozenblum, A.; Brunerie, P. Cyclodextrin derivatives in GC separation of racemic mixtures of volatiles - Part XIV: Some applications of thick-film wide-bore columns to enantiomer GC micropreparation. Hrc-J. High Resolut. Chromatogr. 1998, 21, 103–106. [Google Scholar] [CrossRef]
  28. Armstrong, D.W.; Ward, T.J.; Armstrong, R.D.; Beesley, T.E. Separation of drug stereoisomers by the formation of β-cyclodextrin inclusion complexes. Science 1986, 232, 1132–1135. [Google Scholar] [CrossRef] [PubMed]
  29. Przybyłek, M.; Cysewski, P. Distinguishing Cocrystals from Simple Eutectic Mixtures: Phenolic Acids as Potential Pharmaceutical Coformers. Cryst. Growth Des. 2018, 18, 3524–3534. [Google Scholar] [CrossRef]
  30. Steffen, A.; Karasz, M.; Thiele, C.; Lengauer, T.; Kämper, A.; Wenz, G.; Apostolakis, J. Combined similarity and QSPR virtual screening for guest molecules of β-cyclodextrin. New J. Chem. 2007, 31, 1941–1949. [Google Scholar] [CrossRef]
  31. Linden, L.; Goss, K.U.; Endo, S. 3D-QSAR predictions for α-cyclodextrin binding constants using quantum mechanically based descriptors. Chemosphere 2017, 169, 693–699. [Google Scholar] [CrossRef]
  32. Katritzky, A.R.; Fara, D.C.; Yang, H.; Karelson, M.; Suzuki, T.; Solov’ev, V.P.; Varnek, A. Quantitative Structure−Property Relationship Modeling of β -Cyclodextrin Complexation Free Energies. J. Chem. Inf. Comput. Sci. 2004, 44, 529–541. [Google Scholar] [CrossRef] [PubMed]
  33. Prakasvudhisarn, C.; Wolschann, P.; Lawtrakul, L. Predicting complexation thermodynamic parameters of β-cyclodextrin with chiral guests by using swarm intelligence and support vector machines. Int. J. Mol. Sci. 2009, 10, 2107–2121. [Google Scholar] [CrossRef] [PubMed]
  34. Pérez-Garrido, A.; Helguera, A.M.; Cordeiro, M.N.D.S.; Escudero, A.G. QSPR modelling with the topological substructural molecular design approach: β-cyclodextrin complexation. J. Pharm. Sci. 2009, 98, 4557–4576. [Google Scholar] [CrossRef] [PubMed]
  35. Rama Krishna, G.; Ukrainczyk, M.; Zeglinski, J.; Rasmuson, Å.C. Prediction of Solid State Properties of Cocrystals Using Artificial Neural Network Modeling. Cryst. Growth Des. 2018, 18, 133–144. [Google Scholar] [CrossRef]
  36. Zhokhova, N.I.; Bobkov, E.V.; Baskin, I.I.; Palyulin, V.A.; Zefirov, A.N.; Zefirov, N.S. Calculation of the stability of β-cyclodextrin complexes of organic compounds using the QSPR approach. Moscow Univ. Chem. Bull. 2007, 62, 269–272. [Google Scholar] [CrossRef]
  37. Blanford, W.J.; Gao, H.; Dutta, M.; Ledesma, E.B. Solubility enhancement and QSPR correlations for polycyclic aromatic hydrocarbons complexation with α, β, and γ cyclodextrins. J. Incl. Phenom. Macrocycl. Chem. 2014, 78, 415–427. [Google Scholar] [CrossRef]
  38. Mirrahimi, F.; Salahinejad, M.; Ghasemi, J.B. QSPR approaches to elucidate the stability constants between β-cyclodextrin and some organic compounds: Docking based 3D conformer. J. Mol. Liq. 2016, 219, 1036–1043. [Google Scholar] [CrossRef]
  39. Veselinović, A.M.; Veselinović, J.B.; Toropov, A.A.; Toropova, A.P.; Nikolić, G.M. In silico prediction of the β-cyclodextrin complexation based on Monte Carlo method. Int. J. Pharm. 2015, 495, 404–409. [Google Scholar] [CrossRef]
  40. Friedman, J.H. Multivariate Adaptive Regression Splines. Ann. Stat. 1991, 19, 1–67. [Google Scholar] [CrossRef]
  41. Przybyłek, M.; Recki, Ł.; Mroczyńska, K.; Jeliński, T.; Cysewski, P. Experimental and theoretical solubility advantage screening of bi-component solid curcumin formulations. J. Drug Deliv. Sci. Technol. 2019, 50, 125–135. [Google Scholar] [CrossRef]
  42. Przybyłek, M.; Jeliński, T.; Cysewski, P. Application of Multivariate Adaptive Regression Splines (MARSplines) for Predicting Hansen Solubility Parameters Based on 1D and 2D Molecular Descriptors Computed from SMILES String. J. Chem. 2019, 2019, 1–15. [Google Scholar] [CrossRef] [Green Version]
  43. Suzuki, T. A Nonlinear Group Contribution Method for Predicting the Free Energies of Inclusion Complexation of Organic Molecules with α- and β-Cyclodextrins. J. Chem. Inf. Comput. Sci. 2001, 41, 1266–1273. [Google Scholar] [CrossRef] [PubMed]
  44. Dong, J.; Cao, D.S.; Miao, H.Y.; Liu, S.; Deng, B.C.; Yun, Y.H.; Wang, N.N.; Lu, A.P.; Zeng, W.B.; Chen, A.F. ChemDes: An integrated web-based platform for molecular descriptor and fingerprint computation. J. Cheminform. 2015, 7. [Google Scholar] [CrossRef] [PubMed]
  45. Dong, J.; Yao, Z.J.; Wen, M.; Zhu, M.F.; Wang, N.N.; Miao, H.Y.; Lu, A.P.; Zeng, W.B.; Cao, D.S. BioTriangle: A web-accessible platform for generating various molecular representations for chemicals, proteins, DNAs/RNAs and their interactions. J. Cheminform. 2016, 8. [Google Scholar] [CrossRef] [PubMed]
  46. ChemDes. Available online: http://www.scbdd.com/chemdes/ (accessed on 1 June 2019).
  47. BioTriangle. Available online: http://biotriangle.scbdd.com (accessed on 1 June 2019).
  48. Ballabio, D.; Consonni, V.; Mauri, A.; Claeys-Bruno, M.; Sergent, M.; Todeschini, R. A novel variable reduction method adapted from space-filling designs. Chemom. Intell. Lab. Syst. 2014, 136, 147–154. [Google Scholar] [CrossRef]
  49. Ambure, P.; Aher, R.B.; Gajewicz, A.; Puzyn, T.; Roy, K. “NanoBRIDGES” software: Open access tools to perform QSAR and nano-QSAR modeling. Chemom. Intell. Lab. Syst. 2015, 147, 1–13. [Google Scholar] [CrossRef]
  50. Kennard, R.W.; Stone, L.A. Computer Aided Design of Experiments. Technometrics 1969, 11, 137–148. [Google Scholar] [CrossRef]
  51. Martin, T.M.; Harten, P.; Young, D.M.; Muratov, E.N.; Golbraikh, A.; Zhu, H.; Tropsha, A. Does rational selection of training and test sets improve the outcome of QSAR modeling? J. Chem. Inf. Model. 2012, 52, 2570–2578. [Google Scholar] [CrossRef]
  52. QSAR Model Development Using DTC Lab. Software Tools. Available online: http://teqip.jdvu.ac.in/QSAR_Tools/ (accessed on 1 June 2019).
  53. Statsoft. Statistica; Version 12; StatSoft: Tulsa, OK, USA, 2012. [Google Scholar]
  54. Gramatica, P.; Cassani, S.; Chirico, N. QSARINS-chem: Insubria datasets and new QSAR/QSPR models for environmental pollutants in QSARINS. J. Comput. Chem. 2014, 35, 1036–1044. [Google Scholar] [CrossRef]
  55. Gramatica, P.; Chirico, N.; Papa, E.; Cassani, S.; Kovarich, S. QSARINS: A new software for the development, analysis, and validation of QSAR MLR models. J. Comput. Chem. 2013, 34, 2121–2132. [Google Scholar] [CrossRef]
  56. QSAR Research Unit in Environmental Chemistry and Ecotoxicology. Available online: http://www.qsar.it/ (accessed on 1 June 2019).
  57. Przybyłek, M.; Jeliński, T.; Słabuszewska, J.; Ziółkowska, D.; Mroczyńska, K.; Cysewski, P. Application of Multivariate Adaptive Regression Splines (MARSplines) Methodology for Screening of Dicarboxylic Acid Cocrystal Using 1D and 2D Molecular Descriptors. Cryst. Growth Des. 2019. [Google Scholar] [CrossRef]
  58. Todeschini, R. Data correlation, number of significant principal components and shape of molecules. The K correlation index. Anal. Chim. Acta 1997, 348, 419–430. [Google Scholar] [CrossRef]
  59. Todeschini, R.; Consonni, V.; Maiocchi, A. The K correlation index: Theory development and its application in chemometrics. Chemom. Intell. Lab. Syst. 1999, 46, 13–29. [Google Scholar] [CrossRef]
  60. Stanton, D.T.; Jurs, P.C. Development and Use of Charged Partial Surface Area Structural Descriptors in Computer-Assisted Quantitative Structure-Property Relationship Studies. Anal. Chem. 1990, 62, 2323–2329. [Google Scholar] [CrossRef]
  61. Labute, P. A widely applicable set of descriptors. J. Mol. Graph. Model. 2000, 18, 464–477. [Google Scholar] [CrossRef]
  62. Hall, L.H.; Mohney, B.; Kier, L.B. The Electrotopological State: Structure Information at the Atomic Level for Molecular Graphs. J. Chem. Inf. Comput. Sci. 1991, 31, 76–82. [Google Scholar] [CrossRef]
  63. Hall, L.H.; Kier, L.B. The Molecular Connectivity Chi Indexes and Kappa Shape Indexes in Structure-Property Modeling. Rev. Comput. Chem. 1991, 2, 367–422. [Google Scholar]
  64. Noolvi, M.N.; Patel, H.M. A comparative QSAR analysis and molecular docking studies of quinazoline derivatives as tyrosine kinase (EGFR) inhibitors: A rational approach to anticancer drug design. J. Saudi Chem. Soc. 2013, 17, 361–379. [Google Scholar] [CrossRef] [Green Version]
  65. Ji, H.F.; Kong, D.X.; Shen, L.; Chen, L.L.; Ma, B.G.; Zhang, H.Y. Distribution patterns of small-molecule ligands in the protein universe and implications for origin of life and drug discovery. Genome Biol. 2007, 8. [Google Scholar] [CrossRef]
  66. Bhatiya, R.; Vaidya, A.; Kashaw, S.K.; Jain, A.K.; Agrawal, R.K. QSAR analysis of furanone derivatives as potential COX-2 inhibitors: kNN MFA approach. J. Saudi Chem. Soc. 2014, 18, 977–984. [Google Scholar] [CrossRef] [Green Version]
  67. Veerasamy, R.; Subramaniam, D.K.; Chean, O.C.; Ying, N.M. Designing hypothesis of substituted benzoxazinones as HIV-1 reverse transcriptase inhibitors: QSAR approach. J. Enzyme Inhib. Med. Chem. 2012, 27, 693–707. [Google Scholar] [CrossRef]
  68. Ajmani, S.; Janardhan, S.; Viswanadhan, V.N. Toward a general predictive QSAR model for gamma-secretase inhibitors. Mol. Divers. 2013, 17, 421–434. [Google Scholar] [CrossRef]
  69. Todeschini, R.; Consonni, V. Molecular Descriptors for Chemoinformatics: Volume 1&2; Wiley-VCH Verlag GmbH & Co. KGaA: Weinheim, Germany, 2009; ISBN 978-3-527-31852-0. [Google Scholar]
  70. Wen, X.; Tan, F.; Jing, Z.; Liu, Z. Preparation and study the 1:2 inclusion complex of carvedilol with β-cyclodextrin. J. Pharm. Biomed. Anal. 2004, 34, 517–523. [Google Scholar] [CrossRef]
  71. Kano, K.; Nishiyabu, R.; Asada, T.; Kuroda, Y. Static and dynamic behavior of 2:1 inclusion complexes of cyclodextrins and charged porphyrins in aqueous organic media. J. Am. Chem. Soc. 2002, 124, 9937–9944. [Google Scholar] [CrossRef] [PubMed]
  72. Frixa, C.; Scobie, M.; Black, S.J.; Thompson, A.S.; Threadgill, M.D. Formation of a remarkably robust 2:1 complex between β-cyclodextrin and a phenyl-substituted icosahedral carborane. Chem. Commun. 2002, 2, 2876–2877. [Google Scholar] [CrossRef]
  73. U.S. Food and Drug Administration The Biopharmaceutics Classification System (BCS) Guidance. Available online: https://www.fda.gov/ (accessed on 1 June 2019).
  74. Loftsson, T. Cyclodextrins and the biopharmaceutics classification system of drugs. J. Incl. Phenom. 2002, 44, 63–67. [Google Scholar] [CrossRef]
  75. Loftsson, T. Drug permeation through biomembranes: Cyclodextrins and the unstirred water layer. Pharmazie 2012, 67, 363–370. [Google Scholar]
  76. Dahan, A.; Wolk, O.; Kim, Y.H.; Ramachandran, C.; Crippen, G.M.; Takagi, T.; Bermejo, M.; Amidon, G.L. Purely in silico BCS classification: Science based quality standards for the world’s drugs. Mol. Pharm. 2013, 10, 4378–4390. [Google Scholar] [CrossRef]
  77. Xiao, D.; Pham-Huy, L.A.; Pham-Huy, C.; Dramou, P.; He, H.; Zuo, P. Carbon Nanotubes: Applications in Pharmacy and Medicine. Biomed Res. Int. 2013, 2013, 1–12. [Google Scholar] [Green Version]
  78. Singh, I.; Rehni, A.K.; Kumar, P.; Kumar, M.; Aboul-Enein, H.Y. Carbon Nanotubes: Synthesis, Properties and Pharmaceutical Applications. Fullerenes Nanotub. Carbon Nanostruct. 2009, 17, 361–377. [Google Scholar] [CrossRef]
  79. Szefler, B. Nanotechnology, from quantum mechanical calculations up to drug delivery. Int. J. Nanomed. 2018, 13, 6143–6176. [Google Scholar] [CrossRef]
Figure 1. The relationship between experimental and calculated values of binding constants.
Symmetry 11 00922 g001
Figure 2. The distributions of affinity of APIs to β-CD as a function of BCS classification.
Symmetry 11 00922 g002
Table 1. Multivariate adaptive regression splines (MARSplines) model parameters along with the validation results.
FactorβiaiBasis Functions
F0 5.4277
F1−0.3991−1.2679max(0; 28.1940-Chiv1plusChiv1)
F20.56521.1090max(0; XLogP+0.1340)
F30.37721.3356max(0; carbonTypes.8)
F4−0.1559−1.4658max(0; 0.5620-MLFER_A)
F5−0.1613−1.3482max(0; Wlambda2.unity-1.2400)
F6−0.1391−0.3182max(0; 1.2400-Wlambda2.unity)
F7−0.2130−2.5385max(0; XLogP+0.1340)∙max(0;-15.8078-PNSA-3)
F8−0.1372−0.0120max(0; 66.0412- AATS6m)∙max(0; MLFER_A -0.5620)
F9−0.0977−0.0003max(0; PEOEVSA9*PEOEVSA9-988.3780)∙max(0; XLogP +0.1340)
F10−0.1258−0.0002max(0; 988.378- PEOEVSA9*PEOEVSA9)∙max(0; XLogP +0.1340)
F110.09100.0257max(0; Wlambda2.unity -1.2400)∙max(0; AATS4i-154.1756)
F120.09440.2092max(0; Wlambda2.unity -1.2400)∙max(0; 154.1756- AATS4i)
Model statistics: internal validation (MAECV = 0.51, RMSECV = 0.65, Q2LOO = 0.90, Q2LMO = 0.90, PRESSCV = 99.00), fitting criteria (N = 187, R2 = 0.91, Radj2 = 0.91, MAEtr = 0.61, RMSEtr = 0.48, F = 189.45, SD = 0.63, Kxx = 0.35) and external validation (training set: MAE = 0.49, MAPE = 15.4%, test set: MAE = 0.44, MAPE = 9.3%).
Table 2. Comparison of determination coefficients of beta-cyclodextrin (β-CD) binding constants.
Model DescriptionR2Source
Training SetTest Set
MARSplines0.910.94This work
Molecular docking-based descriptors0.830.83[37]
Monte Carlo optimised topological descriptors0.920.93[38]
Table 3. Biopharmaceutical Classification System (BCS) [73] using solubility and permeability as qualitative criterions.
High SolubilityLow Solubility
High permeabilityClass I
This class comprise compounds characterized by good absorption profiles.
Class II
The bioavailability is directly related to the dissolution behavior.
Low permeabilityClass III
The active pharmaceutical ingredient (API) is soluble, however absorption profile is dependent on limited permeation behavior.
Class IV
The API is characterized by very low bioavailability.

