The Influence of a Network’s Spatial Symmetry, Topological Dimension, and Density on Its Percolation Threshold


Abstract
1. Introduction
2. Percolation Properties of Network Structures and their Invariance
2.1. Theoretical Methods within Percolation Theory
- (1)
- Find the distribution by size for clusters of blocked nodes within the network structure at a given probability of blocking the nodes.
- (2)
- Assess statistical characteristics of clusters, for example, the average size of clusters of blocked nodes within the network structure.
- (3)
- Explore how the percolation threshold value of the network structure depends on the density of the network (average number of links per node), as well as a number of other issues.
2.2. Numerical Methods for Defining Percolation Thresholds
- Randomly select two nodes, A and B, taking into account a restriction that there is at least one intermediate node between them.
- Set a probability of blocking a single node (for the node problem) or a link (for the link problem), and randomly block the proportion of network nodes (or links) that is equal to this probability.
- Check if there is at least one “free” path in the network (a path formed by non-excluded nodes or links) from node A to node B. If at least one of the nodes A or B is excluded, then there is no free path (number of "free" paths is 0). Otherwise, write 1.
- Increase the value of probability of blocking a single node (for the node problem) or link (for the link problem) by some value and randomly block the proportion of network nodes (or links) equal to the specified probability value. Then, define which specific network nodes were blocked.
- Go back to step 3 until all nodes of the network are moved.
- Return to item № 2 and perform items № 3–№ 5—Q times (e.g., several hundred times) from the first to the last step (in cases where the entire network is blocked), for all experiments. Find the number of times in which at least one “free” path was found (let this number be ξ). For example, say at step h = 18, in 8, 12, 19, 56, 58, 76, 80 and 89 experiments of Q, at least one “free” path was found, then number ξ(5) = 18 (8 is the total number of “free” paths). Find value ρ (h) = ξ(h)/Q for each step, where h is step number. Calculate the average size of blocked node clusters, the number of such clusters, etc. (for all N experiments at each step). The average cluster size can be defined as the ratio of the sum of all average values obtained at this clustering step (for all Q experiments) to the total number of experiments Q. For clarification, let us consider an example. Given that, for h = 6 steps, 4 clusters comprising 15 nodes were found in the 1st experiment, in the 2nd 3 clusters were found, in the 3rd 2 clusters were found, etc., and in the 100th experiment, 20 clusters were found. Then the average number of clusters with a size of 10 blocked nodes will be equal to: (4 + 3 + 2 + … + 5)/100.
- Then, go back to item № 1 and repeat once more steps № 2–№ 6 W times. For each of the W experiment values, will be found. The W index defines which of the W tests we consider.
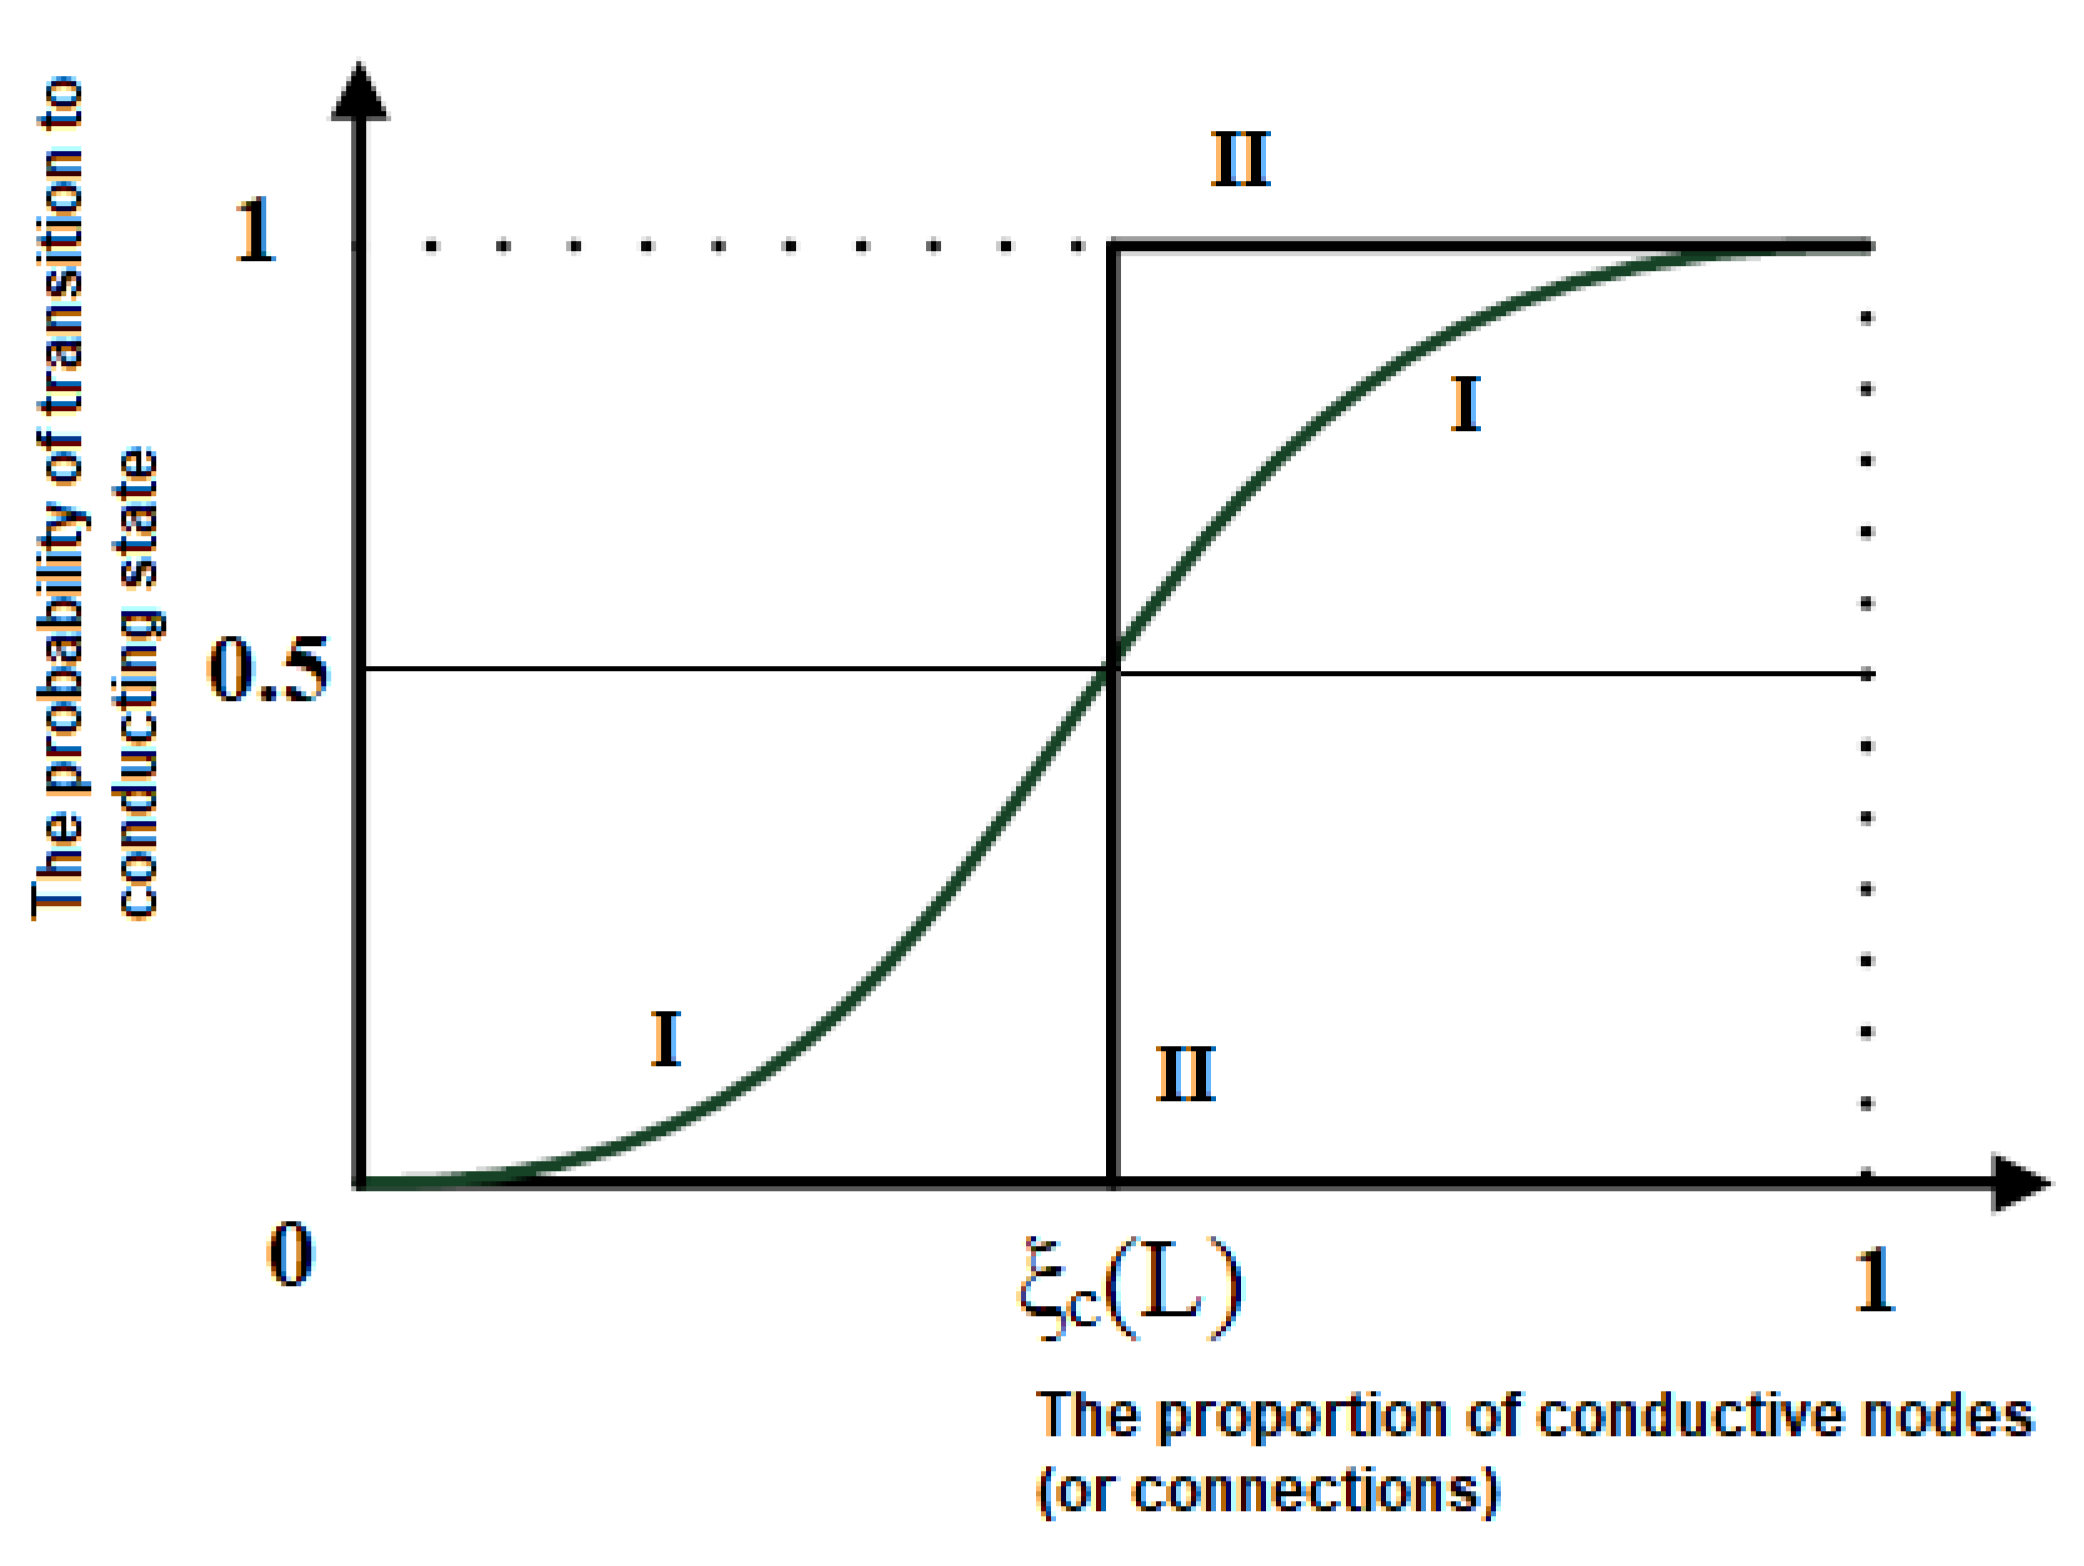
- After the simulation, for each h step, find a value —the average value of probability of information transmission through the network as a whole using non-blocked nodes at each step (considering different possible configurations of all paths). Build graphical dependences of the average value of the probability that data or information will pass through the network as a whole on the proportion of blocked network nodes.
3. Dependence of Percolation Properties of Network Structures on Density, Symmetry Groups, and Topological Dimension
- (1)
- Neumann’s Principle: the symmetry elements of any physical property of a crystal (including network structures) should contain symmetry elements of their point group [46].
- (2)
- Pierre Curie’s symmetry (dissymmetry) principle [46]: at the superposition of several phenomena of different nature, each of which having own symmetry, only matching elements of symmetry of these phenomena will be preserved in the same system. This principle can be written as: , where symmetry of the cause is described by group G1, and symmetry of the consequence by group G2.
3.1. D and 3D Networks with Regular Structures
3.2. D and 3D Random Structure Networks
- (1)
- Set the number of nodes N and number of links E.
- (2)
- Generate the S list consisting of N nodes with random coordinates (x, y).
- (3)
- Select the n0 node with the smallest x–coordinates; if there are several such nodes, then select the node with the largest y–coordinate.
- (4)
- Sort the S list of nodes by increasing distance L from node n0:
- (5)
- Combine the first three nodes from S list into the first triangle by adding edges. Passing the nodes clockwise, beginning from the edge between the first and second nodes of the list, add the edges of the triangle to the cyclical list H.
- (6)
- Sequentially process all nodes from the S list.
- Find the first raw node ni.
- In the H list, take the last edge V whose nodes na and nb together with ni form a left turn (the following condition is satisfied:
- Among the H edges, find the first edge VL which does not satisfy the left turn condition (located before the edge V to the left of it).
- Among the H edges, find the first edge VR which does not satisfy the left turn condition (located after the edge V to the right of it).
- Sequentially process the edges in the H list between VL and VR. Each of these edges together with ni node forms a new triangle by adding new edges between them.
- Remove from the H list all edges between VL and VR.
- From the first added triangle, find the edge between ni and point of the edge that is not included in the next processed triangle and add it to the H list.
- From the last added triangle, find the edge between ni and point of the edge that is not included in the previous processed triangle and add it to the H list.
- (7)
- Remove edges from the current graph until their number is equal to E. Choose edges randomly, but remove them only if there is a path between the nodes of this edge even without this edge.
- (1)
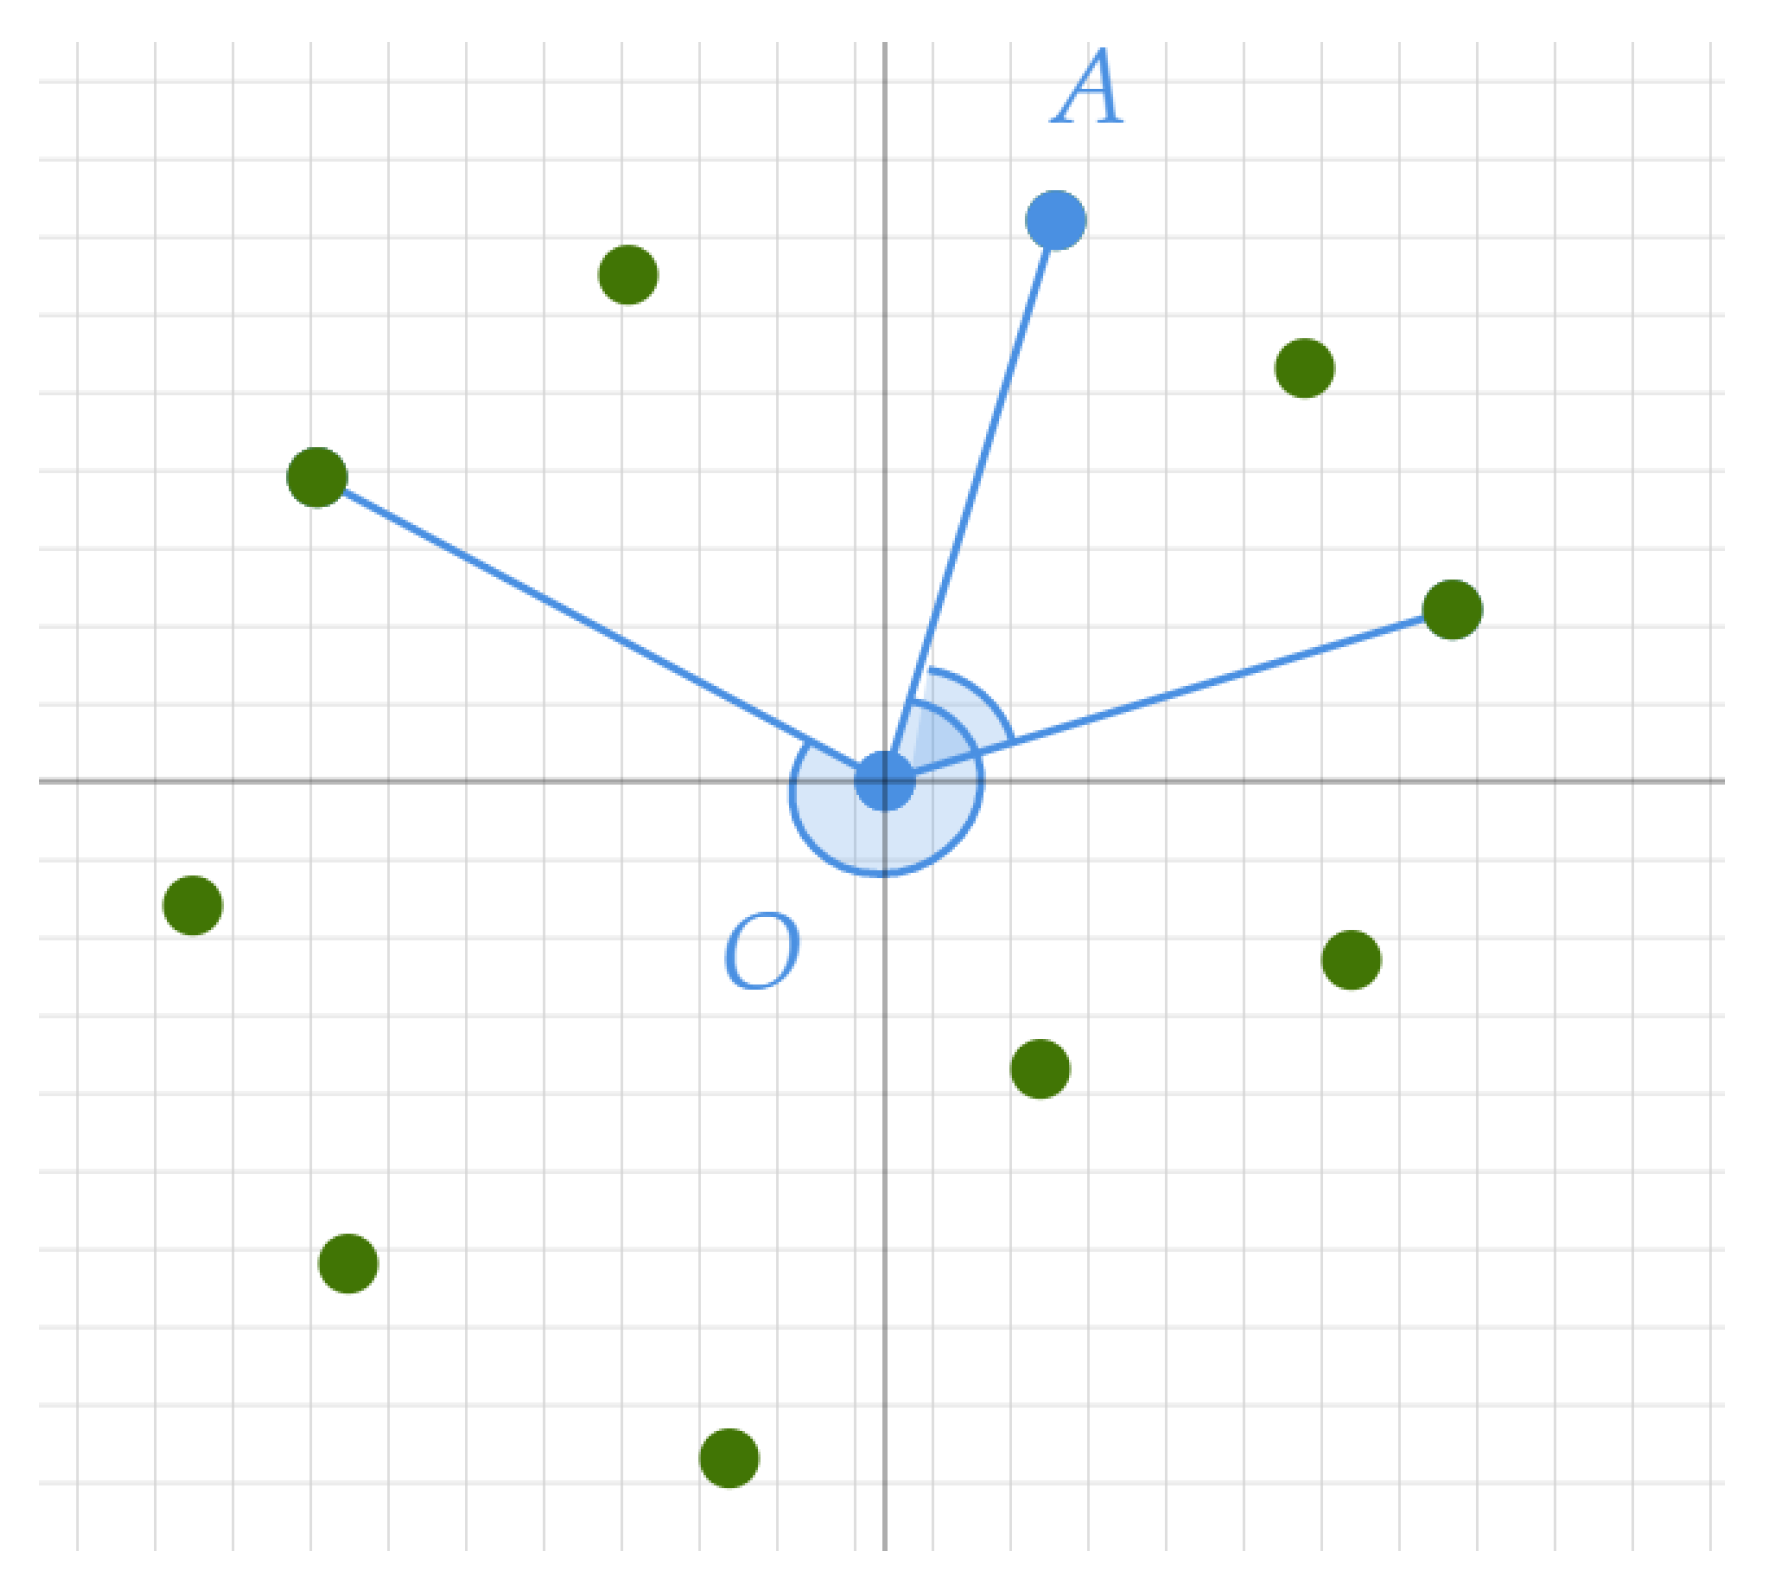
- Find the center of the polygon.
- (2)
- Shift all vertices so that the center is at the root of coordinates.
- (3)
- Find a reference point (for example, radius vector OA = (0, 1) see Figure 4).
- (4)
- Assess angles between vectors from the center to each vertex and OA (the angles should be within the range [0‒360)).
- (5)
- Sort the angles from smallest to largest.
3.3. Analysis of Percolation Threshold Values for Regular 2D and 3D Structures and Selection of Components Responsible for Symmetry Elements
4. Discussion
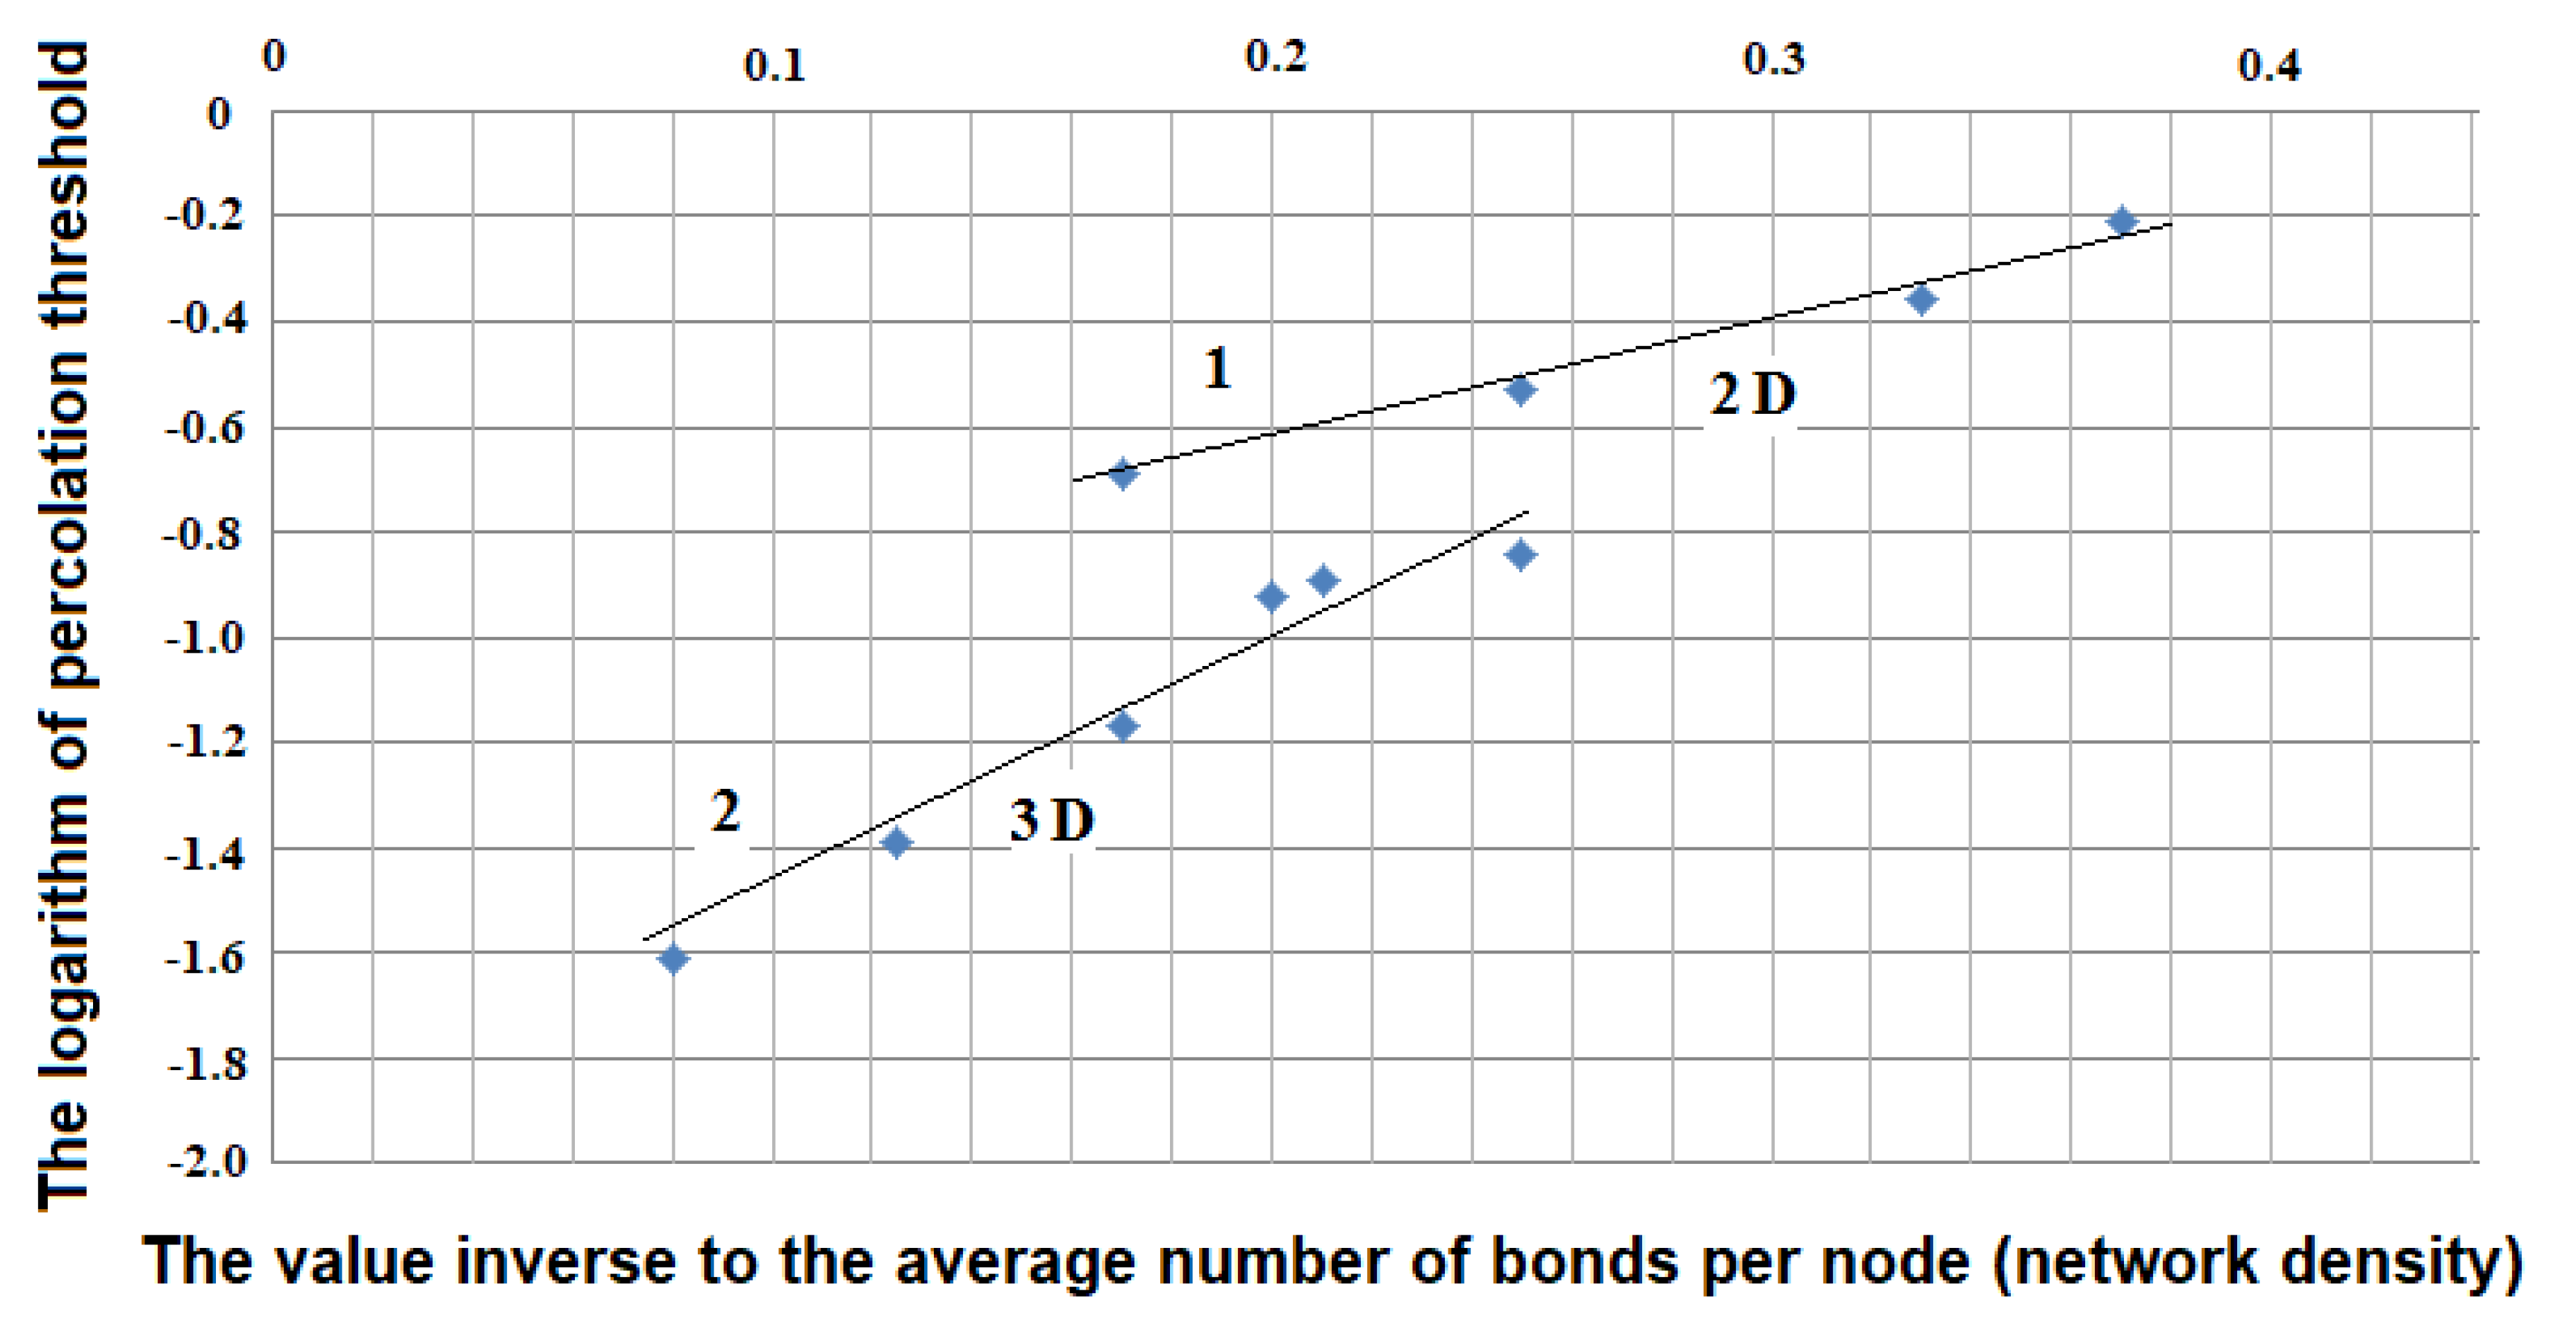
- At the same density of links, 3D networks have smaller percolation threshold values than 2D ones. Regardless of the type of network and symmetry, at the transition from 2D to 3D structures, the percolation threshold changes to the value equal to exp{–(d − 1)}, where d = topological dimension (this value for any network is invariant at the transition between structures). Thus, an increase in topological dimension by one unit reduces the percolation threshold value of the networks and increases the potential for information transmission.
- For random planar (2D) structures, the percolation threshold value, at the same network density, is less than for 2D structures with symmetry. Thus, for 2D structures, the presence of symmetry leads to an increase in the required proportion of nodes at which information conductivity will occur.
- If 2D or 3D networks have structures which can be transformed (transformed into each other) by deformation (elongation or contraction) without breaking and forming new links, they have the same percolation threshold. There is symmetry of similarity (A.V. Shubnikov), in which not only truly equal figures are symmetrical, but also all those which are similar to them. Thus, the presence of some elements of symmetry contributes to the percolation threshold value, certain others do not.
- The presence of axes of symmetry and corresponding number of planes of symmetry in which they lie affects the percolation threshold value. A third-order axis with three planes of symmetry has an increased invariant (which is preserved for structures of any kind) of the percolation threshold by a value of 0.02 units. At the transition to a fourth-order axis with four planes of symmetry, this invariant increases by 0.03 units, and at the transition from a fourth-order axis to a sixth-order axis, it increases by 0.03 units more. Thus, the transition between the orders of the axes of symmetry, in the presence of corresponding planes of symmetry, has an invariant which contributes to the percolation threshold value.
- Percolation analyses of regular 2D structures show that the presence of inversion centers in symmetry elements reduces the percolation threshold value. Moreover, the greater the number of pairs of the structure elements which have inversion, the more the presence of such centers of symmetry contribute to the fraction of the percolation threshold. However, if the center of symmetry lies in the plane of mirror symmetry separating 3D structure layers, the mutual presence of this group of symmetry elements will not affect the percolation threshold value. This corresponds to Curie’s dissymmetry principle (upon superposition of several phenomena of different natures, each of which having its own symmetry, only matching elements of symmetry of these phenomena will be preserved in the same system), since, in this case, the center of inversion performs the same role as the plane of mirror symmetry.
- The numerical values of percolation threshold fractions (see Table 3), resulting from the influence of symmetry elements, show that, in general, the presence of spatial symmetry and density of networks has a stronger influence on the percolation threshold value in 2D structures than in 3D ones.
5. Further Activities
Author Contributions
Funding
Acknowledgments
Conflicts of Interest
References
- Dresselhaus, M.S.; Dresselhaus, G.; Jorio, A. Group Theory Application to the Physics of Condensed Matter; Springer: Berlin/Heidelberg, Germany, 2008. [Google Scholar]
- Cracknell, A.; Bradley, C. The Mathematical Theory of Symmetry in Solids: Representation Theory for Point Groups and Space Groups; Oxford University Press: Oxford, UK, 2010. [Google Scholar]
- Gross, D.J. The role of symmetry in fundamental physics. Proc. Natl. Acad. Sci. USA 1996, 93, 14256–14259. [Google Scholar] [CrossRef] [PubMed]
- Neher, R.A.; Mecke, K.; Wagner, H. Topological estimation of percolation thresholds. J. Stat. Mech. Theory Exp. 2008, 2008, P01011. [Google Scholar] [CrossRef]
- Shang, Y. Vulnerability of networks: Fractional percolation on random graphs. Phys. Rev. E 2014, 89, 012813. [Google Scholar] [CrossRef] [PubMed]
- Shang, Y. Unveiling robustness and heterogeneity through percolation triggered by random-link breakdown. Phys. Rev. E 2014, 90, 032820. [Google Scholar] [CrossRef] [PubMed]
- Shang, Y.-L. Local Natural Connectivity in Complex Networks. Chin. Phys. Lett. 2011, 28, 068903. [Google Scholar] [CrossRef]
- Sykes, M.F.; Essam, J.W. Some exact critical percolation probabilities for site and bond problems in two dimensions. Phys. Rev. Lett. 1963, 10, 3–4. [Google Scholar] [CrossRef]
- Ziff, R.M.; Scullard, C.R.; Wierman, J.C.; Sedlock, M.R.A. The critical manifolds of inhomogeneous bond percolation on bow-tie and checkerboard lattices. J. Phys. A Math. Theor. 2012, 45, 494005. [Google Scholar] [CrossRef]
- Haji-Akbari, A.; Ziff, R.M. Percolation in networks with voids and bottlenecks. Phys. Rev. E 2009, 79, 021118. [Google Scholar] [CrossRef]
- Jacobsen, J.L. High-precision percolation thresholds and Potts-model critical manifolds from graph polynomials. J. Phys. A Math. Theor. 2014, 47, 135001. [Google Scholar] [CrossRef]
- Frisch, H.L.; Gordon, S.B.; Hammersley, J.M.; Vyssotsky, V.A. Monte Carlo solution of bond percolation processes in various crystal lattices. Bell Syst. Tech. J. 1962, 41, 909–920. [Google Scholar] [CrossRef]
- Frisch, H.L.; Hammersley, J.M.; Welsh, D.J.A. Monte Carlo estimates of percolation probabilities for various lattices. Phys. Rev. 1962, 126, 949–951. [Google Scholar] [CrossRef]
- Stauffer, D.; Hehl, F.W.; Ito, N. Computer Simulation and Computer Algebra; Springer: Berlin/Heidelberg, Germany, 1993. [Google Scholar]
- Gao, J.; Buldyrev, S.V.; Stanley, H.E.; Xu, X.; Havlin, S. Percolation of a general network of networks. Phys. Rev. E 2013, 88, 062816. [Google Scholar] [CrossRef] [PubMed]
- Grimmet, G. Percolation, 2nd ed.; Springer: Berlin/Heidelberg, Germany, 1989. [Google Scholar]
- Sahimi, M. Applications of Percolation Theory; Tailor & Francis: London, UK, 1992. [Google Scholar]
- Stauffer, D.; Aharony, A. Introduction to Percolation Theory; Tailor & Francis: London, UK, 1992. [Google Scholar]
- Feder, J. Fractals; Plenum Press: New York, NY, USA; London, UK, 1988. [Google Scholar]
- Tarasevich, Y.Y. Perkolyaciya: Teoriya, Prilozheniya, Algoritmy [Percolation: Theory, Applications, Algorithms]; Yeditorial URSS: Moskow, Russia, 2012. (In Russian) [Google Scholar]
- Mizutaka, S.; Tanizawa, T. Robustness analysis of bimodal networks in the whole range of degree correlation. Phys. Rev. E 2016, 94, 022308. [Google Scholar] [CrossRef]
- De Brito, J.B.; Sampaio Filho, C.I.N.; Moreira, A.A.; Andrade, J.S. Characterizing the intrinsic correlations of scale-free networks. Int. J. Mod. Phys. C 2016, 27, 1650024. [Google Scholar] [CrossRef]
- Timonin, P.N. Statistical mechanics of high-density bond percolation. Phys. Rev. E 2018, 97, 052119. [Google Scholar] [CrossRef] [PubMed]
- Zhou, A.; Maletić, S.; Zhao, Y. Robustness and percolation of holes in complex networks. Phys. A Stat. Mech. Its Appl. 2018, 502, 459–468. [Google Scholar] [CrossRef]
- Bagnoli, F.; Bellini, E.; Massaro, E.; Rechtman, R. Percolation and internet science (Review). Future Internet 2019, 11, 35. [Google Scholar] [CrossRef]
- Katzav, E.; Biham, O.; Hartmann, A.K. Distribution of shortest path lengths in subcritical Erdos-Rényi networks. Phys. Rev. E 2018, 98, 012301. [Google Scholar] [CrossRef]
- Shang, Y. Modeling epidemic spread with awareness and heterogeneous transmission rates in networks. J. Biol. Phys. 2013, 39, 489–500. [Google Scholar] [CrossRef]
- Lesko, S.A.; Alyoshkin, A.S.; Filatov, V.V. Stochastic and percolating models of blocking computer networks dynamics during distribution of epidemics of evolutionary computer viruses. Rossiyskiy Tekhnologicheskiy Zhurnal (Russ. Technol. J.) 2019, 7, 7–27. (In Russian) [Google Scholar] [CrossRef]
- Hunt, A.G.; Yu, F. The fractals of percolation theory in the geosciences (Book Chapter). In Fractals: Concepts and Applications in Geosciences; CRC Press: Boca Raton, FL, USA, 2017; pp. 114–152. [Google Scholar]
- Berkowitz, B.; Ewing, R.P. Percolation theory and network modeling applications in soil physics. Surv. Geophys. 1998, 19, 23–72. [Google Scholar] [CrossRef]
- Rubie, D.C.; Jacobson, S.A. Mechanisms and Geochemical Models of Core Formation (Book Chapter). In Deep Earth: Physics and Chemistry of the Lower Mantle and Core; John Wiley & Sons, Inc.: New York, NY, USA, 2016; pp. 181–190. [Google Scholar]
- Zhukov, D.; Khvatova, T.; Lesko, S.; Zaltsman, A. Managing social networks: Applying the Percolation theory methodology to understand individuals’ attitudes and moods. Technol. Forecast. Soc. Chang. 2018, 123, 234–245. [Google Scholar] [CrossRef]
- Zhukov, D.O.; Khvatova, T.Y.; Lesko, S.A.; Zaltsman, A.D. The influence of the connections density on clusterisation and percolation threshold during information distribution in social networks. Informatika Primeneniya (Inform. Appl.) 2018, 12, 90–97. [Google Scholar]
- Khvatova, T.Y.; Zaltsman, A.D.; Zhukov, D.O. Information processes in social networks: Percolation and stochastic dynamics. In Proceedings of the CEUR Workshop Proceedings 2nd International Scientific Conference “Convergent Cognitive Information Technologies”, Convergent 2017, Moscow, Russia, 24–26 November 2017; Volume 2064, pp. 277–288. [Google Scholar]
- Gallyamov, S.R. A passing threshold of a simple cubic lattice in the site problem of Bethe lattice model. Vestnik Udmurtskogo Universiteta Matematika Mekhanika Komp’yuternye Nauki 2008, 3, 109–115. (In Russian) [Google Scholar] [CrossRef]
- Gallyamov, S.R.; Mel’chukov, S.A.E. On one method of calculationg percolation thresholds for square and diamond lattices in the percolation problem of knots. Vestnik Udmurtskogo Universiteta Matematika Mekhanika Komp’yuternye Nauki. 2009, 4, 33–44. (In Russian) [Google Scholar] [CrossRef]
- Gallyamov, S.R.; Mel’chukov, S.A.E. Hodge’s idea in percolation percolation threshold estimation by the unit cell. Vestnik Udmurtskogo Universiteta Matematika Mekhanika Komp’yuternye Nauki. 2011, 4, 60–79. (In Russian) [Google Scholar] [CrossRef]
- Frisch, H.L.; Hammersley, J.M. Percolation Processes and Related Topics. J. Soc. Ind. Appl. Math. 1963, 11, 894–918. [Google Scholar] [CrossRef]
- Galam, S.; Mauger, A. Universal formulas for percolation thresholds. Phys. Rev. E 1996, 53, 2177–2181. [Google Scholar] [CrossRef]
- Galam, S.; Mauger, A. Topology invariance in percolation thresholds. Eur. Phys. J. B 1998, 1, 255–258. [Google Scholar] [CrossRef]
- Wierman, J.C. Accuracy of universal formulas for percolation thresholds based on dimension and coordination number. Phys. Rev. E 2002, 66, 027105. [Google Scholar] [CrossRef]
- Hodge, W.V.D. The Theory and Applications of Harmonic Integrals; Cambridge University Press: London, UK, 1959. [Google Scholar]
- Kadanoff, L.P.; Jotze, W.; Hamblen, D.; Hecht, R.; Lewis, E.A.S.; Palciauskas, V.V.; Rayl, M.; Swift, J.; Aspres, D.; Kane, J. Static Phenomena Near Critical Points: Theory and Experiment. Rev. Mod. Phys. 1967, 39, 395–431. [Google Scholar] [CrossRef]
- Wilson, K.G. Renormalization group and critical phenomena. Phys. Rev. B 1971, 4, 3174–3183. [Google Scholar] [CrossRef]
- Krasnov, V.A. Algebraic cycles on a real algebraic GM-manifold and their applications. Russ. Acad. Sci. Izvestiya Math. 1994, 43, 141–160. [Google Scholar] [CrossRef]
- Nye, J.F. Physical Properties of Crystals: Their Representation by Tensors and Matrices; Clarendon Press: Oxford, UK, 1967; 322p. [Google Scholar]
- Shubnikov, A.V. Symmetry in Science and Art; Plenum Press: New York, NY, USA, 1974; 420p. [Google Scholar]


| № | Topological Dimension | Network Structure | Hermann–Mogen Spatial Symmetry Group and/or Point Group (in brackets) | Number of Links per Node (Density). Values of Inverse Density Are Presented in Brackets. | Value of Percolation Threshold (General Proportion of Conducting Links Necessary for Conductivity to Occur). Values of Natural Logarithms of Percolation Threshold Values are Presented in Brackets. |
|---|---|---|---|---|---|
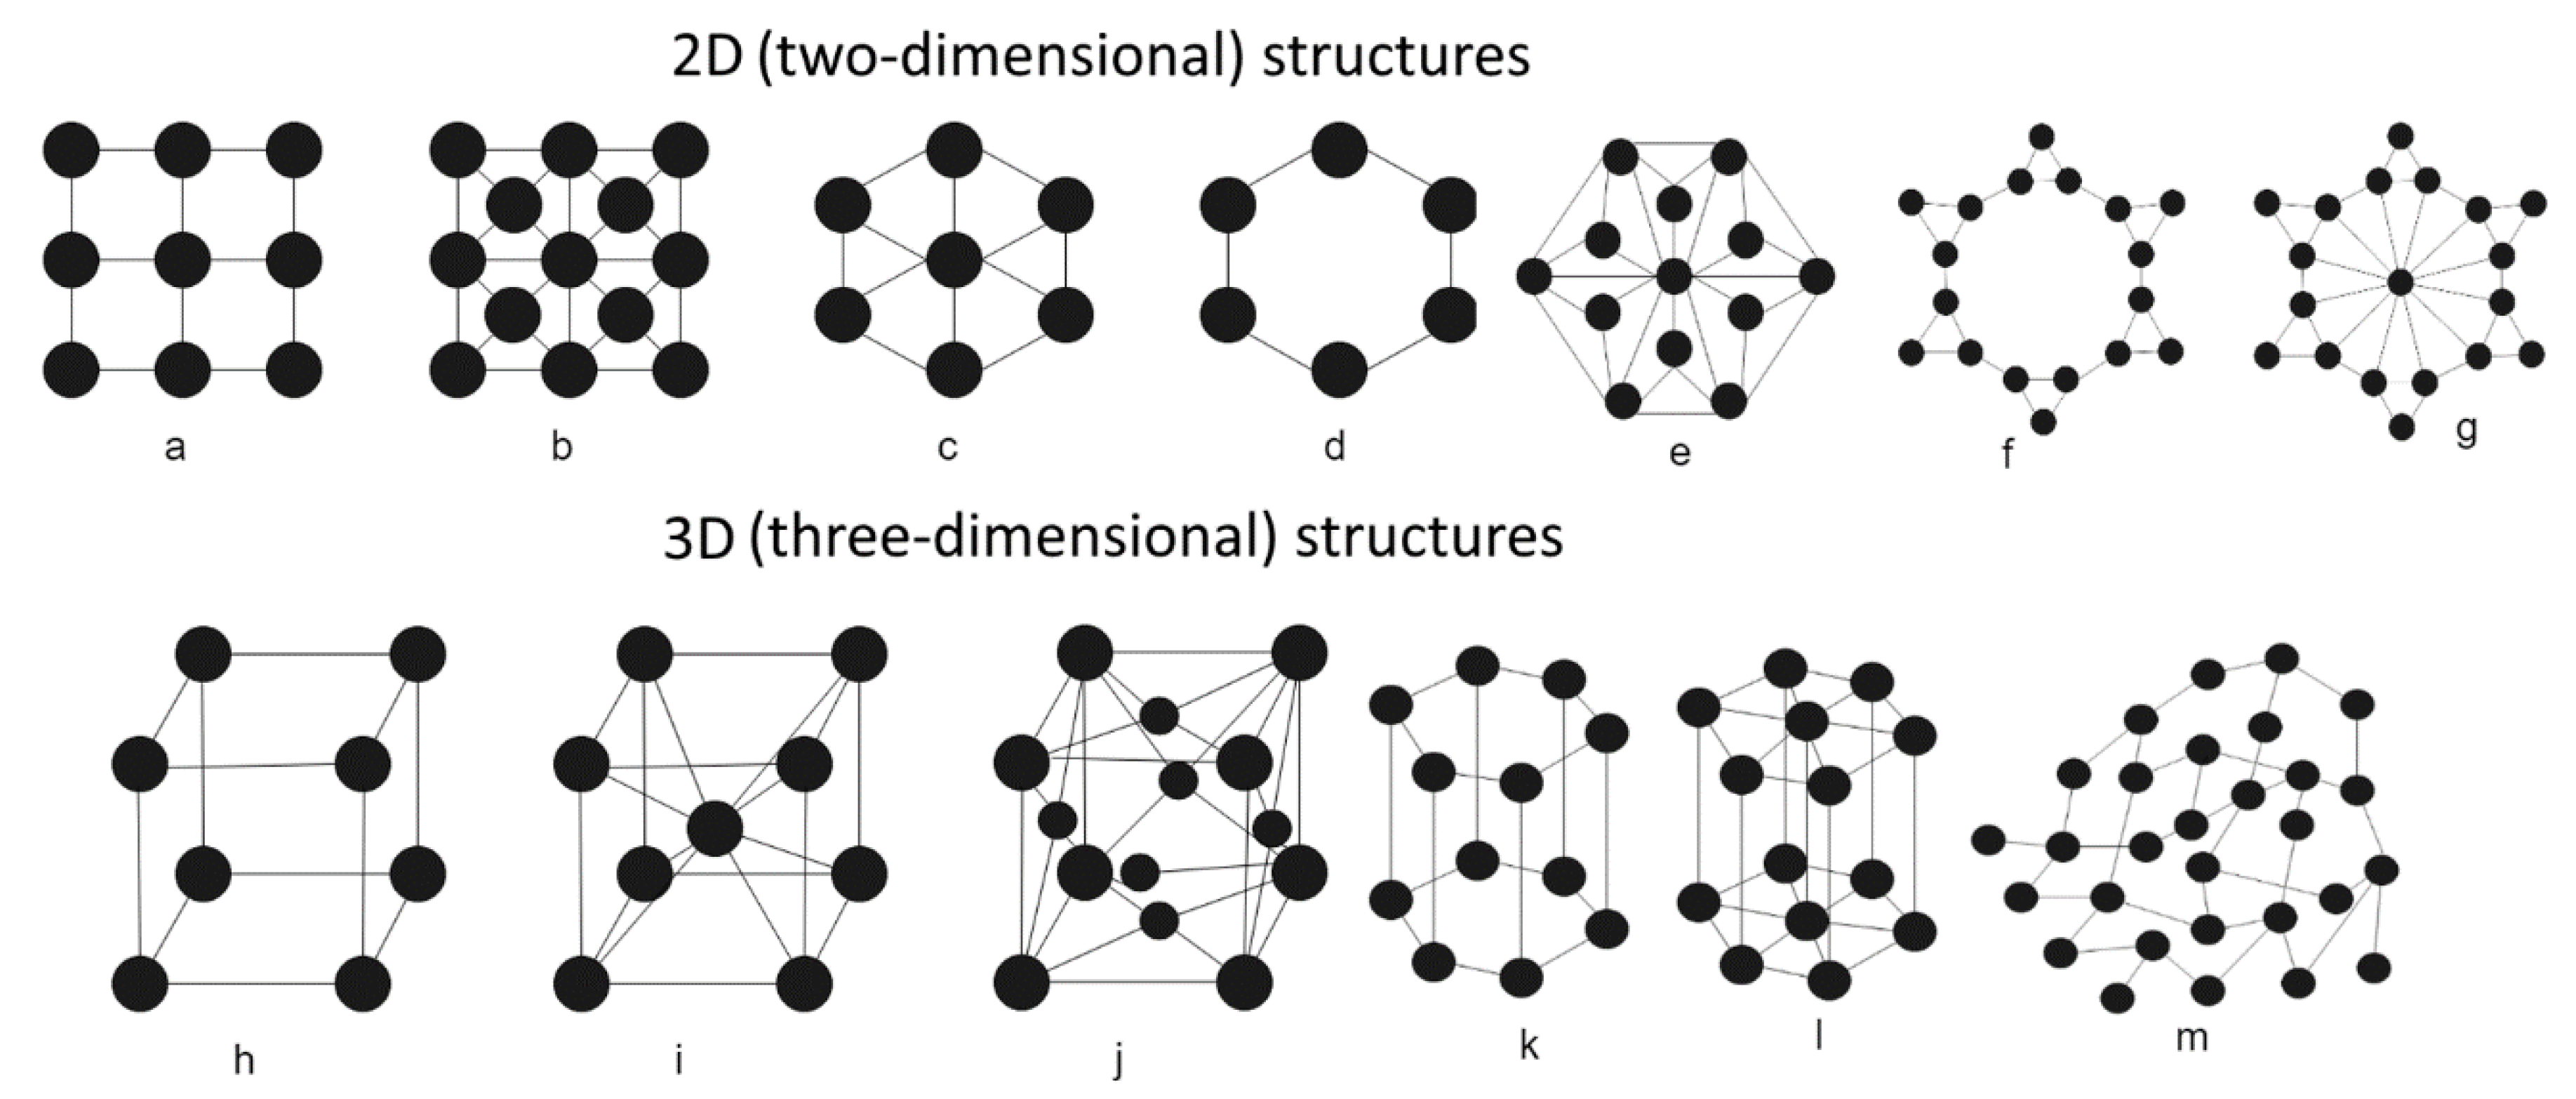
| 1. | 2D | Network 3.122 (shape f in Figure 2). | Group of symmetry elements contains: sixth-order symmetry axis and six symmetry planes. | 2.7 (0.37) | 0.74 (−0.30) |
| 2. | Hexagonal honeycomb structure (shape d in Figure 2). | Point group | 3 (0.33) | 0.70 (−0.36) [18,37] | |
| 3. | Centered network with 3.122 (shape g in Figure 2). | Group of symmetry elements contains: sixth-order symmetry axis, six symmetry planes, and inversion center. | 3.40 | 0.64 | |
| 4. | Square network (shape a in Figure 2). | Point group 4mm | 4 (0.25) | 0.59 (−0.53) [18,36] | |
| 5. | Structure presented with a shape e in Figure 2—“starfish”. | Group of symmetry elements contains: sixth-order symmetry axis, six symmetry planes, and inversion center. | 4.5 | 0.56 | |
| 6. | Centered square network (shape b in Figure 2). | Point group | 6 | 0.50 | |
| 7. | Hexagonal network (shape c in Figure 2). | Point group 6mm | 6 (0.17) | 0.50 (−0.69) [18,37] | |
| 8. | 3D | Structure in the shape of diamond (shape m in Figure 2). | (point group cF8) | 4 (0.25) | 0.43 (−0.84) [18,36] |
| 9. | Parallel 3.122 structures with vertical links | Not defined | 4.7 (0.21) | 0.38 (−0.98) | |
| 10. | Hexagonal honeycomb structure (shape k in Figure 2). | (point group hP4) | 5 (0.2) | 0.36 (−1.03) | |
| 11. | Cubic network (shape h in Figure 2). | (point group cP1) | 6 (0.17) | 0.31 (−1.17) [18,37] | |
| 12. | Cubic volume-centered network (shape i in Figure 2). | (point group cl1) | 8 (0.125) | 0.25 (−1.39) [18,37] | |
| 13. | Hexagonal network (shape l in Figure 2). | P6/mmm (point group hP1) | 8 (0.125) | 0.27 (−1.31) | |
| 14. | Cubic face-centered network (shape j in Figure 2). | (point group cF4) | 12 (0.08) | 0.20 (−1.61) [18,37] |
| № | Topological Dimension | Number of Links Per node (Density). Values of Inverse Density are Presented in Brackets. | Value of the Percolation Threshold (Proportion of Conducting Links Necessary for Conductivity to Occur in General). Values of Natural Logarithms of Percolation Thresholds are Presented in Brackets. |
|---|---|---|---|
| 1. | 2D | 5.99 (0.167) | 0.500 (−0.693) |
| 2. | 5.40 (0.185) | 0.533 (−0.629) | |
| 3. | 4.80 (0.208) | 0.570 (−0.562) | |
| 4. | 4.50 (0.222) | 0.593 (−0.523) | |
| 5. | 4.20 (0.238) | 0.618 (−0.481) | |
| 6. | 3.90 (0.256) | 0.650 (−0.431) | |
| 7. | 3.60 (0.278) | 0.683 (−0.381) | |
| 8. | 3.42 (0.292) | 0.708 (−0.345) | |
| 9. | 3.18 (0.314) | 0.750 (−0.288) | |
| 10. | 2.94 (0.340) | 0.793 (−0.232) | |
| 11. | 2.70 (0.370) | 0.852 (−0.160) | |
| 12. | 2.46 (0.407) | 0.925 (−0.078) | |
| 13. | 3D | 9.31 (0.107) | 0.217 (−1.530) |
| 14. | 8.27 (0.121) | 0.230 (−1.470) | |
| 15. | 7.09 (0.141) | 0.250 (−1.386) | |
| 16. | 6.47 (0.155) | 0.280 (−1.273) | |
| 17. | 5.27 (0.190) | 0.340 (−1.079) | |
| 18. | 4.89 (0.204) | 0.375 (−0.981) | |
| 19. | 4.54 (0.220) | 0.399 (−0.920) | |
| 20. | 4.31 (0.232) | 0.405 (−0.904) | |
| 21. | 3.94 (0.254) | 0.470 (−0.755) | |
| 22. | 3.34 (0.299) | 0.543 (−0.610) |
| № | Topological Dimension | Network Structure | Hermann–Mogen Spatial Symmetry Group and/or Point Group | Fraction of Percolation Threshold, Resulting from the Influence of Symmetry Elements |
|---|---|---|---|---|
| 1. | 2D | Network 3.122 (shape f in Figure 2). | Group of symmetry elements contains: sixth-order symmetry axis and six symmetry planes. | 0.12 |
| 2. | Hexagonal honeycomb structure (shape d in Figure 2). | Point group | 0.08 | |
| 3. | Centered network with 3.122 (shape g in Figure 2). | Group of symmetry elements contains: sixth-order symmetry axis, six symmetry planes, and inversion center. | 0.05 | |
| 4. | Square network (shape a in Figure 2). | Point group 4mm | 0.05 | |
| 5. | Structure presented with a shape e in Figure 2—“starfish”. | Group of symmetry elements contains: sixth-order symmetry axis, six symmetry planes, and inversion center. | 0.03 | |
| 6. | Centered square network (shape b in Figure 2). | Point group | 0.02 | |
| 7. | Hexagonal network (shape c in Figure 2). | Point group 6 mm | 0.02 | |
| 8. | 3D | Structure in the shape of diamond (shape m in Figure 2). | (point group cF8) | 0.02 |
| 9. | Parallel 3.122 structures with vertical links | Undefined | −0.01 | |
| 10. | Hexagonal honeycomb structure (shape k in Figure 2). | (point group hP4) | −0.01 | |
| 11. | Cubic network (shape h in Figure 2). | (point group cP1) | −0.01 | |
| 12. | Cubic volume-centered network (shape i in Figure 2). | (point group cl1) | −0.01 | |
| 13. | Hexagonal network (shape l in Figure 2). | P6/mmm (point group hP1) | −0.03 | |
| 14. | Cubic face-centered network (shape j in Figure 2). | (point group cF4) | −0.01 |
© 2019 by the authors. Licensee MDPI, Basel, Switzerland. This article is an open access article distributed under the terms and conditions of the Creative Commons Attribution (CC BY) license (http://creativecommons.org/licenses/by/4.0/).
Share and Cite
Zhukov, D.O.; Andrianova, E.G.; Lesko, S.A. The Influence of a Network’s Spatial Symmetry, Topological Dimension, and Density on Its Percolation Threshold. Symmetry 2019, 11, 920. https://doi.org/10.3390/sym11070920
Zhukov DO, Andrianova EG, Lesko SA. The Influence of a Network’s Spatial Symmetry, Topological Dimension, and Density on Its Percolation Threshold. Symmetry. 2019; 11(7):920. https://doi.org/10.3390/sym11070920
Chicago/Turabian StyleZhukov, Dmitry O., Elena G. Andrianova, and Sergey A. Lesko. 2019. "The Influence of a Network’s Spatial Symmetry, Topological Dimension, and Density on Its Percolation Threshold" Symmetry 11, no. 7: 920. https://doi.org/10.3390/sym11070920
APA StyleZhukov, D. O., Andrianova, E. G., & Lesko, S. A. (2019). The Influence of a Network’s Spatial Symmetry, Topological Dimension, and Density on Its Percolation Threshold. Symmetry, 11(7), 920. https://doi.org/10.3390/sym11070920