Abstract
It is generally acknowledged that the failure of the layer-crack structure is closely related to rock bursts (a layer-crack structure means a coal or rock rib that is cut by fractures that are parallel or sub-parallel to the surface of the rib). Understanding the mechanical behavior of the layer-crack structure under cyclic loading is beneficial for rock burst mitigation. This study experimentally investigated the influence of the geometry of vertical fissure (i.e., width, length and number) on the mechanical properties of layer-crack rock specimens. The results show that the sensitivity of parameters with respect to the geometry of the fissure from strong to weak is the number, length and width. First, the peak stress under cyclic loading increases by approximately 7.82–17.35%, thereby exerting an obvious strengthening effect. Second, the fissure geometry slightly affects the energy evolution of the layer-crack specimen, i.e., the input energy density, elastic energy density and dissipated energy density all gradually increase with the increase of the number of cycles. However, when approaching a specimen failure, the increasing rates from quick to slow are the dissipated energy, input energy and elastic energy. Third, the damage variable of the layer-crack specimen shows a concave increasing trend with the increase of the number of cycles. When the number of cycles is equal, the damage increases with the increase of the number of fissures, but it decreases with the increase of the fissure length. Fourth, AE events occur shortly before specimen failures, but rapidly increase near the specimen failures. The accumulated AE events that lead to specimen failures decrease with the increase in the number of fissures. These results can provide some basic data for the research of rock bursts related to the failures of layer-crack structures.
1. Introduction
Rock bursts are common dynamic disasters that are often accompanied by the sudden, quick and violent ejection of coal or rock in coal mines and tunnels [1,2,3,4]. Many case studies have proven that the dynamic failure of the layer-crack structure can easily lead to rock bursts in brittle coal or rock mass [5,6,7,8,9,10,11], as shown in Figure 1. Actually, coal or rock excavation is accompanied by energy input, accumulation, dissipation, and release, i.e., the deformation and failure of the rock are due to the energy transformation process [12,13,14]. Dissipated energy causes crack propagation, and released energy causes rock ejection. Thus, this research is essential for assessing the energy evolution process during the failure and deformation processes of layer-crack structures, especially underground engineering structures that are likely to be subjected to cyclic loadings resulting from hard roof fractures, blasting and other mining activities. Understanding the mechanical behavior of layer-crack structures under cyclic uniaxial compression is beneficial for rock burst mitigation.
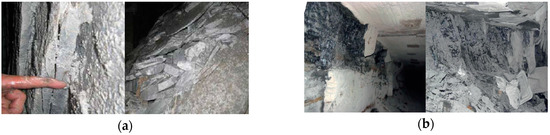
Figure 1.
Phenomena of layer-crack structures. (a) Layer-crack phenomenon in one tunnel [7]; (b) layer-crack phenomenon in one coal mine [15].
However, most studies focus on the mechanical behavior of intact rocks under cyclic loading. Li et al. [16] obtained the total absorbed energy, released energy and dissipated energy of rock failures using cyclic loading tests. Liu et al. [17] showed out the relationships among the rock density, the area of hysteresis loop and the energy dissipation using the uniaxial cyclic loading tests with sandstone and mudstone. Xu et al. [18] discussed the evolution of energy absorption and release during the deformation and failure process of sandstone under cyclic loading. Zhang et al. [19] researched the influence of the loading rate on the elastic energy and dissipated energy evolution of red sandstone under cyclic uniaxial compression. Zou et al. [20] experimentally studied the mechanical properties and damage evolution of coal under cyclic loading. Wang et al. [21] analyzed the energy evolution and distribution of dry and saturated sandstone using cyclic uniaxial loading-unloading tests.
Although some studies concentrate on the mechanical properties of pre-cracked rock specimens under cyclic loading [22], the mechanical behavior of layer-crack rock specimens remains far from being systematically understood, especially the influence of the width, length and number of the vertical fissure. Layer-crack structures are cut by vertical fractures and, therefore, they can be simplified as layer-crack specimens cut by vertical fissures in the laboratory study. It is hard to cut vertical fissures in coal due to lots of natural fractures [22]. Thus, uniaxial cyclic loading-unloading tests of layer-crack sandstone specimens with different vertical fissure geometries (i.e., width, length and number) were first carried out in this paper. Then, the energy, damage and AE evolution processes during the deformation and failure processes were researched. These results can provide some basic data for the research of rock bursts related to the failure of layer-crack structures.
2. Specimen Preparation and Testing
2.1. Specimen Preparation
Red sandstone was chosen for this study. All the specimens were cut from one block of red sandstone that was bought from the building material market. The size of the specimen was 50 mm wide × 100 mm height × 30 mm thickness. The precision of these specimens was in compliance with the requirements of the ISRM. The fissure passing through the specimen in the thickness direction was cut using a high-pressure water jet. Part of the prepared layer-crack specimens is shown in Figure 2.
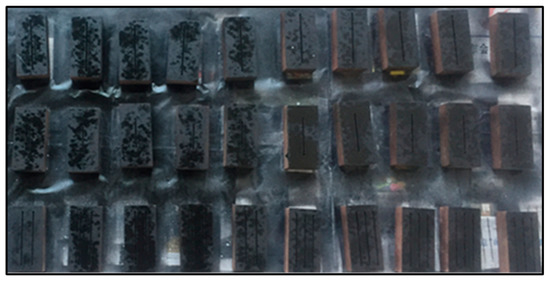
Figure 2.
Part of the layer-crack specimens.
2.2. Test Scheme and System
To research the influence of the vertical fissure geometry (i.e., width, length, and number) on the fatigue behavior of layer-crack specimens, three types of specimens were made, as shown in Figure 3. For type I, the fissure length and number of fissures are set to 80 mm and 1, respectively, while the fissure width varies from 1.0 to 2.5 mm, as shown in Figure 3a. For type II, the fissure width and number of fissures are set to 1.0 mm and 1, respectively, while the fissure length varies from 20 to 80 mm, as shown in Figure 3b. For type III, the fissure width and fissure length are set to 1.0 mm and 80 mm, respectively, while the number of fissures varies from 0 to 3, as shown in Figure 3c.
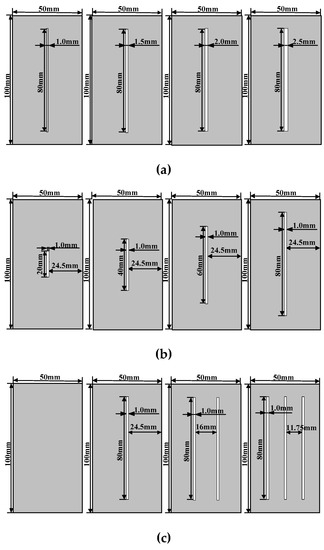
Figure 3.
Sketch of layer-crack specimens. (a) Different fissure widths; (b) different fissure lengths; (c) different numbers of fissures.
The cyclic loading-unloading scheme is as follows. When loading to 10%σc, the loading stress is first unloaded to 0.5–1.0 MPa (Note: σc is the uniaxial compressive strength of the corresponding kind of layer-crack specimen). The loading magnitude is 10%σc, which means that 20%σc, 30%σc, …, 90%σc are the 2nd, 3rd, …, and 9th unloading points, respectively. After nine cyclic repetitions, the specimen will be loaded until failure. The loading and unloading rates are 0.25 mm/min. Three specimens were prepared for each type of test. The final results, whose dispersion ratios are less than 5%, were chosen for the analysis.
These tests were conducted on a RLJW-2000 servo-controlled rock pressure testing machine at the College of Mining and Safety Engineering at Shandong University of Science and Technology [23]. The testing system includes a loading control system and a PCI-2 AE monitoring system, as shown in Figure 4. The AE monitoring system, with an A/D resolution of 18 bits and a Signal-Noise Ratio of less than 60 dB, was applied to record the AE signals.
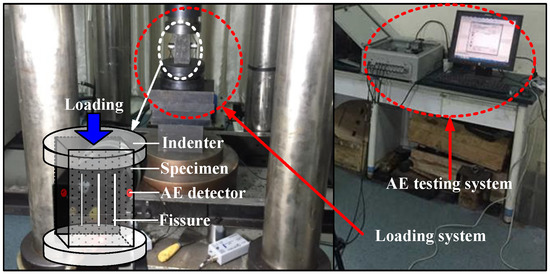
Figure 4.
Test system.
3. Determination of Fatigue Property
Energy dissipation and release accompany the deformation and failure processes of rocks. Scholars have reached the consensus that the inherent cause of rock failure is energy accumulation, dissipation and release [24,25]. Then, according to the first law of thermodynamics, the total input energy U can be calculated by Equation (1) [12].
where, Ud is the dissipated energy that is used for inner damage and plastic deformation of rock elements and Ue is the elastic strain energy.
U = Ud + Ue
As shown in Figure 5, the elastic energy and dissipated energy can be calculated using the loading-unloading stress-strain curve of the rocks. The area under the loading curve is the input energy density ui during the ith cycle, the area under the unloading curve is the elastic energy density uie, and the difference between the input energy density and elastic energy density is the dissipated energy density uid, which are calculated as follows:
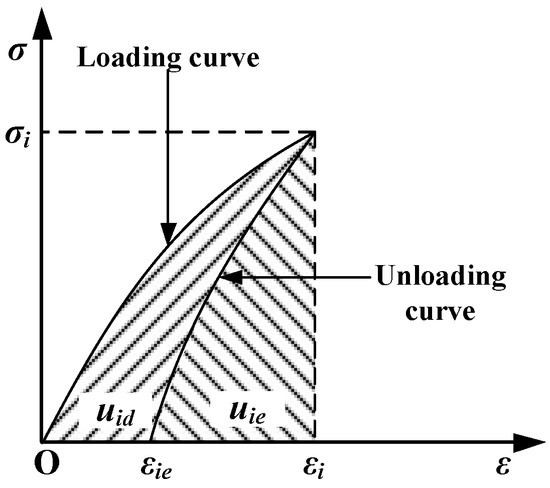
Figure 5.
Sketch for calculating the input energy, elastic energy and dissipated energy densities.
To quantitatively describe the evolution of the damage during the failure process of rocks, one damage variable that can be used for explaining the strength degradation is needed. The inner damage of the rock is caused by energy dissipation. Damage accumulation can be referred to as the irreversible process of energy dissipation. Therefore, the damage variable that is defined by using the dissipated energy is widely used. The calculation method is illustrated in Equation (5) [26].
where, uid is the dissipated energy in the ith cycle; Ni is the ith cycle’s number; and N is the final number of cycles.
4. Experimental Results and Discussions
4.1. Influence of Fissure Width
4.1.1. Strength, Deformation and Failure Characteristics
Figure 6 gives the stress-strain curves of the layer-crack specimens with different fissure widths under monotonic and cyclic uniaxial compression. Compared with a monotonic loading curve, it can be found that the envelope line of the cyclic loading-unloading curve has similar characteristics. All of them consist of five stages, i.e., the compaction, elastic deformation, hardening, softening, and residual strength stages, which reflect that rocks have memories. Overall, the stress-strain curve of the layer-crack specimen is slightly influenced by the fissure width.
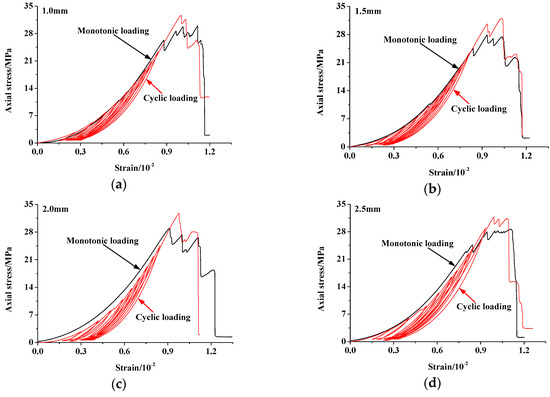
Figure 6.
Stress-strain curves of the layer-crack specimens with different fissure widths under monotonic and cyclic uniaxial compression: (a) 1.0 mm, (b) 1.5 mm, (c) 2.0 mm, and (d) 2.5 mm.
The variation of the mechanical parameters of the layer-crack specimens with different fissure widths under monotonic and cyclic uniaxial compression is illustrated in Figure 7. Under monotonic loading, the peak stress and peak strain of the layer-crack specimens with different fissure widths are 27.18–28.53 MPa and (0.97–1.06) × 10−2, respectively. Under cyclic loading, however, the peak stress is 31.78–32.82 MPa, which corresponds to an increase rate of 12.15–17.35%; the peak strain is (0.98–1.03) × 10−2, which corresponds to a variation rate of less than 5%. There are two possible reasons for this phenomenon. The first reason is that low loads are helpful for crack closures during the initial loading period [27]. The second reason is that low loads improve the compatible deformation. Thus, the strength of the layer-crack specimen under cyclic loading is larger than that under monotonic loading.
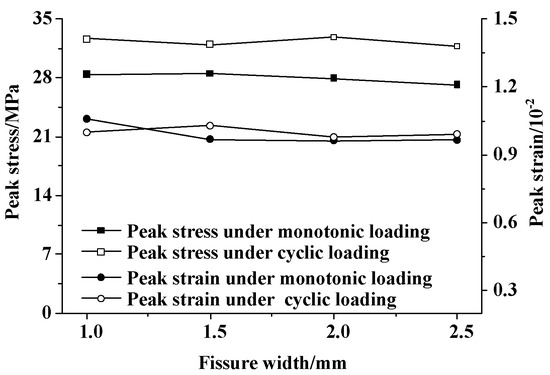
Figure 7.
Variation of the mechanical parameters of layer-crack specimens with different fissure widths under monotonic and cyclic uniaxial compression.
The elastic modulus is one of the essential parameters for representing the mechanical properties of rocks. During the cyclic loading process, the elastic modulus constantly varies as the number of cycles increases. In this paper, the loading or unloading elastic modulus is the slope of line that connects the unloading point and minimum stress point in each loading cycle. Figure 8 gives the relationship between the elastic modulus and number of cycles of the layer-crack specimens with different fissure widths. The fissure width slightly influences the magnitude of the elastic modulus. The loading elastic modulus and unloading elastic modulus increase as the number of cycles increases, but their increasing rates decrease. This is because of the hardening effect of cyclic loading and the permanent damage [27]. During the early cyclic loading stage, the internal micro-cracks are compacted, and the continuous increase of the number of cycles leads to accumulated damage in rocks.
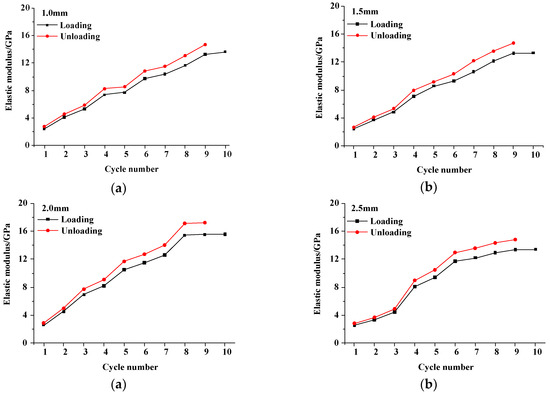
Figure 8.
Relationship between the elastic modulus and the number of cycles of the layer-crack specimens with different fissure widths: (a) 1.0 mm, (b) 1.5 mm, (c) 2.0 mm, and (d) 2.5 mm.
Figure 9 gives the failure modes of layer-crack specimens with different fissure widths. The fissure width slightly influences the failure mode, which is the splitting failure of one supporting body. (Note: supporting body is the part of specimen divided by the vertical fissure in this paper).
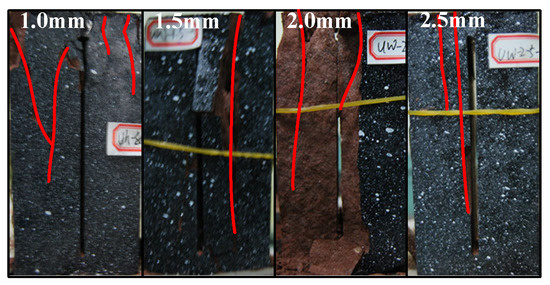
Figure 9.
Failure modes of the layer-crack specimens with different fissure widths.
4.1.2. Energy and Damage Evolution
The elastic energy density and dissipated energy density of the layer-crack specimens with different fissure widths in each cycle number are calculated using Equations (2)–(4). The calculated results are listed in Table 1. Then, the results are illustrated in Figure 10. (Note: During the 10th circle time, there is no unloading process.)

Table 1.
Elastic energy density and dissipated energy density in each cycle for the layer-crack specimens with different fissure widths.
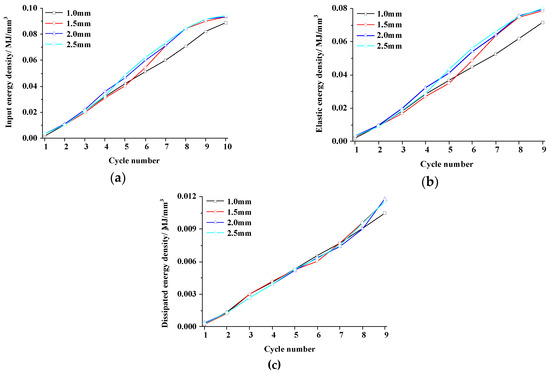
Figure 10.
Energy evolution of the layer-crack specimens with different fissure widths: (a) Input energy density, (b) elastic energy density, and (c) dissipated energy density.
From Figure 10, it can be found that the evolution of the input energy density, elastic energy density and dissipated energy density are slightly influenced by the fissure width. When the fissure widths are equal, the three kinds of energy density all increase with the increase of the number of cycles. As the specimens reach failure, the increasing rates of the energy density vary greatly. For instance, when the number of cycles increases from 8 to 9, the increasing rate of the dissipated energy density is 17.56–29.74%, but the increasing rates of the input energy density and elastic energy density are 8.04–12.37% and 3.64–8.45%, respectively. This is because when the specimen is near failure, its inner damage reaches its maximum. Thus, the increasing rate of the dissipated energy density also reaches its maximum.
The deformation and failure processes of rocks are closely related to the elastic energy and dissipated energy. Figure 11 illustrates the evolution of the elastic and dissipated energy ratios of the layer-crack specimens with different fissure widths. (Note: The energy ratio reflects the energy proportion with respect to the total input energy). The influence of the fissure width on the evolution of the energy ratio is slight. The elastic energy ratio shows a “decreasing-increasing-decreasing” trend as the number of cycles increases, but the dissipated energy ratio experiences an “increasing-decreasing-increasing” trend. Take the fissure width of 1.5 mm as an example. When the number of cycles increases from 1 to 3, the elastic energy ratio decreases from 0.93 to 0.85 and the dissipated energy ratio increases from 0.07 to 0.15. When the number of cycles increases from 3 to 7, the elastic energy ratio increases from 0.85 to 0.89 and the dissipated energy ratio decreases from 0.15 to 0.11. Finally, when the number of cycles increases from 7 to 9, the elastic energy ratio decreases from 0.89 to 0.87 and dissipated energy ratio increases from 0.11 to 0.13. During the compaction period, the micro fissures and defect closures increase the dissipated energy. When entering the elastic deformation period, the consumed energy decreases and the input energy mainly turns into elastic energy, i.e., the elastic energy ratio increases. In the later loading period, micro fissures begin to propagate, which means that the consumed energy starts rapidly increasing. Therefore, the elastic energy ratio decreases, and the dissipated energy ratio increases.
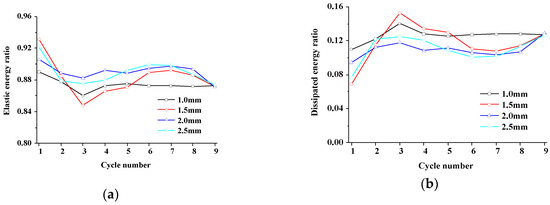
Figure 11.
Evolution of the elastic and dissipated energy ratios of the layer-crack specimens with different fissure widths: (a) Elastic energy ratio and (b) dissipated energy ratio.
The damage of the layer-crack specimens with different fissure widths is calculated using Equation (5), which is illustrated in Figure 12. The influence of the fissure width on the damage of the layer-crack specimens is also slight. The damage variable follows a concave increasing trend with the increase of the number of cycles.
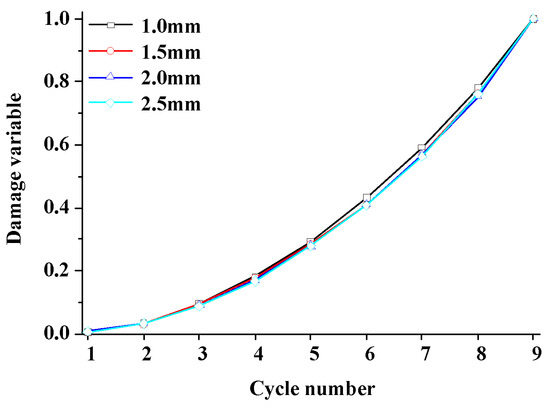
Figure 12.
Damage evolution of the layer-crack specimens with different fissure widths.
4.1.3. AE Evolution Characteristics
Figure 13 gives the AE evolution characteristics of the layer-crack specimens with different fissure widths. The fissure width affects the AE evolution characteristics slightly. The number of AE events is less than 1 × 10³ before the specimen failure. When the number of cycles is 10, however, AE events and cumulative AE events both rapidly increase, which are (5.4–9.8) × 103 and (11.5–15.9) × 105, respectively. This phenomenon is very similar to the damage evolution, i.e., a gradually increasing trend followed by a rapid increase.
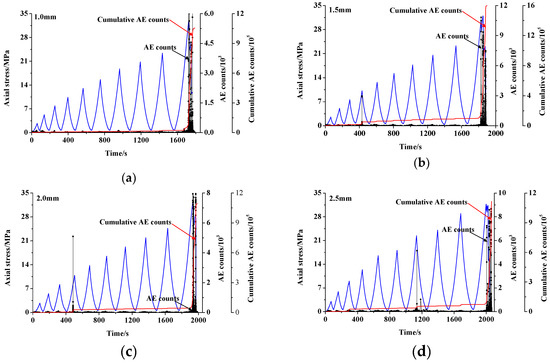
Figure 13.
AE evolution characteristics of the layer-crack specimens with different fissure widths: (a) 1.0 mm, (b) 1.5 mm, (c) 2.0 mm, and (d) 2.5 mm.
4.2. Influence of Fissure Length
4.2.1. Strength, Deformation and Failure Characteristics
Figure 14 gives the stress-strain curves of the layer-crack specimens with different fissure lengths under monotonic and cyclic uniaxial compression. The envelope line of the cyclic loading-unloading curve includes the compaction, elastic deformation, hardening, softening, and residual strength stages. There exists an interesting phenomenon. Compared with monotonic loading, when the fissure length is 20 mm or 40 mm, the strength of the layer-crack specimen decreases, thereby exerting a weakening effect; however, when the fissure length is 60 mm or 80 mm, the strength increases, thereby exerting a strengthening effect. The compatible deformation capacity of the layer-crack specimens decreases as the fissure length increases [28]. When the fissure length is large, the cyclic loading-unloading might enhance the compatible deformation capacity; however, when the fissure length is small, the properties of the layer-crack specimens are similar to those of intact specimens, and the cyclic loading-unloading might promote inner damage.
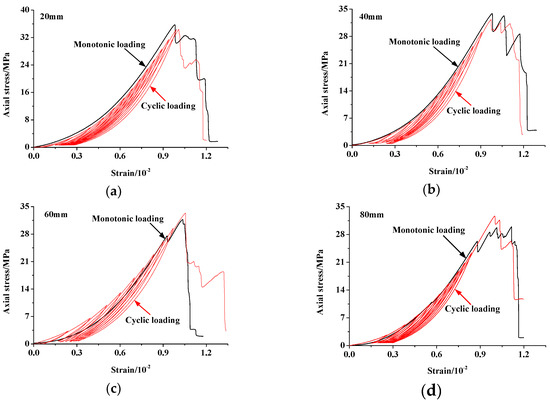
Figure 14.
Stress-strain curves of the layer-crack specimens with different fissure lengths under monotonic and cyclic uniaxial compression: (a) 20 mm, (b) 40 mm, (c) 60 mm, and (d) 80 mm.
The variation of the mechanical parameters of the layer-crack specimens with different fissure lengths under monotonic and cyclic uniaxial compression is illustrated in Figure 15. When the fissure length is 20 mm or 40 mm, the peak strength of the layer-crack specimen under cyclic loading is smaller than that under monotonic loading. For instance, when the fissure length is 40 mm, the peak stress under monotonic loading is 33.58 MPa, but under cyclic loading is 32.32 MPa. The corresponding decreasing rate is 6.04%. When the fissure length is 60 mm or 80 mm, the peak strength under cyclic loading is larger than that under monotonic loading. For instance, when the fissure length is 80 mm, the peak stress under monotonic loading is 28.44 MPa, but under cyclic loading it is 32.65 MPa. The corresponding increasing rate is 14.80%. The variation of the peak strain is stable.
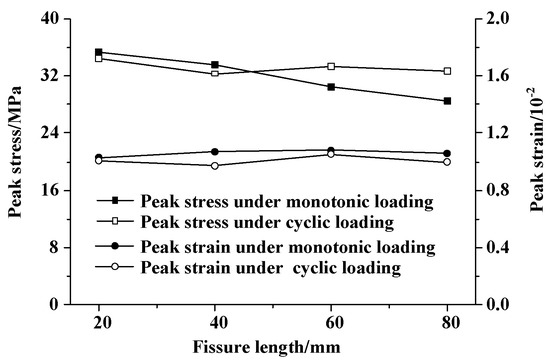
Figure 15.
Variation of the mechanical parameters of the layer-crack specimens with different fissure lengths under monotonic and cyclic uniaxial compression.
Figure 16 gives the relationship between the elastic modulus and the number of cycles for the layer-crack specimens with different fissure lengths. The fissure length slightly influences the magnitude of the elastic modulus. When the number of cycles increases, the loading elastic modulus and unloading elastic modulus both linearly increase while their increasing rates decrease. Additionally, their difference also increases as the number of cycles increases. Take a fissure length of 40 mm as an example. When the number of cycles is two, the difference is 0.24 GPa; however, when the number of cycles is eight, their difference reaches 1.53 GPa.
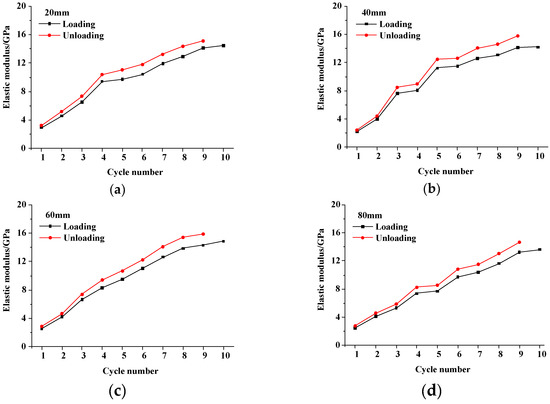
Figure 16.
Relationship between the elastic modulus and number of cycles of the layer-crack specimens with different fissure lengths: (a) 20 mm, (b) 40 mm, (c) 60 mm, and (d) 80 mm.
Figure 17 gives the failure modes of the layer-crack specimens with different fissure lengths. The fissure width obviously influences the failure mode. When the fissure length is 20 mm or 40 mm, there is a shear or splitting failure for the whole specimen. However, when the fissure length is 60 mm or 80 mm, there is a splitting failure of one supporting body.
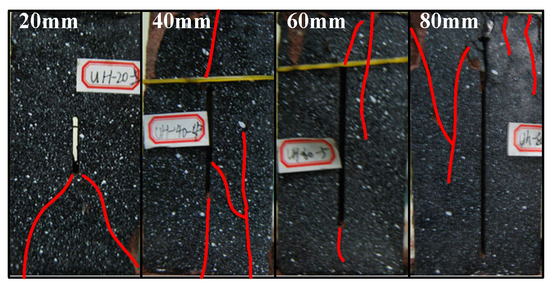
Figure 17.
Failure modes of the layer-crack specimens with different fissure widths.
4.2.2. Energy and Damage Evolution
Table 2 lists the elastic energy density and dissipated energy density of the layer-crack specimens with different fissure lengths in each cycle. Figure 18 illustrates the energy evolution. The fissure length slightly influences the energy evolution. The three kinds of energy density all gradually increase as the number of cycles increases. In addition, when approaching the specimen’s failure, the increasing rate of the dissipated energy density accelerates while the increasing rates of the input and elastic energy densities decelerate. When the number of cycles increases from eight to nine, the increasing rate of the dissipated energy density is 13.19–30.91%, but the increasing rates of the input and elastic energy densities are 4.97–15.65% and 8.86–15.41%, respectively.
Table 2.
Elastic energy density and dissipated energy density in each cycle of the layer-crack specimens with different fissure lengths.
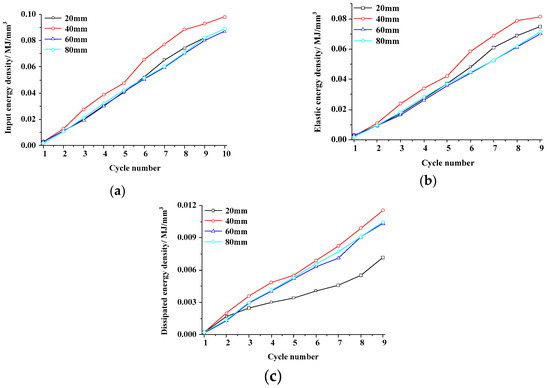
Figure 18.
Energy evolution of the layer-crack specimens with different fissure lengths: (a) Input energy density, (b) elastic energy density, and (c) dissipated energy density.
Figure 19 illustrates the evolution of the elastic and dissipated energy ratios of the layer-crack specimens with different fissure lengths. The influence of the fissure length on the evolution of the energy ratios is slight. For all kinds of layer-crack specimens, the elastic energy ratio shows a “decreasing-increasing-decreasing” trend as the number of cycles increases, but the dissipated energy ratio experiences the opposite trend.
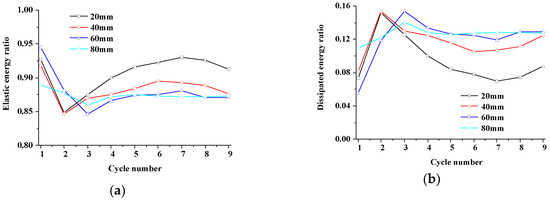
Figure 19.
Evolution of the elastic and dissipated energy ratios of the layer-crack specimens with different fissure lengths: (a) Elastic energy ratio and (b) dissipated energy ratio.
The damage of the layer-crack specimens with different fissure lengths is illustrated in Figure 20. The damages to the layer-crack specimens with different fissure lengths all nonlinearly increase as the number of cycles increases. When the numbers of cycles are equal, the damage decreases with the increase of fissure length. This phenomenon reveals that the cyclic loading-unloading can improve the compatible deformation capacity of the layer-crack structures, and thus, this weakens the inner damage.
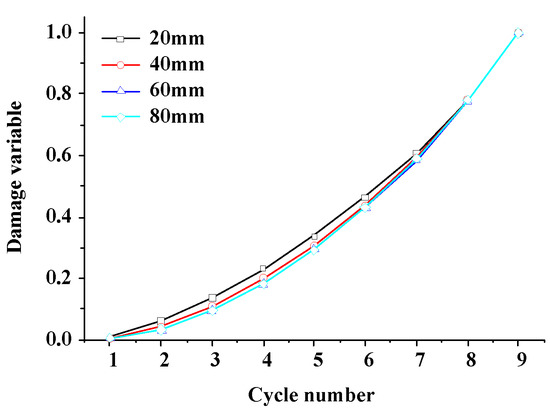
Figure 20.
Damage evolution of the layer-crack specimens with different fissure lengths.
4.2.3. AE Evolution Characteristics
Figure 21 gives the AE evolution characteristics of the layer-crack specimens with different fissure lengths. The overall evolution is slightly influenced by the fissure length. I.E., AE events occur a little before specimen failure, but AE events and cumulative AE events both experience rapid increases when near a specimen failure. In addition, when the fissure length is 20 mm, the cumulative AE events start to gradually increase, which means that the inner damage has begun accumulating. However, when the fissure length is 60 mm or 80 mm, the slow increasing phenomenon of the cumulative AE events appears in the 6–9th cycle. This result further verifies that the inner damage of the layer-crack specimen is weakened through the cyclic loading during the initial loading period and that the compatible deformation capacity is improved.
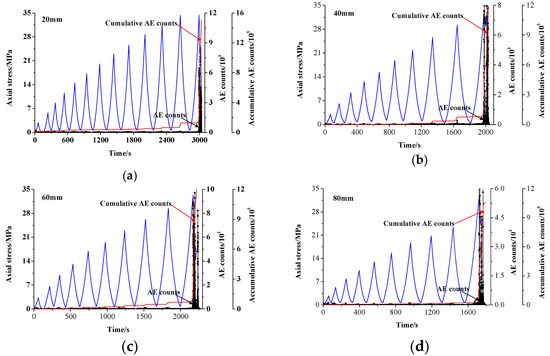
Figure 21.
AE evolution characteristics of the layer-crack specimens with different fissure lengths: (a) 20 mm, (b) 40 mm, (c) 60 mm, and (d) 80 mm.
4.3. Influence of the Number of Fissures
4.3.1. Strength, Deformation and Failure Characteristics
Figure 22 gives the stress-strain curves of the layer-crack specimens with different numbers of fissures under monotonic and cyclic uniaxial compression. When the number of fissures is 0, the envelope line of the cyclic loading-unloading is similar to the stress-strain curve under monotonic loading, but when the number of fissures is 1, 2 or 3, the strengthening effect is quite evident.
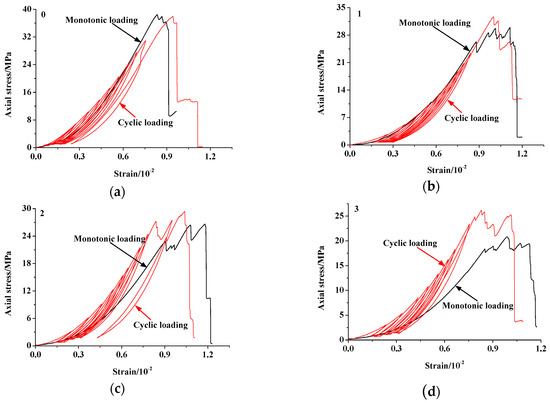
Figure 22.
Stress-strain curves of layer-crack specimens with different fissure numbers under monotonic and cyclic uniaxial compression: (a) 0, (b) 1, (c) 2, and (d) 3.
The variation of the mechanical parameters of the layer-crack specimens with different numbers of fissures under monotonic and cyclic uniaxial compression is illustrated in Figure 23. Compared with monotonic loading, the peak stress increases; however, the variation of the peak strain is slight. For instance, when the number of fissures is 1, 2 or 3, the peak stresses of the layer-crack specimens under monotonic loading are 22.32–28.44 MPa, but under cyclic loading they are 26.17–32.65 MPa. The corresponding increasing rate is 7.82–17.25%. Additionally, the peak stress gradually decreases as the number of fissures under cyclic loading increases. The peak stress decreases from 37.95 MPa to 26.17 MPa as the number of fissures increases from 0 to 3. The corresponding decreasing rate is 31.04%.
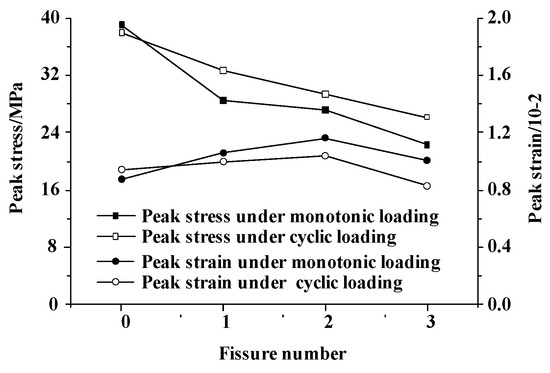
Figure 23.
Variation of the mechanical parameters of the layer-crack specimens with different numbers of fissures under monotonic and cyclic uniaxial compression.
Figure 24 gives the relationship between the elastic modulus and the number of cycles of the layer-crack specimens with different numbers of fissures. It shows that the magnitude of the elastic modulus is strongly influenced by the number of fissures. When the numbers of cycles are equal, both the loading elastic modulus and unloading elastic modulus decrease as the number of fissures increase. Take two cycles as an example. When the number of fissures increases from zero to one, the loading elastic modulus and unloading elastic modulus decrease from 7.80 GPa to 4.32 GPa and from 8.67 GPa to 4.81 GPa, respectively. The corresponding decreasing rates are 44.62% and 44.51%, respectively. The two kinds of elastic modulus show a nonlinear increasing trend with the increase of the number of cycles. Their increasing rates decrease at first and then remain almost steady, and their difference gradually increases. Take the number of fissures of three as an example. When the number of cycles is two, their difference is 0.49 GPa, but when the number of cycles is six, this value reaches 0.88 GPa.
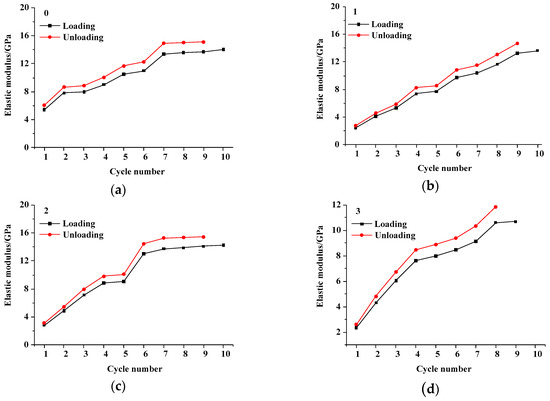
Figure 24.
Relationship between the elastic modulus and the number of cycles of the layer-crack specimens with different numbers of fissures: (a) 0, (b) 1, (c) 2, and (d) 3.
Figure 25 gives the failure modes of the layer-crack specimens with different numbers of fissures. When the number of fissure is 0, there is a splitting failure of the whole specimen. When the number of fissures is 1, 2 or 3, however, there is a shear or splitting failure of the supporting bodies.
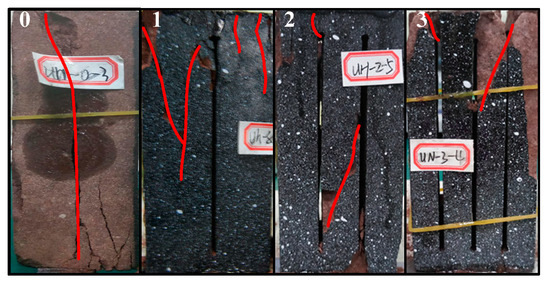
Figure 25.
Failure modes of the layer-crack specimens with different numbers of fissures.
4.3.2. Energy and Damage Evolution
Table 3 lists the elastic energy density and dissipated energy density of the layer-crack specimens with different numbers of fissures in each cycle. Figure 26 illustrates the energy evolution. The number of fissures also slightly influences the energy evolution. The input energy density, elastic energy density and dissipated energy density all increase as the number of cycles increases. When a specimen is approaching failure, the increase of the dissipated energy density accelerates, but the increase of the input energy density and elastic energy density decelerate. Additionally, it can be found that the magnitude of the energy density of intact specimens is larger than that of layer-crack specimens. The reason might be that the bearing capacity of the intact specimen is stronger.
Table 3.
Elastic energy density and dissipated energy density in each cycle of the layer-crack specimens with different numbers of fissures.
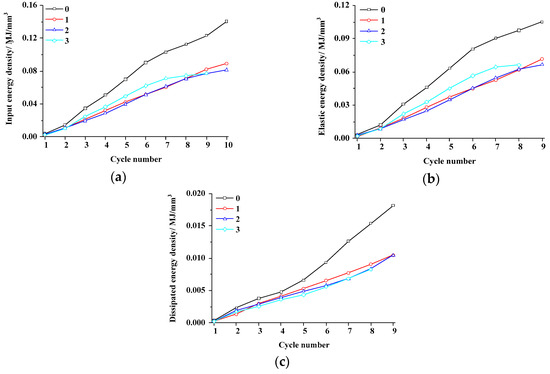
Figure 26.
Energy evolution of the layer-crack specimens with different numbers of fissures: (a) Input energy density; (b) elastic energy density; and (c) dissipated energy density.
Figure 27 illustrates the evolution of the elastic and dissipated energy ratios of the layer-crack specimens with different numbers of fissures. The influence of the number of fissures on the evolution of energy ratios is also slight. The elastic energy ratio shows a “decreasing-increasing-decreasing” trend as the number of cycles increases, and the dissipated energy ratio shows the opposite trend.
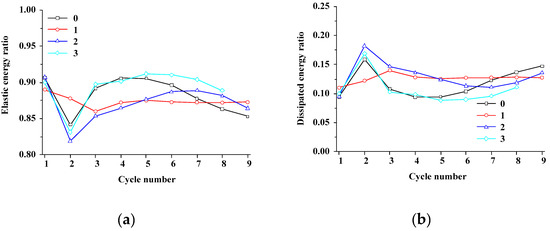
Figure 27.
Evolution of the elastic and dissipated energy ratios of the layer-crack specimens with different numbers of fissures: (a) Elastic energy ratio and (b) dissipated energy ratio.
The damage of layer-crack specimens with different numbers of fissures is illustrated in Figure 28. The damage of the layer-crack specimens with different numbers of fissures nonlinearly increases as the number of cycles increases. When the numbers of cycles are equal, the damage increases with the increase of the number of fissures. This phenomenon reveals that the increase of the number of fissures is disadvantageous to controlling the inner damage.
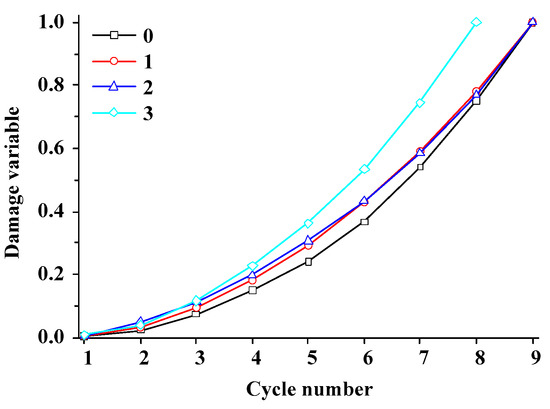
Figure 28.
Damage evolution of layer-crack specimens with different numbers of fissures.
4.3.3. AE Evolution Characteristics
Figure 29 gives the AE evolution characteristics of the layer-crack specimens with different numbers of fissures. The overall evolution is slightly influenced by the number of fissures. The number of AE events is small before specimen failure, and the AE events and cumulative AE events both experience rapid increases near a specimen failure. Additionally, the cumulative AE events with specimen failures decrease as the number of fissures increases. When the number of fissures increases from 0 to 3, the cumulative AE events decrease from 13.31 × 10⁵ to 9.88 × 10⁵. This phenomenon might be caused by the different failure modes, since the micro cracks or energy during splitting failure are larger than they are during shear failure [29,30,31]. Thus, the cumulative AE events decrease.
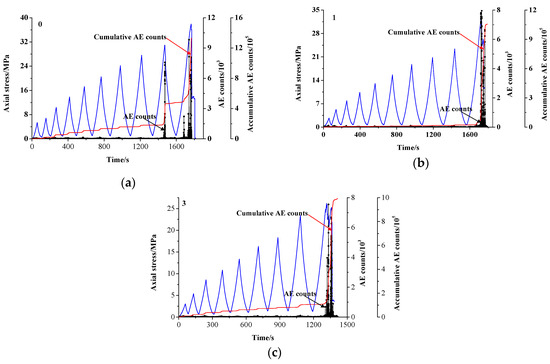
Figure 29.
AE evolution characteristics of the layer-crack specimens with different numbers of fissures: (a) 0, (b) 1, and (c) 3.
5. Conclusions
To understand the fatigue mechanical properties of layer-crack structures, this paper experimentally studies the influence of vertical fissures’ geometry (i.e., width, length and number) on the fatigue mechanism of layer-crack rock specimens.
The envelope line of the cyclic loading-unloading curve of the layer-crack specimens is similar to the monotonic loading curve, which includes the compaction stage, elastic deformation stage, hardening stage, softening stage, and residual strength stage. Additionally, the peak stress under cyclic loading increases by approximately 7.82–17.35%, thereby exerting a strengthening effect. This is because the small load improves the compatible deformation capacity during the initial loading process.
Under cyclic loading-unloading, the influence of the fissure geometry on the mechanical behavior of the layer-crack specimens from strong to weak is the number, length and width. The peak stress and elastic modulus both decrease with the increase of the number of fissures, while the influences of the fissure width and fissure number are weak.
During the cyclic loading process, the energy evolution of the layer-crack specimen is slightly influenced by the fissure geometry. i.e., the input energy density, elastic energy density and dissipated energy density all gradually increase with the increase of the number of cycles. However, when the specimen approaches failure, their increasing rates vary. The increasing rates from quick to slow are the dissipated energy, input energy and elastic energy. In addition, the elastic energy ratio shows a “decreasing-increasing-decreasing” trend as the number of cycles increases, but the dissipated energy ratio experiences the opposite trend.
The damage variable of the layer-crack specimen shows a concave increasing trend with the increase of the number of cycles. The sensitivity of the fissure geometry to the damage from strong to weak is number, length and width. When the numbers of cycles are equal, the damage increases with the increase of the number of fissures; however, it decreases with the increase of the fissure length.
The fissure geometry also slightly affects the overall AE evolution characteristics of the layer-crack specimen, i.e., AE events are little before specimen failures, but the AE events and cumulative AE events both experience rapid increases near specimen failures. In addition, cumulative AE events with specimen failure decrease as the number of fissures increases due to the different failure modes.
Author Contributions
T.Z. and Y.T. designed research; F.Y. and Y.Q. performed the experiments; all authors analysed the data; W.G. wrote the manuscript; all authors reviewed the manuscript. Correspondence should be addressed to F.Y and Y.Q.
Funding
The research described in this paper was financially supported by National Key R&D Program of China (2018YFC0604703), National Natural Science Foundation of China (Nos. 51674160, 51704181 and 51809160), Major Program of Shandong Province Natural Science Foundation (ZR2018ZA0603), Shandong Province Natural Science Foundation (ZR201702160366), Tai’shan Scholar Engineering Construction Fund of Shandong Province of China (No. ts201511026), Scientific Research Foundation of Shandong University of Science and Technology for Recruited Talents (2017RCJJ004) and Taishan Scholar Talent Team Support Plan for Advantaged & Unique Discipline Areas.
Conflicts of Interest
The authors declare no conflicts of interest.
References
- Guo, W.-Y.; Zhao, T.-B.; Tan, Y.-L.; Yu, F.-H.; Hu, S.-C.; Yang, F.-Q. Progressive mitigation method of rock bursts under complicated geological conditions. Int. J. Rock Mech. Min. Sci. 2017, 96, 11–22. [Google Scholar] [CrossRef]
- Guo, W.Y.; Tan, Y.L.; Yu, F.H.; Zhao, T.B.; Hu, S.C.; Huang, D.M.; Qin, Z. Mechanical behavior of rock-coal-rock specimens with different coal thicknesses. Geomech Eng. 2018, 5, 1017–1027. [Google Scholar]
- Zhao, T.B.; Guo, W.Y.; Tan, Y.L.; Lu, C.P.; Wang, C.W. Case histories of rock bursts under complicated geological conditions. Bull. Eng. Geol. Environ. 2018, 77, 1529–1545. [Google Scholar] [CrossRef]
- Tan, Y.; Yu, F.; Ning, J.; Zhao, T. Design and construction of entry retaining wall along a gob side under hard roof stratum. Int. J. Rock Mech. Min. Sci. 2015, 77, 115–121. [Google Scholar] [CrossRef]
- Martini, C.; Read, R.; Martino, J. Observations of brittle failure around a circular test tunnel. Int. J. Rock Mech. Min. Sci. Géoméch. Abstr. 1997, 34, 1065–1073. [Google Scholar] [CrossRef]
- Diederichs, M.S. The 2003 Canadian Geotechnical Colloquium: Mechanistic interpretation. Can. Geotech. J. 2007, 44, 1082–1116. [Google Scholar] [CrossRef]
- Gong, Q.; Yin, L.; Wu, S.; Zhao, J.; Ting, Y. Rock burst and slabbing failure and its influence on TBM excavation at headrace tunnels in Jinping II hydropower station. Eng. Geol. 2012, 124, 98–108. [Google Scholar] [CrossRef]
- Zhou, H.; Meng, M.Z.; Zhang, C.Q.; Lu, J.J.; Xu, R.C. Effect of structural plane on rockburst in deep hard rock tunnels. Chin J. Rock Mech Eng. 2015, 34, 720–727. [Google Scholar]
- Yin, Y.; Zhao, T.; Zhang, Y.; Tan, Y.; Qiu, Y.; Taheri, A.; Jing, Y. An Innovative Method for Placement of Gangue Backfilling Material in Steep Underground Coal Mines. Minerals 2019, 9, 107. [Google Scholar] [CrossRef]
- Tan, Y.-L.; Guo, W.-Y.; Zhao, T.-B.; Yu, F.-H.; Huang, B.; Huang, D.-M. Influence of Fissure Number on the Mechanical Properties of Layer-Crack Rock Models under Uniaxial Compression. Adv. Civ. Eng. 2018, 2018, 1–12. [Google Scholar] [CrossRef]
- Zhou, G.; Zhang, Q.; Bai, R.; Fan, T.; Wang, G. The diffusion behavior law of respirable dust at fully mechanized caving face in coal mine: CFD numerical simulation and engineering application. Process Saf Env. 2017, 106, 117–128. [Google Scholar] [CrossRef]
- Xie, H.P.; Ju, Y.; Li, L.Y.; Peng, R.D. Energy mechanism of deformation and failure of rock masses. Chin J. Rock Mech. Eng. 2008, 27, 1729–1740. [Google Scholar]
- Rezaei, M.; Hossaini, M.F.; Majdi, A. Determination of Longwall Mining-Induced Stress Using the Strain Energy Method. Rock Mech. Rock Eng. 2015, 48, 2421–2433. [Google Scholar] [CrossRef]
- Wang, J.; Ning, J.; Jiang, L.; Jiang, J.-Q.; Bu, T. Structural characteristics of strata overlying of a fully mechanized longwall face: a case study. J. South. Afr. Inst. Min. Met. 2018, 118, 1195–1204. [Google Scholar] [CrossRef]
- Mohamed, K.M.; Murphy, M.M.; Lawson, H.E.; Klemetti, T. Analysis of the current rib support practices and techniques in U.S. coal mines. Int. J. Min. Sci. Technol. 2016, 26, 77–87. [Google Scholar] [CrossRef] [PubMed]
- Xu, M.A. The energy variety analysis of rock under biaxial compression. J. Chin. Coal. Soc. 2010, 35, 2033–2038. [Google Scholar]
- Liu, J.F.; Xu, J.; Li, Q.S.; Li, L.G. Experimental research on damping parameters of rock under cyclic loading. Chin. J. Rock Mech. Eng. 2010, 29, 1036–1041. [Google Scholar]
- Xu, J.; Zhang, Y.; Yang, H.W.; Wang, J.N. Energy evolution law of deformation and damage of sandstone under cyclic pore water pressures. Chin. J. Rock Mech. Eng. 2011, 30, 141–148. [Google Scholar]
- Zhang, Z.Z.; Gao, F. Research on nonlinear characteristics of rock energy evolution under uniaxial compression. Chin. J. Rock Mech. Eng. 2012, 31, 1198–1207. [Google Scholar]
- Zou, J.P.; Chen, W.Z.; Yang, D.S.; Yuan, J.Q.; Tan, X.J. Mechanical properties and damage evolution of coal under cyclic loading conditions. J. Chin. Coal Soc. 2016, 41, 1675–1682. [Google Scholar]
- Wang, H.; Yang, T.H.; Liu, H.L.; Zhao, Y.C.; Deng, W.X.; Hou, X.G. Mechanical properties and energy evolution of dry and saturated sandstones under cyclic loading. Rock Soil Mech. 2017, 38, 1600–1608. [Google Scholar]
- Masoudian, M.S.; Saadabad, M.M. Multiphysics of carbon dioxide sequestration in coalbeds: A review with a focus on geomechanical characteristics of coal. J. Rock Mech. Geotech. Eng. 2016, 8, 93–112. [Google Scholar] [CrossRef]
- Guo, W.-Y.; Tan, Y.-L.; Zhao, T.-B.; Liu, X.-M.; Gu, Q.-H.; Hu, S.-C. Compression Creep Characteristics and Creep Model Establishment of Gangue. Geotech. Geol. Eng. 2016, 34, 1193–1198. [Google Scholar] [CrossRef]
- Fu, B.; Zhou, Z.H.; Wang, H.Q.; Wang, Y.X. Precursor information study on acoustic emission characteristics of marble under uniaxial cyclic loading-unloading. J. Chin. Coal Soc. 2016, 41, 1946–1953. [Google Scholar]
- Liu, X.; Tan, Y.; Ning, J.; Lu, Y.; Gu, Q. Mechanical properties and damage constitutive model of coal in coal-rock combined body. Int. J. Rock Mech. Min. Sci. 2018, 110, 140–150. [Google Scholar] [CrossRef]
- Xiao, J.-Q.; Ding, D.-X.; Jiang, F.-L.; Xu, G. Fatigue damage variable and evolution of rock subjected to cyclic loading. Int. J. Rock Mech. Min. Sci. 2010, 47, 461–468. [Google Scholar] [CrossRef]
- You, M.Q.; Su, C.D. Experimental study on strengthening of marble specimen in cyclic loading of uniaxial or pseudo-triaxial compression. Chin. J. Solid Mech. 2008, 10, 66–72. [Google Scholar]
- Guo, W.-Y.; Tan, Y.-L.; Huang, B.; Zhang, L.-S.; Zhao, T.-B.; Yu, F.-H. Failure mechanism of layer-crack rock models with different vertical fissure geometric configurations under uniaxial compression. Adv. Mech. Eng. 2017, 9, 1–15. [Google Scholar]
- Cao, A.Y.; Dou, L.M.; Jiang, H.; Lv, C.G.; Guo, X.Q.; Wang, Y. Characteristics of energy radiation and stress drop in different failure modes of mining-induced coal-rock mass. J. Min. Safety Eng. 2011, 28, 350–355. [Google Scholar]
- Chen, X.G.; Zhang, Q.Y. Research on the energy dissipation and release in the process of rock shear failure. J. Min. Safety Eng. 2010, 27, 179–184. [Google Scholar]
- Zhang, Q.; Zhou, G.; Qian, X.; Yuan, M.; Sun, Y.; Wang, D.; Yuan, M. Diffuse pollution characteristics of respirable dust in fully-mechanized mining face under various velocities based on CFD investigation. J. Clean. Prod. 2018, 184, 239–250. [Google Scholar] [CrossRef]
© 2019 by the authors. Licensee MDPI, Basel, Switzerland. This article is an open access article distributed under the terms and conditions of the Creative Commons Attribution (CC BY) license (http://creativecommons.org/licenses/by/4.0/).