Article

Feature Extraction Method of Transmission Signal in Electronic Communication Network Based on Symmetric Algorithm

Department of Educational Affairs, Nanyang Institute of Technology, Nanyang 473000, China
Symmetry 2019, 11(3), 410; https://doi.org/10.3390/sym11030410
Submission received: 15 January 2019 / Revised: 9 March 2019 / Accepted: 13 March 2019 / Published: 20 March 2019
(This article belongs to the Special Issue New Trends in Dynamics)

Abstract

:
Because the existing methods extract the signal characteristics of electronic communication networks, there is a problem of poor extraction. In this paper, a feature extraction method based on symmetric algorithm for transmission signals in electronic communication networks is proposed. The transmission signal in the time domain is decomposed by three-layer wavelet packet decomposition through threshold denoising and data dimension reduction. The adaptive floating threshold is used as a threshold to quantify the wavelet coefficients of the signal, which can effectively remove noise while retaining valuable transmission signal. Secondly, the feature extraction algorithm based on symmetric Holder coefficient is used to transform the transmitted signal from time domain to frequency domain, identify the signal sequence, and classify the signal sequence using neural network classifier. The simulation results show that the proposed method can extract the transmission signal of electronic communication network with the highest accuracy of 98.21%. This method can extract the amplitude and frequency characteristics of the transmission signal accurately under strong vibration environment. It is an efficient method for feature extraction of transmission signal.

1. Introduction

With the continuous improvement of network communication technology, network communication has been widely used in aviation, industry, transportation, and other fields. In the actual process of network communication, it is necessary to receive or transmit signals frequently, but in this process, it will be affected by a large number of noise environment caused by external environment and other factors [1]. As a result, the received or transmitted original signals will be completely submerged in the noise, which makes it difficult to extract the characteristics of the original transmission signals.
Cui, J. et al. [2] studied the feature extraction method of electronic network communication signals under strong noise environment based on short-time Fourier method. The method first extracts the multidimensional entropy feature of the received signal, and obtains the spectrum map of the signal by short-time Fourier-transform. Based on this, the binary tree algorithm is used to extract the communication transmission signal in the strong noise environment. The method extracts the signal with high efficiency, but when extracting the communication transmission signal, the accurate signal feature function cannot be obtained, the characteristics of the transmission signal extracted from the electronic communication network are too abstract, and the signal extraction precision is low. Zeng, F. et al. [3] introduced a feature extraction method based on multi-dimensional signal feature fusion for transmission signals in electronic communication networks. The method extracts single multidimensional signal features in the time domain, frequency domain, and high-order spectral domain from the radio frequency signal of the communication target; fuses the extracted features; and then uses the support vector machine to classify the signal features to realize the transmission in electronic communication. Extraction of signal features: At present, the method has the widest application range, but the method still has the problem of high complexity of the extraction process.
Addressing the above problems, this paper presents a method of extracting transmission signal features of electronic communication network based on symmetric algorithm. The simulation results show that the method can extract transmission signal features of electronic communication network effectively under strong noise, and the method has high accuracy and overall superiority.

2. Feature Extraction Method of Transmission Signal in Electronic Communication Network Based on Symmetric Algorithm

2.1. Threshold Denoising and Data Dimensionality Reduction

The transmission signal of the electronic communication network is often included in the vibration signal during its operation. Therefore, extracting the feature information components from the vibration signal of the electronic communication network becomes an effective means to extract the features of the transmission signal of the electronic communication network [4]. The feature information of transmission signals in electronic communication network is submerged in strong noise. Firstly, the signal in the time domain is decomposed into Daub4 wavelet packet space, and the vibration signal is decomposed into three layers of wavelet packet. Due to the influence of strong background noise, the useful transmission signals in electronic communication networks are at risk of being overwhelmed by noise.
To extract the feature information of the vibration signal transmitted by the electronic communication network under the background of strong noise, the noise interference must be eliminated firstly. In this paper, soft threshold denoising is used to quantify the wavelet coefficients in the wavelet packet space. Most of the wavelet coefficients are 0, preserving the wavelet coefficients representing the signal features. The model of time domain signal is selected as follows
g ( t ) = f ( t ) + z ( t )
In the formula, f ( t ) is the signal part, z ( t ) is the Gauss white noise obeying N ( 0 , 1 ) , and is the noise level. Signal f ( t ) can be reconstructed in the wavelet packet space with the wavelet packet coefficients. The larger the coefficients are, the more the signal energy is carried and vice versa. According to the theory of local maximum modulus of wavelet transform [5], when noise is removed, most of the noise can be removed as long as the coefficient energy formed by the local maximum modulus of wavelet transform of white noise is removed. On the basis of retaining most of the signal energy, the adaptive floating threshold is used to quantize the noise-damaged wavelet coefficients. The wavelet coefficients equal to or less than the threshold are treated as zero, and the original signal f ( t ) is reconstructed only from the data above the threshold. After the above process, most of the noise can be eliminated, and the reconstruction result can be made without obvious distortion.
The modulus of the wavelet coefficients of the effective signals is much larger than that of the wavelet coefficients generated by the noise signals. The adaptive floating threshold is used as the threshold to quantify the wavelet coefficients [6], which can effectively remove the noise while retaining the effective signal. Most of the energy of the signal is concentrated on a small number of nonzero wavelet coefficients, that is, after the signal is transformed, most of the energy is concentrated on K transform coefficients. If K is less, the energy concentration property of such transformation is better. The lower the data dimension is, the less the coefficient of transmission feature information of electronic communication network is.

2.2. Selection of Adaptive Threshold

The choice of threshold is the key in the denoising process [7], it is necessary to retain the characteristic information of the transmitted signal to eliminate noise interference. In this paper, an adaptive threshold selection method is proposed, which can describe as much information as possible with as few coefficients as possible, so that the feature information of the transmitted signal can be concentrated on a small number of coefficients with larger modulus, in order to achieve wavelet packet space data reduction and extraction of transmission signal features. The algorithm is described as follows
(1) The wavelet coefficients of each node except node ( 3.0 ) are ordered d = ( d , d 1 , d 2 , d t , ) according to the modulus of coefficients, and only the first k thcomponent is preserved by threshold denoising algorithm d = ( d , d 1 , d 2 , d t , 0 , 0 , 0 )
(2) The percentage of retained wavelet coefficients in total signal energy η t and the percentage ξ t of the number of wavelet coefficients with zero are calculated:
η t = t = 1 N a b s ( d t ) 2 / ( k = 1 N a b s ( d t ) 2 + j = 1 M a b s ( d j ) 2 )
The wavelet coefficient corresponding to min ( a b s [ ( 1 η t ) ξ t ] ) is selected as the threshold value of wavelet coefficient quantization τ .
(3) The soft domain value algorithm is used for coefficient quantization.
c o e f ( t ) = ( | c o e f ( t ) | τ ξ t ) · sign ( c o e f ( t ) ) and | c o e f ( t ) | > τ
The above process completes the three-layer wavelet packet decomposition of the network transmission signal, quantifies the wavelet coefficients, and effectively removes the noise in the signal and retains the valuable transmission signal. On this basis, the feature extraction algorithm of symmetrical Holder coefficient is adopted to optimize the feature extraction of the transmission signal in the communication network.

2.3. Feature Extraction Algorithm of Symmetric Holder Coefficient

2.3.1. Recognition of Signal Sequence

The discrete signal sequence of the electronic communication network signal received by the receiver is set as | F ( i ) , i = 1 , 2 , , M | and M as the length of the signal sequence after sampling. Firstly, the signal is preprocessed. The process of preprocessing is as follows. Firstly, Fourier-transform is used to transform the signal from the time domain to the frequency domain, the signal energy is normalized in the frequency domain, then the central frequency and effective bandwidth of the signal spectrum are calculated, and the bandwidth is normalized. The purpose of energy normalization is to eliminate the influence of the distance of the emitter [8]. The purpose of bandwidth normalization is to reduce the computational complexity of feature extraction, and eliminate the influence of out-of-band noise and the change of sweep width or code length. The processed signal sequence is { G ( j ) , j = 1 , 2 , , N } .
Where, N is the length of the signal sequence after preprocessing. In order to calculate the symmetrical Holder coefficients of transmission signals in electronic communication network, two basic signal sequences are introduced at first.
The rectangular signal sequence is
U ( k ) = { m , 1 k N 0 , other
The triangular signal sequence is
T ( k ) = { 2 k m N , 1 < k N 2 2 m 2 k m N , N 2 < k N
In formulas (4) and (5), m is the maximum value of { G ( j ) } . Based on the definition of the symmetric Holder coefficient, the algorithm for calculating the symmetric Holder coefficient is given below.
(1) The sampling signal { F ( i ) } is preprocessed firstly. The preprocessing method is described above. The signal sequence after preprocessing is { G ( j ) } .
(2) According to formula (6), it can calculate the values of symmetric Holder coefficient of two signals { U ( k ) } and { G ( j ) } :
H S 1 = U ( i ) G ( i ) ( U p ( i ) ) 1 / p ( G q ( i ) ) 1 / q + U ( i ) G ( i ) ( U q ( i ) ) 1 / q ( G p ( i ) ) 1 / p 2
According to formula (7), the symmetric Holder coefficient of two signals is calculated:
H s 2 = T ( i ) G ( i ) ( T p ( i ) ) 1 / p ( G q ( i ) ) 1 / q + T ( i ) G ( i ) ( G q ( i ) ) 1 / q ( T P ( i ) ) 1 / p 2
(3) H s 1 and H s 2 constitute two dimensional joint eigenvectors, which can be expressed as H s = [ H s 1 , H s 2 ]
The processing flow of symmetric Holder coefficient method is shown in Figure 1. In the definition of symmetric Holder coefficients and feature extraction algorithm, it can be clearly seen that symmetric Holder coefficients are related to the mathematical expression, length of two discrete functions, and the selection of the p , q value [9]. For two known discrete functions, the different selection of the p , q value will change the size of the symmetric Holder coefficient. When the p , q value is determined, the larger the length N of the two discrete functions, the smaller the value of the symmetric Holder coefficient, which has been proven mathematically [10]. For the signal transmitted in the same electronic communication network after preprocessing, because the transmission signal sequence { G ( i ) } has the same form and the normalized bandwidth, the length of signal sequence { G ( i ) } is the same. At this time, when any set of values are selected, the eigenvalues of symmetrical Holder coefficient of the transmission signal in the same electronic communication network will be very close. It shows that the symmetry Holder coefficient has better intraclass aggregation. For the signals transmitted in different electronic communication networks after preprocessing, because the signal sequence forms are different and the normalized bandwidth is different, the form of signal sequence { G ( i ) } is different, and the normalized bandwidth is also different, so the length of signal sequence { G ( i ) } is different, if a set of p , q values are fixed, for example, p = q = 2 , the method of similarity coefficient is used, the eigenvalues of the symmetrical Holder coefficients of different signals may be similar or the same, so that the distance between the extracted feature classes cannot be compared [10], and the satisfactory correct recognition rate cannot be obtained. Therefore, it is necessary to adjust the p , q value appropriately in order to make that the feature of symmetric Holder coefficient not only have a better degree of clustering within the class, but also have a larger distance between the classes. At the same time, it can be clearly seen that the complexity of the symmetric Holder coefficient method in type selection will be reduced by half [11,12,13,14]. As shown in Figure 1, it is the process flow of symmetric coefficient method.

2.3.2. Classifier Design

In recent years, neural network technology has developed rapidly. A neural network is a complex processing unit formed by a large number of simple processing units connected widely. It reflects many basic characteristics of human brain function and is a highly complex nonlinear dynamic system. A neural network has the ability of large-scale, parallel distributed storage and processing [15], self-organization, self-adaptation, and self-learning, which has attracted much attention in pattern recognition and has been widely used [16,17].
This paper uses neural network as shown in Figure 2. In Figure 2, layer L 1 is the input layer of the neural network, and the number of neurons is two, which is the input of two Holder coefficient eigenvalues, respectively; layer L 2 and layer L 3 are the middle layers of the neural network, and their number of neurons is 30 and 20, respectively. The transfer function chooses “tansig” function, layer L 4 is the output layer of the neural network, and the number of neurons is the same as the number of transmitted signals in the electronic communication network to be classified [18], and the transfer function selects the “logsig” function. The training algorithm of the neural network adopts the elastic back-propagation algorithm [19,20,21]. The supervisory signal is taken as the “0–1” signal and the error is 0.05.

2.3.3. Optimization of Transmission Signal Feature Extraction Process

In the process of extracting the features of transmission signal in electronic communication network under strong vibration environment, the neural network classifier in the previous section is used to classify and recognize the extracted signals, and the signal sequence results after the recognition in the Section 2.3.1 are used to extract the features of transmission signal in strong vibration environment.
The specific steps are as follows.
Assuming that [ ( x 1 , y 1 ) ( x i , y i ) , y i { 1 , 1 } ] is used to describe the training sample set, i.e., the signal sequence of network communication identified in Section 2.3.1, and the optimal hyperplane is represented by ω T · x + b = 0 , then, based on μ · ( z ) , the original signal sequence space of network communication is mapped to a high-dimensional space by formula (8), in which the optimal classification surface of signal features is established:
E ( x ) = ω T · x + b ( x i , y i ) × μ · ( z )
In the formula, x represents the input features of the classifier and ω represents the weight coefficient vector of the classifier.
The classification problem of signals to be extracted after comparison is transformed into a quadratic programming problem [22,23]. The constraints are given by formula (9) and the minimum generalization function is obtained.
Φ ( ω ) = ϑ ( S ) [ ω T · x + b ] × μ ( Q ) × E ( x )
In the formula, ϑ ( S ) represents the similarity between the extracted signal feature samples, μ ( Q ) represents the amplitude distribution at each frequency point, and E ( x ) represents the number of support vector machines corresponding to each intermediate node.
Assuming that Z represents the decision rule [24], K ( x i · x ) represents the kernel function. Formula (10) is an optimization of the feature extraction process for network communication transmission signals in a strong noise environment:
f ( W ) = K ( x i · x ) × Z N ( z ) ϕ ( Z )
In the formula, N ( z ) represents the frequency characteristic of the communication transmission signal and ϕ ( Z ) represents the input vector.

3. Results

In order to verify the effectiveness of the proposed method, a simulation experiment was designed. The signals transmitted by six typical electronic communication networks wereselected: electronic communication network transmission signal (CECNT), linear frequency modulation signal (LFM), nonlinear frequency modulation signal (NLFM), binary phase coded signal (BPSK), polyphase coded signal (MPSK), and the frequency-coded signal (FSK). The signal carrier frequency is 30 MHz, the sampling frequency is 80 MHz, the pulse width is 12.8 μs, BPSK uses the L sequence code, MPSK uses the Frank code, and FSK uses the Barker code. Eight different sets of values are used to generate 150 samples for each transmitted signal in the electronic communication network with signal to noise ratios of 5 dB, 10 dB, 15 dB, and 20 dB, respectively. There are 600 samples per transmitted signal in an electronic communication network, of which 300 samples are used as training sets for classifiers and another 300 samples are used as test sets.

3.1. Analysis of Extraction Accuracy

Neural network classifier is used in the proposed method, the training set samples are trained first, and then the trained neural network classifier is tested with the test set samples. For different p , q values, the average correct recognition rate is shown in Table 1. The results in Table 1 show the average correct extraction rate of the different features of network transmission signal after 10 experiments.
From Table 1, it can be seen that in the SNR range of 5 to 20 dB, the average correct extraction rate of different types of network transmission signal features obtained by the proposed method is satisfactory, which shows the effectiveness of the proposed method in identifying the transmission signal of electronic communication network. The average correct extraction rate of the proposed method is higher when p is not equal to 2 than when p is equal to 2. That is to say, the average correct extraction rate of the proposed method is higher in the process of extracting transmission signals, and the maximum can be increased by more than 5%. The average correct extraction rate is the best when p is equal to 4, and the average correct extraction rate reaches 98.21%. For different forms of transmission signal in electronic communication network, appropriate adjustment of p , q value can obtain a better average correct extraction rate. In order to further illustrate the good characteristics of the proposed method, 1800 training sets of six kinds of transmission signals in electronic communication network at p = 5 are selected to draw a two-dimensional joint feature distribution map as shown in Figure 3.
From Figure 3, it can be seen that the eigenvalues extracted by the proposed method are very stable in the SNR range of 5 to 20 dB, and are less affected by noise. At the same time, the symmetrical Holder coefficients of network communication signals obtained by the proposed method have a higher degree of clustering within the class and a larger distance between the classes, which indicates that the proposed method has a higher stability in extracting transmission signals in electronic communication network.

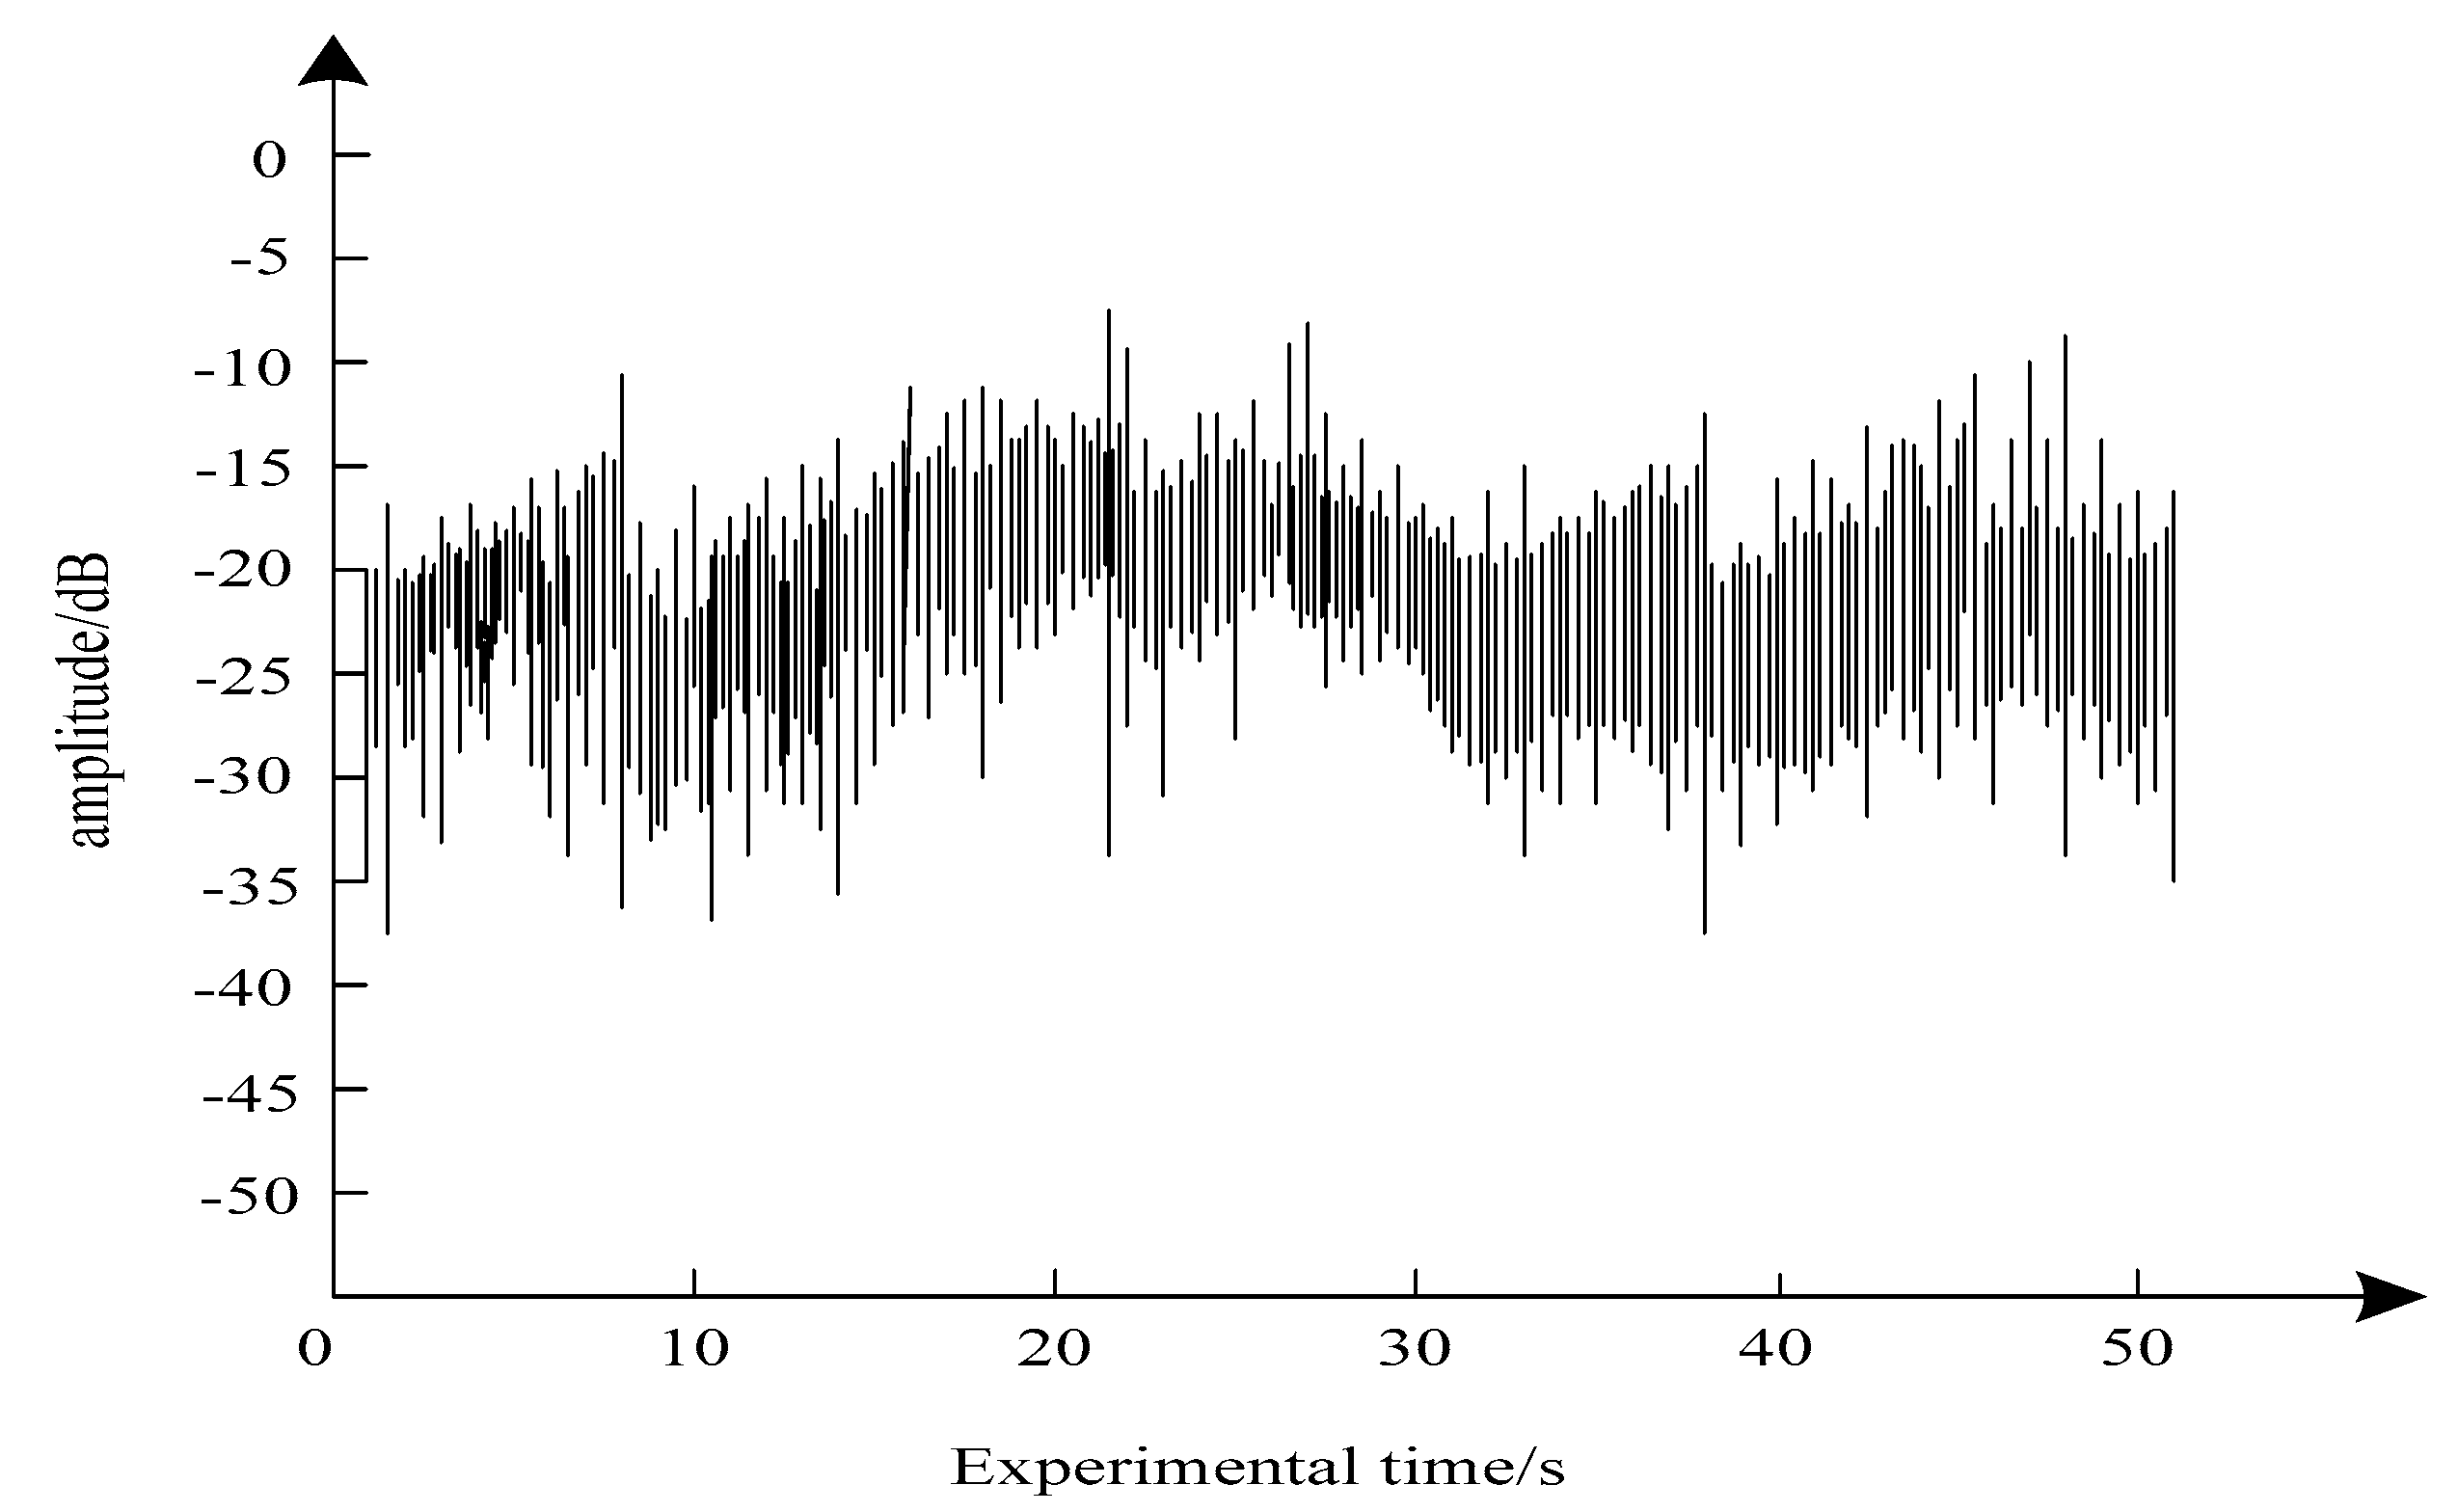
3.2. Feature Analysis of Extracted Signals

Taking the FSK communication transmission signal as an example, the effects of different signal feature extraction methods, such as the time domain inspection method, short-time Fourier method, quadratic feature extraction method, and the proposed method, are analyzed. The analysis results are shown in Table 2.
Analysis of Table 2 shows that when extracting the transmission signal of FSK communication, the performance of extracting modulation time feature, energy time-varying feature, and frequency-band feature using the proposed method is very good, while the effect of other three methods is not as good as that of the proposed method. Among them, there is no result of extracting frequency-band feature by time domain check, but the proposed method has good effect on the extraction of frequency bands. Compared with other three methods, the proposed method has great advantages in signal feature extraction, and can extract the transmission signal features in electronic communication network very well.
The actual signal amplitude features of the experimental electronic communication network transmission in strong vibration environment are described in Figure 4. The extraction effect of the features of transmission signal amplitude in the electronic communication network is described in Figure 5 and Figure 6, respectively, by using the method of quadratic feature extraction and the method presented in this paper.
Analysis of Figure 4, Figure 5 and Figure 6 shows that the amplitude features of transmission signals in electronic communication network extracted by the proposed method are basically consistent with the actual characteristics in strong vibration environment, while the quadratic feature extraction method is disturbed by strong vibration environment. The extracted amplitude features of transmission signals in electronic communication network are quite different from the actual signal amplitude characteristics, and the signal amplitude features have significant fluctuations. This is mainly because when using the proposed method to extract the transmission signal features, the original signal and the noise band are separated by the wavelet principle, the signal matching template is formed after noise reduction, and then the signal to be extracted is decomposed by wavelet to obtain the protocol features of the signal to be extracted. The proposed method can improve the accuracy of signal feature extraction.

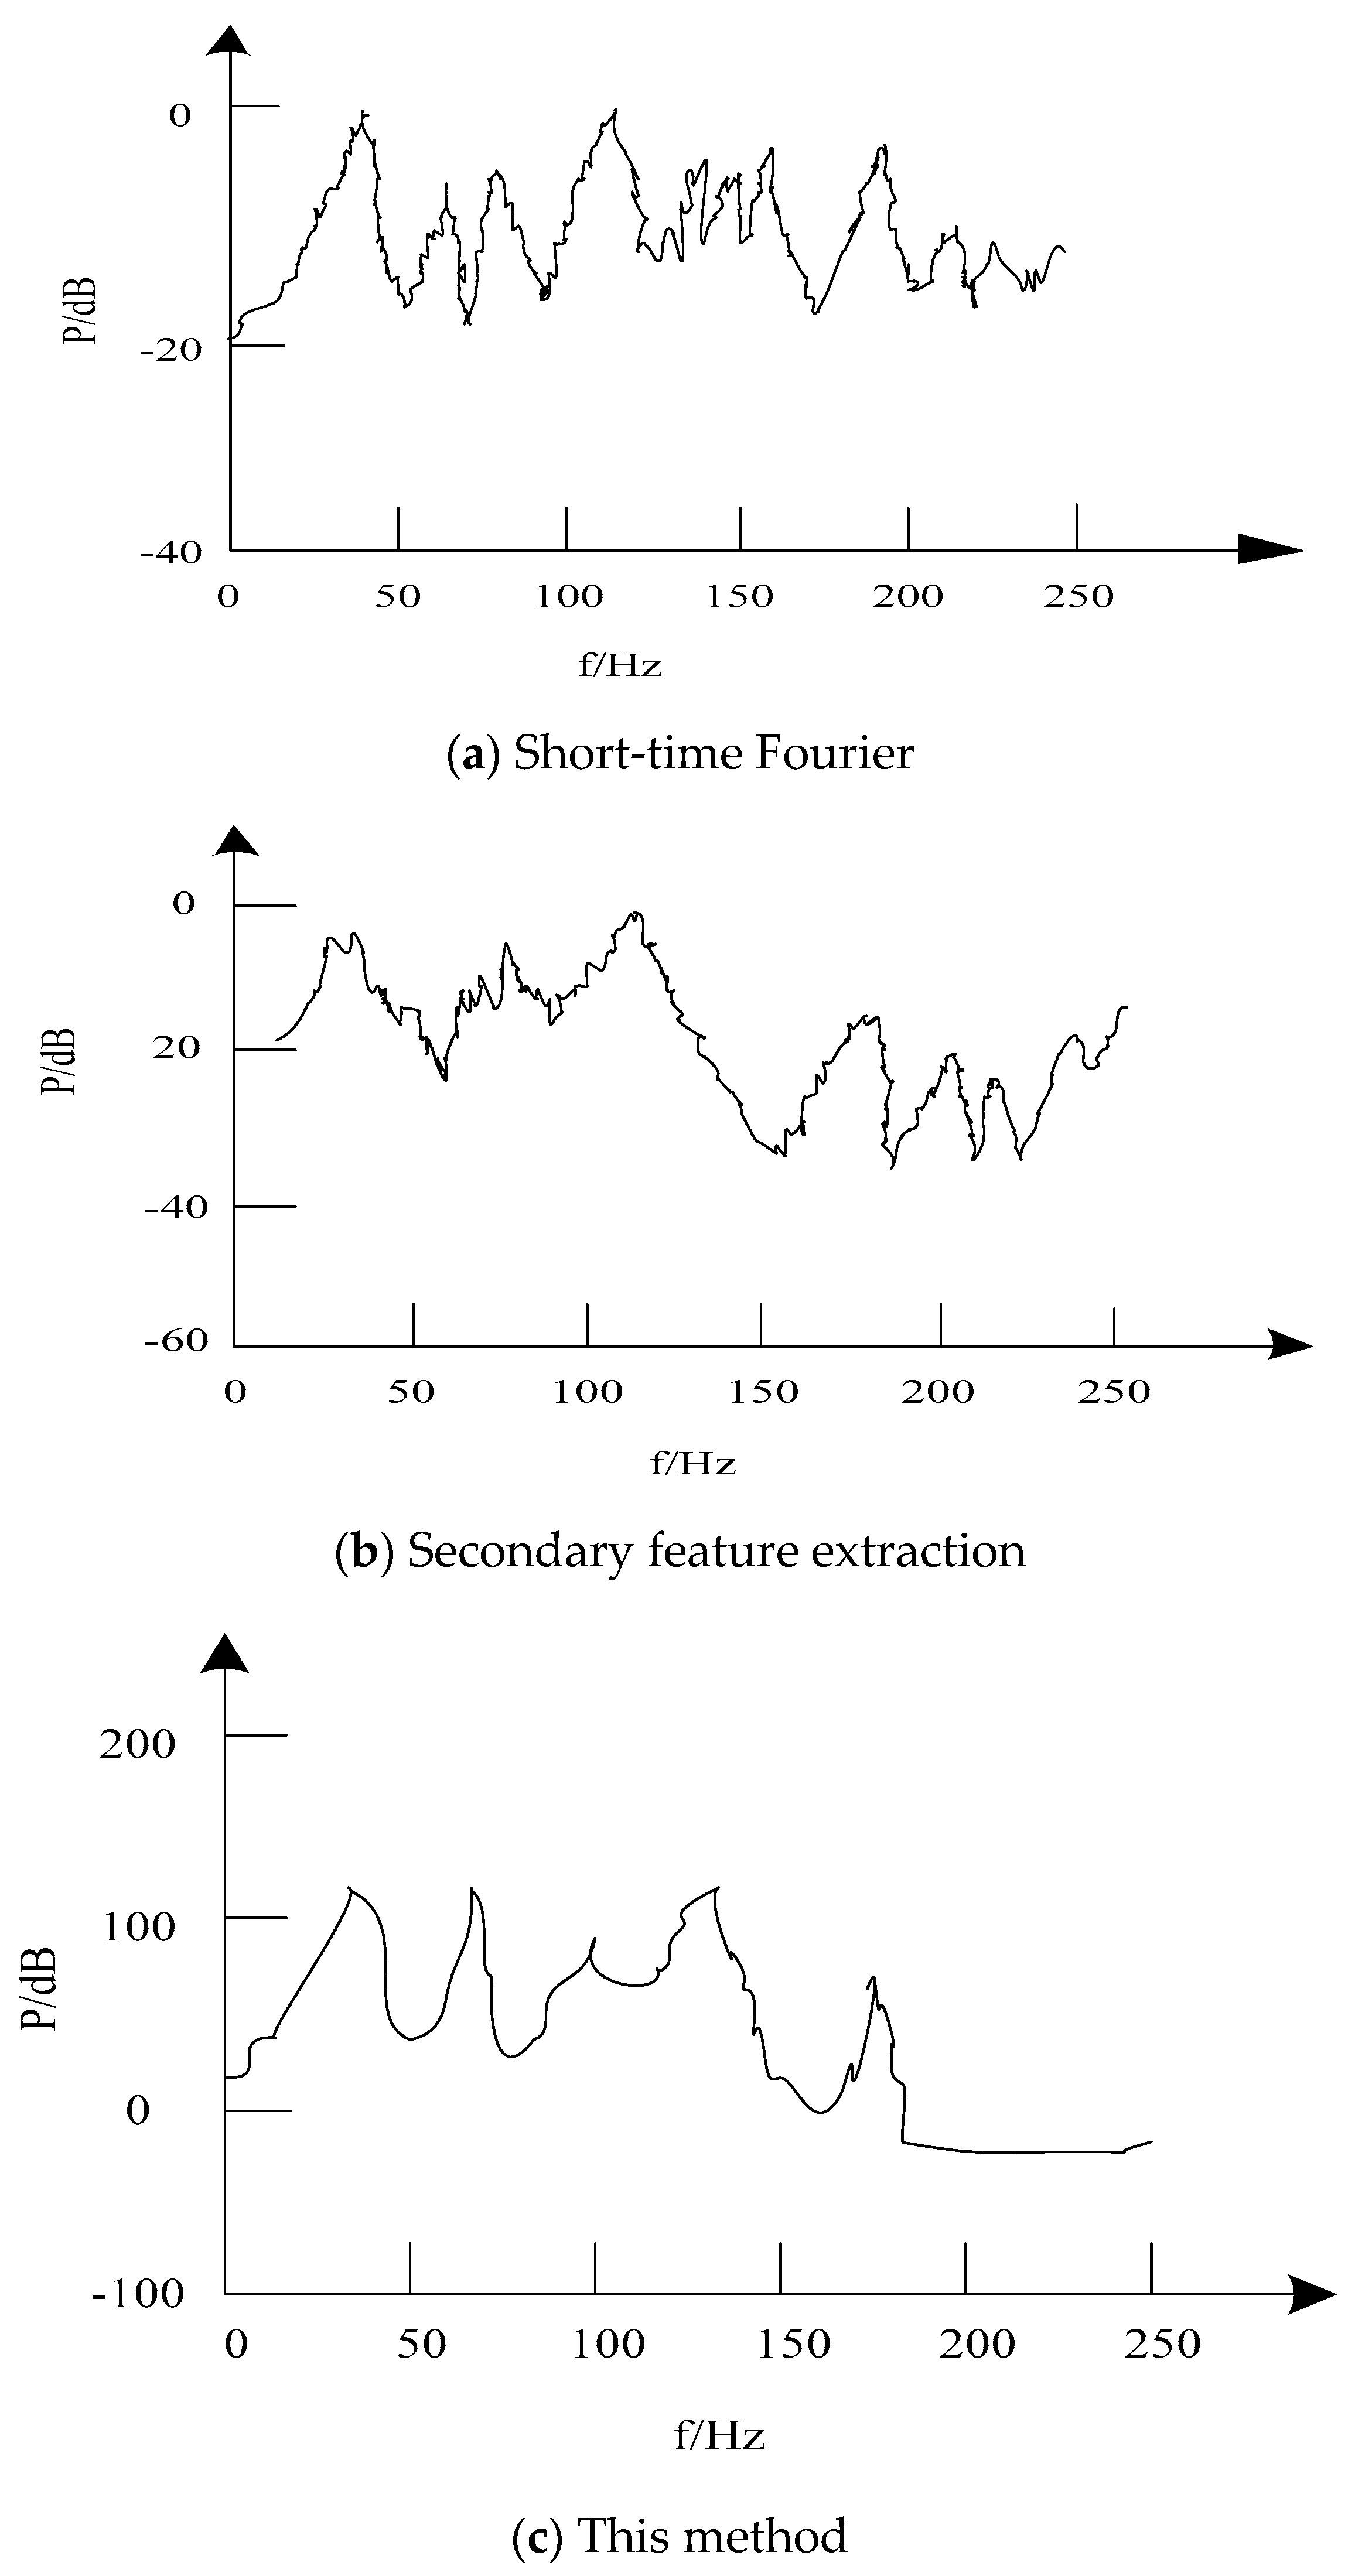
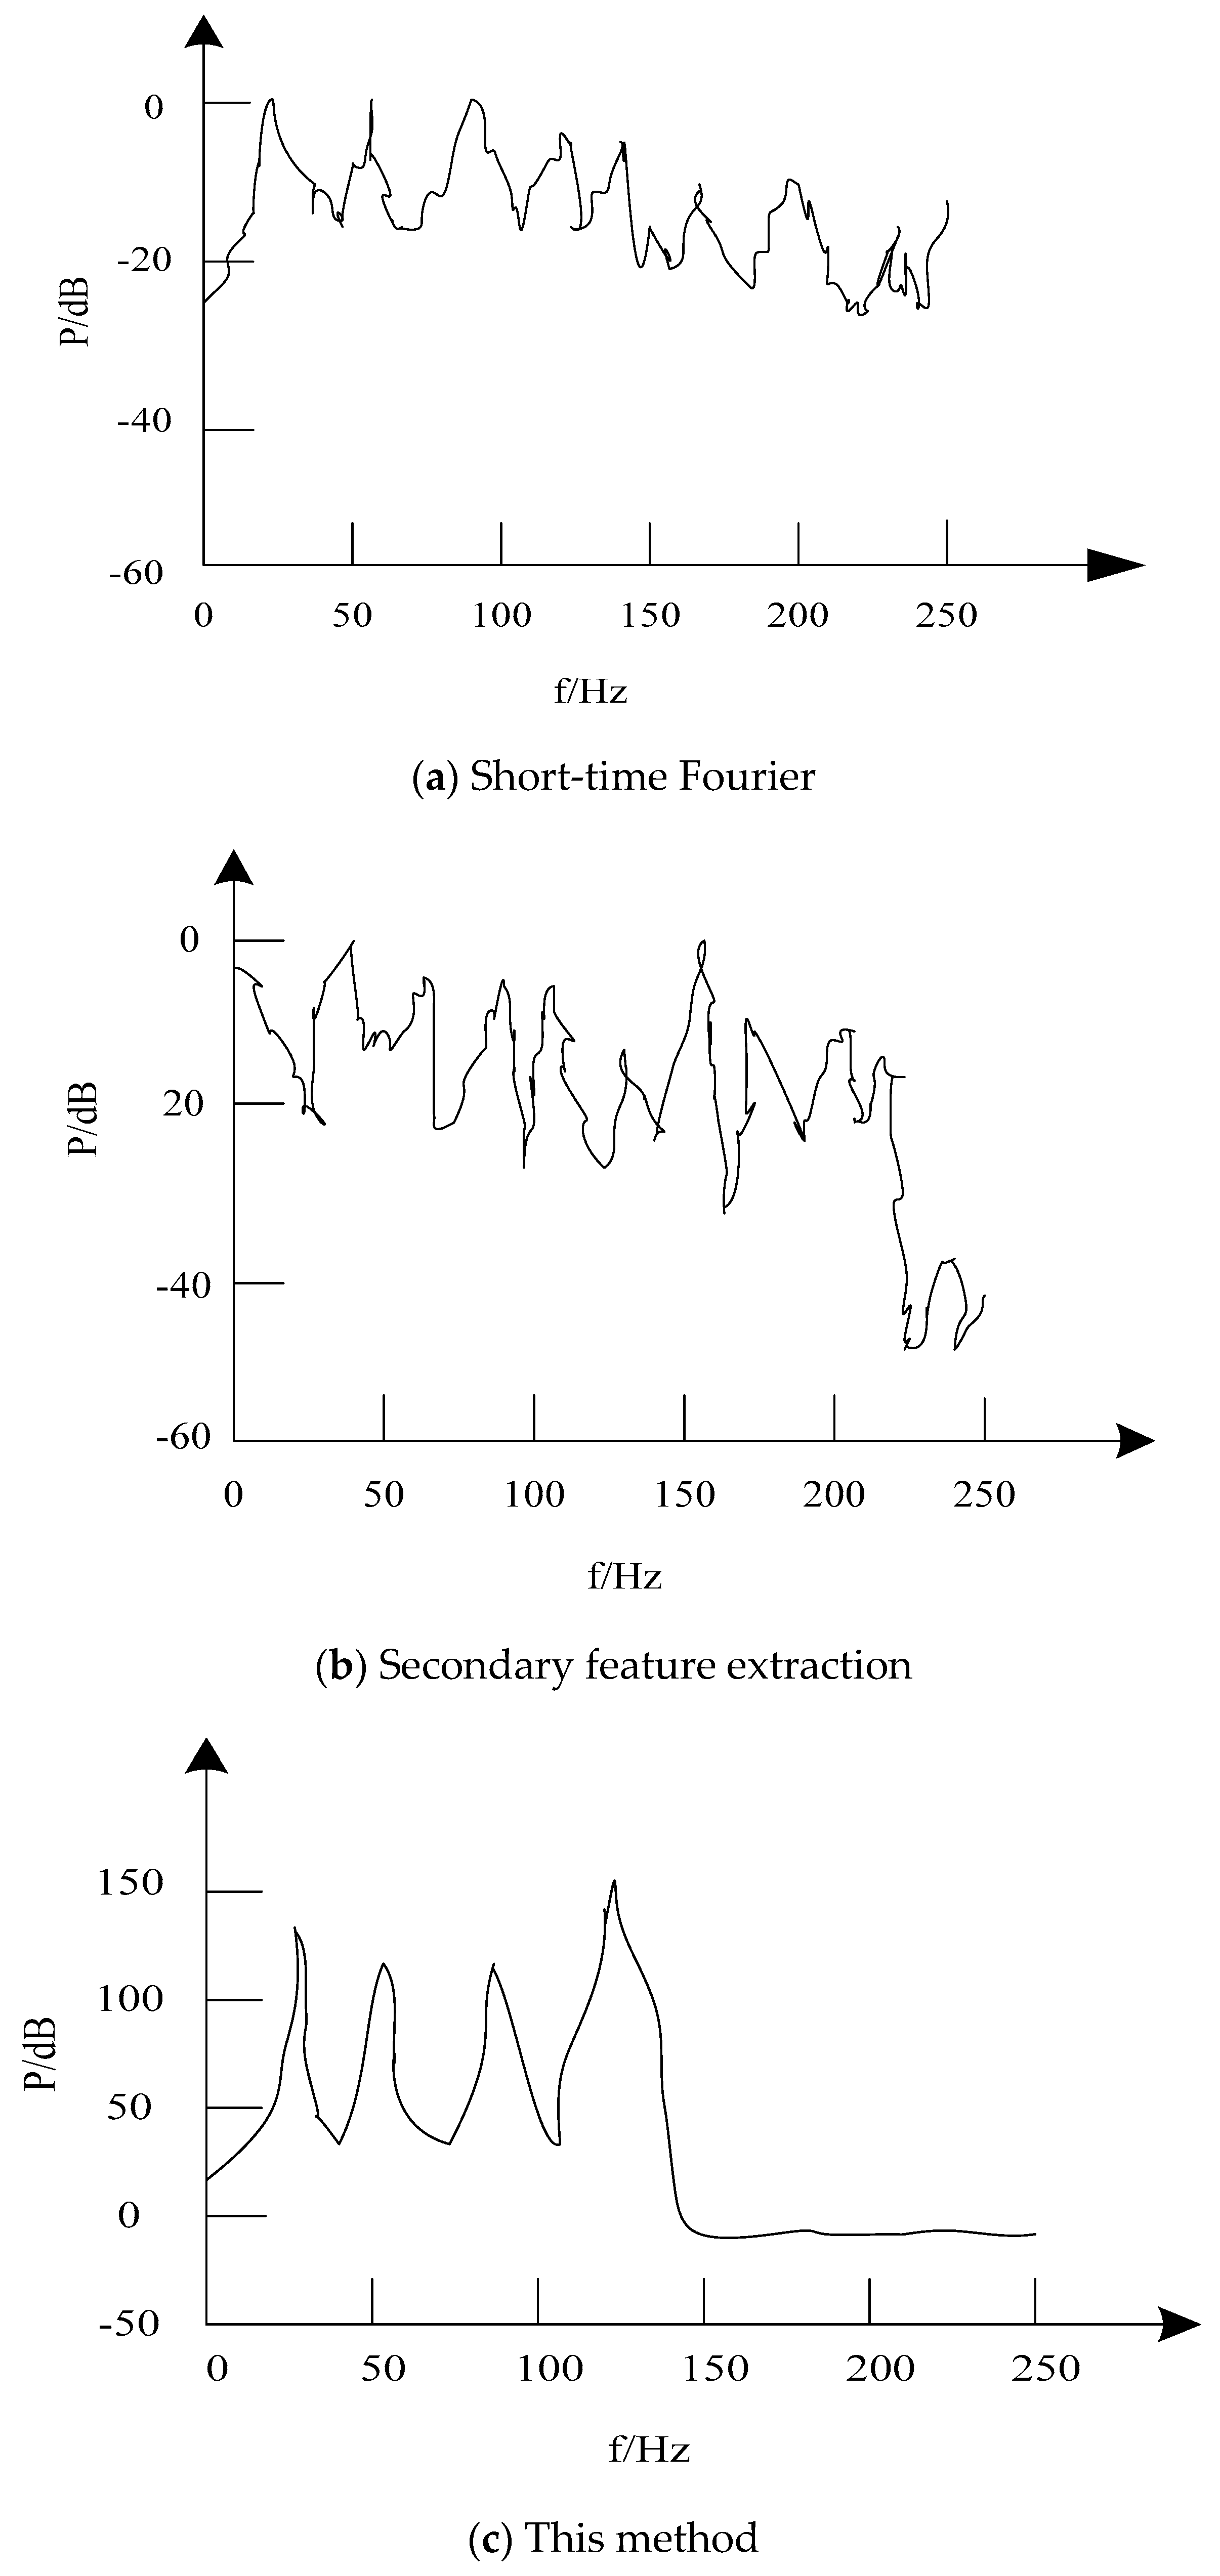
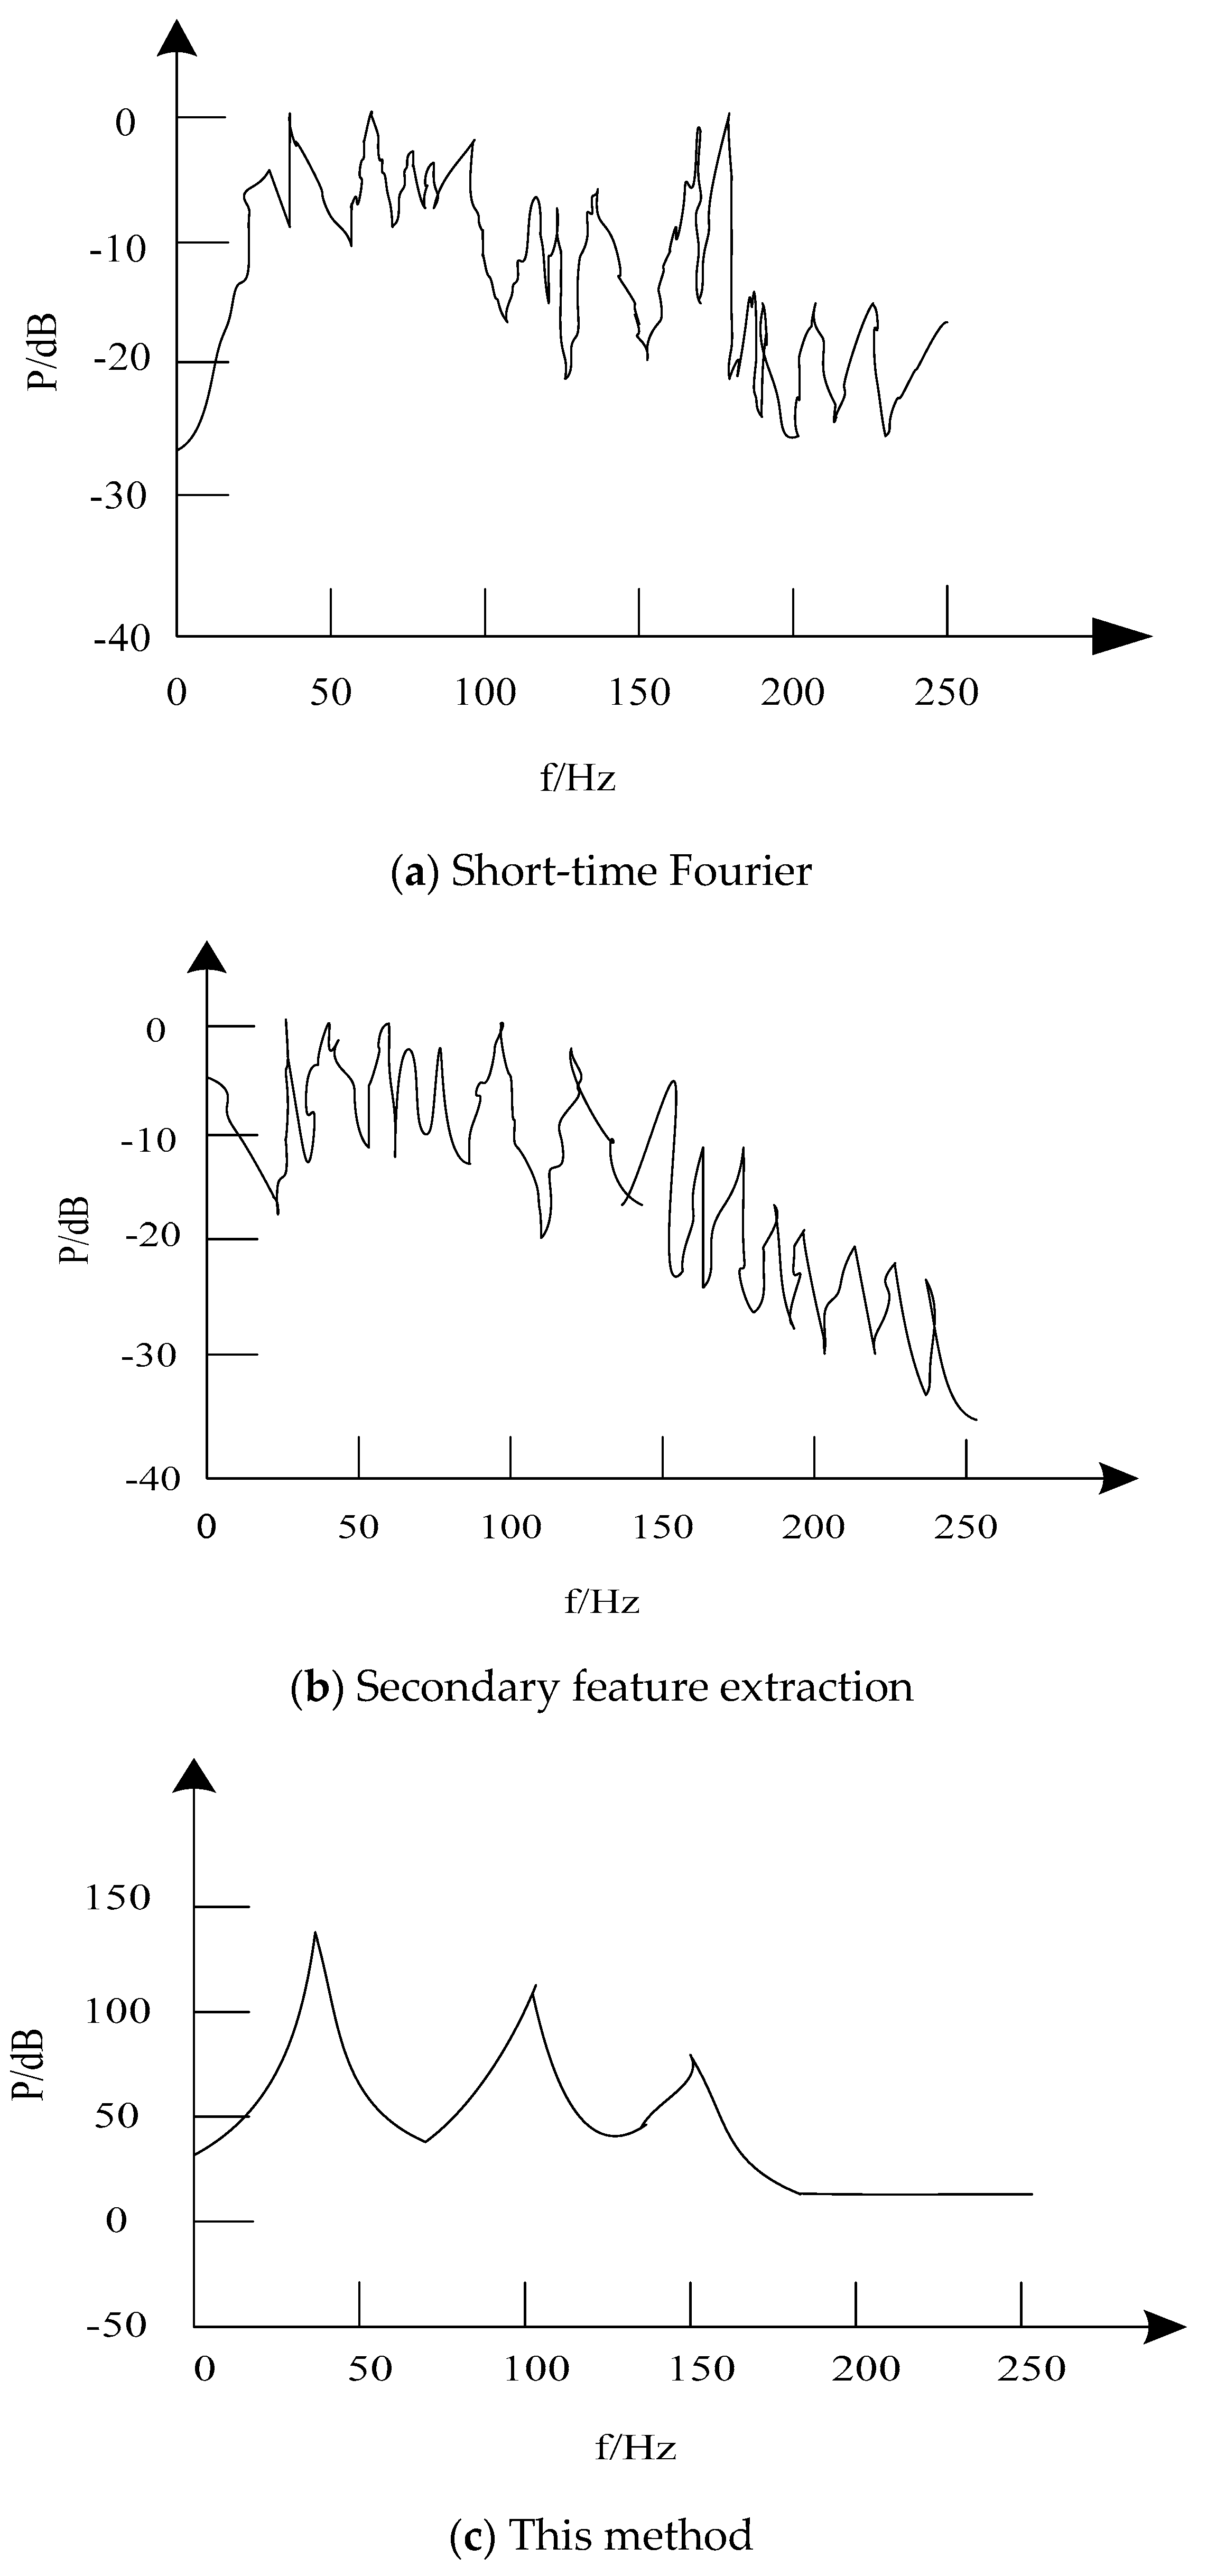
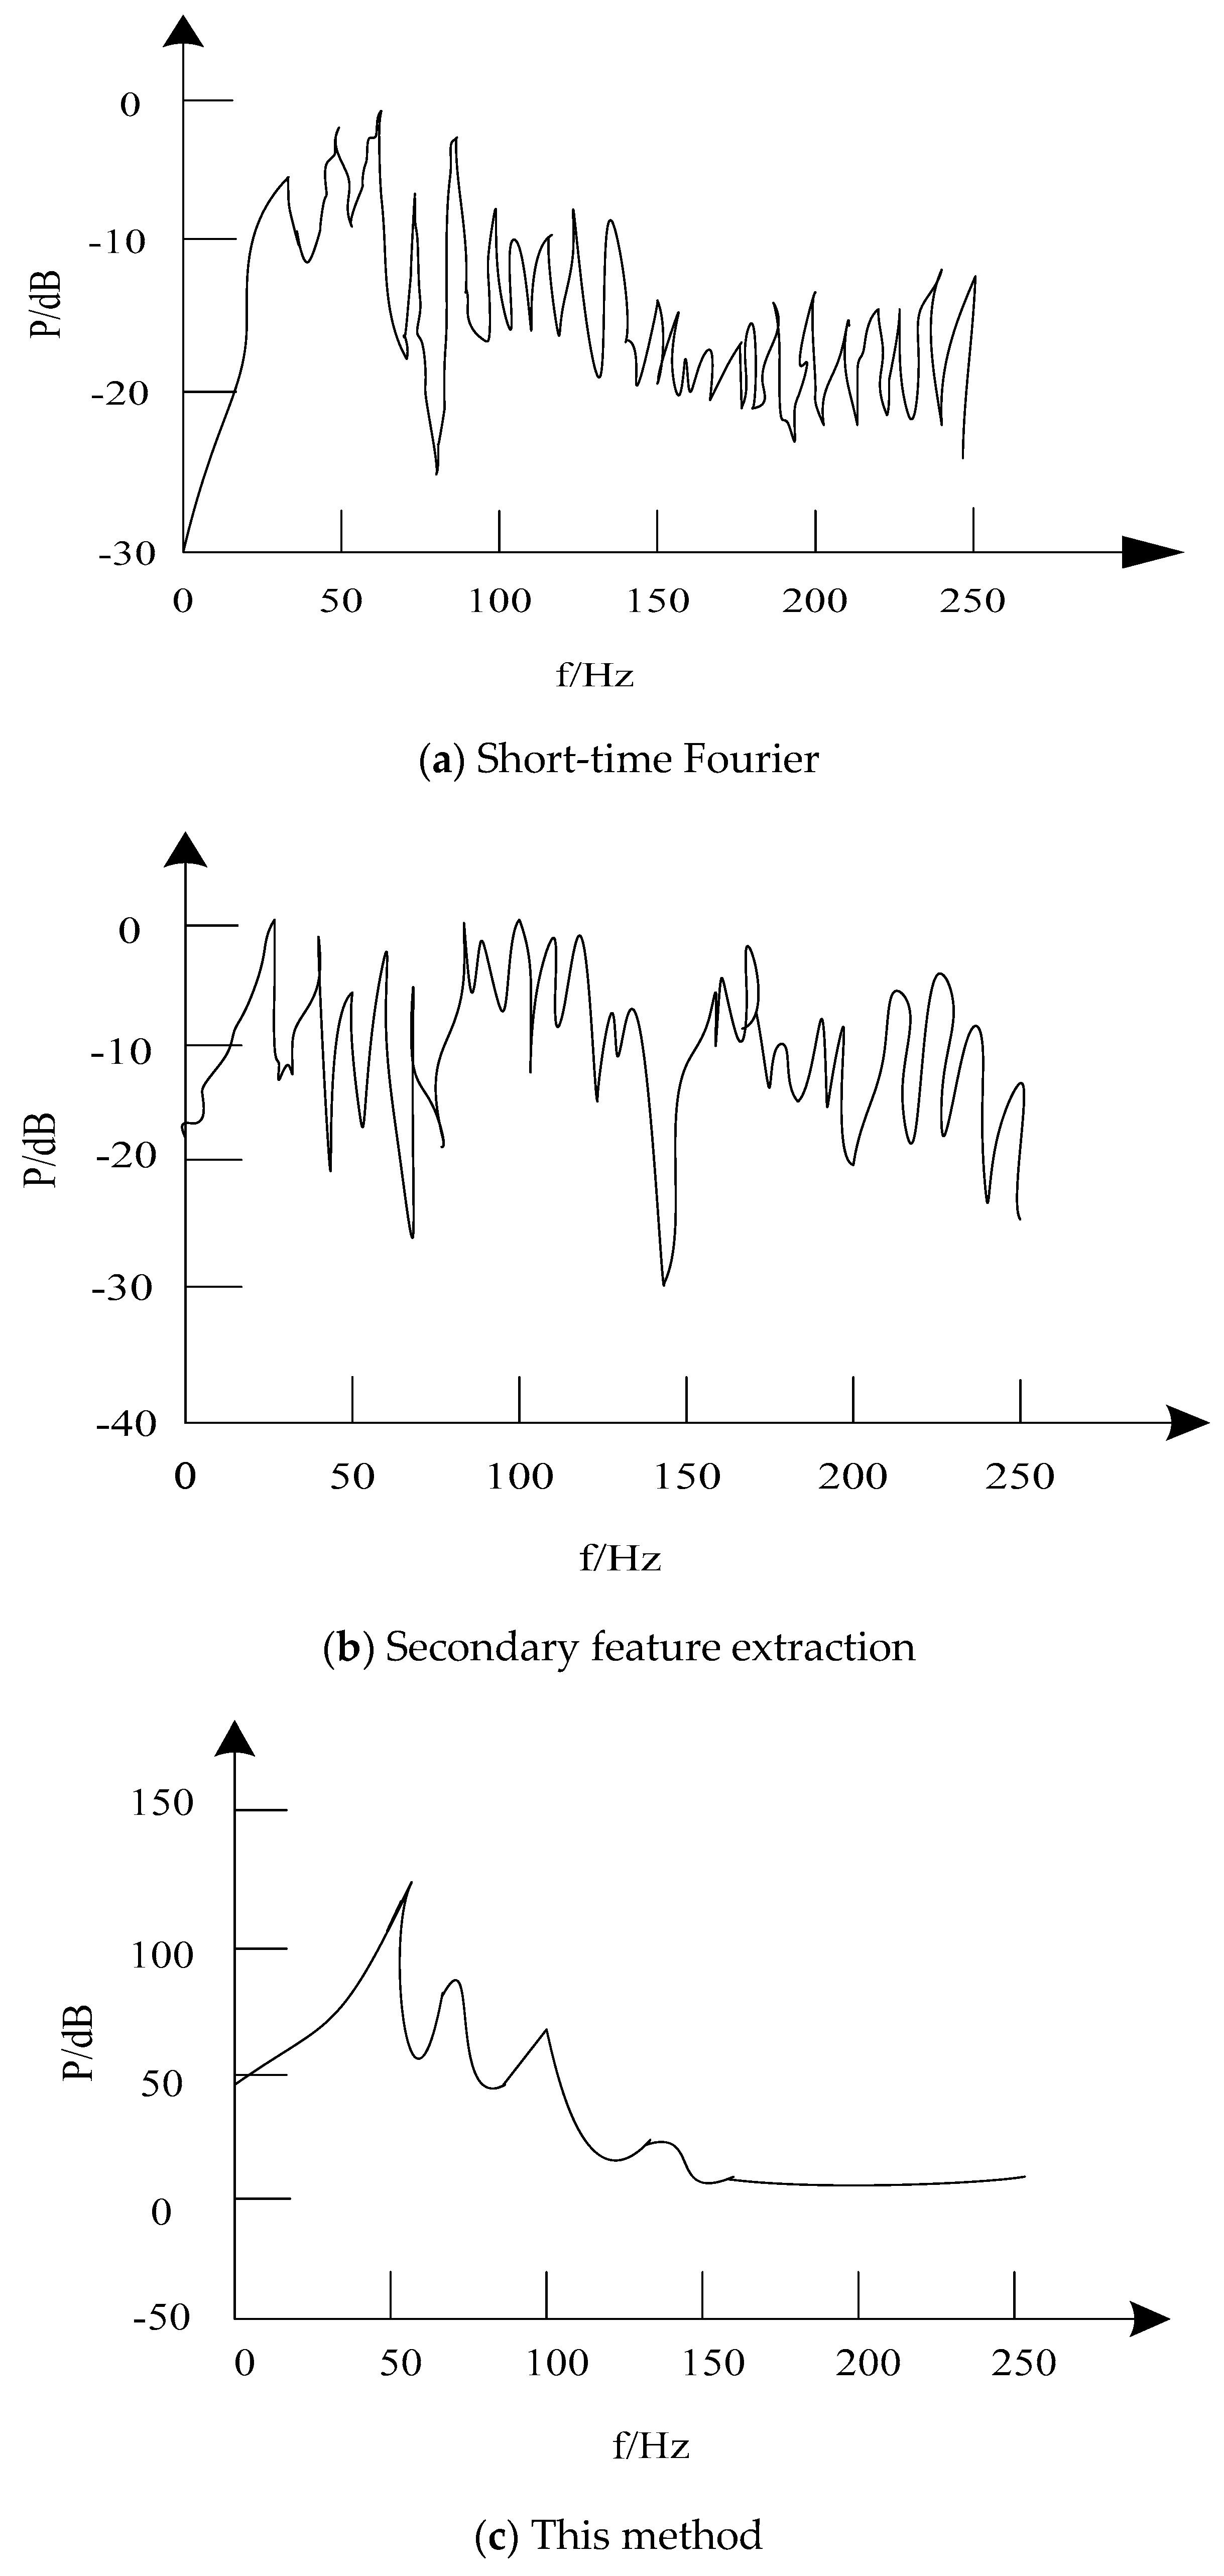
3.3. Extraction Effect Analysis of Frequency Feature

In order to verify the practical application effect of feature extraction of transmission signal in an electronic communication network based on the proposed method, a simulation application example of extracting harmonic frequency features of transmission signal in electronic communication network is given. The transmission signal of the electronic communication network is sampled by the computer at the frequency of 44,100 Hz. Because the sampling frequency is 1024 Hz, according to the sampling theorem, the analysis frequency is 512 Hz. Because the features of the transmission signal in the electronic communication network are mainly concentrated below 300 Hz, the frequency range of the proposed method is 0–250 Hz and the step length is ∆f = 0.5 Hz. The white noise interference signal with high intensity of 52,626 Hz is input into the experimental signal to simulate strong vibration, to verify the performance of the proposed method for the extraction of communication signal features in strong vibration environment. The experiment compares the proposed method with the short-time Fourier method and the quadratic feature extraction method. The extraction results of the signal frequency characteristics are described using Figure 7, Figure 8, Figure 9 and Figure 10 respectively.
In Figure 7, Figure 8, Figure 9 and Figure 10, (a) is the result of signal frequency feature extraction by short-time Fourier extraction method, (b) is the result of quadratic feature extraction method, and (c) is the result of the proposed method. By comparing and analyzing these figures, it can be seen that the method presented in this paper has good effect in extracting frequency features of transmission signals in electronic communication network under strong vibration environment. When extracting the transmission signals, the proposed method can restrain strong noise interference, highlight the position of spectral peaks, and reflect the quadratic phase coupling relationship between spectral peaks.

3.4. Analysis of Extraction Performance

Table 3 is the performance test results of feature extraction of network communication transmission signal in strong vibration environment by using the proposed method, quadratic feature extraction method, time domain inspection method, and short-time Fourier method. The signal-to-noise ratio (dB), stability (%), and efficiency (%) of transmission signal extraction in a strong vibration environment by four different methods are compared. The comparison results are used to measure the overall superiority of different methods for feature extraction of transmission signals in strong vibration environment.
From Table 3, it can be concluded that the overall superiority of the proposed method in extracting transmission signals under strong vibration environment is higher than the other three methods. This is mainly because when extracting transmission signals using the proposed method, symmetrical Holder coefficient feature extraction algorithm is used to transform transmission signals from time domain to frequency domain. The original signal feature space is mapped to a high-dimensional space, in which the optimal classification surface of signal features is established, so that the signal samples are separated correctly and the separation interval is maximized, which greatly improves the stability and efficiency of signal feature extraction in the proposed method and effectively reduces the effect of strong vibration noise environment on the feature extraction of communication signals.

4. Discussion

The transmission signal characteristics of six different types of electronic communication networks are extracted by the method designed in this paper. The average correct extraction rate is greater than 92%, and the maximum correct extraction rate is 98.21%. The experimental results can prove that the proposed method can accurately extract the signal characteristics of the electronic communication network, and the extraction effect is considerable. Due to the influence of noise caused by external environment and other factors in the process of extracting the signal characteristics of the electronic communication network, the original signal received or transmitted by the electronic communication network may be completely submerged in the noise, and it is difficult to extract the original characteristics of the transmitted signal. When using the method of this paper to extract the characteristics of the transmission signal of electronic communication network, the method of threshold denoising is firstly used to eliminate the interference of environmental noise on the signal extraction engineering, so that the noise has little influence on the extraction of the characteristic signal, which greatly improves the accuracy of signal feature extraction. It is able to guarantee the characteristics of the original transmission signal as much as possible.
Using symmetric Holder coefficients, the performance of proposed method, short-time Fourier extraction method, time domain inspection method and quadratic feature extraction method in modulation time feature extraction, energy time-varying feature extraction and band feature extraction are described by using Table 2. It can be seen from Table 2 that the proposed method can effectively identify the FSK communication transmission signal and can extract three of them well, but the extraction effects of the other three methods are not ideal. Therefore, it can be explained that the method of this paper has a high feature extraction effect on the network transmission signal.
In summary, compared with other methods, the proposed method can extract the frequency characteristics of the signal more effectively. This is because the method can effectively suppress the interference of strong environmental noise, highlight the position of the peak, and reflect the secondary phase coupling relationship between the peaks. The main reason is that the method uses the symmetry retention coefficient to identify the signal sequence, then uses the neural network classifier to classify and identify the signal sequence, and, on the basis of identification, extracts the characteristics of the transmitted signal in the communication network under strong morning environment. Because the optimization is carried out the extraction effect of the transmission signal characteristics of the communication network under strong vibration is greatly improved, and the method has more obvious application advantages than the traditional method.

5. Conclusions

The electronic communication network provides an effective guarantee for information transmission for social development. The level of its technology determines the level of national science and technology development. It is an important strategic component of the information industry. It can drive the development of advanced productive forces for all aspects of society. Sustainable development makes an important contribution. Research on electronic communication network technology can make the development of this field more and more advanced. In order to improve the feature extraction of transmitted signals in electronic communication networks under a strong vibration environment, a feature extraction method based on symmetric algorithm for transmitting signals in electronic communication networks is proposed. This method can effectively remove noise and retain available transmission signals. The signal is denoised by threshold denoising and data dimensionality reduction, and then the transmitted signal is transformed from the time domain to the frequency domain and classified by the symmetric retention coefficient feature extraction algorithm. The experimental results show that the proposed method has high signal feature extraction accuracy and satisfactory results.

Funding

This research received no external funding.

Conflicts of Interest

The author declares no conflict of interest.

References

  1. Chen, Y.Q.; Fink, O.; Sansavini, G. Combined Fault Location and Classification for Power Transmission Lines Fault Diagnosis with Integrated Feature Extraction. IEEE Trans. Ind. Electron. 2018, 99, 561–569. [Google Scholar] [CrossRef]
  2. Cui, J.; Zheng, Q.; Xin, Y. Feature Extraction and Classification Method for Switchgear Faults Based on Sample Entropy and Cloud Model. IET Gener. Transm. Distrib. 2017, 11, 2938–2946. [Google Scholar]
  3. Zeng, F.; Dong, Y.; Ju, T. Feature Extraction and Severity Assessment of Partial Discharge under Protrusion Defect Based on Fuzzy Comprehensive Evaluation. IET Gener. Transm. Distrib. 2015, 9, 2493–2500. [Google Scholar] [CrossRef]
  4. Li, Z.X.; Jiang, Y.; Wang, X.; Peng, Z. Multi-Mode Separation and Nonlinear Feature Extraction of Hybrid Gear Failures in Coal Cutters Using Adaptive Nonstationary Vibration Analysis. Nonlinear Dyn. 2016, 84, 295–310. [Google Scholar] [CrossRef]
  5. Xu, K.; Ta, D.; Cassereau, D. Multichannel Processing for Dispersion Curves Extraction of Ultrasonic Axial-Transmission Signals: Comparisons and Case Studies. J. Acoust. Soc. Am. 2016, 140, 1758–1770. [Google Scholar] [PubMed]
  6. Wadduwage, D.P.; Annakkage, U.D.; Narendra, K. Identification of Dominant Low-Frequency Modes in Ring-Down Oscillations Using Multiple Prony Models. IET Gener. Transm. Distrib. 2015, 9, 2206–2214. [Google Scholar] [CrossRef]
  7. Gustavsen, B. Optimal Time Delay Extraction for Transmission Line Modeling. IEEE Trans. Power Deliv. 2017, 32, 45–54. [Google Scholar] [Green Version]
  8. Lauretis, M.D.; Antonini, G.; Ekman, J.A. SPICERealization of the Delay-Rational Green’s-Function-Based Method for Multiconductor Transmission Lines. IEEE Trans. Electromagn. Compat. 2016, 58, 1158–1168. [Google Scholar] [CrossRef]
  9. Ji, W.; Zhang, M.; Wang, T. Molecularly Imprinted Solid-Phase Extraction Method Based on Sh-Au Modified Silica Gel for The Detection of Six Sudan Dyes in Chili Powder Samples. Talanta 2016, 165, 18–26. [Google Scholar] [CrossRef]
  10. Guan, H.; Yu, Y.; Li, J. Extraction of Power-Transmission Lines from Vehicle-Borne Lidar Data. Int. J. Remote Sens. 2016, 37, 229–247. [Google Scholar] [CrossRef]
  11. Yang, Y.; Zhong, M.; Yao, H.; Yu, F.; Fu, X.; Postolache, O. Internet of Things for Smart Ports: Technologies and Challenges. IEEE Instrum. Meas. Mag. 2018, 21, 34–43. [Google Scholar] [CrossRef]
  12. Bhavani, R.R.; Jiji, G.W. Image Registration for Varicose Ulcer Classification Using Knn Classifier. Int. J. Comput. Appl. 2018, 40, 88–97. [Google Scholar] [CrossRef]
  13. Santos, G.L.; Takako Endo, P.; Ferreira Da Silva Lisboa Tigre, M.F.; da Silva, L.G.F.; Sadok, D.; Kelner, J.; Lynn, T. Analyzing the Availability and Performance of an E-Health System Integrated with Edge, Fog and Cloud Infrastructures. J. Cloud Comput. 2018, 7, 16. [Google Scholar] [CrossRef]
  14. Liu, L.; Duan, J.Q.; Liu, Y.M. Classification of Ship Radiated Noise Based on Auditory Features. J. China Acad. Electron. Inf. Technol. 2016, 11, 401–406. [Google Scholar]
  15. Zhou, Z.; Zhu, W.; Zhu, H. Two-Astable-Oscillator Circuit Based on Coupling Memcapacitor Simulator. J. Power Supply 2018, 16, 171–177. [Google Scholar]
  16. Jin, J.; Mi, W. An Aimms-Based Decision-Making Model for Optimizing the Intelligent Stowage of Export Containers in a Single Bay. Discret. Contin. Dyn. Syst. Ser. S 2019, 12, 1101–1115. [Google Scholar] [CrossRef]
  17. Li, Q.; Yin, Y.A. Research on Ranging System and Stereo Matching Algorithm Based on Binocular Camera. Telecom Power Technol. 2016, 33, 66–67. [Google Scholar] [CrossRef]
  18. Pan, Z.R.; Liu, X.; Qiao, Z.J. Intelligent Fault Diagnosis of Rolling Bearing Based on Wavelet Packet Energy and BP Neural Network. Autom. Instrum. 2015, 5, 82–84. [Google Scholar]
  19. Kilaru, V.; Amin, M.; Ahmad, F. Gaussian Mixture Modeling Approach for Stationary Human Identification in Through-The-Wall Radar Imagery. J. Electron. Imaging 2015, 24, 13–28. [Google Scholar] [CrossRef]
  20. Leiva, L.A.; Alabau, V. Polyglot Machine Translation. J. Intell. Fuzzy Syst. 2017, 32, 613–627. [Google Scholar] [CrossRef]
  21. Yu, S.K.; Tague, P.; Lee, H. A Jamming Approach to Enhance Enterprise Wi-Fi Secrecy through Spatial Access Contro. Wirel. Netw. 2015, 21, 2631–2647. [Google Scholar]
  22. You, X.; Piao, C.; Chen, L. Preparation of a Magnetic Molecularly Imprinted Polymer by Atom-Transfer Radical Polymerization for the Extraction of Parabens from Fruit Juices. J. Sep. Sci. 2016, 39, 2831–2838. [Google Scholar] [CrossRef] [PubMed]
  23. Hosamani, S.M. Correlation of Domination Parameters with Physicochemical Properties of Octane Isomers. Appl. Math. Nonlinear Sci. 2016, 1, 345–352. [Google Scholar] [CrossRef]
  24. Chen, S.H.; Chow, C.W. Hierarchical Scheme for Detecting the Rotating MIMO Transmission of the In-Door RGB-LED Visible Light Wireless Communications Using Mobile-Phone Camera. Opt. Commun. 2015, 335, 189–193. [Google Scholar] [CrossRef]
Figure 1. Processing flow of symmetric Holder coefficient method.
Symmetry 11 00410 g001
Figure 2. Structure diagram of neural network classifier.
Symmetry 11 00410 g002
Figure 3. p = 5-point electronic communication network transmission signal symmetry Holder coefficient characteristic distribution map.
Symmetry 11 00410 g003
Figure 4. Actual signal amplitude characteristics.
Symmetry 11 00410 g004
Figure 5. Signal amplitude characteristics extracted by quadratic feature extraction method.
Symmetry 11 00410 g005
Figure 6. Characteristics of signal amplitude extracted by this method.
Symmetry 11 00410 g006
Figure 7. Data 1 simulation results.
Symmetry 11 00410 g007
Figure 8. Data 2 simulation results.
Symmetry 11 00410 g008
Figure 9. Data 3 simulation results.
Symmetry 11 00410 g009
Figure 10. Data 4 simulation results.
Symmetry 11 00410 g010
Table 1. Average accurate extraction rate of transmission signal in electronic communication network.
p-Value2345
Average Correct Identification Rate (%)92.8497.2598.2197.62
p-value68910
Average Correct Identification Rate (%)97.7196.1596.1596.63
Table 2. Comparison of the effectiveness of frequency-coded signal (FSK) transmission signal feature extraction method.
Time Domain Check MethodShort-time Fourier extraction methodQuadratic Feature Extraction MethodThis Method
Modulation time feature extraction performancedifferencepoorgeneralVery good
Capability of energy time-varying feature extractiongeneralgoodgoodVery good
Frequency band feature extraction performancenoBetter.goodVery good
Table 3. Comparison of the overall superiority of transmission signal extraction by different methods.
MethodSignal-to-Noise Ratio (dB)Stability (%)Efficiency (%)
This method6.9998.697.4
Quadratic feature extraction method2.1569.373.1
Time domain check3.2370.279.2
Short time Fourier2.5660.574.1

