Generalized Truncation Positive Normal Distribution


Abstract
:1. Introduction
2. Model Properties
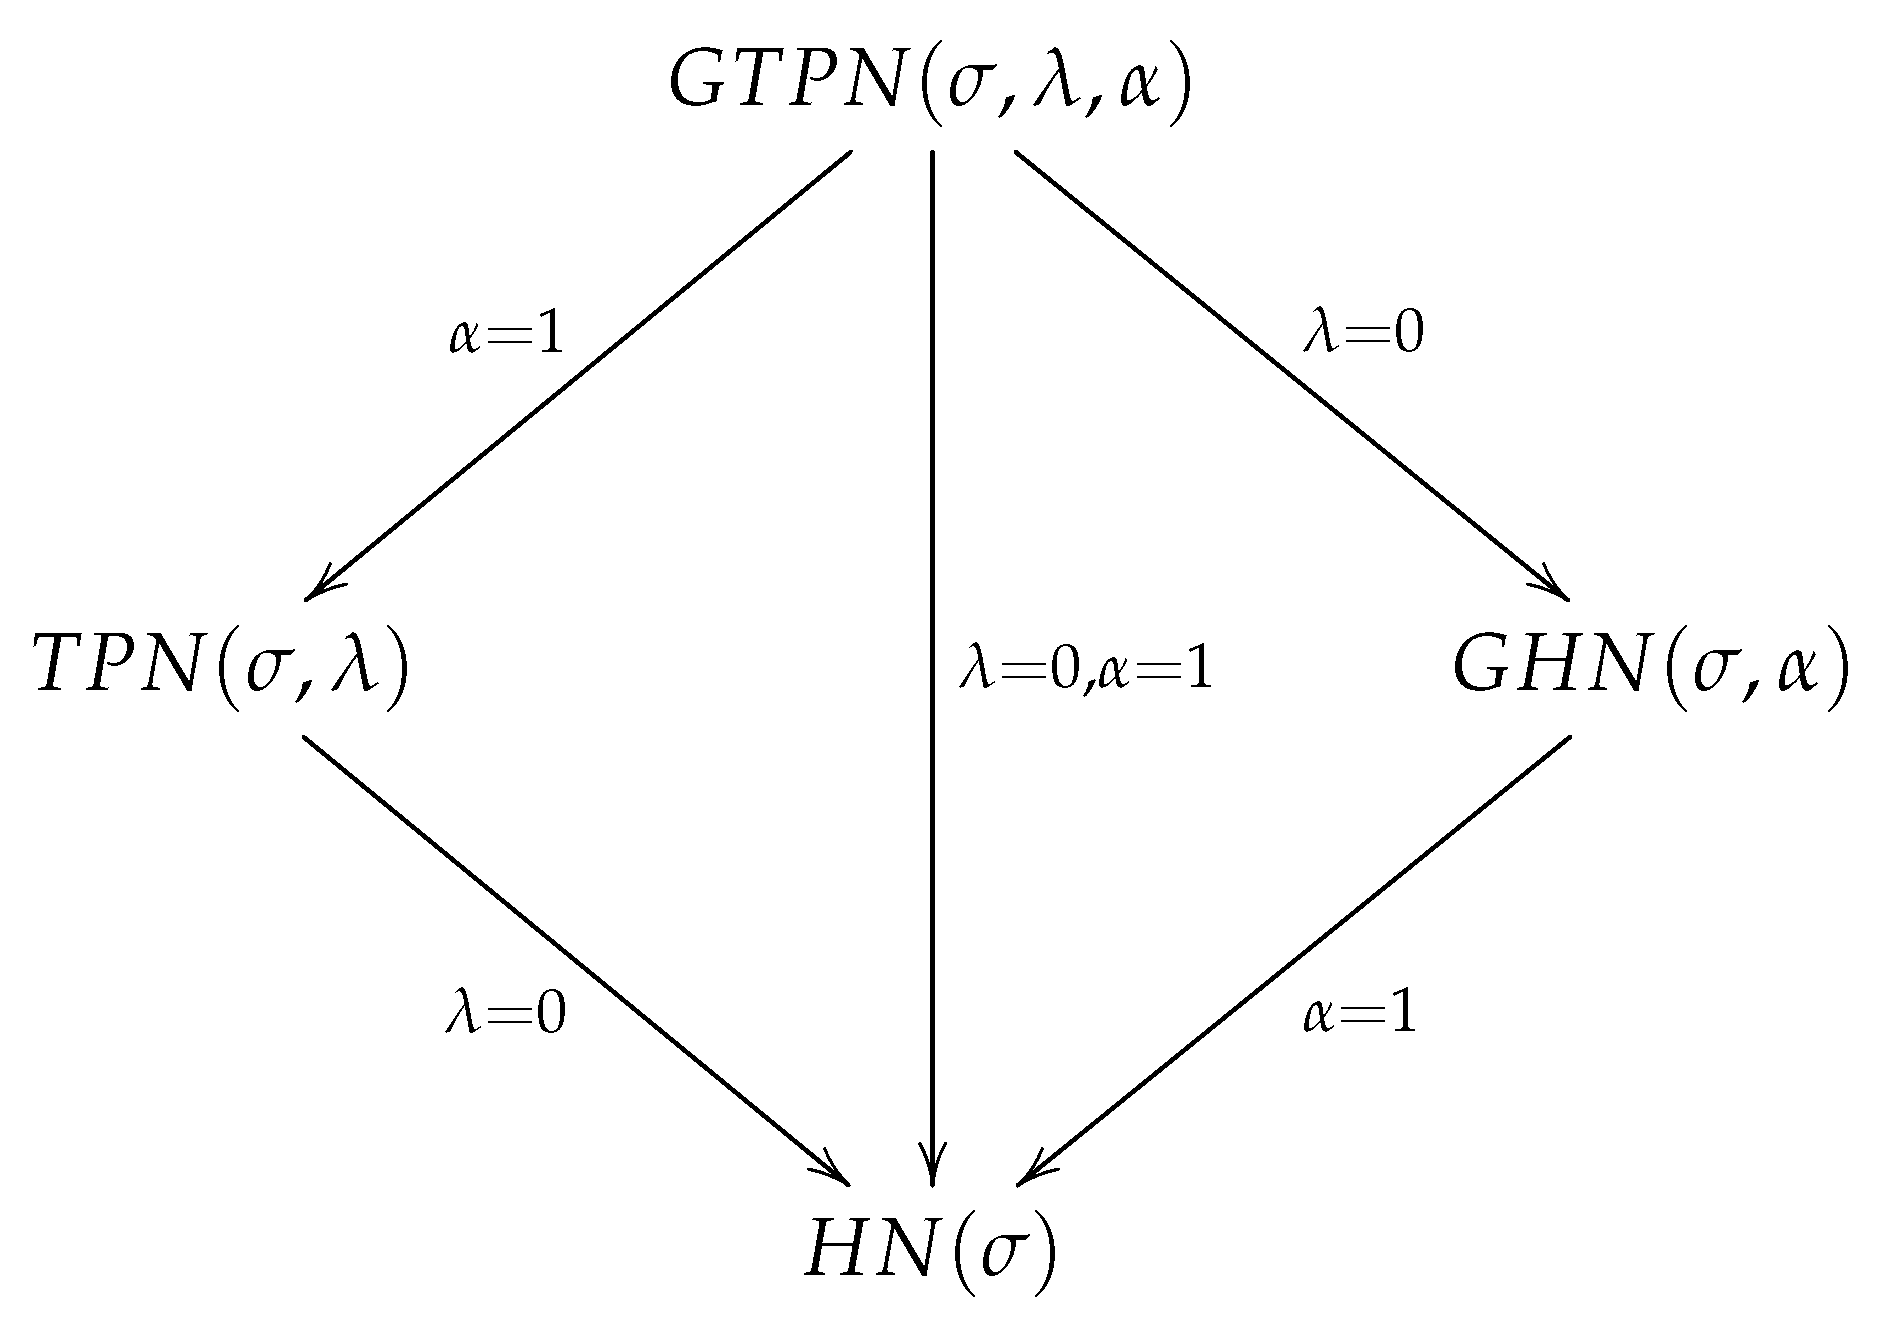
2.1. Stochastic Representation and Particular Cases
- .
- .
- .
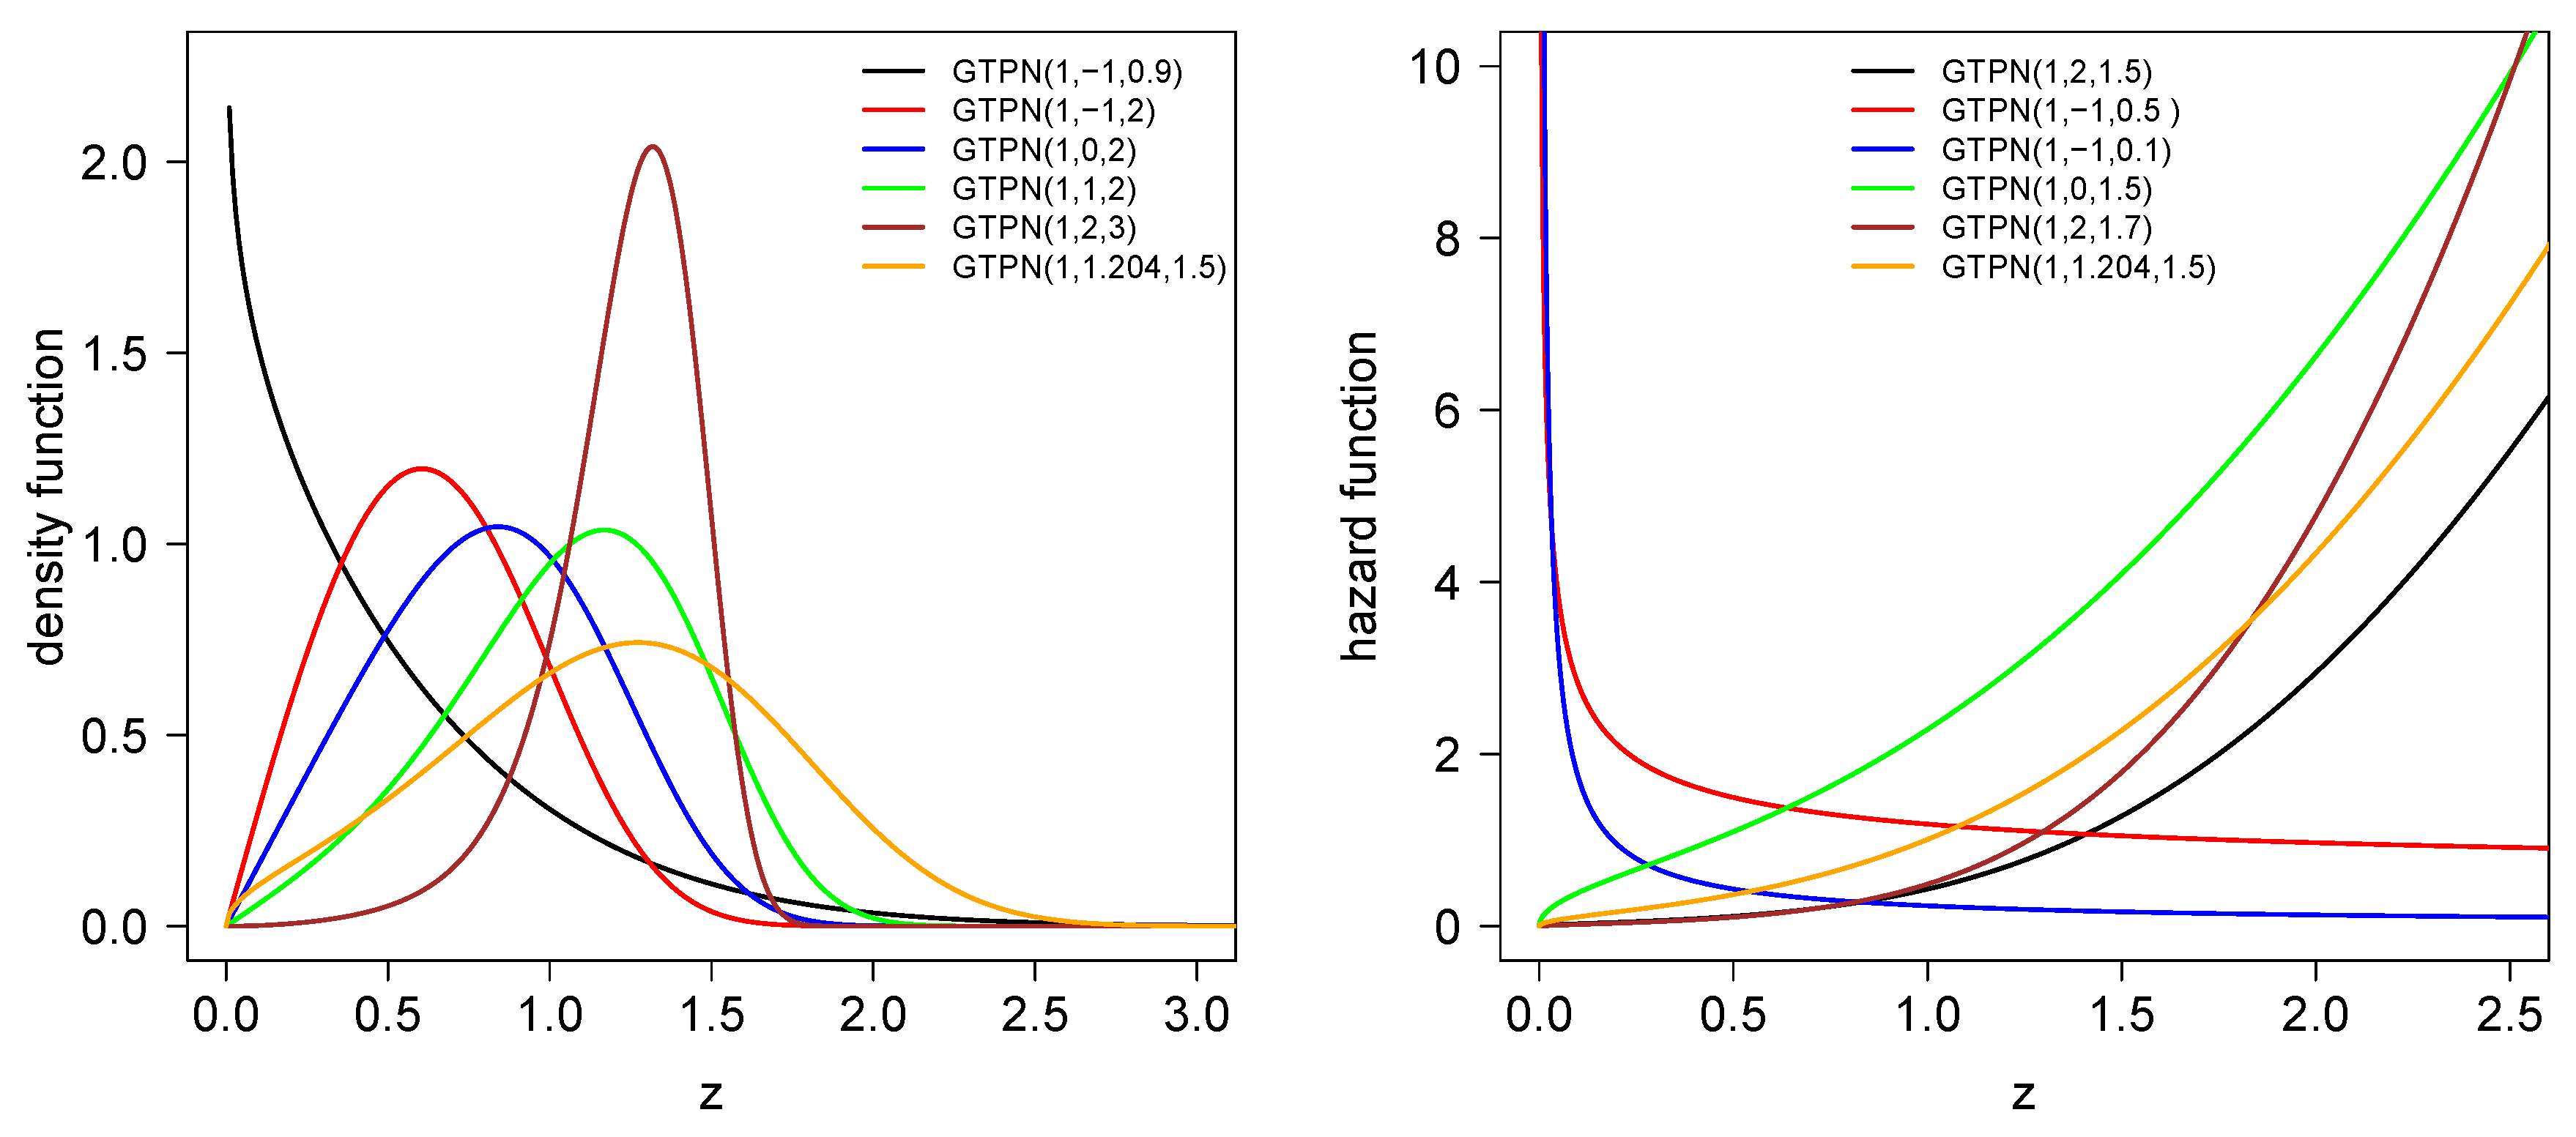
2.2. Density, Cdf and Hazard Functions
2.3. Mode
- 1.
- atwheneverorand,
- 2.
- atin otherwise.
2.4. Quantiles
- 1.
- First quartile.
- 2.
- Median.
- 3.
- Third quartile.
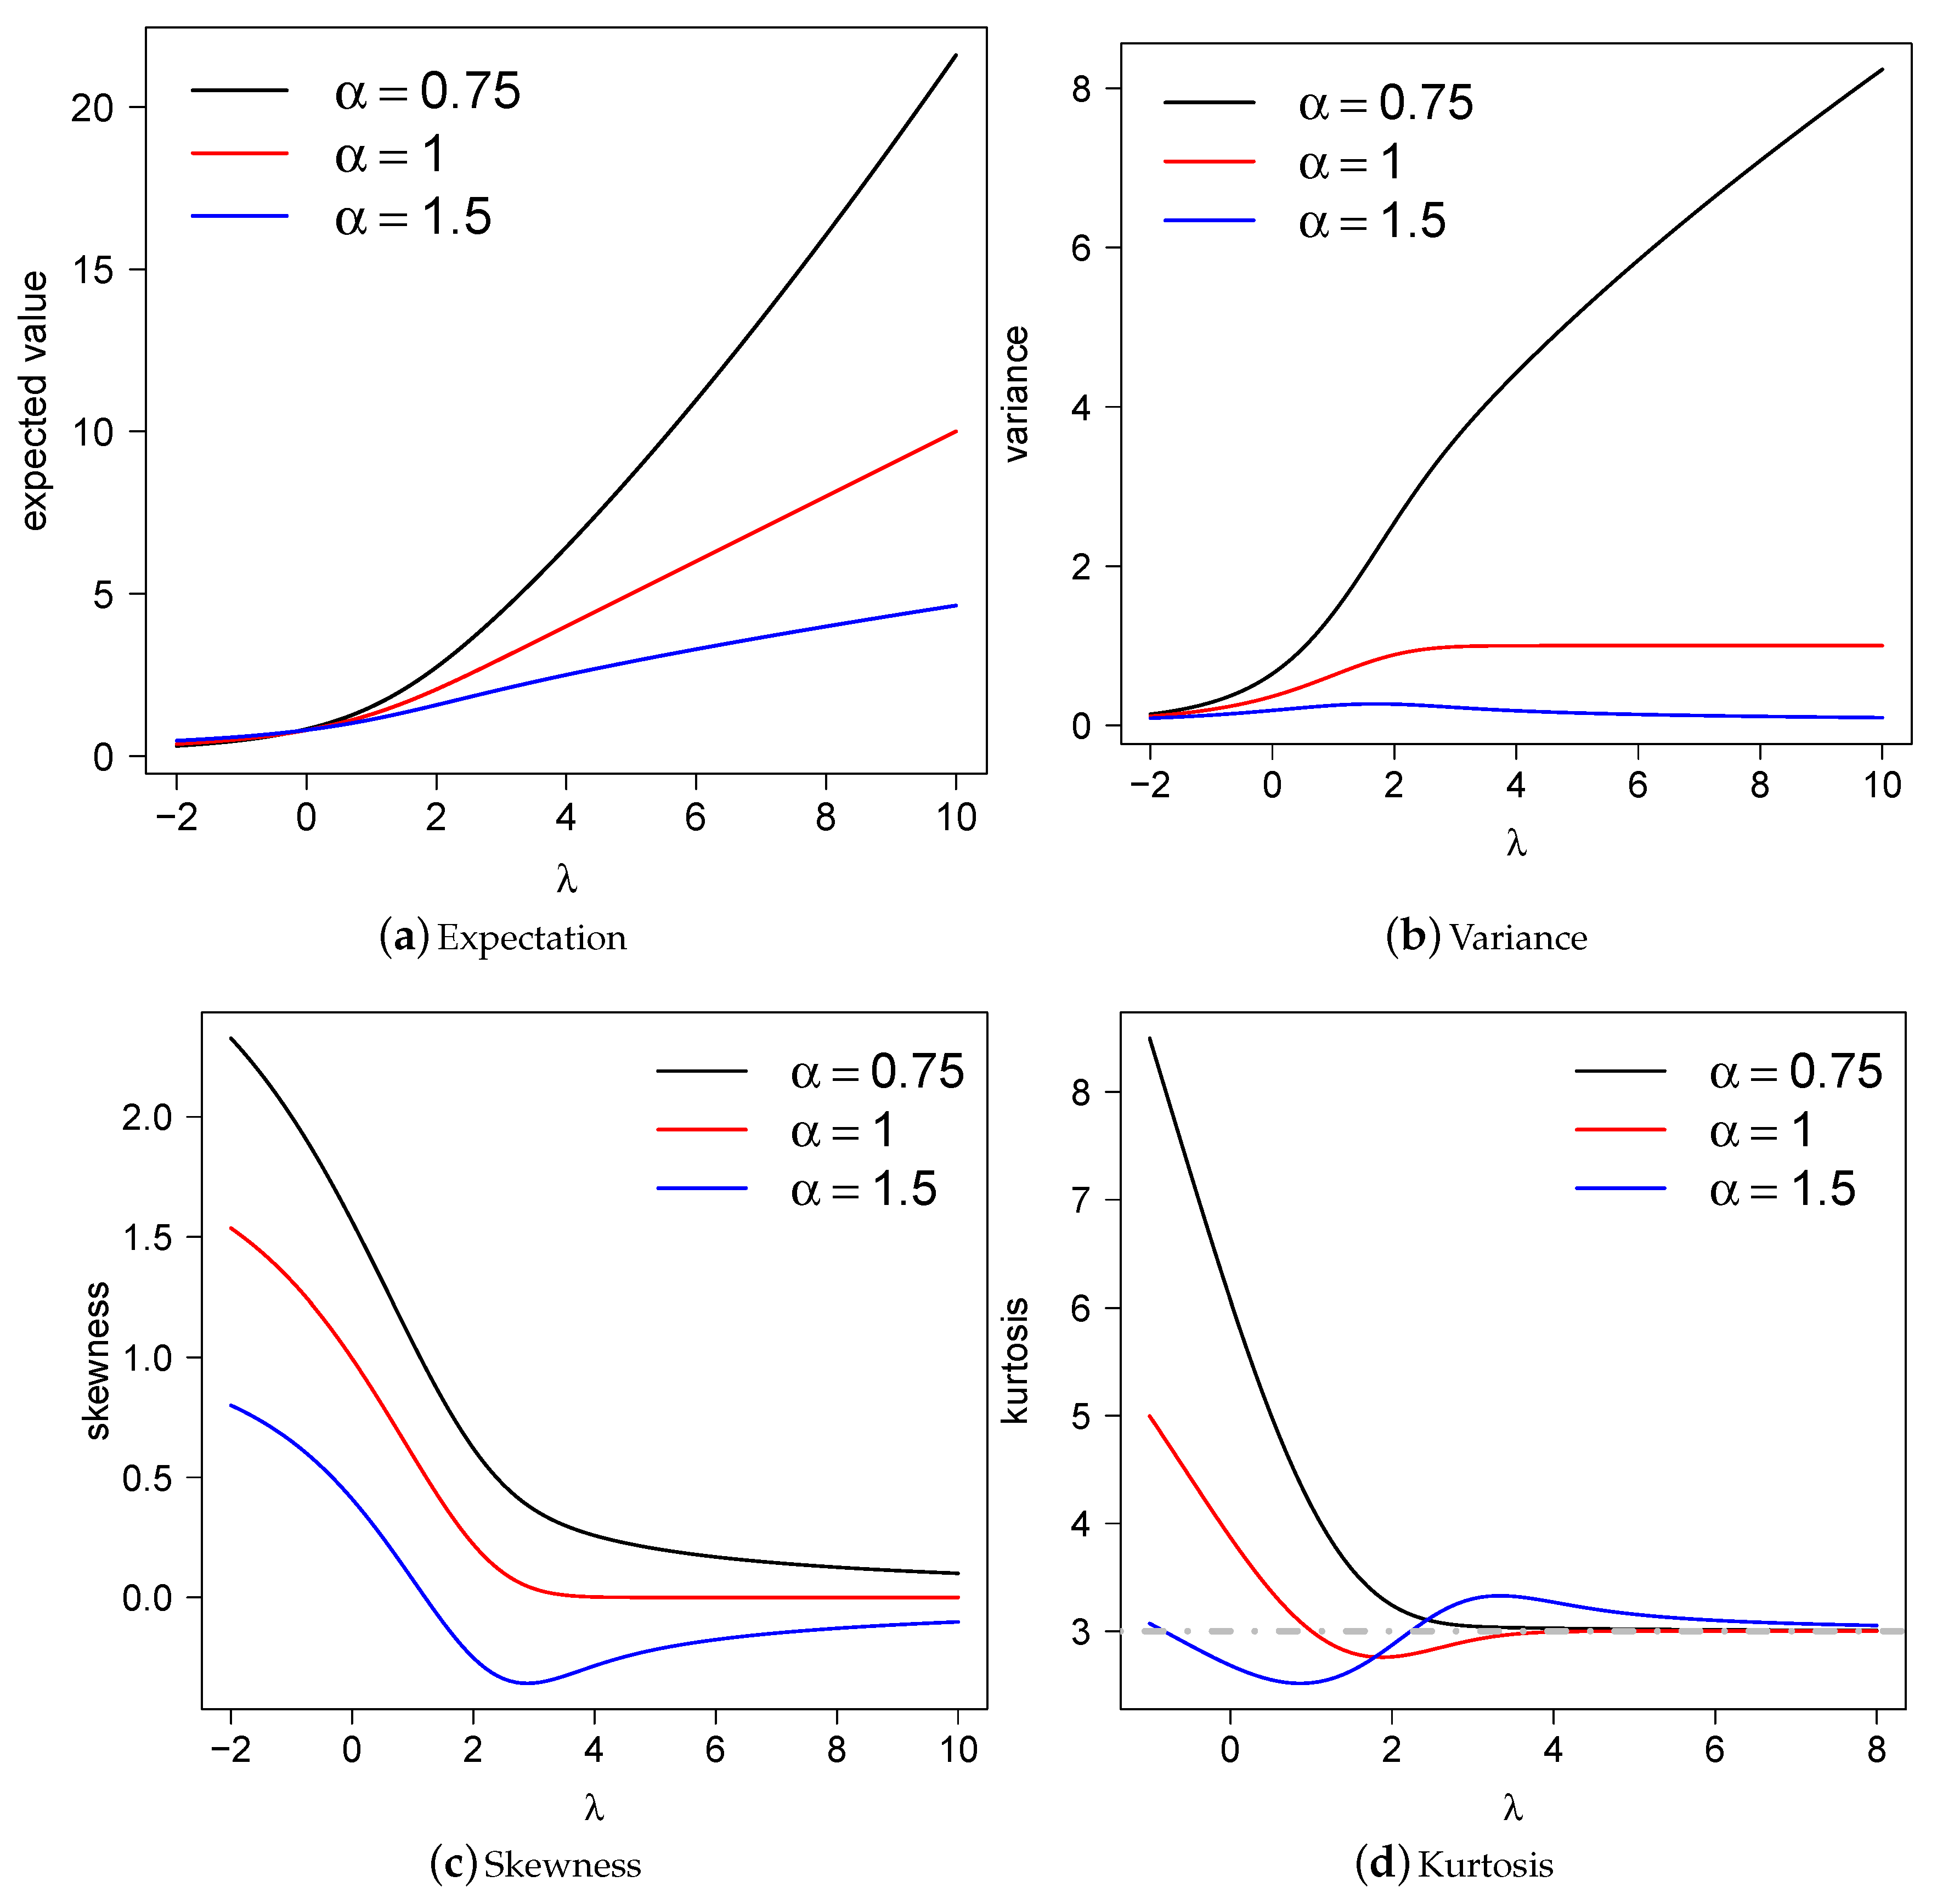
2.5. Central Moments
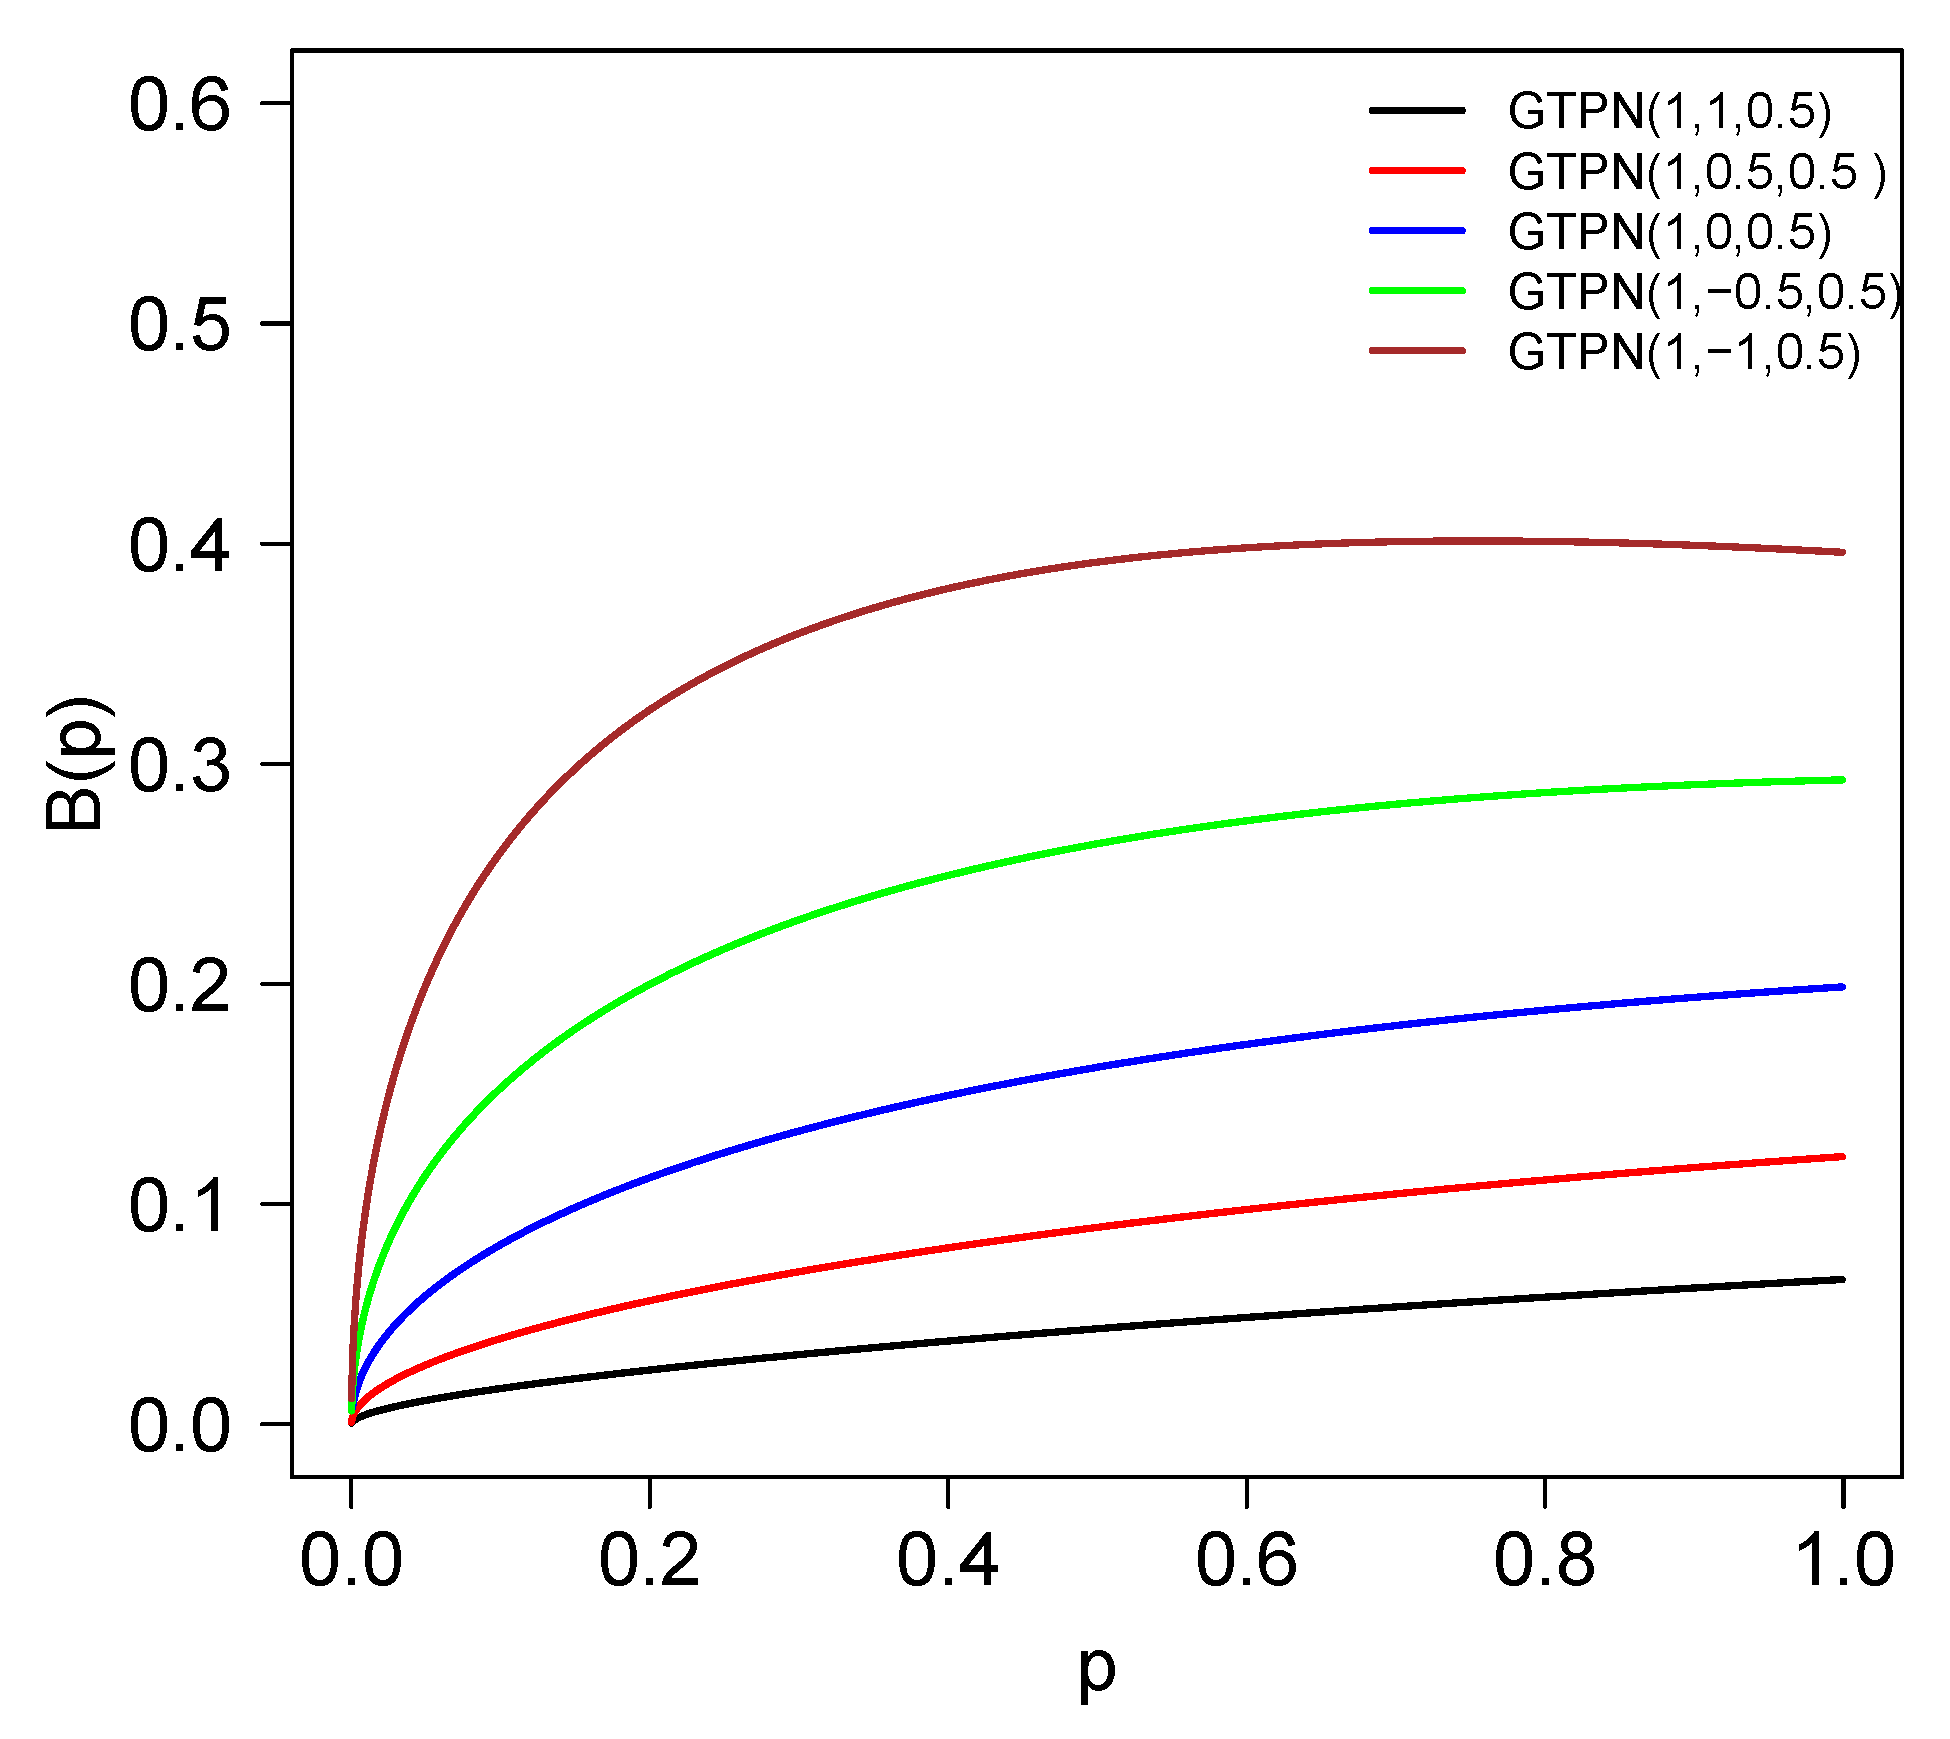
2.6. Bonferroni and Lorenz Curves
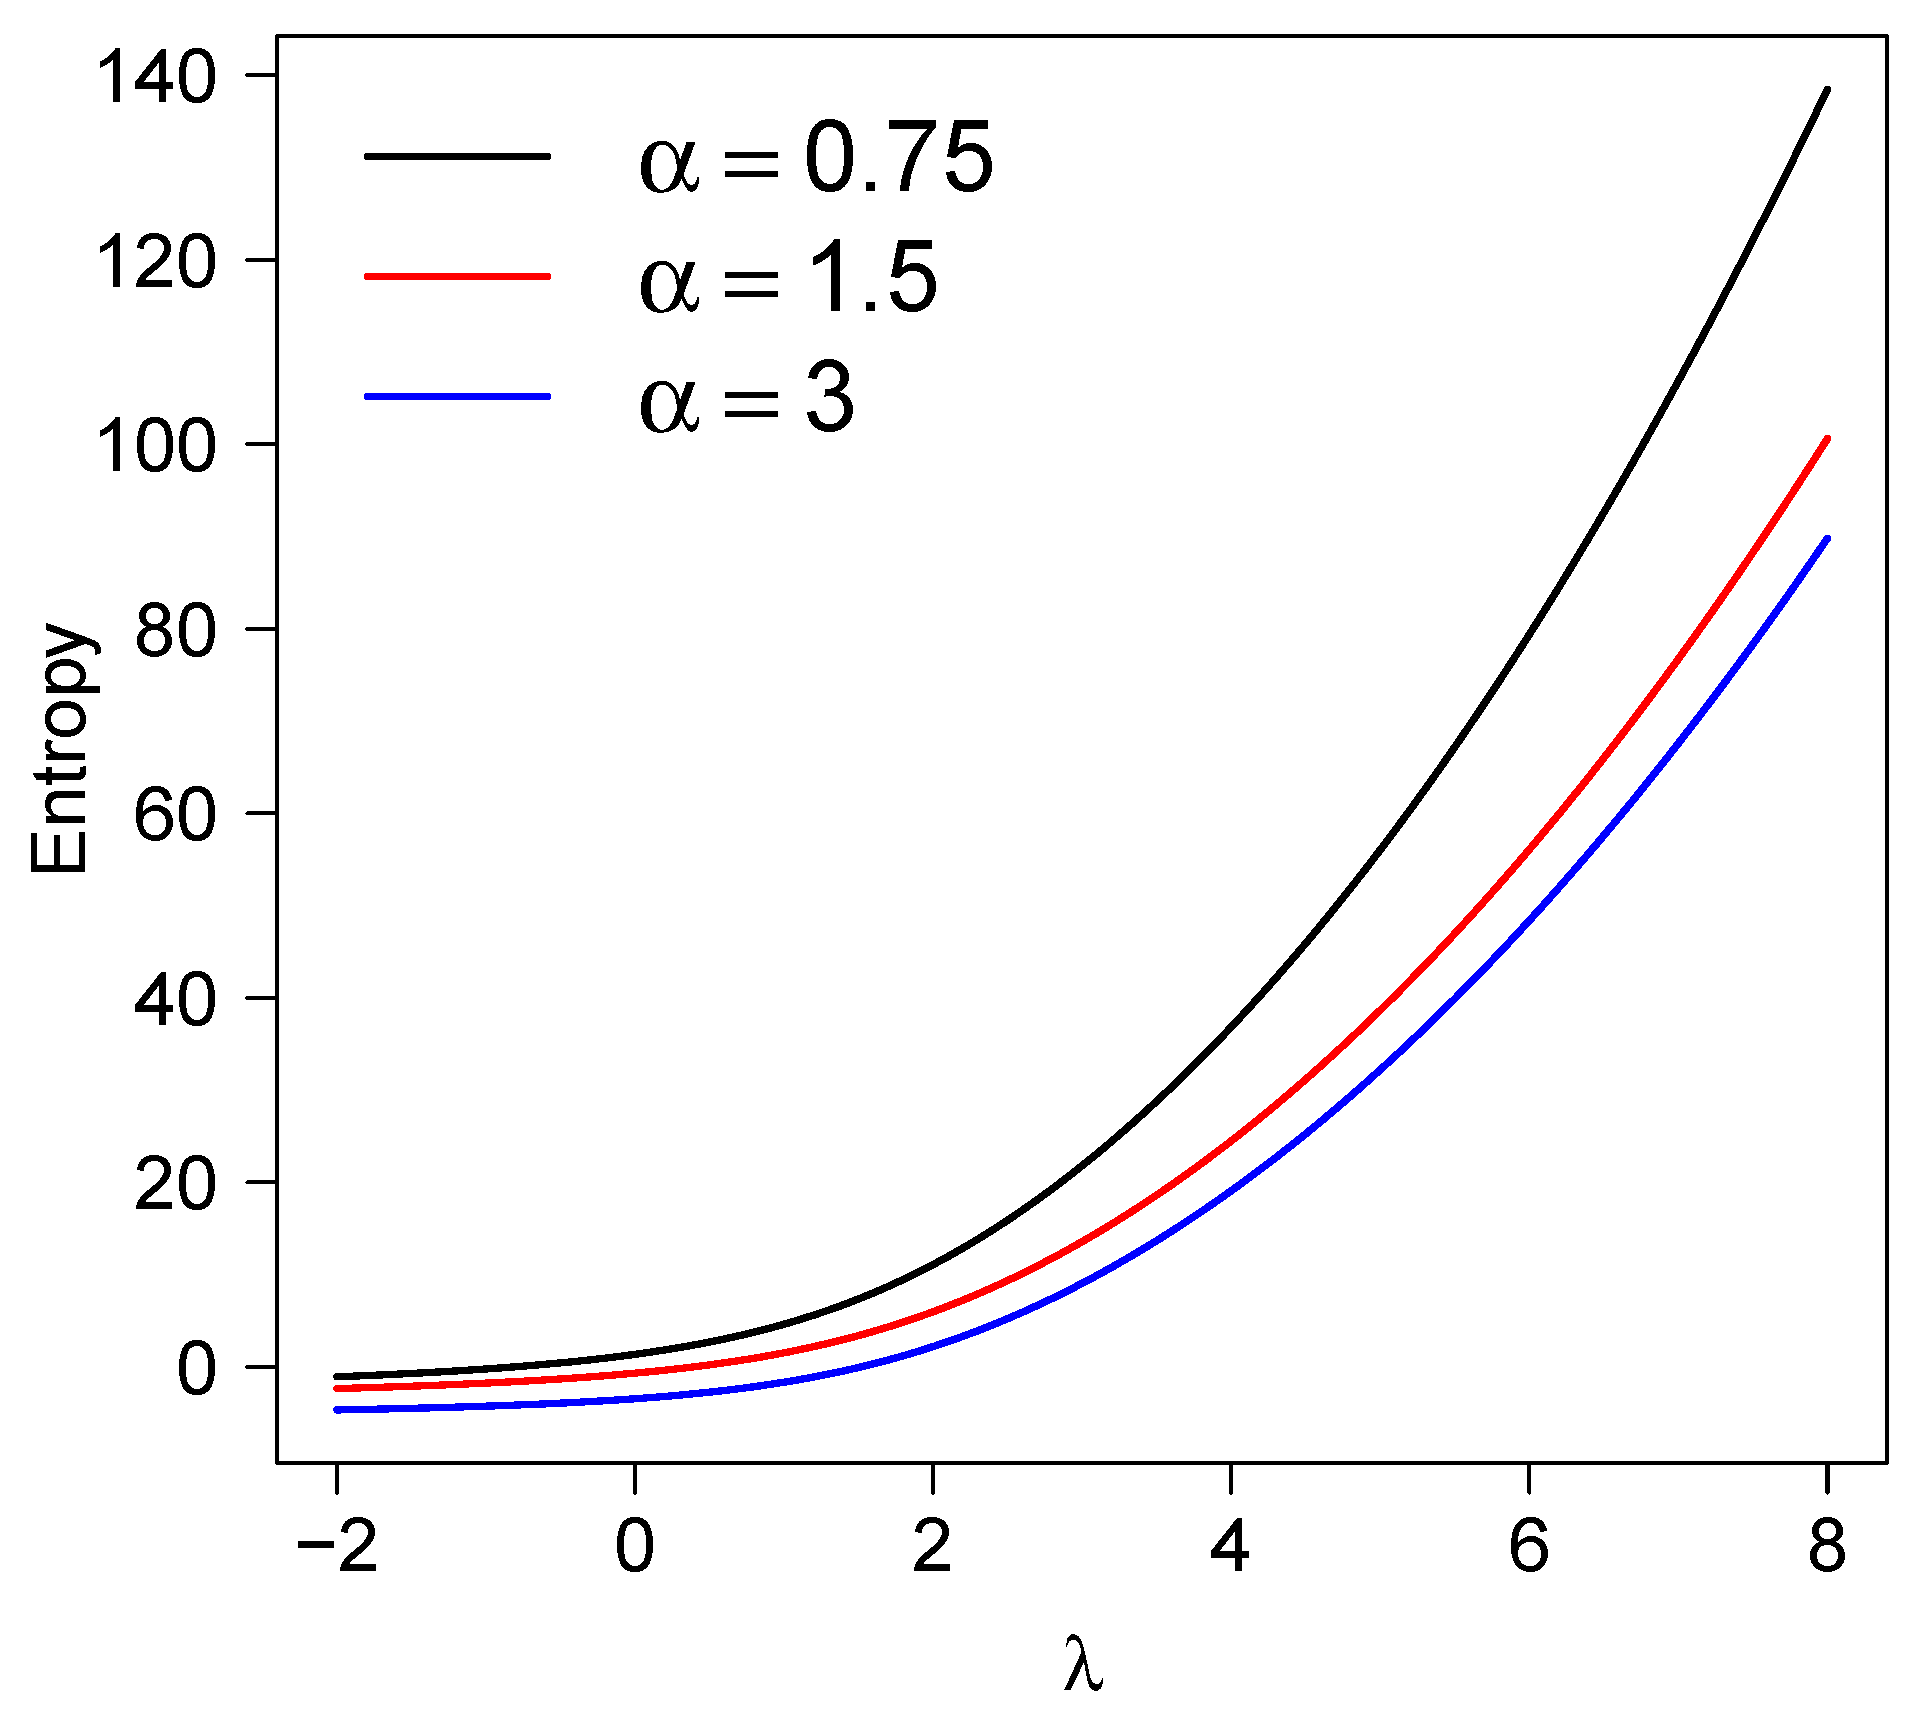
2.7. Shannon Entropy
3. Inference
3.1. Maximum Likelihood Estimators
3.2. Initial Point to Obtain the Maximum Likelihood Estimators
3.2.1. A Naive Point Based on the HN Model
3.2.2. An Initial Point Based on Centiles
3.3. An Initial Point Based on the Method of Moments
3.4. Fisher Information Matrix
4. Model Discrimination
4.1. GTPN Versus Submodels
- versus (TPN versus GTPN distribution).
- versus (GHN versus GTPN distribution).
- versus (HN versus GTPN distribution).
4.1.1. Likelihood Ratio Test
4.1.2. Score Test
4.1.3. Gradient Test
4.2. Non-Nested Models
5. Simulation
- Simulate .
- Compute .
- Compute .
6. Applications
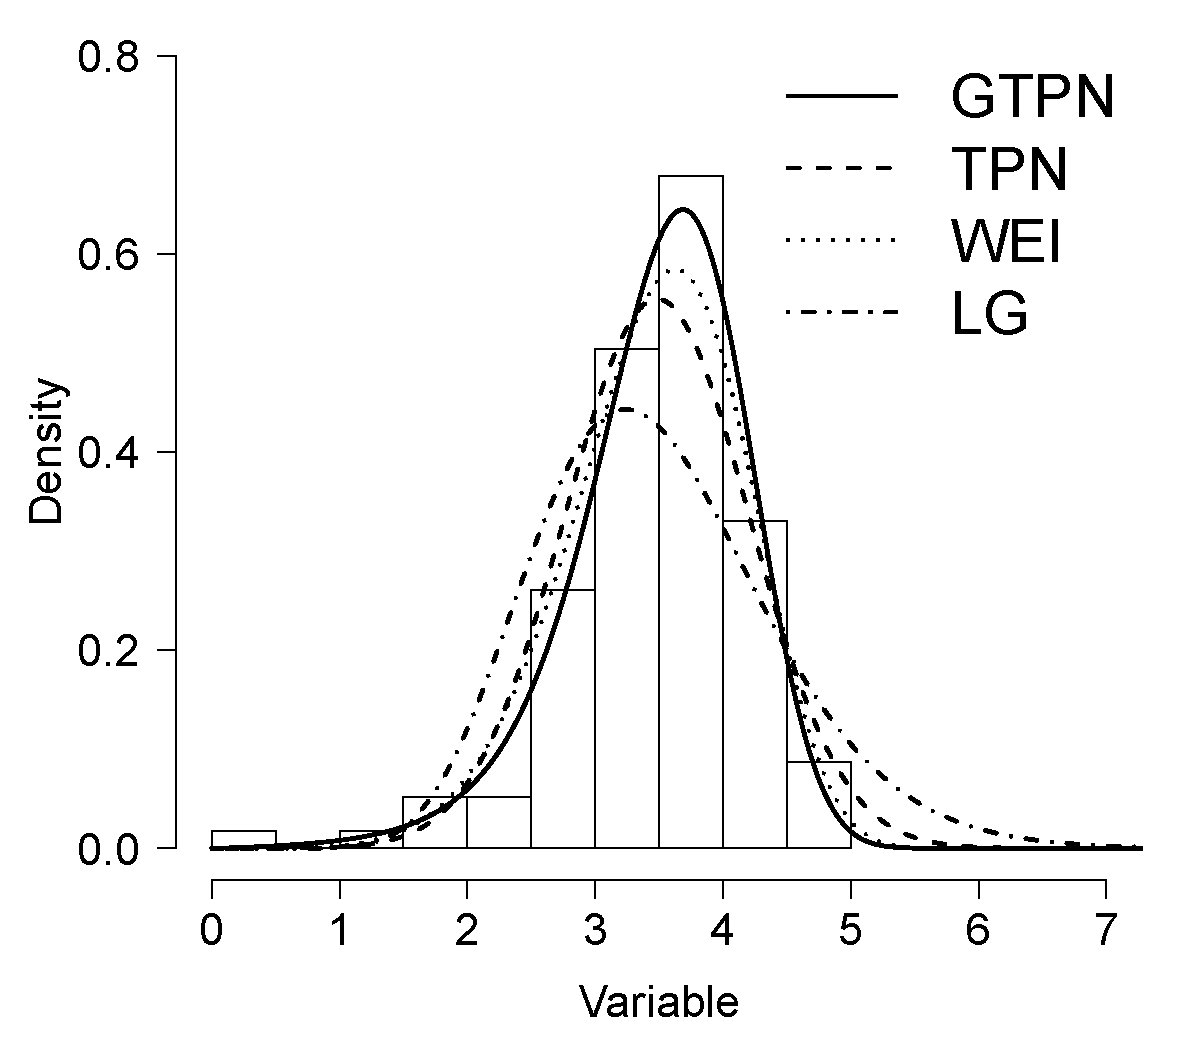
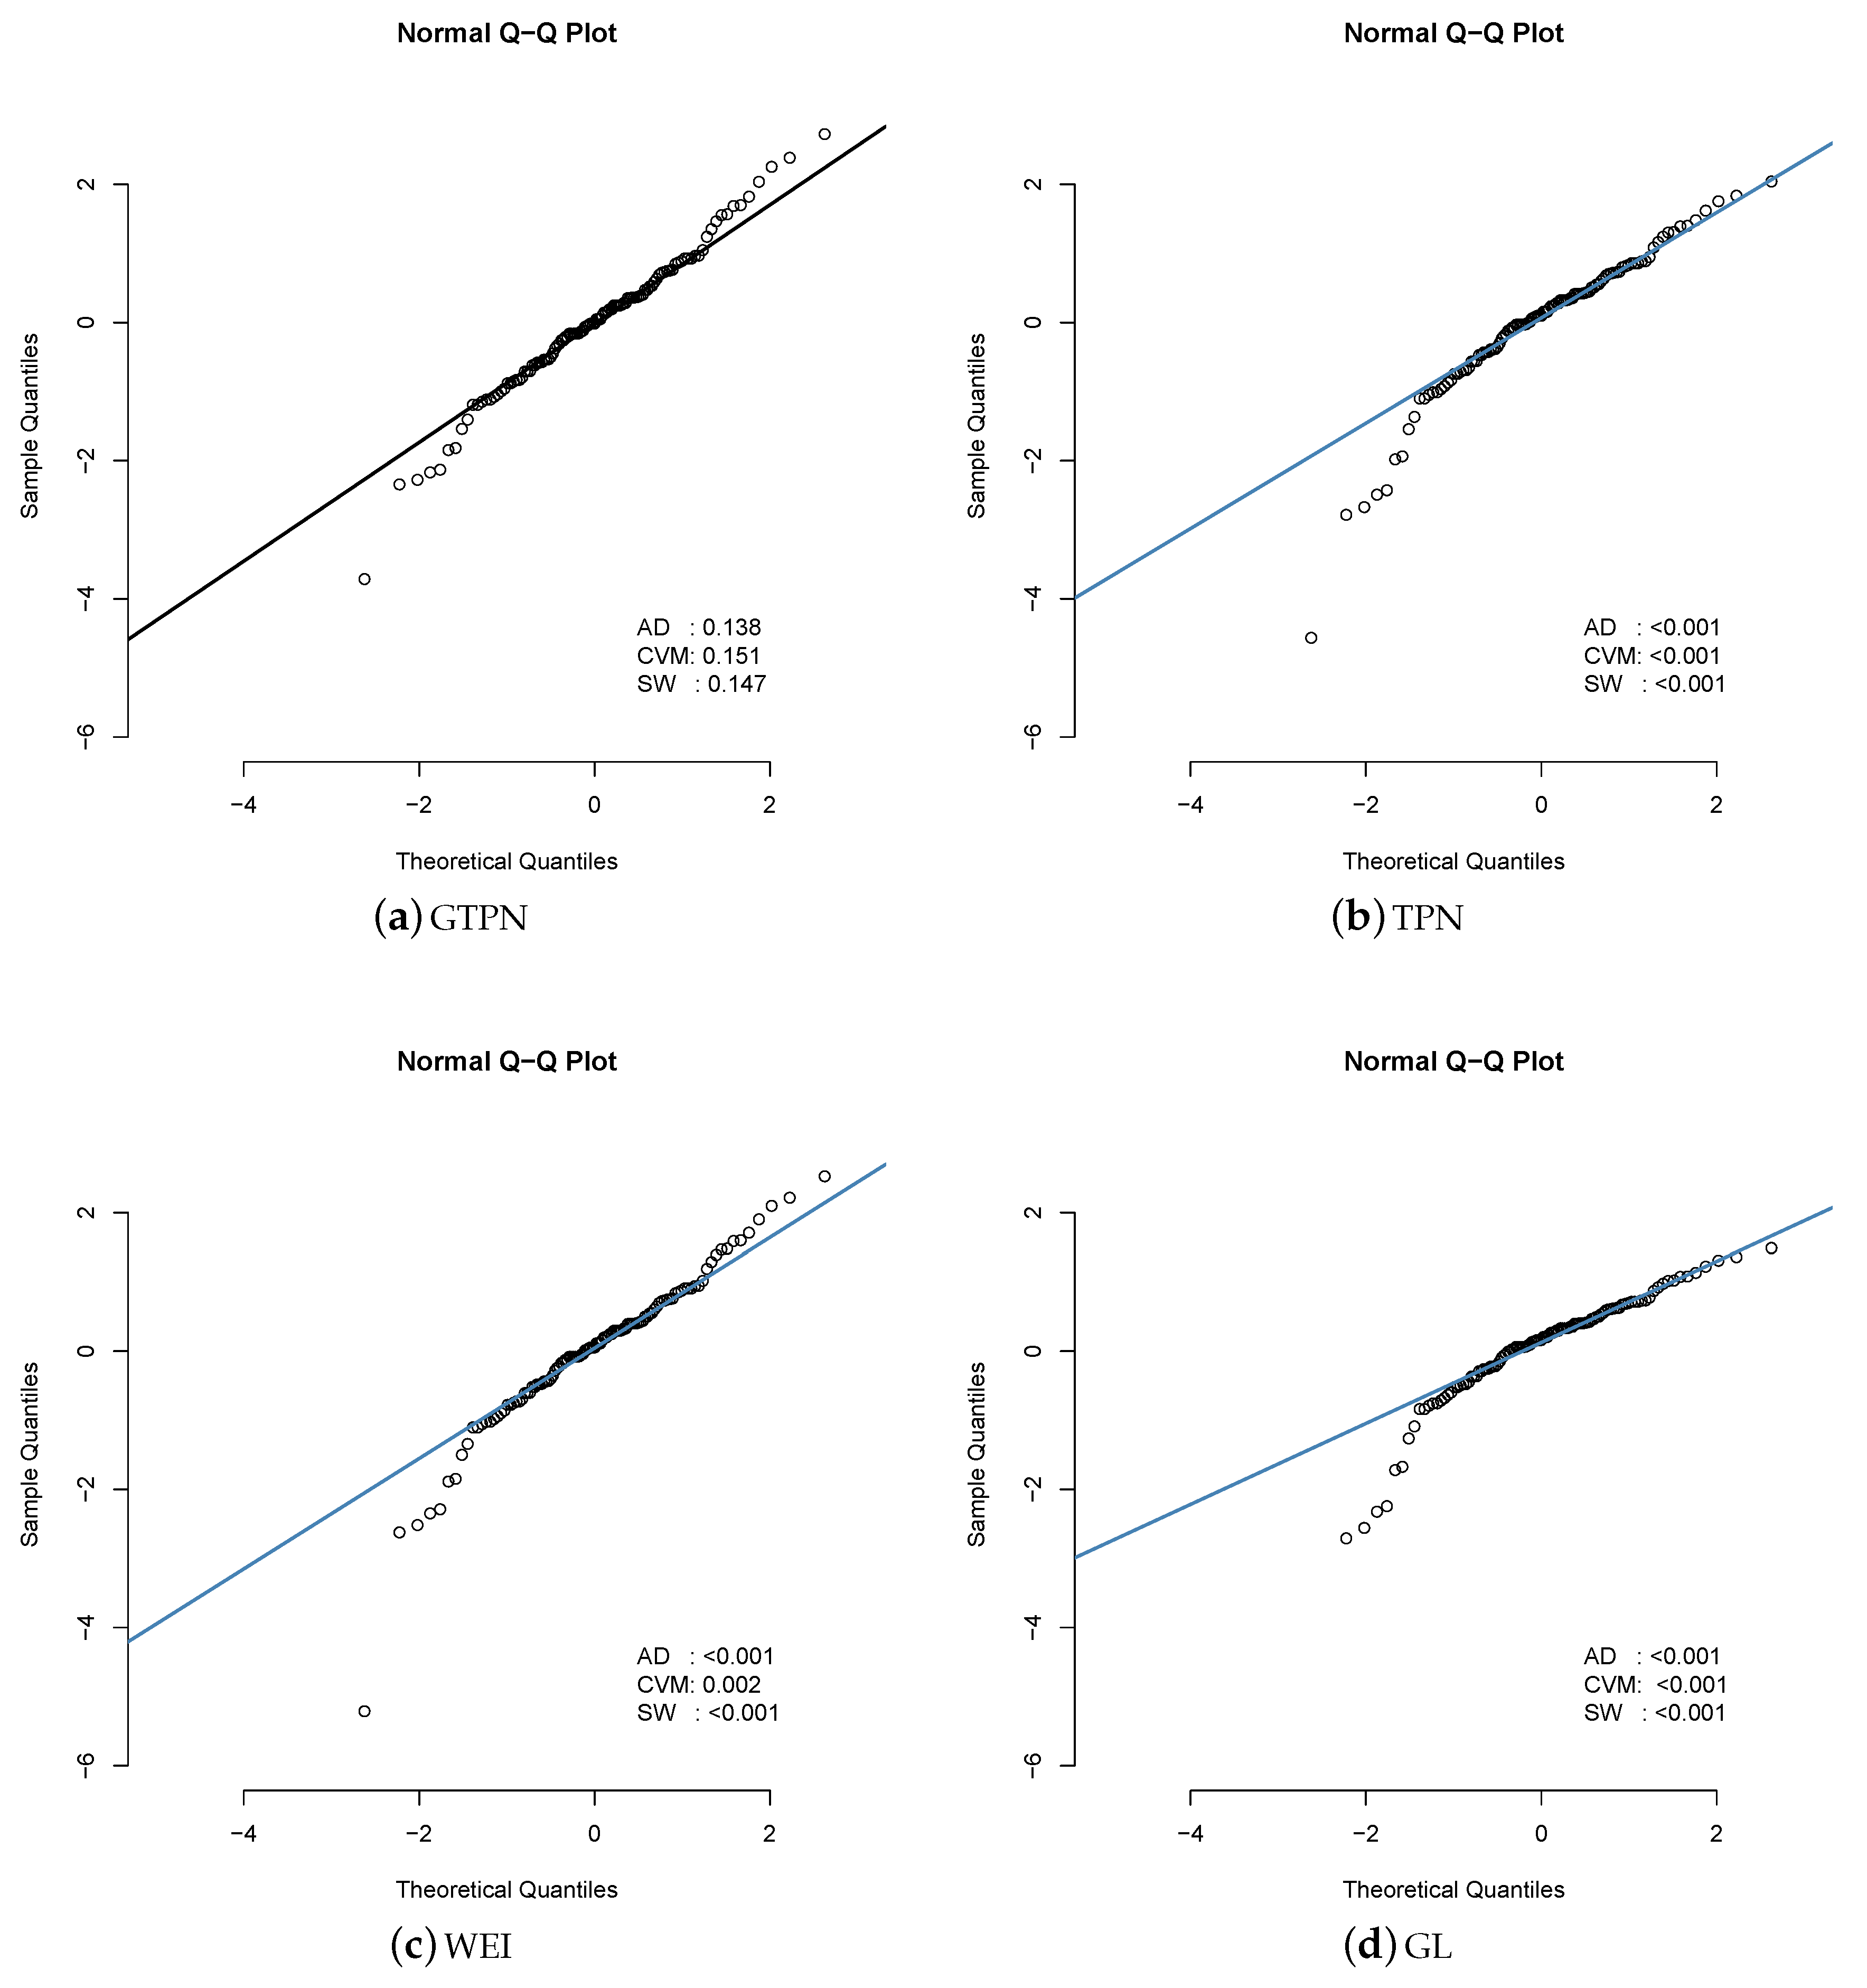
6.1. Application 1
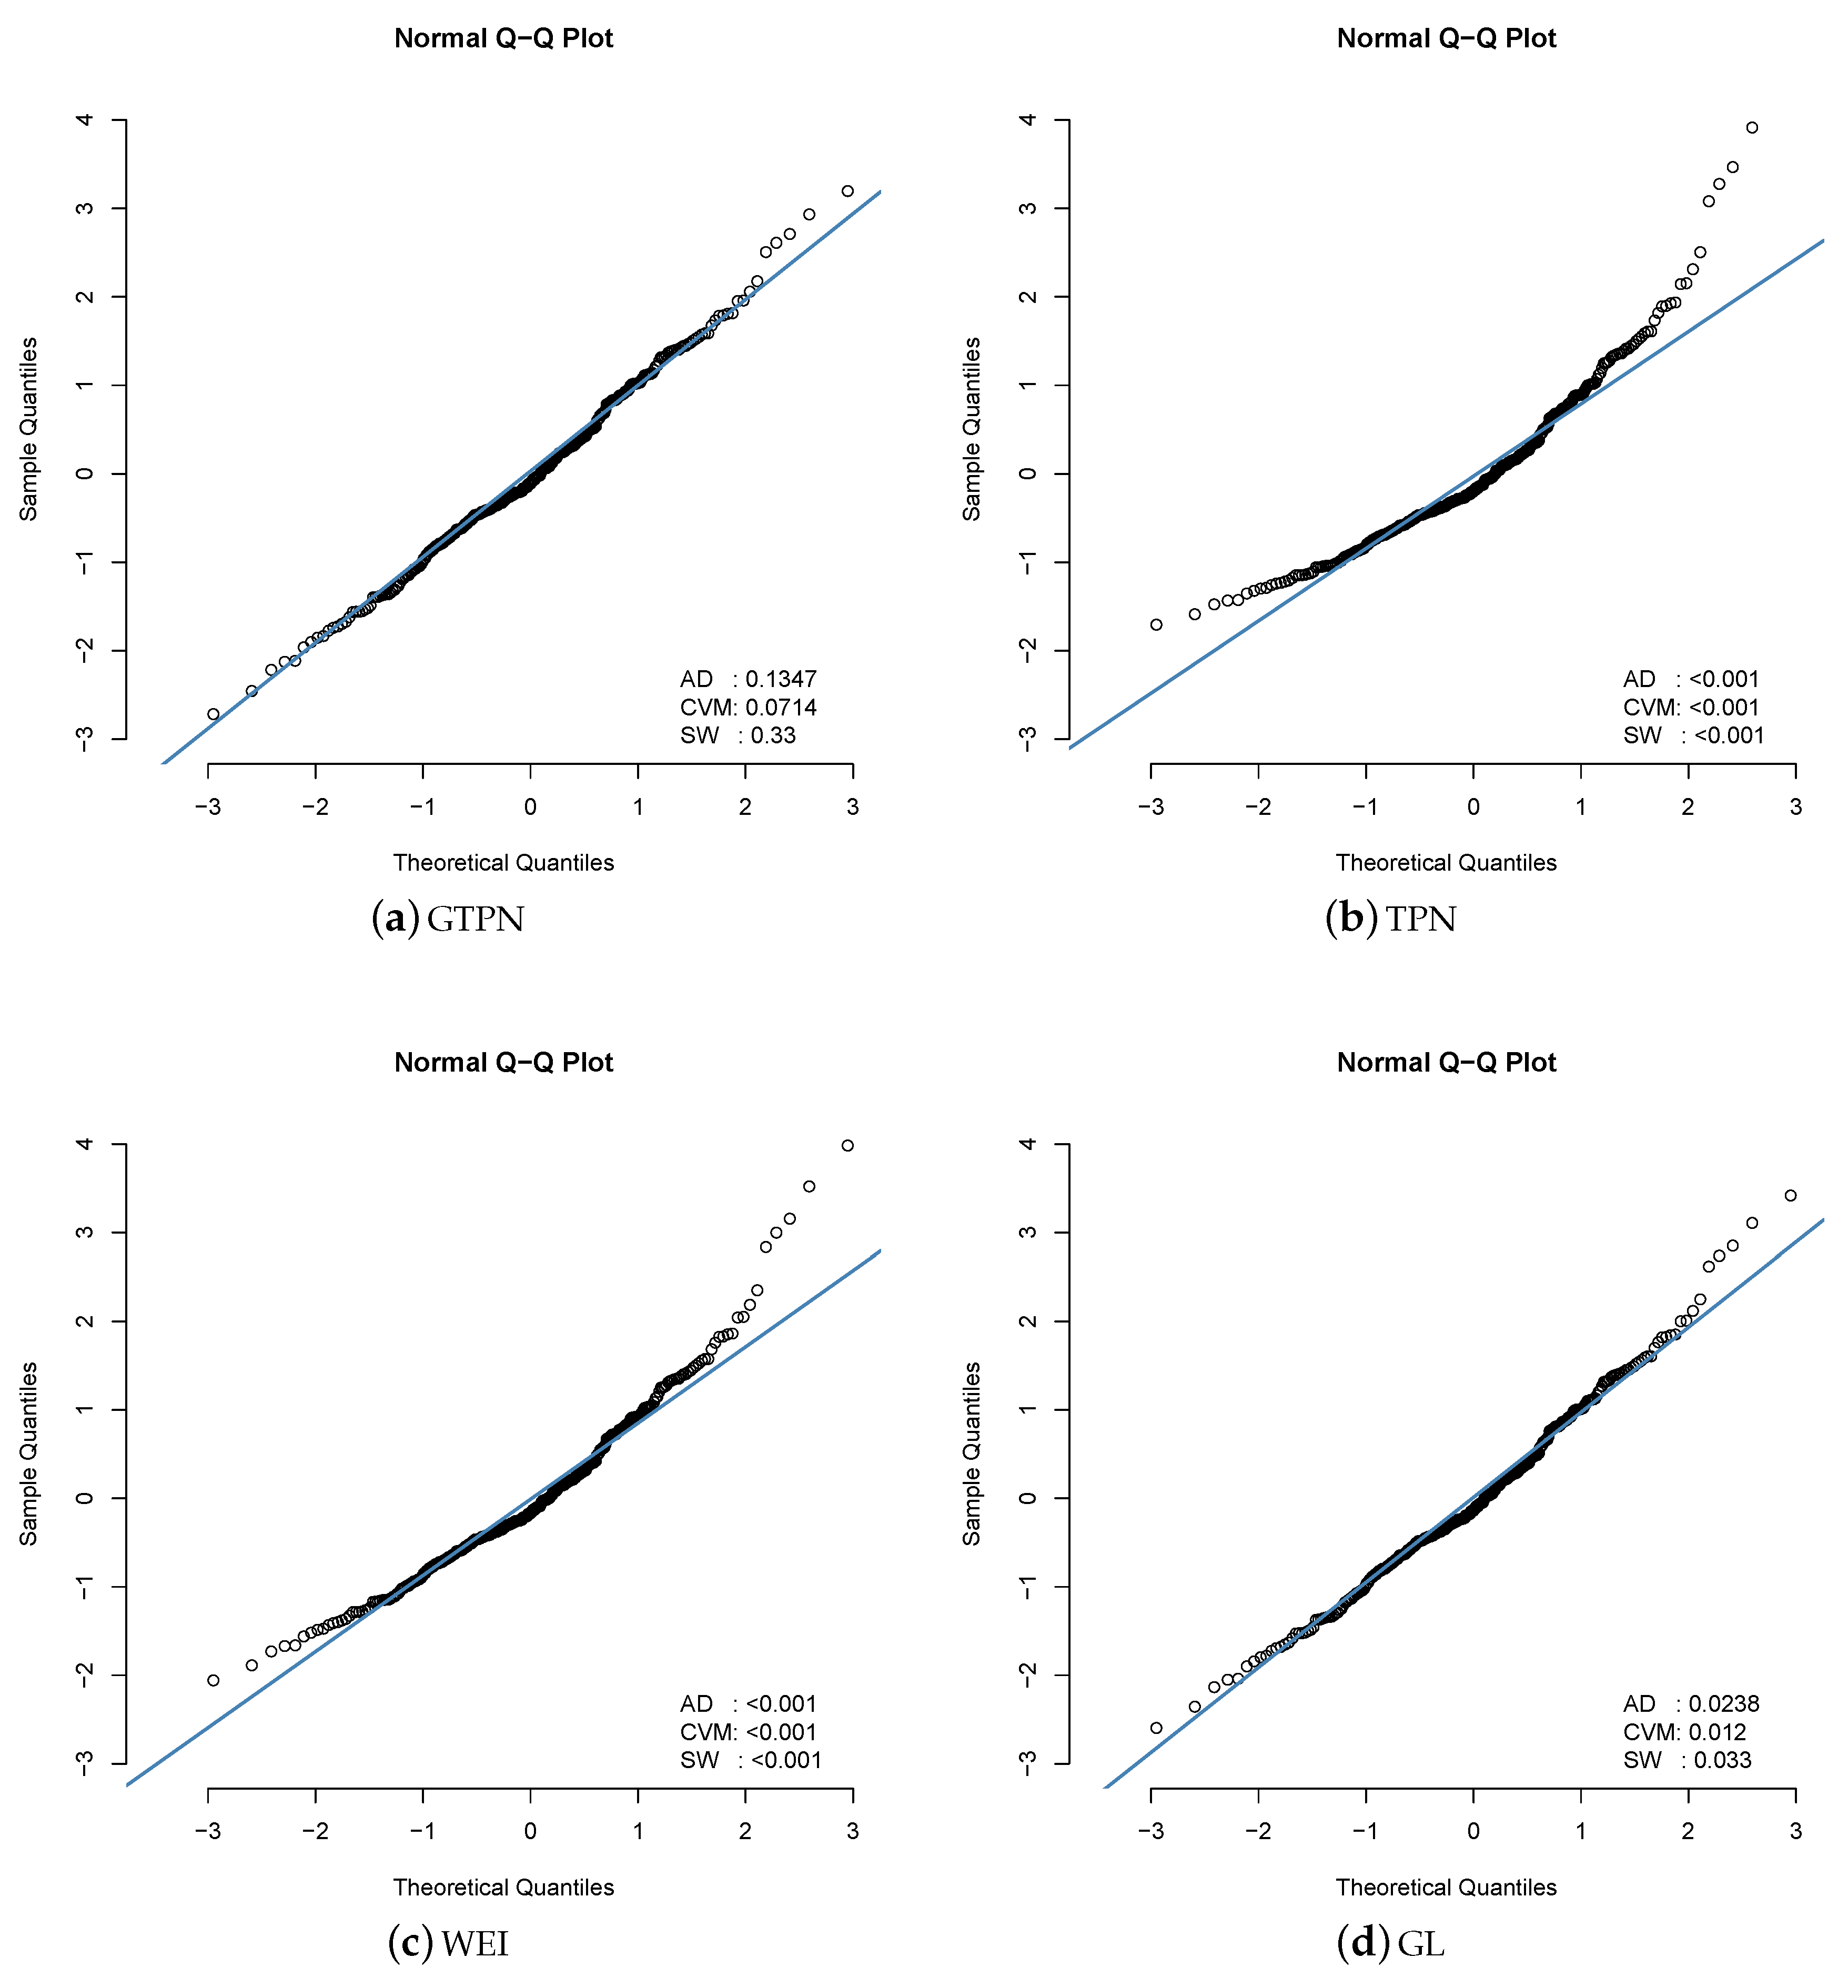
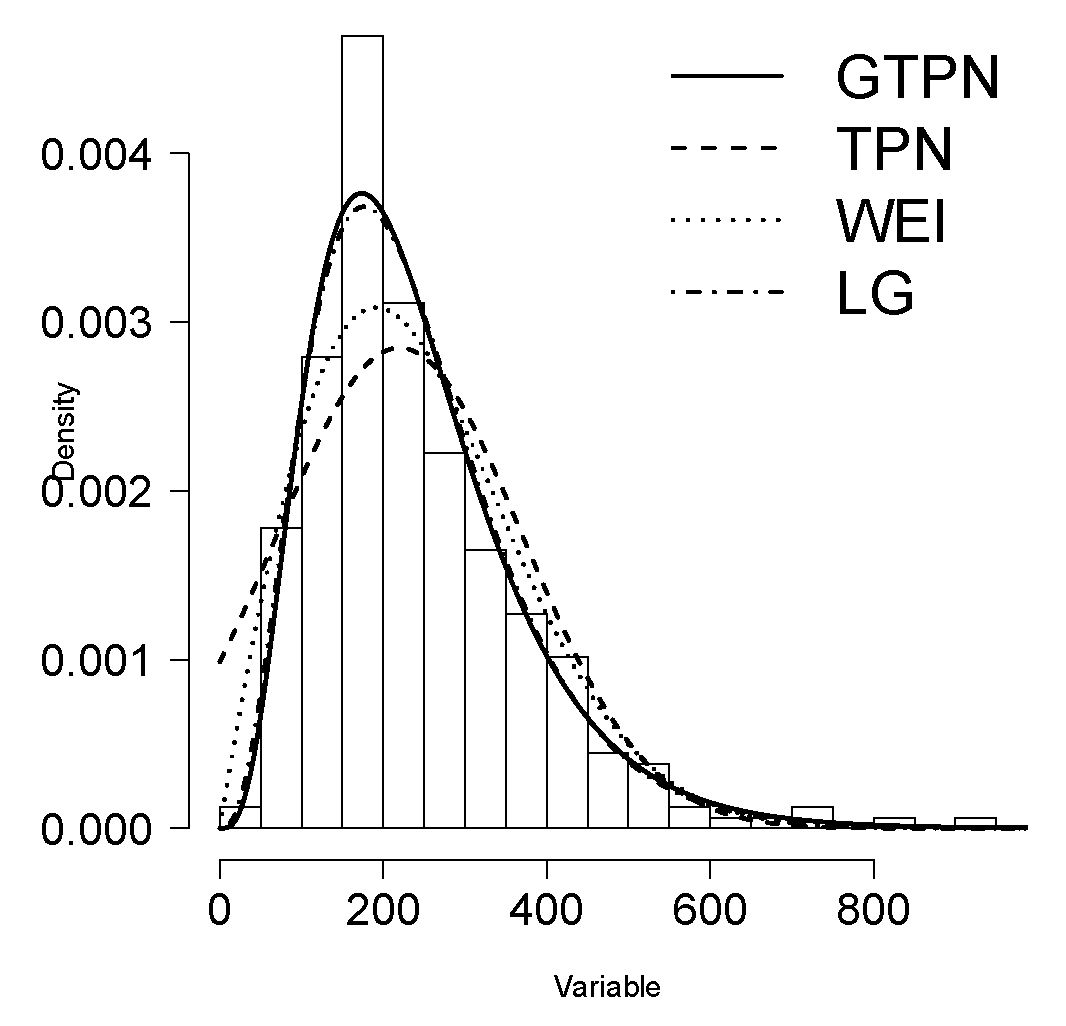
6.2. Application 2
7. Conclusions
Author Contributions
Funding
Conflicts of Interest
References
- Pewsey, A. Large-sample inference for the general half-normal distribution. Commun. Stat. Theory Methods 2002, 31, 1045–1054. [Google Scholar] [CrossRef]
- Pewsey, A. Improved likelihood based inference for the general half-normal distribution. Commun. Stat. Theory Methods 2004, 33, 197–204. [Google Scholar] [CrossRef]
- Wiper, M.P.; Girón, F.J.; Pewsey, A. Objective Bayesian inference for the half-normal and half-t distributions. Commun. Stat. Theory Methods 2008, 37, 3165–3185. [Google Scholar] [CrossRef]
- Khan, M.A.; Islam, H.N. Bayesian analysis of system availability with half-normal life time. Math. Sci. 2012, 9, 203–209. [Google Scholar] [CrossRef]
- Moral, R.A.; Hinde, J.; Demétrio, C.G.B. Half-normal plots and overdispersed models in R: The hnp package. J. Stat. Softw. 2017, 81, 1–23. [Google Scholar] [CrossRef]
- Azzalini, A. A class of distributions which includes the normal ones. Scand. J. Stat. 1985, 12, 171–178. [Google Scholar]
- Azzalini, A. Further results on a class of distributions which includes the normal ones. Statistics 1986, 12, 199–208. [Google Scholar]
- Henze, N. A probabilistic representation of the skew-normal distribution. Scand. J. Stat. 1986, 13, 271–275. [Google Scholar]
- Cooray, K.; Ananda, M.M.A. A generalization of the half-normal distribution with applications to lifetime data. Commun. Stat. Theory Methods 2008, 10, 195–224. [Google Scholar] [CrossRef]
- Olmos, N.M.; Varela, H.; Gómez, H.W.; Bolfarine, H. An extension of the half-normal distribution. Stat. Pap. 2012, 53, 875–886. [Google Scholar] [CrossRef]
- Cordeiro, G.M.; Pescim, R.R.; Ortega, E.M.M. The Kumaraswamy generalized half-normal distribution for skewed positive data. J. Data Sci. 2012, 10, 195–224. [Google Scholar]
- Gómez, Y.M.; Bolfarine, H. Likelihood-based inference for power half-normal distribution. J. Stat. Theory Appl. 2015, 14, 383–398. [Google Scholar] [CrossRef]
- Gómez, H.J.; Olmos, N.M.; Varela, H.; Bolfarine, H. Inference for a truncated positive normal distribution. Appl. Math. J. Chin. Univ. 2015, 33, 163–176. [Google Scholar] [CrossRef]
- Bonferroni, C.E. Elementi di Statistica Generale; Libreria Seber: Firenze, Italy, 1930. [Google Scholar]
- Arcagnia, A.; Porrob, F. The Graphical Representation of Inequality. Rev. Colomb. Estad. 2014, 37, 419–436. [Google Scholar] [CrossRef] [Green Version]
- Shannon, C.E. A Mathematical Theory of Communication. Bell Syst. Tech. J. 1948, 27, 379–423. [Google Scholar] [CrossRef] [Green Version]
- Akaike, H. A new look at the statistical model identification. IEEE Trans. Auto. Contr. 1974, 19, 716–723. [Google Scholar] [CrossRef]
- Dunn, P.K.; Smyth, G.K. Randomized Quantile Residuals. J. Comput. Graph. Stat. 1996, 5, 236–244. [Google Scholar]
- Yazici, B.; Yocalan, S. A comparison of various tests of normality. J. Stat. Comput. Simul. 2007, 77, 175–183. [Google Scholar] [CrossRef]
- Zakerzadeh, H.; Dolati, A. Generalized Lindley Distribution. J. Math. Ext. 2009, 3, 1–17. [Google Scholar]
- Laslett, G.M. Kriging and Splines: An Empirical Comparison of Their Predictive Performance in Some Applications. J. Am. Stat. Assoc. 1994, 89, 391–400. [Google Scholar] [CrossRef]
- Schwarz, G. Estimating the dimension of a model. Ann. Stat. 1978, 6, 461–464. [Google Scholar] [CrossRef]
- Nierenberg, D.W.; Stukel, T.A.; Baron, J.A.; Dain, B.J.; Greenberg, E.R. Determinants of plasma levels of beta-carotene and retinol. Am. J. Epidemiol. 1989, 130, 511–521. [Google Scholar] [CrossRef] [PubMed]


| n = 50 | n = 150 | n = 300 | n = 1000 | |||||||||||||||||||||||
|---|---|---|---|---|---|---|---|---|---|---|---|---|---|---|---|---|---|---|---|---|---|---|---|---|---|---|
| True Valor | ||||||||||||||||||||||||||
| mean | sd | mean | sd | mean | sd | mean | sd | mean | sd | mean | sd | mean | sd | mean | sd | mean | sd | mean | sd | mean | sd | mean | sd | |||
| 1 | 3 | 0.8 | 1.523 | 1.573 | 3.089 | 1.797 | 0.987 | 1.029 | 1.227 | 1.029 | 3.000 | 1.052 | 0.875 | 0.350 | 1.081 | 0.614 | 3.017 | 0634 | 0.830 | 0.202 | 1.011 | 0.233 | 3.014 | 0.267 | 0.803 | 0.071 |
| 1 | 1.286 | 1.105 | 3.118 | 1.843 | 1.227 | 0.705 | 1.111 | 0.705 | 3.027 | 1.040 | 1.083 | 0.425 | 1.044 | 0.444 | 3.020 | 0.629 | 1.031 | 0.250 | 1.006 | 0.185 | 3.012 | 0.266 | 1.004 | 0.089 | ||
| 2 | 1.006 | 0.510 | 3.220 | 2.036 | 2.432 | 0.309 | 1.011 | 0.309 | 3.019 | 1.055 | 2.171 | 0.850 | 1.001 | 0.196 | 3.022 | 0.614 | 2.058 | 0.481 | 0.998 | 0.093 | 3.013 | 0.266 | 2.008 | 0.177 | ||
| 4 | 0.8 | 1.489 | 1.799 | 4.391 | 2.010 | 0.971 | 0.860 | 1.087 | 0.860 | 4.280 | 1.199 | 0.817 | 0.282 | 1.017 | 0.513 | 4.164 | 0.786 | 0.798 | 0.148 | 1.003 | 0.301 | 4.049 | 0.413 | 0.799 | 0.082 | |
| 1 | 1.236 | 1.219 | 4.439 | 2.182 | 1.203 | 0.631 | 1.018 | 0.631 | 4.295 | 1.222 | 1.017 | 0.343 | 0.986 | 0.418 | 4.187 | 0.826 | 0.995 | 0.191 | 0.993 | 0.230 | 4.055 | 0.404 | 0.998 | 0.099 | ||
| 2 | 0.962 | 0.543 | 4.642 | 2.495 | 2.360 | 0.321 | 0.957 | 0.321 | 4.323 | 1.326 | 2.033 | 0.696 | 0.974 | 0.223 | 4.168 | 0.839 | 2.000 | 0.382 | 0.993 | 0.118 | 4.045 | 0.404 | 2.000 | 0.198 | ||
| 2 | 3 | 0.8 | 3.006 | 3.131 | 3.157 | 1.876 | 0.974 | 1.996 | 2.423 | 1.996 | 3.018 | 1.045 | 0.869 | 0.340 | 2.152 | 1.185 | 3.023 | 0.624 | 0.823 | 0.194 | 2.034 | 0.472 | 3.007 | 0.269 | 0.805 | 0.072 |
| 1 | 2.512 | 2.198 | 3.215 | 1.942 | 1.207 | 1.437 | 2.237 | 1.437 | 3.028 | 1.077 | 1.086 | 0.431 | 2.094 | 0.897 | 3.017 | 0.642 | 1.033 | 0.250 | 2.009 | 0.373 | 3.015 | 0.269 | 1.004 | 0.089 | ||
| 2 | 1.999 | 1.039 | 3.318 | 2.223 | 2.417 | 0.631 | 2.017 | 0.631 | 3.035 | 1.096 | 2.171 | 0.862 | 2.000 | 0.405 | 3.027 | 0.638 | 2.061 | 0.504 | 1.995 | 0.186 | 3.016 | 0.267 | 2.006 | 0.177 | ||
| 4 | 0.8 | 2.880 | 3.544 | 4.562 | 2.283 | 0.970 | 1.714 | 2.161 | 1.714 | 4.326 | 1.288 | 0.813 | 0.282 | 2.024 | 1.078 | 4.194 | 0.849 | 0.796 | 0.160 | 2.003 | 0.573 | 4.053 | 0.404 | 0.799 | 0.079 | |
| 1 | 2.402 | 2.434 | 4.659 | 2.419 | 1.176 | 1.283 | 2.033 | 1.283 | 4.344 | 1.346 | 1.015 | 0.355 | 1.974 | 0.835 | 4.190 | 0.844 | 0.995 | 0.191 | 1.990 | 0.465 | 4.053 | 0.408 | 0.998 | 0.100 | ||
| 2 | 1.913 | 1.132 | 4.802 | 2.848 | 2.378 | 0.668 | 1.898 | 0.668 | 4.393 | 1.469 | 2.024 | 0.708 | 1.938 | 0.460 | 4.198 | 0.901 | 1.993 | 0.391 | 1.984 | 0.236 | 4.047 | 0.401 | 2.000 | 0.198 | ||
| Dataset | n | S2 | |||
|---|---|---|---|---|---|
| Heights measured | 115 | 3.48 | 0.52 | −1.24 | 6.30 |
| Estimated | GTPN | TPN | WEI | GL |
|---|---|---|---|---|
| 2.354(0.379) | 0.720(0.047) | 5.855(0.435) | - | |
| 2.512(0.495) | 4.842(0.333) | 3.744(0.062) | 4.093(0.539) | |
| 2.227(0.401) | - | - | 13.467(1.902) | |
| - | - | - | 15.528(29.638) | |
| AIC | 238.43 | 254.63 | 251.74 | 308.67 |
| BIC | 246.67 | 260.12 | 257.23 | 316.90 |
| Data Set | n | ||||
|---|---|---|---|---|---|
| Heights measured | 315 | 242.46 | 17421.79 | 1.47 | 6.34 |
| Estimated | GTPN | TPN | WEI | GL |
|---|---|---|---|---|
| 0.040(0.027) | 151.106(8.734) | 1.964(0.080) | - | |
| 7.888(0.459) | 1.455(0.138) | 274.717(8.353) | 0.016(0.001) | |
| 0.240(0.013) | - | - | 2.831(0.293) | |
| - | - | - | 2.067(6.720) | |
| AIC | 3874.92 | 3943.25 | 3905.68 | 3879.07 |
| BIC | 3886.17 | 3950.75 | 3913.18 | 3890.42 |
© 2019 by the authors. Licensee MDPI, Basel, Switzerland. This article is an open access article distributed under the terms and conditions of the Creative Commons Attribution (CC BY) license (http://creativecommons.org/licenses/by/4.0/).
Share and Cite
Gómez, H.J.; Gallardo, D.I.; Venegas, O. Generalized Truncation Positive Normal Distribution. Symmetry 2019, 11, 1361. https://doi.org/10.3390/sym11111361
Gómez HJ, Gallardo DI, Venegas O. Generalized Truncation Positive Normal Distribution. Symmetry. 2019; 11(11):1361. https://doi.org/10.3390/sym11111361
Chicago/Turabian StyleGómez, Héctor J., Diego I. Gallardo, and Osvaldo Venegas. 2019. "Generalized Truncation Positive Normal Distribution" Symmetry 11, no. 11: 1361. https://doi.org/10.3390/sym11111361
APA StyleGómez, H. J., Gallardo, D. I., & Venegas, O. (2019). Generalized Truncation Positive Normal Distribution. Symmetry, 11(11), 1361. https://doi.org/10.3390/sym11111361