Effect of Manganese on Co–Mn/CNT Bimetallic Catalyst Performance in Fischer–Tropsch Reaction

 ,
, 
 ,
,  ,
,  and
and
Abstract
1. Introduction
2. Experimental
2.1. Purification and Functionalization of CNT Support
2.2. The Point of Zero Charge, Co Impregnation on a Support, and Catalyst Preparation
2.3. Characterization
2.4. Microreactor Setup, Sampling, and Composition Analysis
3. Results and Discussion
3.1. Effect of Mn Loading on Catalyst Properties and Characterization
3.2. Effect of Mn Promoter on Catalyst Performance
4. Conclusions
Author Contributions
Funding
Acknowledgments
Conflicts of Interest
References
- Steynberg, A.P. Chapter 1—Introduction to Fischer-Tropsch Technology. In Studies in Surface Science and Catalysis; Steynberg, A., Dry, M., Eds.; Elsevier: Amsterdam, The Netherlands, 2004; Volume 152, pp. 1–63. [Google Scholar]
- Jacobs, G.; Das, T.K.; Zhang, Y.; Li, J.; Racoillet, G.; Davis, B.H. Fischer–Tropsch synthesis: Support, loading, and promoter effects on the reducibility of cobalt catalysts. Appl. Catal. A Gen. 2002, 233, 263–281. [Google Scholar] [CrossRef]
- Bezemer, G.L.; Radstake, P.B.; Koot, V.; Van Dillen, A.J.; Geus, J.W.; De Jong, K.P. Preparation of Fischer–Tropsch cobalt catalysts supported on carbon nanofibers and silica using homogeneous deposition-precipitation. J. Catal. 2006, 237, 291–302. [Google Scholar] [CrossRef]
- Qiu, X.; Tsubaki, N.; Sun, S.; Fujimoto, K. Promoting effect of noble metals to Co/SiO2 catalysts for hydroformylation of 1-hexene. Catal. Commun. 2001, 2, 75–80. [Google Scholar] [CrossRef]
- Karaca, H.; Safonova, O.V.; Chambrey, S.; Fongarland, P.; Roussel, P.; Griboval-Constant, A.; Lacroix, M.; Khodakov, A.Y. Structure and catalytic performance of Pt-promoted alumina-supported cobalt catalysts under realistic conditions of Fischer–Tropsch synthesis. J. Catal. 2011, 277, 14–26. [Google Scholar] [CrossRef]
- Das, T.K.; Jacobs, G.; Davis, B.H. Fischer–Tropsch synthesis: Deactivation of promoted and unpromoted cobalt–alumina catalysts. Catal. Lett. 2005, 101, 187–190. [Google Scholar] [CrossRef]
- Jacobs, G.; Ji, Y.; Davis, B.H.; Cronauer, D.; Kropf, A.J.; Marshall, C.L. Fischer–Tropsch synthesis: Temperature programmed EXAFS/XANES investigation of the influence of support type, cobalt loading, and noble metal promoter addition to the reduction behavior of cobalt oxide particles. Appl. Catal. A Gen. 2007, 333, 177–191. [Google Scholar] [CrossRef]
- Borg, O.; Eri, S.; Blekkan, E.A.; Storsæter, S.; Wigum, H.; Rytter, E.; Holmen, A. Fischer–Tropsch synthesis over γ-alumina-supported cobalt catalysts: Effect of support variables. J. Catal. 2007, 248, 89–100. [Google Scholar] [CrossRef]
- Keyser, M.J.; Everson, R.C.; Espinoza, R.L. Fischer–Tropsch studies with cobalt–manganese oxide catalysts: Synthesis performance in a fixed bed reactor. Appl. Catal. A Gen. 1998, 171, 99–107. [Google Scholar] [CrossRef]
- Colley, S.E.; Copperthwaite, R.G.; Hutchings, G.J.; Foulds, G.A.; Coville, N.J. Cobalt/manganese oxide catalysts: Use of chromium promoters for long chain hydrocarbon production. Appl. Catal. A Gen. 1992, 84, 1–15. [Google Scholar] [CrossRef]
- Morales, F.; De Smit, E.; De Groot, F.M.F.; Visser, T.; Weckhuysen, B.M. Effects of manganese oxide promoter on the CO and H2 adsorption properties of titania-supported cobalt Fischer–Tropsch catalysts. J. Catal. 2007, 246, 91–99. [Google Scholar] [CrossRef]
- Bezemer, G.L.; Radstake, P.B.; Falke, U.; Oosterbeek, H.; Kuipers, H.P.C.E.; Van Dillen, A.J.; De Jong, K.P. Investigation of promoter effects of manganese oxide on carbon nanofiber-supported cobalt catalysts for Fischer–Tropsch synthesis. J. Catal. 2006, 237, 152–161. [Google Scholar] [CrossRef]
- Bezemer, G.L.; Falke, U.; Van Dillen, A.J.; De Jong, K.P. Cobalt on carbon nanofiber catalysts: Auspicious system for study of manganese promotion in Fischer–Tropsch catalysis. Chem. Commun. 2005, 6, 731–733. [Google Scholar] [CrossRef] [PubMed][Green Version]
- Eschemann, T.O.; Lamme, W.S.; Manchester, R.L.; Parmentier, T.E.; Cognigni, A.; Rønning, M.; de Jong, K.P. Effect of support surface treatment on the synthesis, structure, and performance of Co/CNT Fischer–Tropsch catalysts. J. Catal. 2015, 328, 130–138. [Google Scholar] [CrossRef]
- Akbarzadeh, O.; Mohd Zabidi, N.; Abdul Wahab, Y.; Hamizi, N.; Chowdhury, Z.; Merican Aljunid Merican, Z.; Ab Rahman, M.; Akhter, S.; Rasouli, E.; Johan, M. Effect of Cobalt Catalyst Confinement in Carbon Nanotubes Support on Fischer-Tropsch Synthesis Performance. Symmetry 2018, 10, 572. [Google Scholar] [CrossRef]
- Trépanier, M.; Tavasoli, A.; Dalai, A.K.; Abatzoglou, N. Fischer–Tropsch synthesis over carbon nanotubes supported cobalt catalysts in a fixed bed reactor: Influence of acid treatment. Fuel Process. Technol. 2009, 90, 367–374. [Google Scholar] [CrossRef]
- Akbarzadeh, O.; Mohd Zabidi, N.; Hamizi, N.; Abdul Wahab, Y.; Aljunid Merican, Z.; Yehya, W.; Akhter, S.; Shalauddin, M.; Rasouli, E.; Johan, M. Effect of pH, Acid and Thermal Treatment Conditions on Co/CNT Catalyst Performance in Fischer–Tropsch Reaction. Symmetry 2019, 11, 50. [Google Scholar] [CrossRef]
- Akbarzadeh, O.; Mohd Zabidi, N.; Abdul Wahab, Y.; Hamizi, N.; Chowdhury, Z.; Aljunid Merican, Z.; Ab Rahman, M.; Akhter, S.; Shalauddin, M.; Johan, M. Effects of Cobalt Loading, Particle Size, and Calcination Condition on Co/CNT Catalyst Performance in Fischer–Tropsch Reactions. Symmetry 2018, 11, 7. [Google Scholar] [CrossRef]
- Sudarsanam, P.; Zhong, R.; Van den Bosch, S.; Coman, S.M.; Parvulescu, V.I.; Sels, B.F. Functionalised heterogeneous catalysts for sustainable biomass valorisation. Chem. Soc. Rev. 2018, 47, 8349–8402. [Google Scholar] [CrossRef]
- Park, J.; Regalbuto, J.R. A Simple, Accurate Determination of Oxide PZC and the Strong Buffering Effect of Oxide Surfaces at Incipient Wetness. J. Colloid Interface Sci. 1995, 175, 239–252. [Google Scholar] [CrossRef]
- Akbarzadeh, O.; Zabidi, N.A.M.; Abdullah, B.; Subbarao, D. Dispersion of Co/CNTs via strong electrostatic adsorption method: Thermal treatment effect. AIP Conf. Proc. 2015, 1669, 020052. [Google Scholar] [CrossRef]
- Akbarzadeh, O.; Mohd Zabidi, N.A.; Abdullah, B.; Subbarao, D. Synthesis and Characterization of Co/CNTs Catalysts Prepared by Strong Electrostatic Adsorption (SEA) Method. Appl. Mech. Mater. 2014, 625, 328–332. [Google Scholar] [CrossRef]
- Bahome, M.C.; Jewell, L.L.; Hildebrandt, D.; Glasser, D.; Coville, N.J. Fischer–Tropsch synthesis over iron catalysts supported on carbon nanotubes. Appl. Catal. A Gen. 2005, 287, 60–67. [Google Scholar] [CrossRef]
- Graham, U.; Dozier, A.; Khatri, R.; Bahome, M.; Jewell, L.; Mhlanga, S.; Coville, N.; Davis, B. Carbon nanotube docking stations: A new concept in catalysis. Catal. Lett. 2009, 129, 39–45. [Google Scholar] [CrossRef]
- Zolfaghari, Z.; Tavasoli, A.; Tabyar, S.; Pour, A.N. Enhancement of bimetallic Fe-Mn/CNTs nano catalyst activity and product selectivity using microemulsion technique. J. Energy Chem. 2014, 23, 57–65. [Google Scholar] [CrossRef]
- Novoselov, K.S.; Geim, A.K.; Morozov, S.V.; Jiang, D.; Katsnelson, M.I.; Grigorieva, I.V.; Dubonos, S.V.; Firsov, A.A. Two-dimensional gas of massless Dirac fermions in graphene. Nature 2005, 438, 197. [Google Scholar] [CrossRef]
- Tavasoli, A.; Taghavi, S. Performance enhancement of bimetallic Co-Ru/CNTs nano catalysts using microemulsion technique. J. Energy Chem. 2013, 22, 747–754. [Google Scholar] [CrossRef]
- Jacobs, G.; Patterson, P.M.; Das, T.K.; Luo, M.; Davis, B.H. Fischer–Tropsch synthesis: Effect of water on Co/Al2O3 catalysts and XAFS characterization of reoxidation phenomena. Appl. Catal. A Gen. 2004, 270, 65–76. [Google Scholar] [CrossRef]
- Tavasoli, A.; Mortazavi, Y.; Khodadadi, A.A.; Mousavian, M.A.; Sadagiani, K.; Karimi, A. Effects of different loadings of Ru and Re on physico-chemical properties and performance of 15% Co/Al2O3 FTS catalysts. Iran. J. Chem. 2005, 24, 9–17. [Google Scholar]
- Akbarzadeh, O.; Mohd Zabidi, N.A.; Abdullah, B.; Subbarao, D. Synthesis of Co/CNTs via Strong Electrostatic Adsorption: Effect of Metal Loading. Adv. Mater. Res. 2014, 1043, 101–104. [Google Scholar] [CrossRef]
- Akbarzadeh, O.; Mohd Zabidi, N.A.; Abdullah, B.; Subbarao, D. Synthesis of Co/CNTs Catalyst via Strong Electrostatic Adsorption: Effect of Calcination Condition. Adv. Mater. Res. 2015, 1109, 1–5. [Google Scholar] [CrossRef]
- Chen, W.; Fan, Z.; Pan, X.; Bao, X. Effect of confinement in carbon nanotubes on the activity of Fischer− Tropsch iron catalyst. J. Am. Chem. Soc. 2008, 130, 9414–9419. [Google Scholar] [CrossRef] [PubMed]
- Kozhuharova, R.; Ritschel, M.; Elefant, D.; Graff, A.; Mönch, I.; Mühl, T.; Schneider, C.; Leonhardt, A. (FexCo 1−x)-alloy filled vertically aligned carbon nanotubes grown by thermal chemical vapor deposition. J. Magn. Magn. Mater. 2005, 290, 250–253. [Google Scholar] [CrossRef]
- Tavasoli, A.; Sadagiani, K.; Khorashe, F.; Seifkordi, A.; Rohani, A.; Nakhaeipour, A. Cobalt supported on carbon nanotubes—A promising novel Fischer–Tropsch synthesis catalyst. Fuel Process. Technol. 2008, 89, 491–498. [Google Scholar] [CrossRef]
- Jothimurugesan, K.; Goodwin, J.G.; Gangwal, S.K.; Spivey, J.J. Development of Fe Fischer–Tropsch catalysts for slurry bubble column reactors. Catal. Today 2000, 58, 335–344. [Google Scholar] [CrossRef]
- Bezemer, G.; Van Laak, A.; Van Dillen, A.; De Jong, K. Cobalt supported on carbon nanofibers-a promising novel Fischer-Tropsch catalyst. Stud. Surf. Sci. Catal. 2004, 147, 259–264. [Google Scholar]
- Bechara, R.; Balloy, D.; Vanhove, D. Catalytic properties of Co/Al2O3 system for hydrocarbon synthesis. Appl. Catal. A Gen. 2001, 207, 343–353. [Google Scholar] [CrossRef]
- Tavasoli, A.; Abbaslou, R.M.M.; Trepanier, M.; Dalai, A.K. Fischer–Tropsch synthesis over cobalt catalyst supported on carbon nanotubes in a slurry reactor. Appl. Catal. A Gen. 2008, 345, 134–142. [Google Scholar] [CrossRef]
- Tavasoli, A.; Rashidi, A.M.; Sadaghiani, K.; Karimi, A.; Khodadadi, A.; Mortazavi, Y. Carbon nano-tube supported cobalt catalyst for converting synthesis gas to hydrocarbons. EP1782885B1, 9 May 2007. [Google Scholar]
- Brown, R.; Cooper, M.E.; Whan, D.A. Temperature programmed reduction of alumina-supported iron, cobalt and nickel bimetallic catalysts. Appl. Catal. 1982, 3, 177–186. [Google Scholar] [CrossRef]
- De La Peña O’Shea, V.; Álvarez-Galván, M.C.; Campos-Martín, J.M.; Fierro, J. Fischer–Tropsch synthesis on mono-and bimetallic Co and Fe catalysts in fixed-bed and slurry reactors. Appl. Catal. A Gen. 2007, 326, 65–73. [Google Scholar] [CrossRef]
- Das, T.K.; Jacobs, G.; Patterson, P.M.; Conner, W.A.; Li, J.; Davis, B.H. Fischer–Tropsch synthesis: Characterization and catalytic properties of rhenium promoted cobalt alumina catalysts. Fuel 2003, 82, 805–815. [Google Scholar] [CrossRef]
- De La Peña, O.S.; Víctor, A.; Álvarez-Galván, M.C.; Campos-Martin, J.M.; Menéndez, N.N.; Tornero, J.D.; Fierro, J.L. Surface and Structural Features of Co-Fe Oxide Nanoparticles Deposited on a Silica Substrate. Eur. J. Inorg. Chem. 2006, 2006, 5057–5068. [Google Scholar] [CrossRef]
- Larsen, J.H.; Chorkendorff, I. From fundamental studies of reactivity on single crystals to the design of catalysts. Surf. Sci. Rep. 1999, 35, 163–222. [Google Scholar] [CrossRef]
- Zhang, J.; Müller, J.O.; Zheng, W.; Wang, D.; Su, D.; Schlögl, R. Individual Fe-Co alloy nanoparticles on carbon nanotubes: Structural and catalytic properties. Nano Lett. 2008, 8, 2738–2743. [Google Scholar] [CrossRef] [PubMed]
- Morales, F.; Weckhuysen, B.M. Promotion effects in Co-based Fischer-Tropsch catalysis. Catalysis 2006, 19. [Google Scholar] [CrossRef]
- Craciun, R.; Dulamita, N. Influence of La2O3 promoter on the structure of MnOx/SiO2 catalysts. Catal. Lett. 1997, 46, 229–234. [Google Scholar] [CrossRef]
- Thiessen, J.; Rose, A.; Meyer, J.; Jess, A.; Curulla-Ferré, D. Effects of manganese and reduction promoters on carbon nanotube supported cobalt catalysts in Fischer–Tropsch synthesis. Microporous Mesoporous Mater. 2012, 164, 199–206. [Google Scholar] [CrossRef]
- Bertole, C.J.; Mims, C.A.; Kiss, G. The effect of water on the cobalt-catalyzed Fischer–Tropsch synthesis. J. Catal. 2002, 210, 84–96. [Google Scholar] [CrossRef]
- Li, J.; Jacobs, G.; Das, T.; Zhang, Y.; Davis, B. Fischer–Tropsch synthesis: Effect of water on the catalytic properties of a Co/SiO2 catalyst. Appl. Catal. A Gen. 2002, 236, 67–76. [Google Scholar] [CrossRef]
- Huffman, G.P.; Shah, N.; Zhao, J.; Huggins, F.E.; Hoost, T.E.; Halvorsen, S.; Goodwin, J. In-situ XAFS investigation of K-promoted Co catalysts. J. Catal. 1995, 151, 17–25. [Google Scholar] [CrossRef]
- Madon, R.J.; Iglesia, E. The importance of olefin readsorption and H2/CO reactant ratio for hydrocarbon chain growth on ruthenium catalysts. J. Catal. 1993, 139, 576–590. [Google Scholar] [CrossRef]
- Patzlaff, J.; Liu, Y.; Graffmann, C.; Gaube, J. Studies on product distributions of iron and cobalt catalyzed Fischer–Tropsch synthesis. Appl. Catal. A: Gen. 1999, 186, 109–119. [Google Scholar] [CrossRef]
- Jam, S.; Ahangary, M.G.; Tavasoli, A.; Sadaghiani, K.; Pour, A.N. Enhancement of distillate selectivity in Fischer-Tropsch synthesis by using iron and cobalt catalysts in a novel dual-bed reactor. React. Kinet. Catal. Lett. 2006, 89, 71–79. [Google Scholar] [CrossRef]
- Tavasoli, A.; Trépanier, M.; Dalai, A.K.; Abatzoglou, N. Effects of confinement in carbon nanotubes on the activity, selectivity, and lifetime of Fischer−Tropsch Co/carbon nanotube catalysts. J. Chem. Eng. Data 2010, 55, 2757–2763. [Google Scholar] [CrossRef]


| Samples | BET Surface Area (m2/g) | Total Pore Volume (m3/g) |
|---|---|---|
| Pristine CNT | 138.2 | 1.58 |
| CNT.A | 223.2 | 0.88 |
| CNT.A.T | 266.4 | 0.54 |
| 95Co5Mn/CNT.A.T | 217.5 | 0.36 |
| 90Co10Mn/CNT.A.T | 220.8 | 0.48 |
| 85Co15Mn/CNT.A.T | 223.4 | 0.55 |
| 80Co20Mn/CNT.A.T | 225.3 | 0.58 |
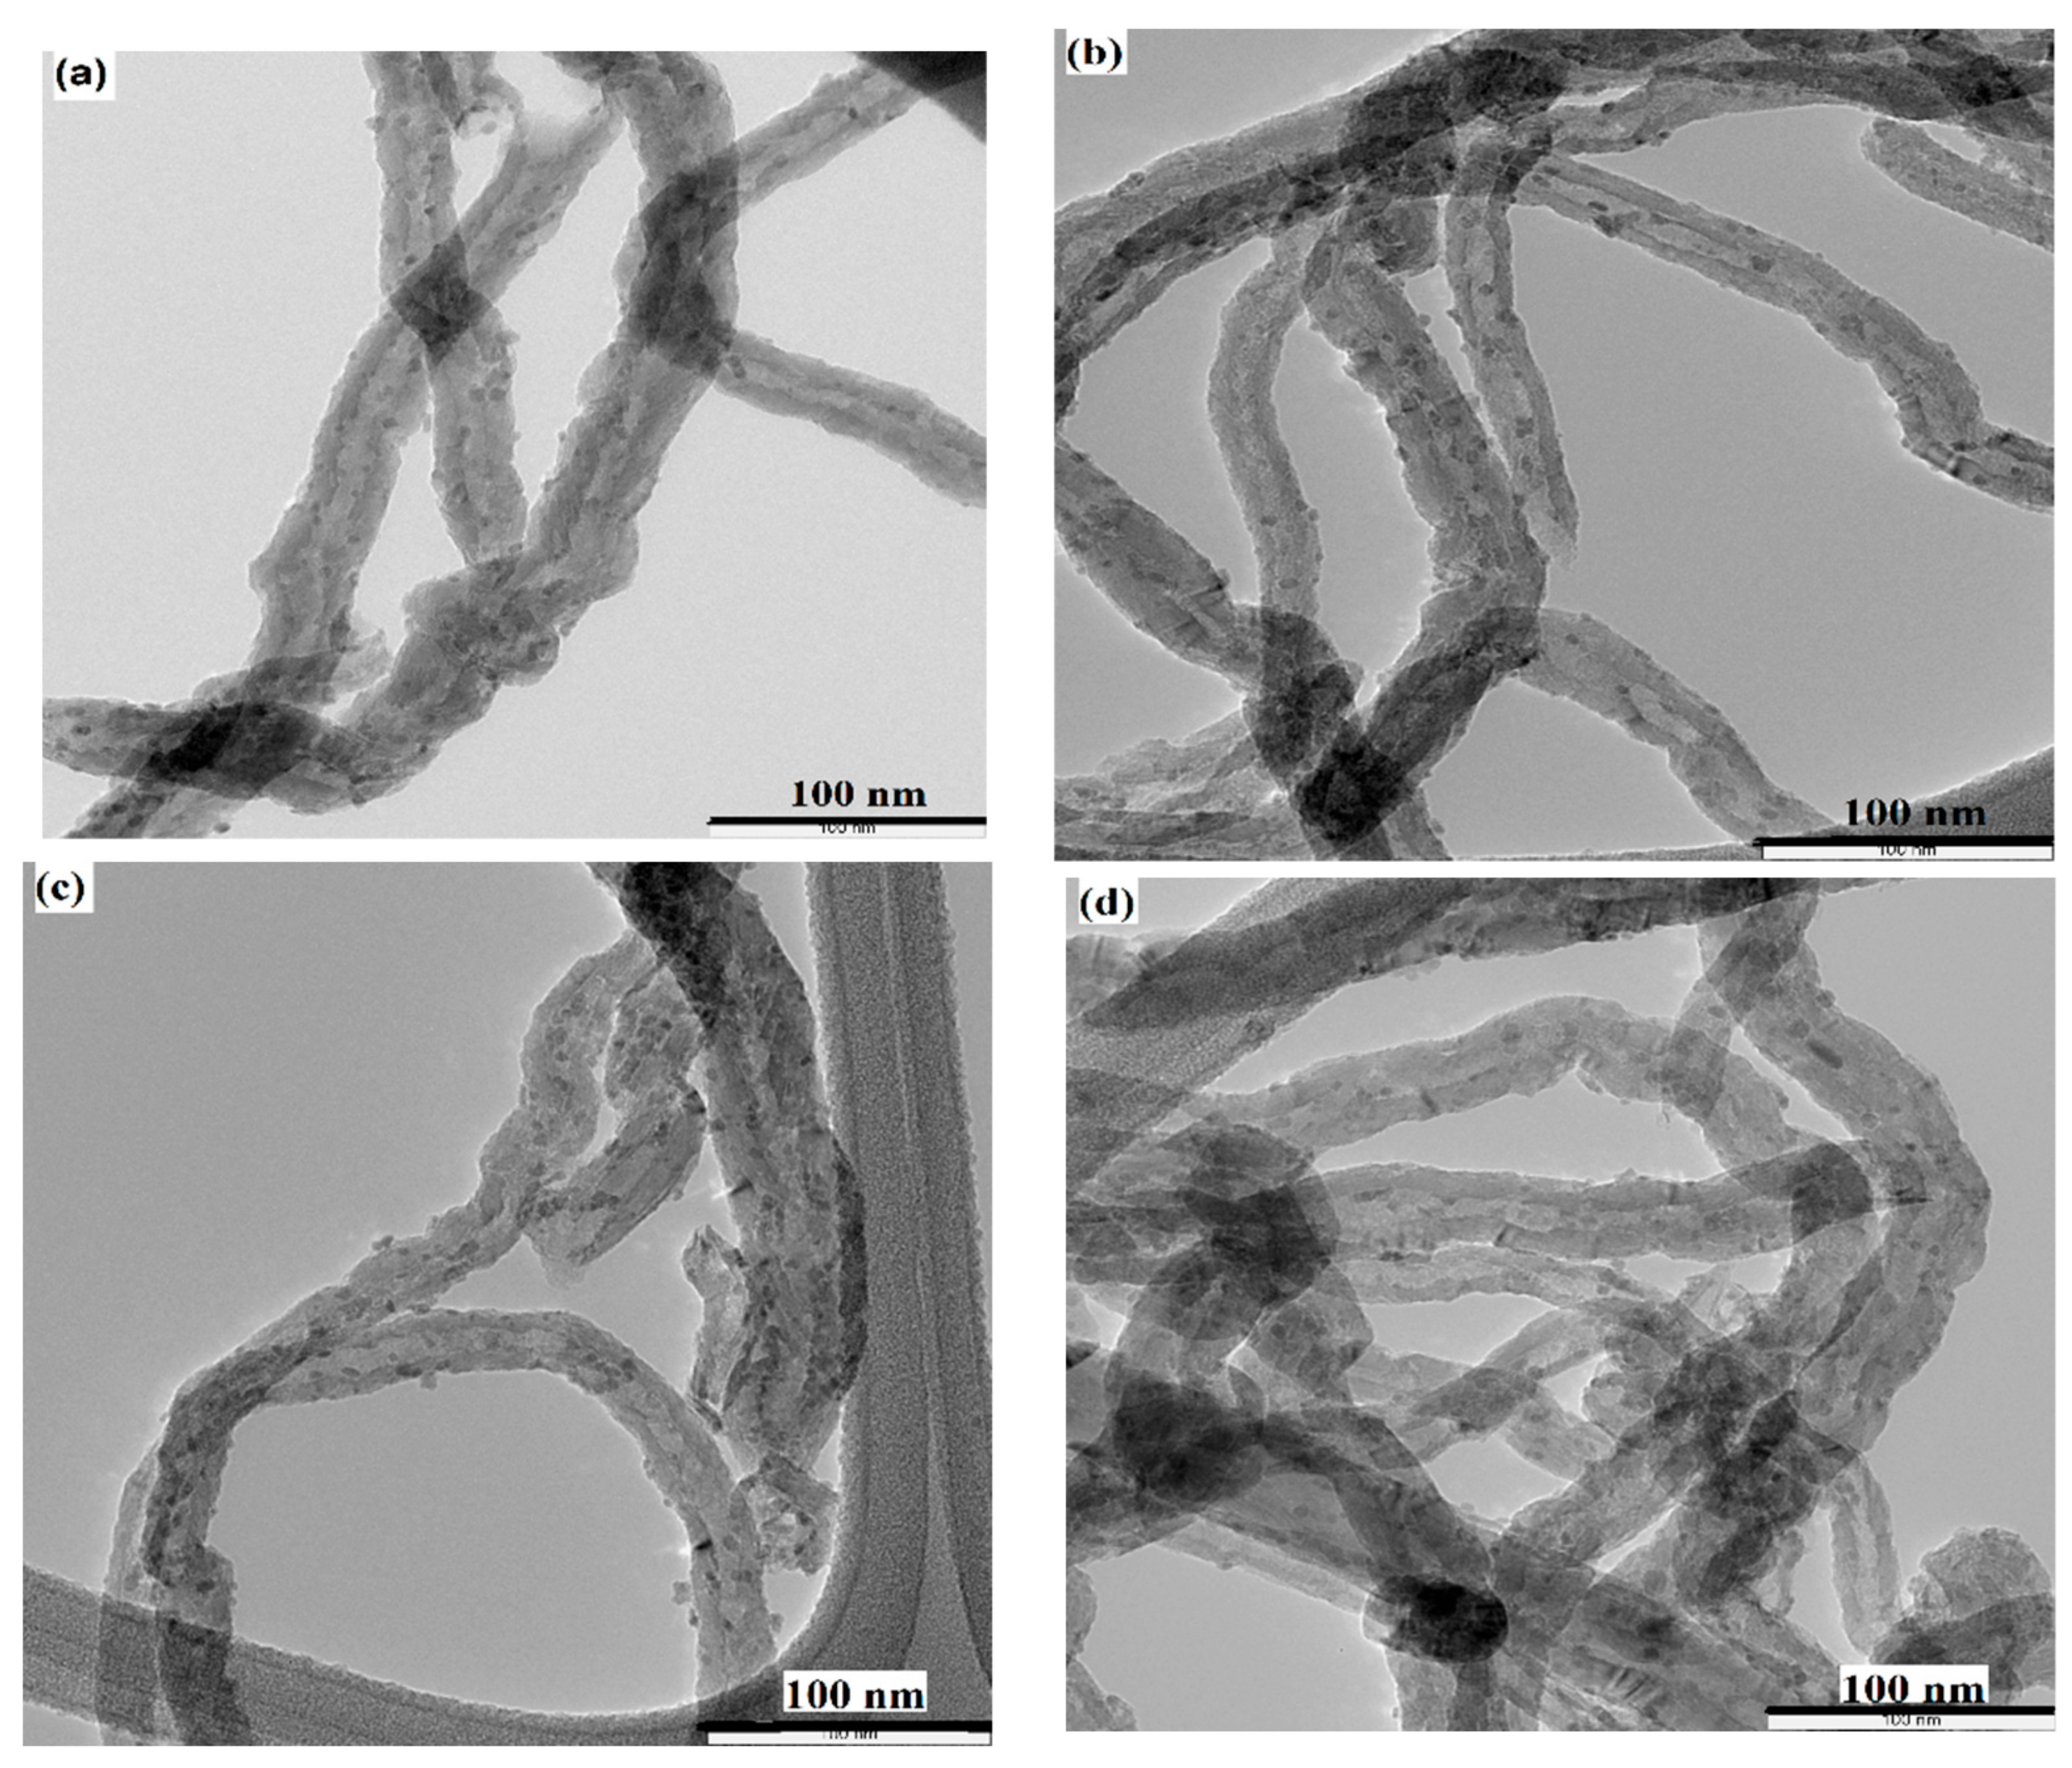
| Catalyst | XRD (dCo3O4) (nm) | TEM Ave. Size (nm) |
|---|---|---|
| 95Co5Mn/CNT.A.T | 7.5 | 7.7 |
| 90Co10Mn/CNT.A.T | 7.2 | 7.3 |
| 85Co15Mn/CNT.A.T | 6.8 | 6.9 |
| 80Co20Mn/CNT.A.T | 6.5 | 6.7 |
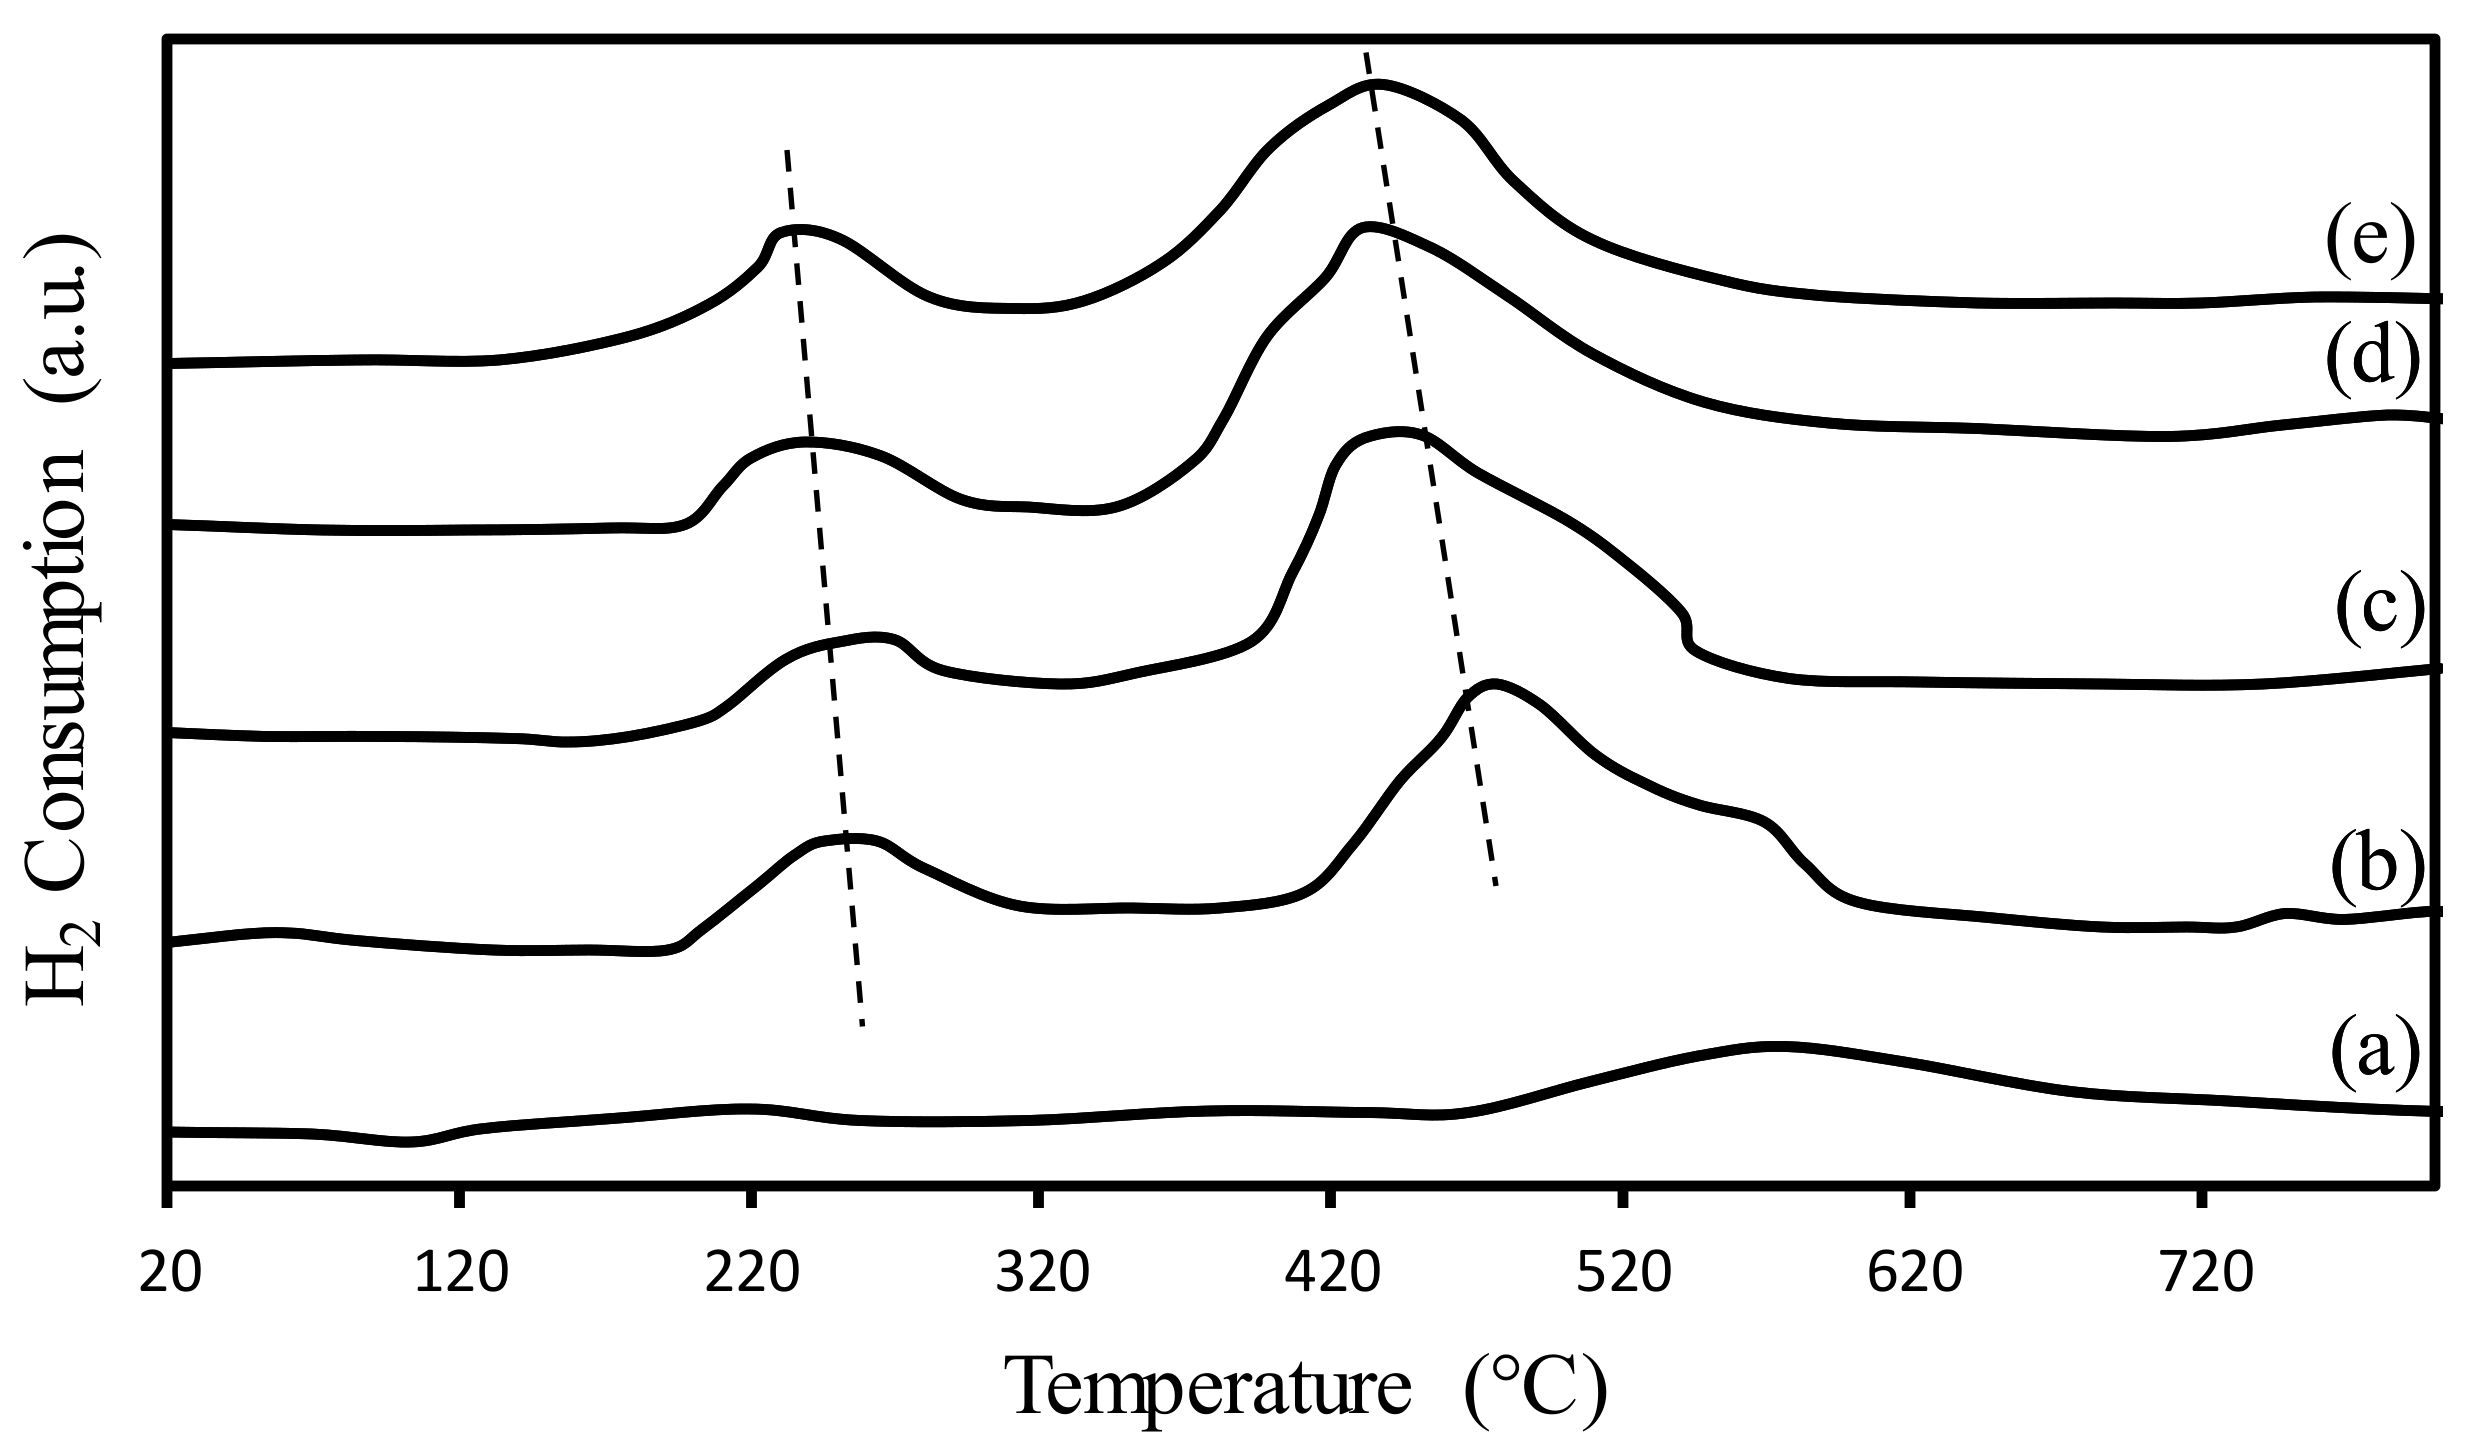
| Samples | 1st Peak °C | 2nd Peak °C | H2 Uptake * | % Disp. | Reduction (%) | No of Active Sites × (1020) |
|---|---|---|---|---|---|---|
| CNT.A.T | ---- | 590 | ---- | ---- | ---- | ---- |
| Co/CNT | 279 | 508 | 100.0 | 14.7 | 50.1 | 3.5 |
| 95Co5Mn/CNT.A.T | 258 | 502 | 100.1 | 22.1 | 68.1 | 5.8 |
| 90Co10Mn/CNT.A.T | 251 | 494 | 97.5 | 20.3 | 63.8 | 5.1 |
| 85Co15Mn/CNT.A.T | 245 | 487 | 94.3 | 18.4 | 55.2 | 4.6 |
| 80Co20Mn/CNT.A.T | 232 | 478 | 91.6 | 17.1 | 48.8 | 4.2 |
| Mn/CNT | 269 | 481 | 32.4 | 12.2 | 35.7 | 3.1 |
| Catalyst | XPS BE (eV) | Atomic Ratios | ∆ECo | ||||
|---|---|---|---|---|---|---|---|
| Co2p3/2 | Co2p1/2 | Mn2p3/2 | Mn2p1/2 | Co3+/Mn4+ | Co2+/Co3+ | ||
| Co/CNT | 780.5 | 796.0 | ---- | ---- | ---- | 0.19 | 15.5 |
| 5Mn95Co/CNT | 780.2 | 795.3 | 641.4 | 652.9 | 2.6 | 1.33 | 15.1 |
| 10Mn90Co/CNT | 780.7 | 796.4 | 641.6 | 653.3 | 2.01 | 0.72 | 15.7 |
| 15Mn85Co/CNT | 781.0 | 796.9 | 641.5 | 653.2 | 1.7 | 0.89 | 15.9 |
| 20Mn80Co/CNT | 781.2 | 797.3 | 641.6 | 654.1 | 1.1 | 0.93 | 16.1 |
| Mn/CNT | ---- | ---- | 641.9 | 653.6 | ---- | ---- | 11.9 |
| Catalyst | %COCon | CH4% | (C2–C4)% | C5+% | Yield% | CO2% | O/P | α |
|---|---|---|---|---|---|---|---|---|
| Co/CNT | 58.7 | 9.5 | 13.4 | 59.1 | 34.7 | 10.4 | 0.60 | 0.591 |
| 95Co5Mn/CNT | 86.6 | 11.8 | 6.7 | 81.5 | 70.6 | 6.5 | 0.74 | 0.751 |
| 90Co10Mn/CNT | 79.8 | 13.3 | 8.4 | 78 | 62.2 | 5.9 | 0.72 | 0.734 |
| 85Co15Mn/CNT | 73.2 | 14.1 | 9.4 | 76.5 | 56.0 | 5.2 | 0.69 | 0.715 |
| 80Co20Mn/CNT | 66.3 | 15.0 | 10.5 | 74.5 | 49.4 | 4.5 | 0.66 | 0.692 |
| Mn/CNT | 31.5 | 17.0 | 11.1 | 11.6 | 36.5 | 8.9 | 0.40 | 0.372 |
© 2019 by the authors. Licensee MDPI, Basel, Switzerland. This article is an open access article distributed under the terms and conditions of the Creative Commons Attribution (CC BY) license (http://creativecommons.org/licenses/by/4.0/).
Share and Cite
Akbarzadeh, O.; Mohd Zabidi, N.A.; Aljunid Merican, Z.M.; Sagadevan, S.; Kordijazi, A.; Das, S.; Amani Babadi, A.; Ab Rahman, M.; Hamizi, N.A.; Abdul Wahab, Y.; et al. Effect of Manganese on Co–Mn/CNT Bimetallic Catalyst Performance in Fischer–Tropsch Reaction. Symmetry 2019, 11, 1328. https://doi.org/10.3390/sym11111328
Akbarzadeh O, Mohd Zabidi NA, Aljunid Merican ZM, Sagadevan S, Kordijazi A, Das S, Amani Babadi A, Ab Rahman M, Hamizi NA, Abdul Wahab Y, et al. Effect of Manganese on Co–Mn/CNT Bimetallic Catalyst Performance in Fischer–Tropsch Reaction. Symmetry. 2019; 11(11):1328. https://doi.org/10.3390/sym11111328
Chicago/Turabian StyleAkbarzadeh, Omid, Noor Asmawati Mohd Zabidi, Zulkifli Merican Aljunid Merican, Suresh Sagadevan, Amir Kordijazi, Sourav Das, Arman Amani Babadi, Marlinda Ab Rahman, Nor Aliya Hamizi, Yasmin Abdul Wahab, and et al. 2019. "Effect of Manganese on Co–Mn/CNT Bimetallic Catalyst Performance in Fischer–Tropsch Reaction" Symmetry 11, no. 11: 1328. https://doi.org/10.3390/sym11111328
APA StyleAkbarzadeh, O., Mohd Zabidi, N. A., Aljunid Merican, Z. M., Sagadevan, S., Kordijazi, A., Das, S., Amani Babadi, A., Ab Rahman, M., Hamizi, N. A., Abdul Wahab, Y., & Rafie Johan, M. (2019). Effect of Manganese on Co–Mn/CNT Bimetallic Catalyst Performance in Fischer–Tropsch Reaction. Symmetry, 11(11), 1328. https://doi.org/10.3390/sym11111328