Article

Extraction of Cellulose Nano-Whiskers Using Ionic Liquid-Assisted Ultra-Sonication: Optimization and Mathematical Modelling Using Box–Behnken Design

by
Zaira Zaman Chowdhury
1,*,
R. Reevenishaa Ravi Chandran
2,
Afrin Jahan
1,
Khalisanni Khalid
3,
Md Mahfujur Rahman
4,5,
Md Al-Amin
6,
Omid Akbarzadeh
1,
Irfan Anjum Badruddin
7,
T. M. Yunus Khan
7,
Sarfaraz Kamangar
7,
Nor Aliya Binti Hamizi
1,
Yasmin Abdul Wahab
1,
Rafie Bin Johan
1 and
Ganiyu Abimbola Adebisi
8
1
Nanotechnology and Catalysis Research Center (NANOCAT), University of Malaya, Kuala Lumpur 50603, Malaysia
2
Department of Chemical Engineering, Faculty of Engineering and the Built environment, Segi University, Kuala Lumpour 50100, Malaysia
3
Malaysian Agricultural Research and Development Institute (MARDI), Serdang 43400, Selangor, Malaysia
4
Islamic Business School, Universiti Utara Malaysia, 06010, UUM, Sinto, Kedah 060010, Malaysia
5
Halal Products Research Institute, Universiti Putra Malaysia, UPM, Serdang, Selangor 43400, Malaysia
6
Global Centre for Environmental Remediation (GCER), University of Newcastle, Callaghan, NSW 2308, Australia
7
Department of Mechanical Engineering, College of Engineering, King Khalid University, PO Box 394, Abha 61421, Saudi Arabia
8
Osun State Polytechnic, Iree PMB 301, Nigeria
*
Author to whom correspondence should be addressed.
Symmetry 2019, 11(9), 1148; https://doi.org/10.3390/sym11091148
Submission received: 30 July 2019 / Revised: 29 August 2019 / Accepted: 3 September 2019 / Published: 10 September 2019
(This article belongs to the Special Issue Nanocatalysis and Symmetry in Chemistry)

Abstract

:
This study focuses on the extraction of cellulose nano-whiskers (CNWs) from the leaves of Adansonia kilima (AK), usually known as African baobab, using a combination of a microwave-assisted alkali (KOH) pre-treatment with subsequent bleaching process prior to ultra-sonication. Ultra-sonication was carried out using the ionic liquid (IL) 1-butyl-3-methylimidazolium hydrogen sulfate (Bmim-HSO4). Process parameters for ultra-sonication were optimized using a two-level factorial Box–Behnken design (BBD). Process variables such as ultra-sonication power (x1), hydrolysing time (x2) and temperature (x3) were varied. Responses selected were percentage crystallinity index, CrI% (y1) and yield% (y1) for the finally procured CNWs sample. Regression analysis was carried out to develop quadratic model to analyze the effect of process variables on IL-assisted ultra-sonication process. Analysis of variance (ANOVA) showed that ultra-sonication power was the most influential aspect for hydrolyzing the amorphous segments of crude cellulose extracted from baobab leaves. A relative study of the physio-chemical properties of the starting lignocellulosic substrate (AK), KOH pre-treated, bleached and IL-assisted ultra-sonicated CNWs was conducted. The synthesized samples were characterized using Fourier transform infrared spectroscopy, Scanning electron microscopy, atomic force microscopy, high resolution transmission electron microscopy, X-ray diffraction and thermo-gravimetric and zeta potential analysis. Under optimum condition, the extracted CNWs showed an average width of 15–20 nm; with high crystallinity index of 86.46%. This research provides an insight about the delignification of Adansonia kilima (AK) leaves and its effective conversion to CNWs having high crystallinity.

1. Introduction

Application of renewable lignocellulosic feedstock to produce nanocellulose has gained extensive interest over the last few decades. Cellulose nano-whiskers (CNWs) can exhibit some unique features of having low density, high aspect ratio with extended surface area, tunable surface chemistry containing negative hydroxyl groups (–OH) with biodegradability and superior thermal and mechanical properties [1,2,3,4]. They are considered as a promising candidate for versatile application in opto-electronic devices, smart composite materials for environmental as well as biomedical application [5,6,7]. Several preparation techniques are available to obtain CNWs from ligno-cellulosic residues. Various mechanical or chemical approaches can be undertaken to obtain the nanocellulose having various morphological and chemical properties [8,9,10,11,12,13]. Usually preliminary treatment of raw biomass substrates is carried out using alkali treatment and bleaching first to separate the lignin and hemicellulose fraction to obtain crude cellulose. After that, subsequent traditional acid hydrolysis with concentrated Lewis acid (H2SO4, HNO3, HCl) is carried out for selective hydrolysis of amorphous region of cellulose to yield nanocellulose. The cellulosic matrix in ligno-cellulosic biomass contain lignin polymer having complex structure in the primary cell wall which causes recalcitrance. This results in difficulties to yield nanocellulose [14,15]. Eliminating lignin using energy efficient, green technology to intensify the degree of nano-fibrillation is often critical. Commonly used chemical reagents, especially corrosive acids, sulphite treatment and TEMPO mediated oxidation have been widely used to delignify the lignocellulosic substrates. Although successful extraction has been carried out by following those methods, some practical obstacles remain for their large-scale production, such as prolonged reaction time with lower yield percentages, use of concentrated corrosive mineral acids and environmental pollution. In this regard, some novel protocols consisting of microwave-assisted heating in presence of alkali (NaOH, KOH, Ca(OH)2) and peroxide bleaching process with subsequent hydrolysis using ionic liquids (ILs)-as green solvent during the ultrasonication have been recognized as eco-friendly approaches [16,17,18]. Application of ionic liquids (ILs) can prevent the use of corrosive mineral acids and reduce environmental pollution [8,19,20].
Ultrasonication can be carried out in different mediums to disperse the nanocellulose crystals in homogeneous suspension with a desired aspect ratio. The ultrasonication process also improves the mass transfer efficiency of nanocellulose extraction process in the presence of suitable solvent under optimized condition. Ultrasonic waves can cause mechanical oscillation inside the reaction medium to generate a cavitation effect. This will initiate formation, growth and collapse of microscopic gas bubbles. It will disintegrate the intra-and intermolecular hydrogen bonding in cellulosic fiber. At the secondary stage, the cellulosic microfiber will further disintegrate in the presence of suitable medium under optimum condition to yield cellulose nano-whiskers (CNWs). Furthermore, it does not alter the fibers’ properties significantly [21,22,23,24]. Application of acid hydrolysis reduces the yield of CNWs to a greater extent making its large-scale commercial production difficult. Thus, overall the process becomes time consuming which is not economically feasible [14,15]. In this context, production efficiency of CNWs should be upgraded by combination of physiochemical treatment as well as avoiding the use of hypochlorite bleaching and application of harsh, corrosive Lewis acids like H2SO4, H3PO4, HCl, etc. In this research, the acidic IL of [Bmim]HSO4 was chosen to extract CNWs during ultrasonication process. [Bmim]HSO4 is classified as Bronsted acidic ionic liquid having pKa values of 2 in presence of water [16,17,18]. It was expected that [Bmim]HSO4 will play dual role for swelling and selective hydrolysis of crude cellulose obtained from pretreated and bleached AK leaves. The presence of shorter alkyl chain (Butyl) with alkylimidazolium cations of [Bmim]HSO4 will have improved solvation capability with higher anion concentration. The presence of negative anions of [HSO4]—will make it acidic and enhance the interlayer distance between the cellulosic chain by swelling and will cause destruction of strong hydrogen bond [16,17,18].
Compared to conventional heating, microwave-assisted heating process can be much more efficient based on starting lignocellulosic residues. Microwave-assisted pretreatment will initiate the breakdown of the cell walls of lignocellulosic residues which involves some biochemical conversion process. This will lead to disruption as well as disintegration of the recalcitrance structures and open some channels for subsequent hydrolysis processes. The cavitation effect can significantly improve the diffusion of heat through convection process to intensify the delignification process. The electromagnetic energy of microwave can transfer the heat inside the interior region of lignocellulosic substrate to separate the lignin from the cellulosic matrix within a shorter reaction time. Thus, the process also becomes energy efficient. It will liberate the cellulose fiber from lignin matrix, enhance the porosity of cellulose and increase the crystallinity index. Until recently, response surface methodology (RSM) has been widely used by the researchers to optimize the complex process of synthesis, modeling, and simulation with statistical analysis. Relatively lesser number of experiments are needed to determine the optimum condition for the reaction, thereby reducing the cost and time of the synthesis process effectively. It also can provide the insight about the relationship between the reaction variables (inputs) with responses (desired output) [25,26].
To the best of our knowledge, until now no research has been conducted to extract CNWs with high crystallinity index from Adansonia kilima (AK) leaves. In this research, dried leaves of Adansonia kilima (AK) were solvent–extracted to reduce pectin, wax, pigments, etc. Subsequently after that, microwave-assisted KOH pre-treatment and peroxide bleaching were carried out to extract CNWs in presence of Bmim-HSO4 IL using ultrasonication. The ultrasonication process was optimized and relevant mathematical polynomial models were developed for crystallinity index, CrI% (y1) and yield% (y2) of CNWs. Statistical analysis with model validation were carried out using RSM technique based on Box–Behnken (BBD) experimental design. Finally extracted CNWs samples were characterized in terms of FESEM, HRTEM, AFM, XRD, TGA, FTIR and Zeta potential analysis. The output of this research clearly shows the role of Bmim-HSO4 IL in extracting highly purified crystals of CNWs having high crystallinity index (CrI%).

2. Materials and Methods

2.1. Materials

The IL 1-butyl-3-methylimidazolium hydrogen sulfate (Bmim-HSO4), potassium hydroxide (KOH), hydrogen peroxide (30%, H2O2) were obtained from Merck (Selangor, Malaysia). Dried leaves of Adansonia kilima (AK) (AKL-1) was obtained from local farmhouses in Khartoum, Sudan. Analytical grade toluene (C7H8) and ethanol (C2H5OH) were purchased from Sigma-Aldrich (Petaling Jaya, Malaysia).

2.2. Method

The dried leaves (AKL-1) were crushed and sieved to 200 µm. They were extracted with a 1:2 solution of ethyl alcohol and toluene for 8 h to remove pectin, wax, pigments, etc. [27,28]. The sample thus obtained was washed with hot deionized water (DI) for several times and dried using a vacuum oven overnight at 60 °C. The sample was labeled as AKL-2 and stored in an airtight container to prevent fungal development. It was sent for subsequent characterizations.

2.2.1. Microwave Pre-Treatment Using KOH

Microwave heating of AKL-2 sample was carried out at constant temperature of 90 °C and the power was fixed to 300 watts to avoid char formation. The required amount (gm) of AKL-2 was added with KOH pellets and the ratio between dewaxed residues (AKL-2) with KOH was maintained at 1:0.25. The mixture was transferred to microwave glass tube with addition of 100 mL deionized water (DI). Microwave heating was carried out for 30 min under nitrogen flow. After 30 min, the sample was cooled to room temperature and filtered to separate the liquid fraction from the solid one. The solid fraction was the partially delignified sample (AKL-3) which was washed repeatedly with DI water and ethanol. The sample thus obtained was dried overnight in vacuum oven at 55 °C and labeled as AKL-3 for further characterizations.

2.2.2. Peroxide Bleaching

AKL-3 was refluxed with 100 mL of 30% H2O2 for 6 h at 60 °C to bleach the sample completely. The sample was filtered and washed with DI water several times until the pH became 6.5–7.5. It was dried overnight in in vacuum oven at 55 °C and labeled as AKL-4 for subsequent characterizations.

2.2.3. Extraction of CNWs Using Ultrasonication

After alkaline peroxide treatment, the sample AKL-4 was ultra-sonicated in presence of ionic liquid, maintaining the reaction condition suggested by the design of experiment based on BBD design. The reaction conditions along with the design matrix obtained for ultrasonication are summarized in Table 1 and Table 2. A total of 10 g of crude cellulosic sample (AKL-4) was added with 100 g of ILs solvent. Ultra-sonication power (x1), time (x2) and temperature (x3) were varied accordingly (Table 2). After the predetermined period (hydrolysis time) of ultrasonication at different conditions (Table 2), 30 mL cold deionized waster (DI) was added with the mixture and was stirred until the temperature reached room temperature. The milky white, colloidal suspension of cellulose thus obtained was centrifuged at 6500 rpm for 30 min. The white cellulosic precipitate obtained was separated from the mixture and washed with hot DI water several times until the pH became 5.5–6. The sample thus obtained was freeze dried at −4 °C for two days and labelled as AKL-5 which was the finally extracted CNWs sample.

2.2.4. Experimental Design and Optimization

In this research, ultrasonication experiments were conducted using response surface methodology using BBD design where the reaction variables (Power = x1, time = x2 and temperature = x3) were varied to observe its impact on preselected responses of crystallinity index, CrI% (y1) and yield% (y2) of finally extracted cellulose nano-whiskers (CNWs). The experimental data were analyzed using Design the Experiment (Design-Expert V9.0). A relevant mathematical model was developed and the accuracy of the model was validated by analysis of variance (ANOVA) test. The process optimization was carried out to get maximum crystallinity index, CrI% and yield% of CNWs (AKL-5).

2.2.5. Characterizations

The surface morphological features of all the samples synthesized here (AKL-2, AKL-3, AKL-4 and AKL-5) including the starting lignocellulosic residues of dried leaves (AKL-1) were observed using a field emission scanning electron microscope (FESEM) (Leo-Supra 55, Carl Zeiss, London, UK). The sample was placed over the conductive carbon tape and it was coated with gold having a thickness of 5 nm before FESEM analysis. From FESEM images, a software (Olympus, Tokyo, Japan) was used to measure the length of the extracted sample (AKL-5). After ultrasonication, HRTEM analysis was carried out for optimum sample (AKL-5) (JEOL-2100 F, Tokyo, Japan). The samples were mixed with C2H5OH and sonicated for 10 min and then a drop of sample was placed over the copper grid and allowed to dry before taking the HRTEM images. Atomic force microscopic (AFM) analysis was carried out for finally extracted CNWs sample (AKL-5) to observe the shape and surface topography (Multimode Nano-Scope-IIIA, Bruker, Billerica, USA). The samples were sonicated for 15 min to prevent aggregation and a drop was placed over the glass slides. After it was dried at ambient temperature, AFM analysis was carried out. Thermogravimetric analysis with DTGmax (TGA-Q0500, Shimadzu, New York, USA) was carried out to observe the thermal degradation profile of all the extracted samples where 5 mg of all the sample was heated from 30 °C to 1000 °C under the nitrogen flow (150 mL/min) at a heating rate of 5 °C per minute. The crystalline phase, crystallinity index (CrI%) including the d-spacing of the samples, was analyzed by X-ray diffraction technique using CuKα radiation at a voltage around 2.7 Kw (Shimadzu-XRD-6000, Kyoto, Japan). The crystallinity index was calculated using Segal’s method using Equation (1):
CrI% = (I002Iam)/I002 × 100%.
Here, I002 represents the intensity of both crystalline and amorphous regions of the sample at 2θ = 22–24° and Iam represents the intensity of amorphous region of the sample [29]. The samples were ground to powder and mixed with dried KBr and pressed to ultrathin films (approximately 4 mm) and sent for FTIR analysis (Perkin Elmer, Tokyo, Japan).
The surface charge of the synthesized samples (AKL-3, AKl-4 and AKL-5) were measured using zeta potential (Zeta Sizer, Malvern, UK).

3. Results and Discussion

3.1. Mathematical Modeling and Statistical Analysis

For crystallinity index, CrI% (y1) and yield% (y2) of CNWs, two polynomial equations were suggested after regression analysis based on the data obtained from the basic design matrix (Table 2). The design matrix provided the reactions conditions for each experimental run with the output responses of crystallinity index, CrI% (y1) and yield% (y2). The models were chosen based on their polynomial order which should be highest here [28]. Preselected input variables such as power (x1), time (x2) and temperature, (x3) were significant for developing the models. All these input variables had positive impact on crystallinity index, CrI% (y1) and yield% (y2) up to certain extent. After that range, enhancing power (x1), time (x2) and temperature (x3) would reduce the crystallinity index, CrI% (y1) and yield% (y2) both due to extensive hydrolysis of the amorphous and crystalline domain of cellulose to form other organic liquid fractions. Based on the magnitude of the sequential model sum of the squares, the models were not aliased [1,29].
For crystallinity index, CrI% (y1) and yield% (y2), following models were proposed, and the empirical equations obtained for that is given bellow:
y 1 = + 76.12 7.46 x 1 + 1.99 x 2 + 3.64 x 3 3.59 x 1 x 2 5.05 x 2 x 3 + 2.44 x 3 x 1 2.02 x 1 2 0.19 x 2 2   1.44 x 3 2
y 2 = + 83.70 2.53 x 1 3.22 x 2 5.22 x 3 + 0.33 x 1 x 2 3.17 x 2 x 3 + 0.67 x 1 x 3 0.13 x 1 2 + 1.03 x 2 2 + 6.08 x 3 2
The numerical coefficients before the linear terms depicting power ( x 1 ), time ( x 2 ) and temperature ( x 3 ) illustrated the impact of these specific parameters for ultra-sonication of crude cellulose (AKL-4). However, the terms obtained after multiplication of two different variables such as   x 1 x 2 , x 2 x 3 and x 3 x 1 represent the interaction effects on the desired output/responses. The terms   x 1 2 , x 2 2 and x 3 2 denote the quadratic effects. A positive sign in front of each term specifies the synergistic effect while the negative symbol shows the antagonistic effect [1,29].
Figure 1a,b displays the linear regression plots for predicted versus actual/experimentally analyzed results for crystallinity index, CrI% (y1) and CNWs yield% (y2), respectively. The plots revealed that the experimental data obtained here for both the responses were closer to the predicted values exhibiting R2 values for the Equations (2) and (3) around 0.987 and 0.986 for crystallinity index, CrI% (y1) (Figure 1a) and CNWs yield%, (y2) (Figure 1b); correspondingly. This evidences the outstanding adjustment of the proposed models with the experimental observation.
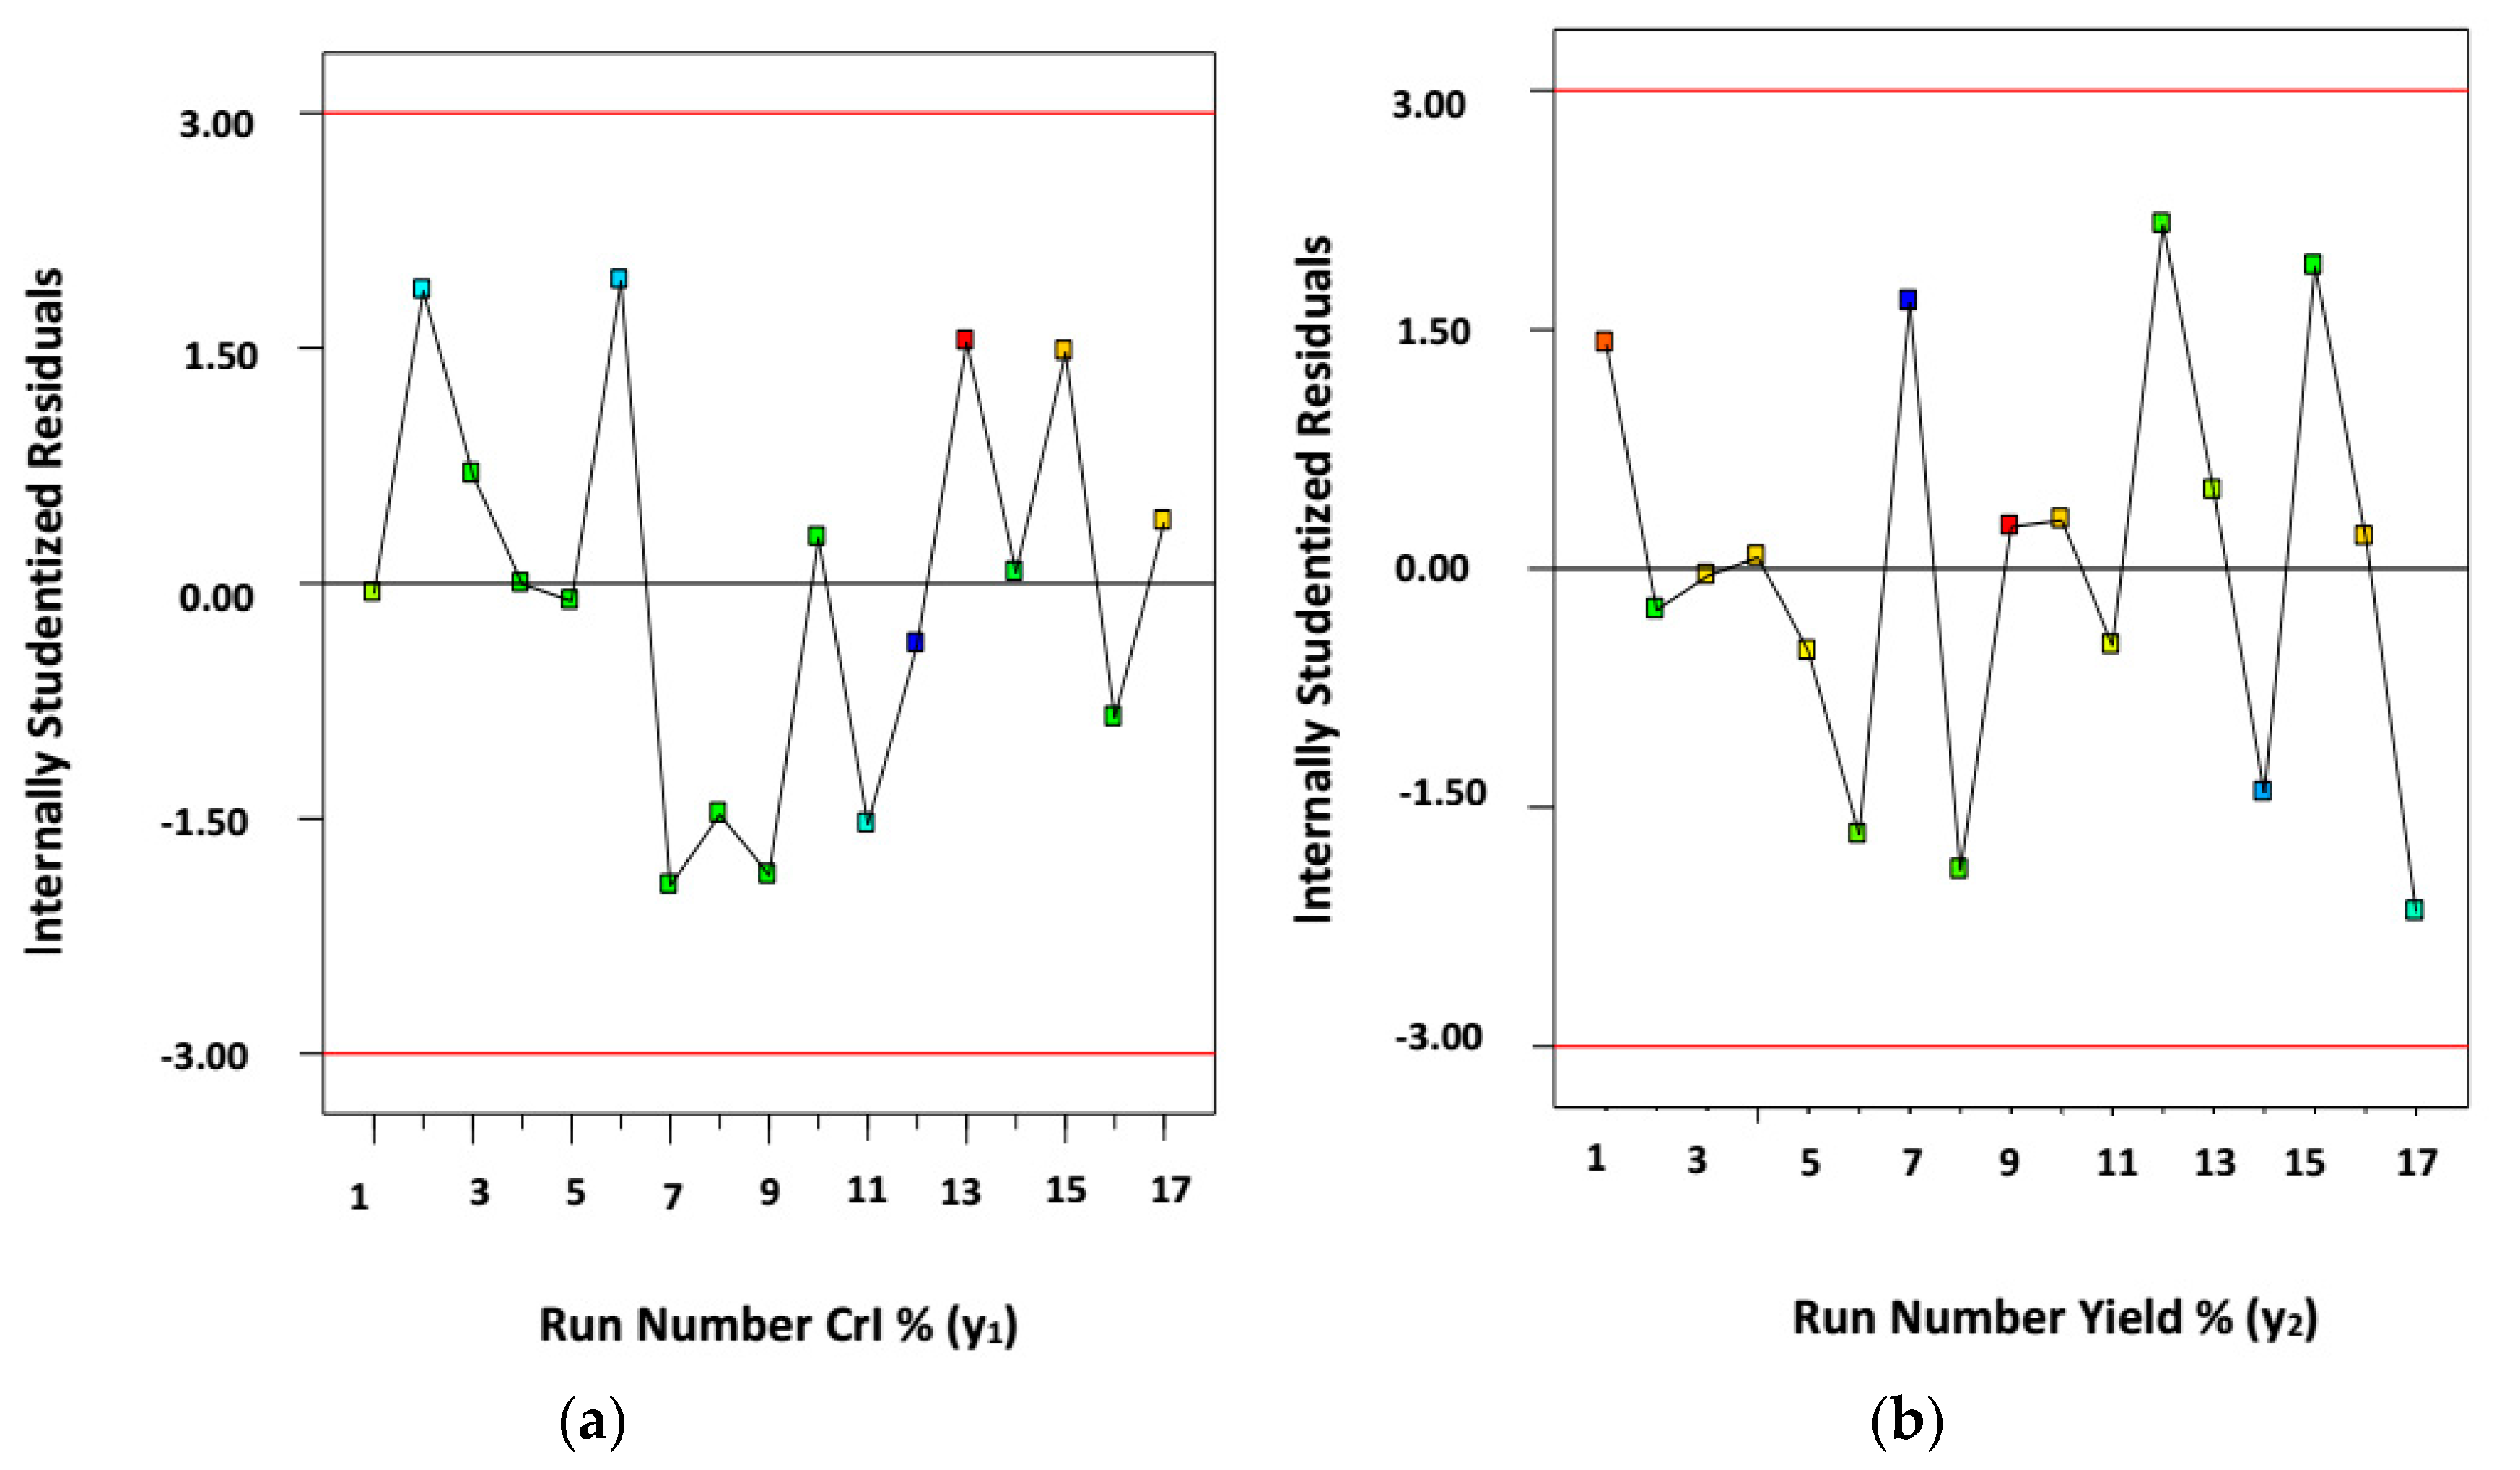
The studentized residuals obtained here for CrI% (y1) and yield% (y2) of CNWs (AKL-5) throughout the 17 experimental runs (Table 2) are shown by Figure 2a,b. Residual error is the difference between experimental data and predicted data for modelling. Studentized residual is obtained by dividing the residual error with standard deviation. Figure 2a,b showed that the points are arbitrarily scattered but were within the range of ±3.00. Thus, transformation of responses is not required, and the models used here are suitable to analyze the overall extraction process using IL-assisted ultra-sonication [1,29].

3.2. Analysis of Variance (ANOVA) Test and Statistical Analysis

An analysis of variance (ANOVA) test was done to observe the competency of the developed model Equations (2) and (3). The statistical parameters with relevant correlation coefficient (actual and adjusted) after the linear regression analysis are listed in Table 3.
The appropriateness of the developed models can be additionally confirmed by observing the values of standard deviation, coefficient of variation (CV) and adequate precision. The experimental R2 values were in close agreement with the adjusted R2 values. The magnitudes of standard deviation observed here for both the models were relatively smaller. Furthermore, the values for coefficient of variation (CV) were also only 1.22 and 1.06 for the empirical models Equations (2) and (3). This represents the reproducibility of the experimental data with the developed model. Adequate precision is defined as the ratio between signal to noise and for effective development of the polynomial model, the magnitude must be greater than 4. Here for both the responses, it was around 29.82 and 29.20, respectively, reflecting suitable navigation of the design [29].
Experimental data obtained here were analyzed using F-test and p-test to observe the consequence of the linear, interaction and quadratic model terms over the responses preselected here (CrI% and yield%). Table 4 and Table 5 summarize the ANOVA results obtained for CrI%, (y1) and yield%, (y2); respectively. It was observed based on the magnitude of the linear term that the ultrasonication power (x1) had a greater impact on CrI% rather than the time (x2) and temperature (x3) (Table 4). However, the yield% (y2) was mostly affected by temperature (x3) (Table 5).
Based on the values of F-test as illustrated by Table 4 and Table 5; both the regression models (Equations (2) and (3)) developed here were significant by considering a 5% confidence level. The probability p-values were less than 0.0001 which also ensures that the developed models were significant and confirms an acceptable fitness of the polynomial regression models as illustrated by Equations (2) and (3) with the actual experimental observation for each run (Table 2).
The analysis of variance test (ANOVA) observed from Table 4, shows that ultrasonication power (x1), time (x2), temperature (x3), and their interaction terms x1x2, x2x3 and x1x3 together with the quadratic terms of ( x 1 2 ) and ( x 3 2 ) were significant model terms. Ultrasonication power (x1) had played most influential role over the CrI% (y1) by showing the highest F-value of 444.77. However, time (x2) had least impact on CrI% (y1) compared to the other two factors of time (x2) and temperature (x3), as observed from F-values of Table 4. As illustrated by Table 5, ultrasonication power (x1), time (x2), temperature (x3), and their interaction terms x2x3 together with the quadratic terms of ( x 3 2 ) are significant model terms for CNWs yield% (y2). The F-values for temperature (x3) was 218.09 reflecting its prominent effect on yield% (y2) (Table 5). However, power (x1) and time (x2) had relatively less remarkable impact on yield% (y2) (Table 5) as observed from the magnitude of F-test. The interaction effect of power and time (x1x2 = 0.43) had negligible impact whereas power and temperature (x1x3 = 1.81) had reasonable impact on yield% of CNWs (y2). Time and temperature combined (x2x3) played a vital role for the yield% (y2) of CNWs.

3.3. Process Variables Optimization

For successful commercialization of finally extracted CNWs, both yield% and crystallinity index, CrI% should be maximum. Thus, the numerical optimization test was conducted for both the responses. The optimum condition thus obtained is listed in Table 6. The input variables of power (x1), time (x2) and temperature (x3) were kept within the range selected earlier (Table 1). The experiment was conducted under optimal condition. The analytical data obtained from experiments under optimum condition was compared with the predicted results as suggested by the software (Table 6). The percentage error between the predicted and actual/experimental results was determined. As observed from Table 6, the percentage error for both the responses obtained were negligible supporting suitability of the polynomial models developed earlier (Equations (2) and (3)) additionally.
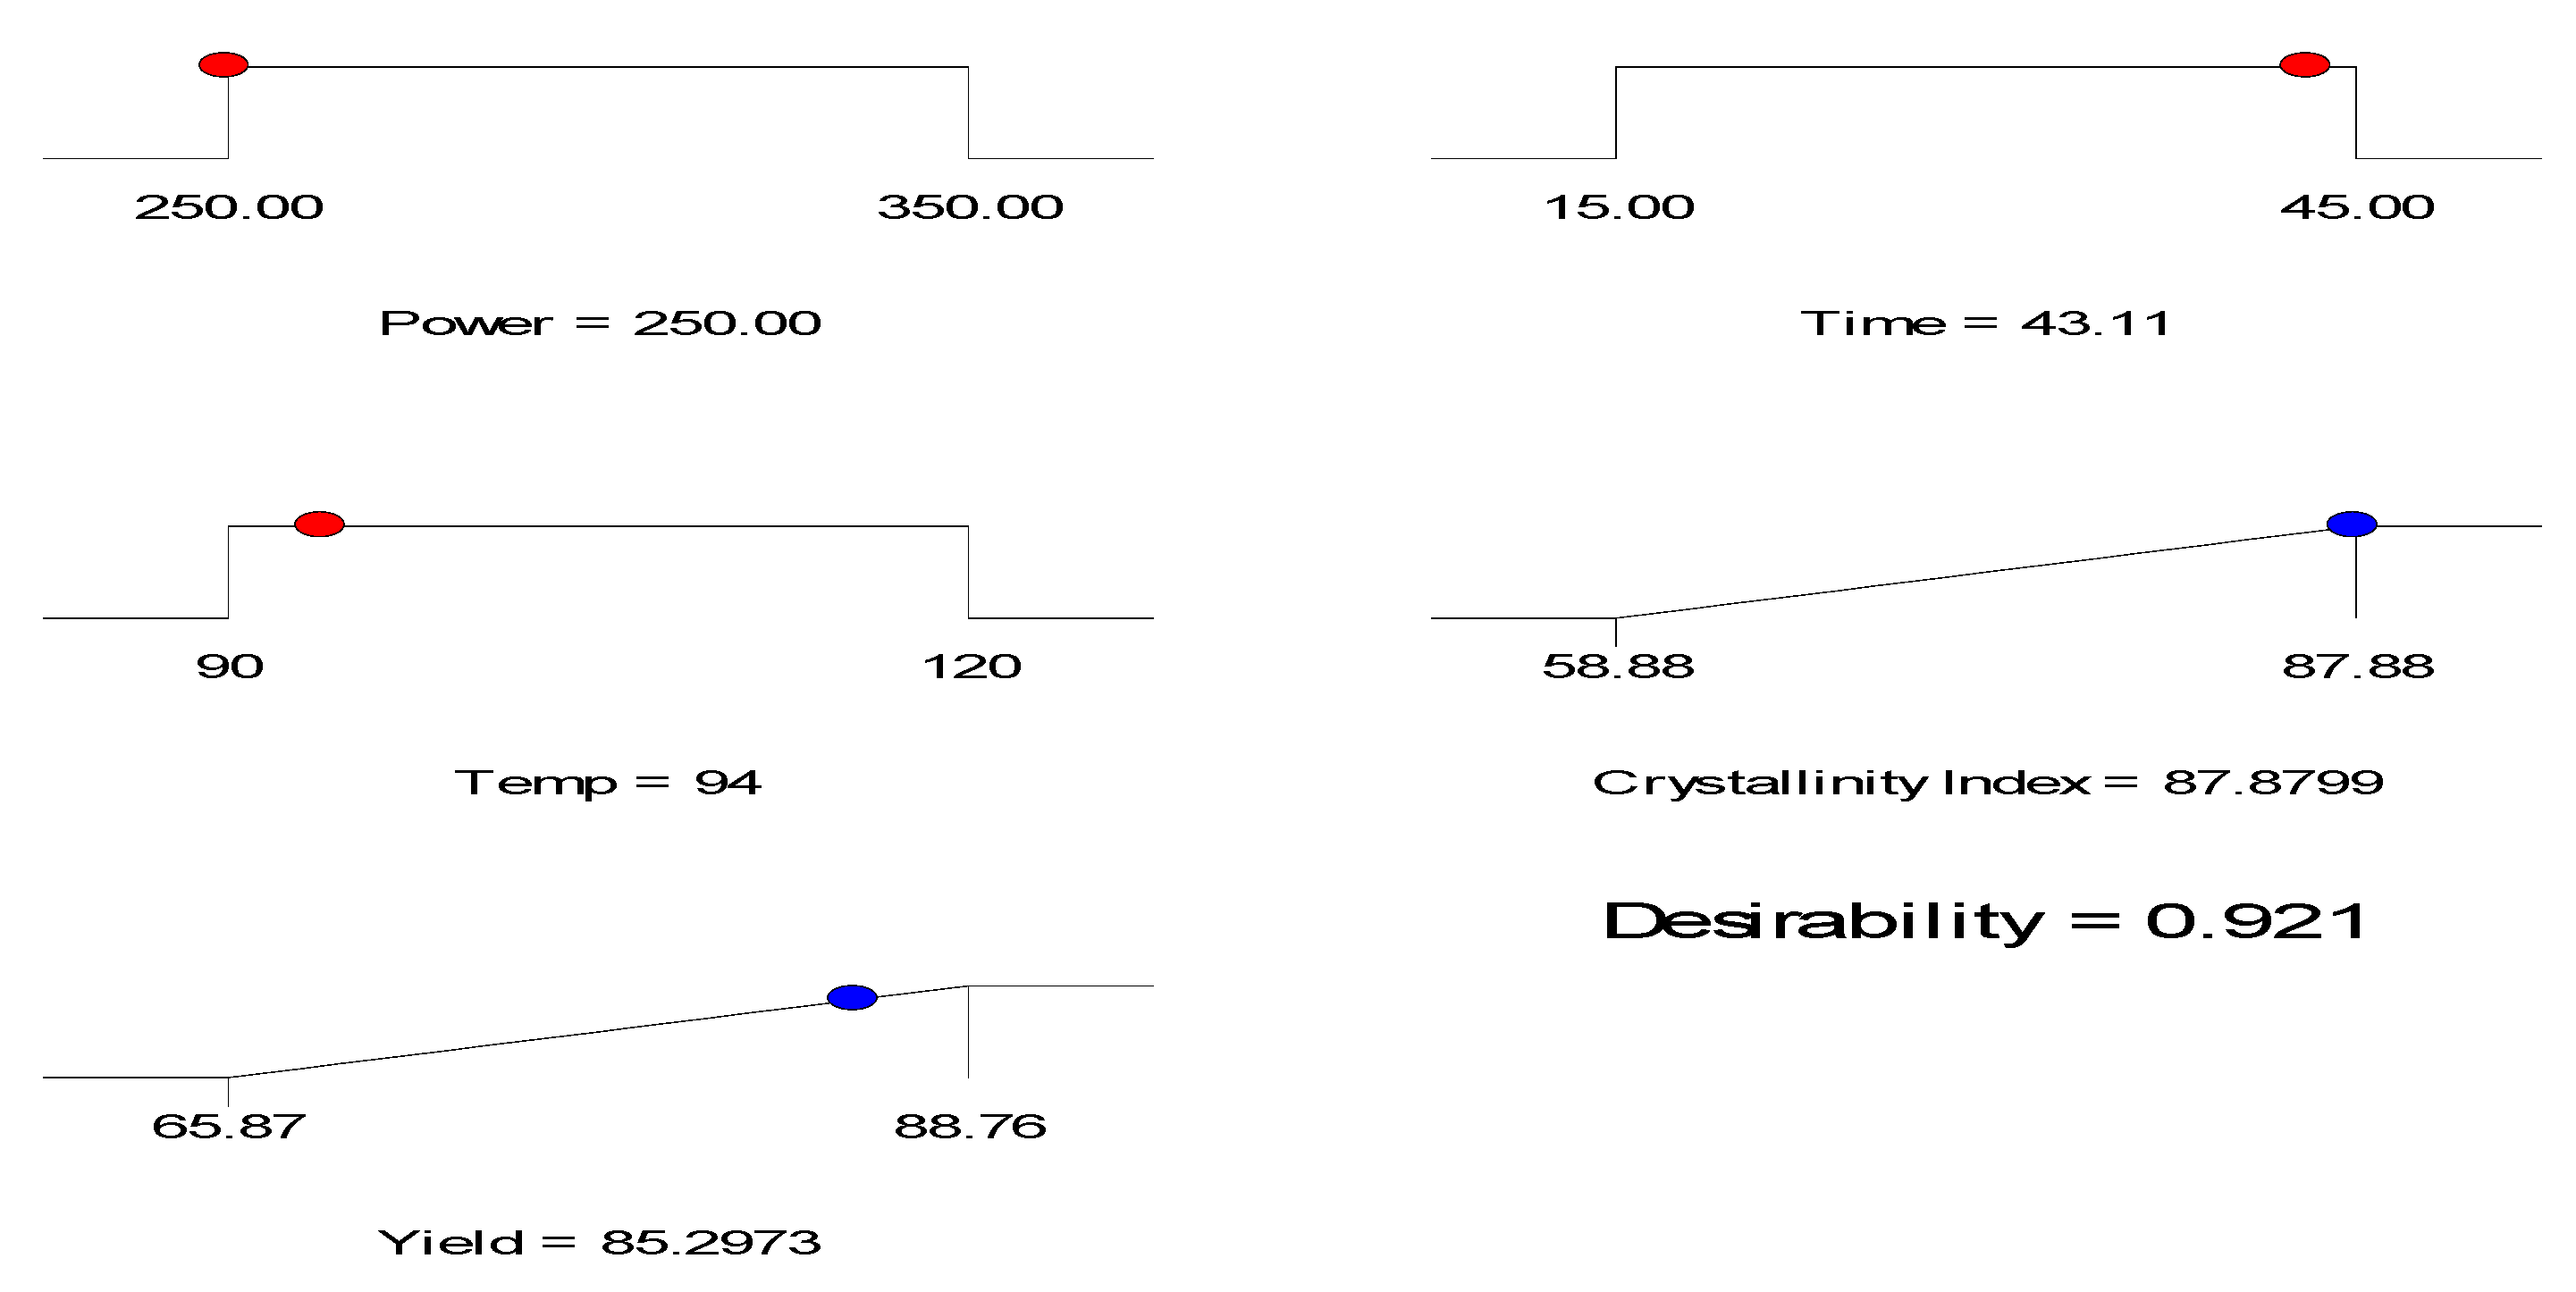
The optimization ramp is shown by Figure 3. The desirability value obtained was 0.921 reflecting reproducibility of the developed model (Equations (2) and (3)).

3.4. Effect of Process Variables for Synthesis of Cellulose Nano-Whiskers (CNWs)

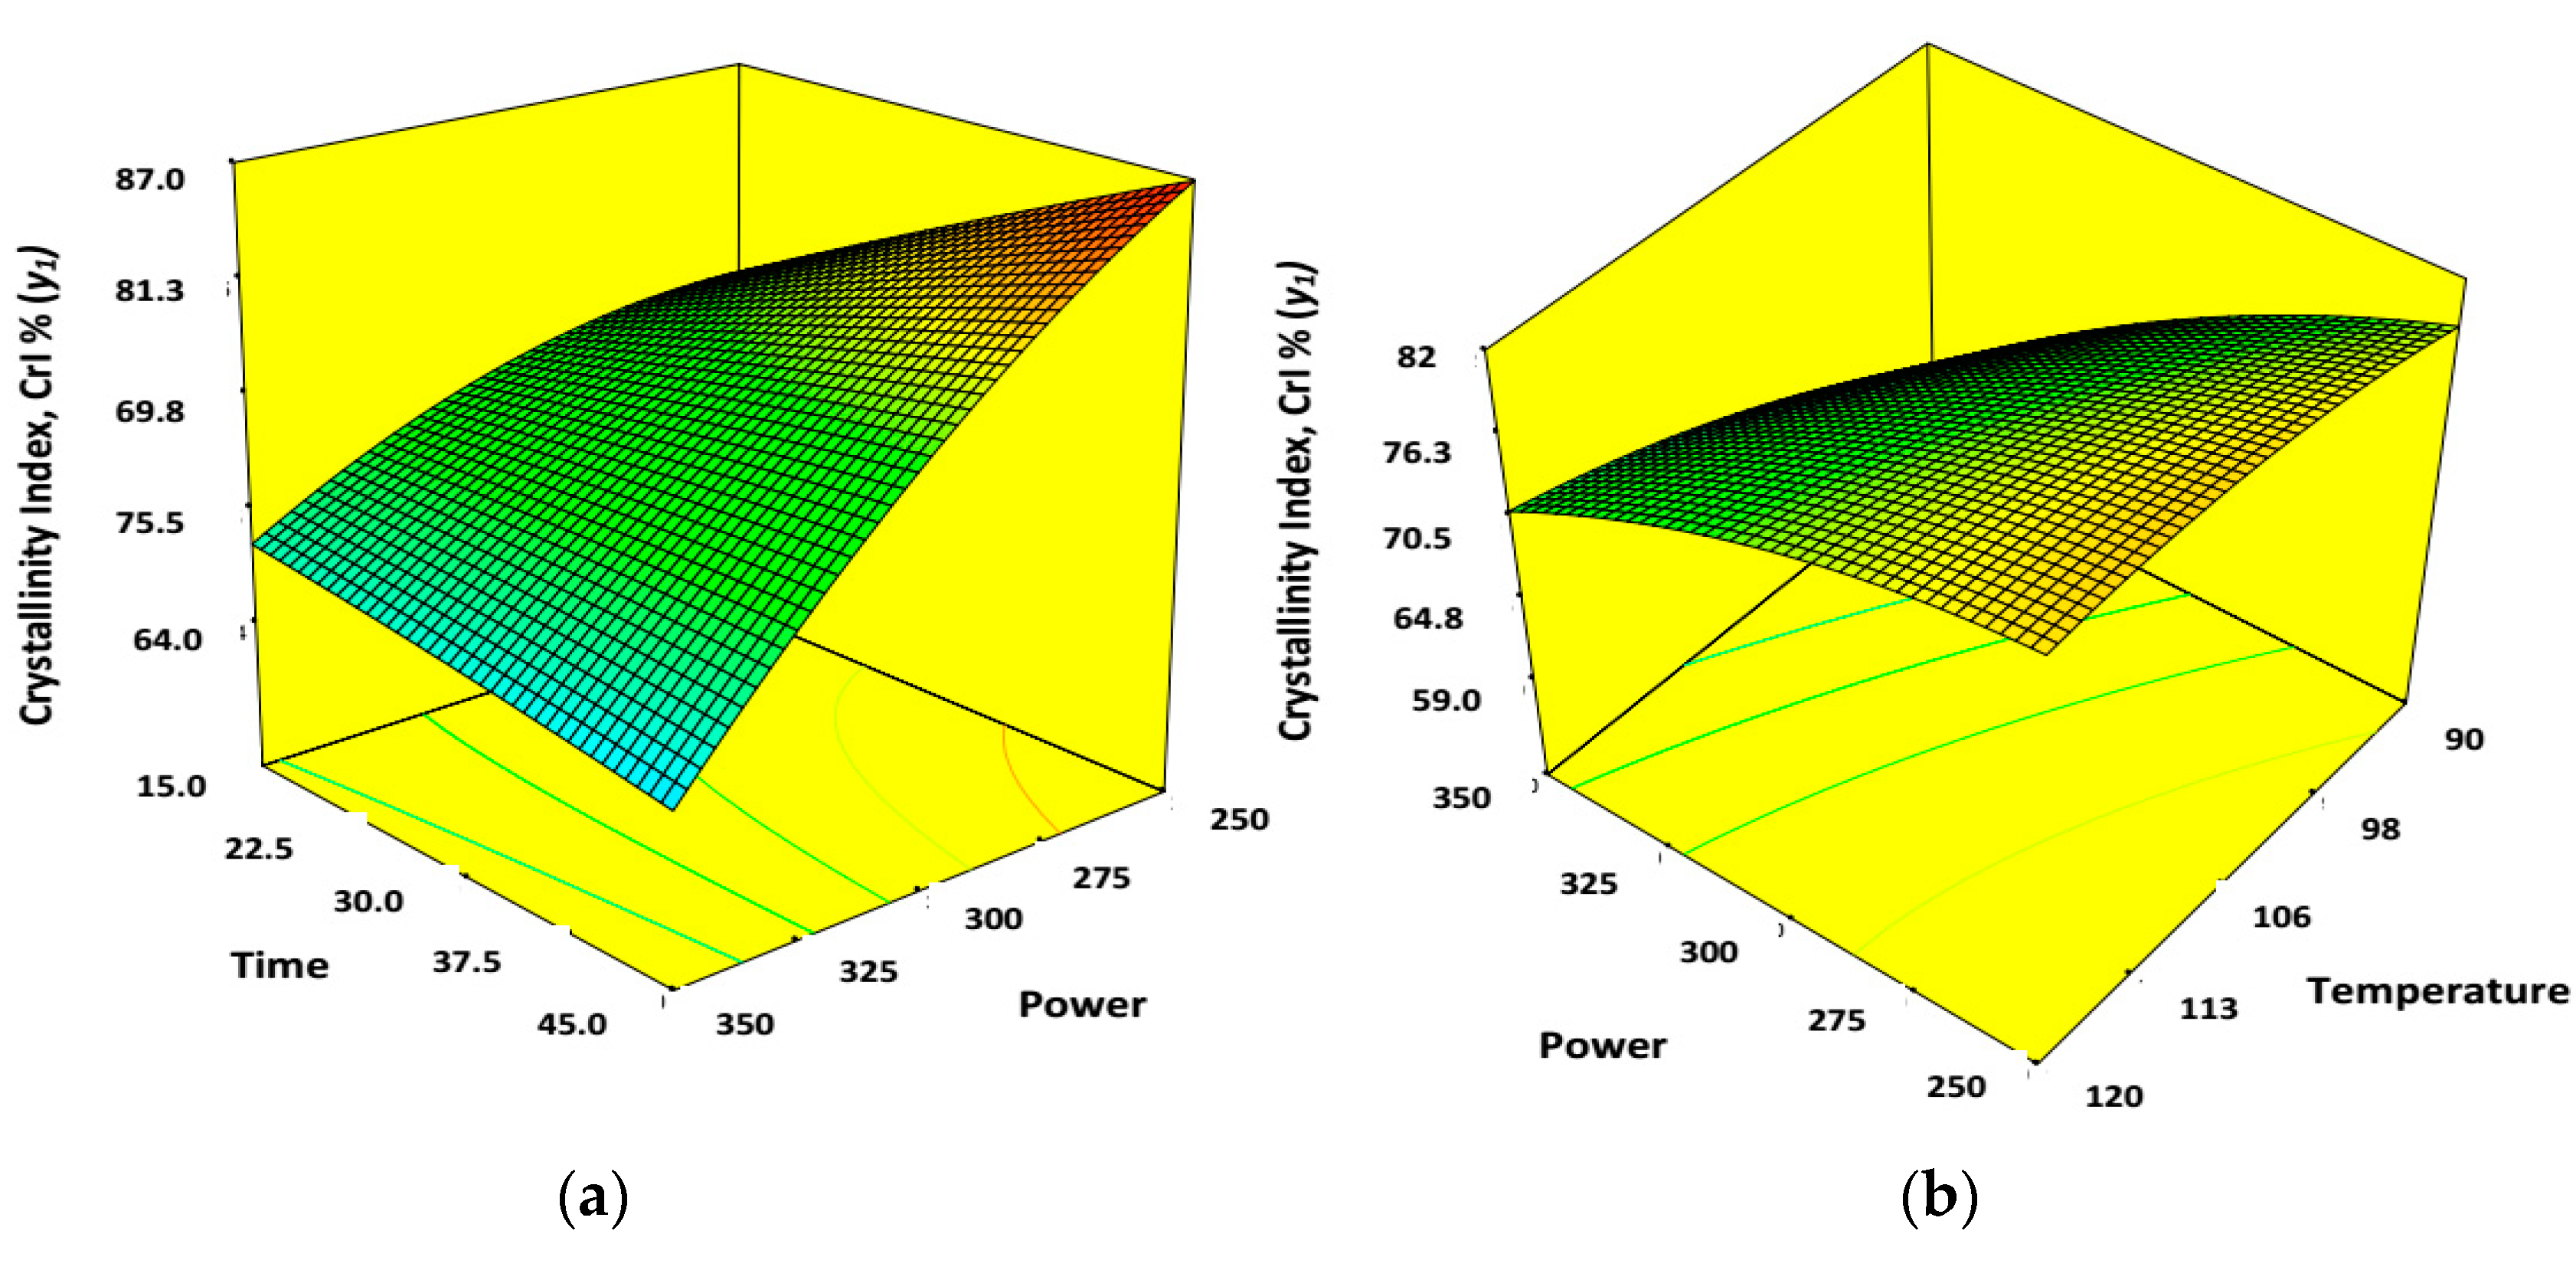
The cumulative effects of ultrasonication power (x1) and time (x2) on CrI% (y1) of finally extracted CNWs is illustrated by a 3D surface mesh with contour plots where the temperature (x3) was kept at center point, in other words constant at 105 °C (Figure 4a). Similarly, Figure 4b was constructed to observe the combined effect of power (x1) and temperature over (x3) the CrI% (y1) where the ultrasonication time (x2) was fixed at 30 min. Overall, the three process parameters used here for ultrasonication have substantial effect on CrI% (y1) as observed from the basic design matrix of Table 2. CrI% of extracted CNWs increased with successive increase of ultrasonication power (x1) and time (x2) in presence of ILs as hydrolyzing solvent (Figure 2a). This was anticipated as the enhancement of power (x1) with hydrolyzing time (x2) would increase the kinetic force of ILs and improve its diffusion rate inside the amorphous segment of cellulose. Enhancing power (x1) during ultrasonication would produce cavitation bubbles which would travel fast towards the interior region of cellulose and collapse there suddenly to initiate the disruption of intra- and intermolecular hydrogen bonds of cellulose. Extended ultrasonication time (x2) would facilitate the physical swelling of crude cellulose (AKL-4) obtained from the previous pretreatment process. Thus, more surface area would be exposed for ILs to enter and hydrolyze the amorphous domain resulting in higher crystallinity index (CrI%) of the finally extracted CNWs sample (AKL-5). Increasing the temperature up to a certain level increased the CrI% of the CNWs. In that case, viscosity of the ILs will be reduced and its solvation properties will be improved [16,17]. Due to reduction of viscosity, significant amount of IL molecules will be dissociated to give [Bmim]+ cations which can form complex with negative oxygen atom of –OH groups and form intermediate complexes [16]. Relatively higher temperature would reduce the viscosity of ILs which would subsequently increase the diffusion rate of them inside the compact cellulosic matrix [18]. The negative part of –HSO4 would interact with positive H+ ions. This would disintegrate the glycosidic bonds between the monosaccharide units of cellulose resulting in nano-dimensional cellulose having higher CrI% [16,17,18]. However, whenever the temperature was increased up to the maximum point of 120 °C at different power (x1) and time (x2); the crystallinity index dropped significantly. This happened due to excessive dissolution of cellulose and char formation [17,18].
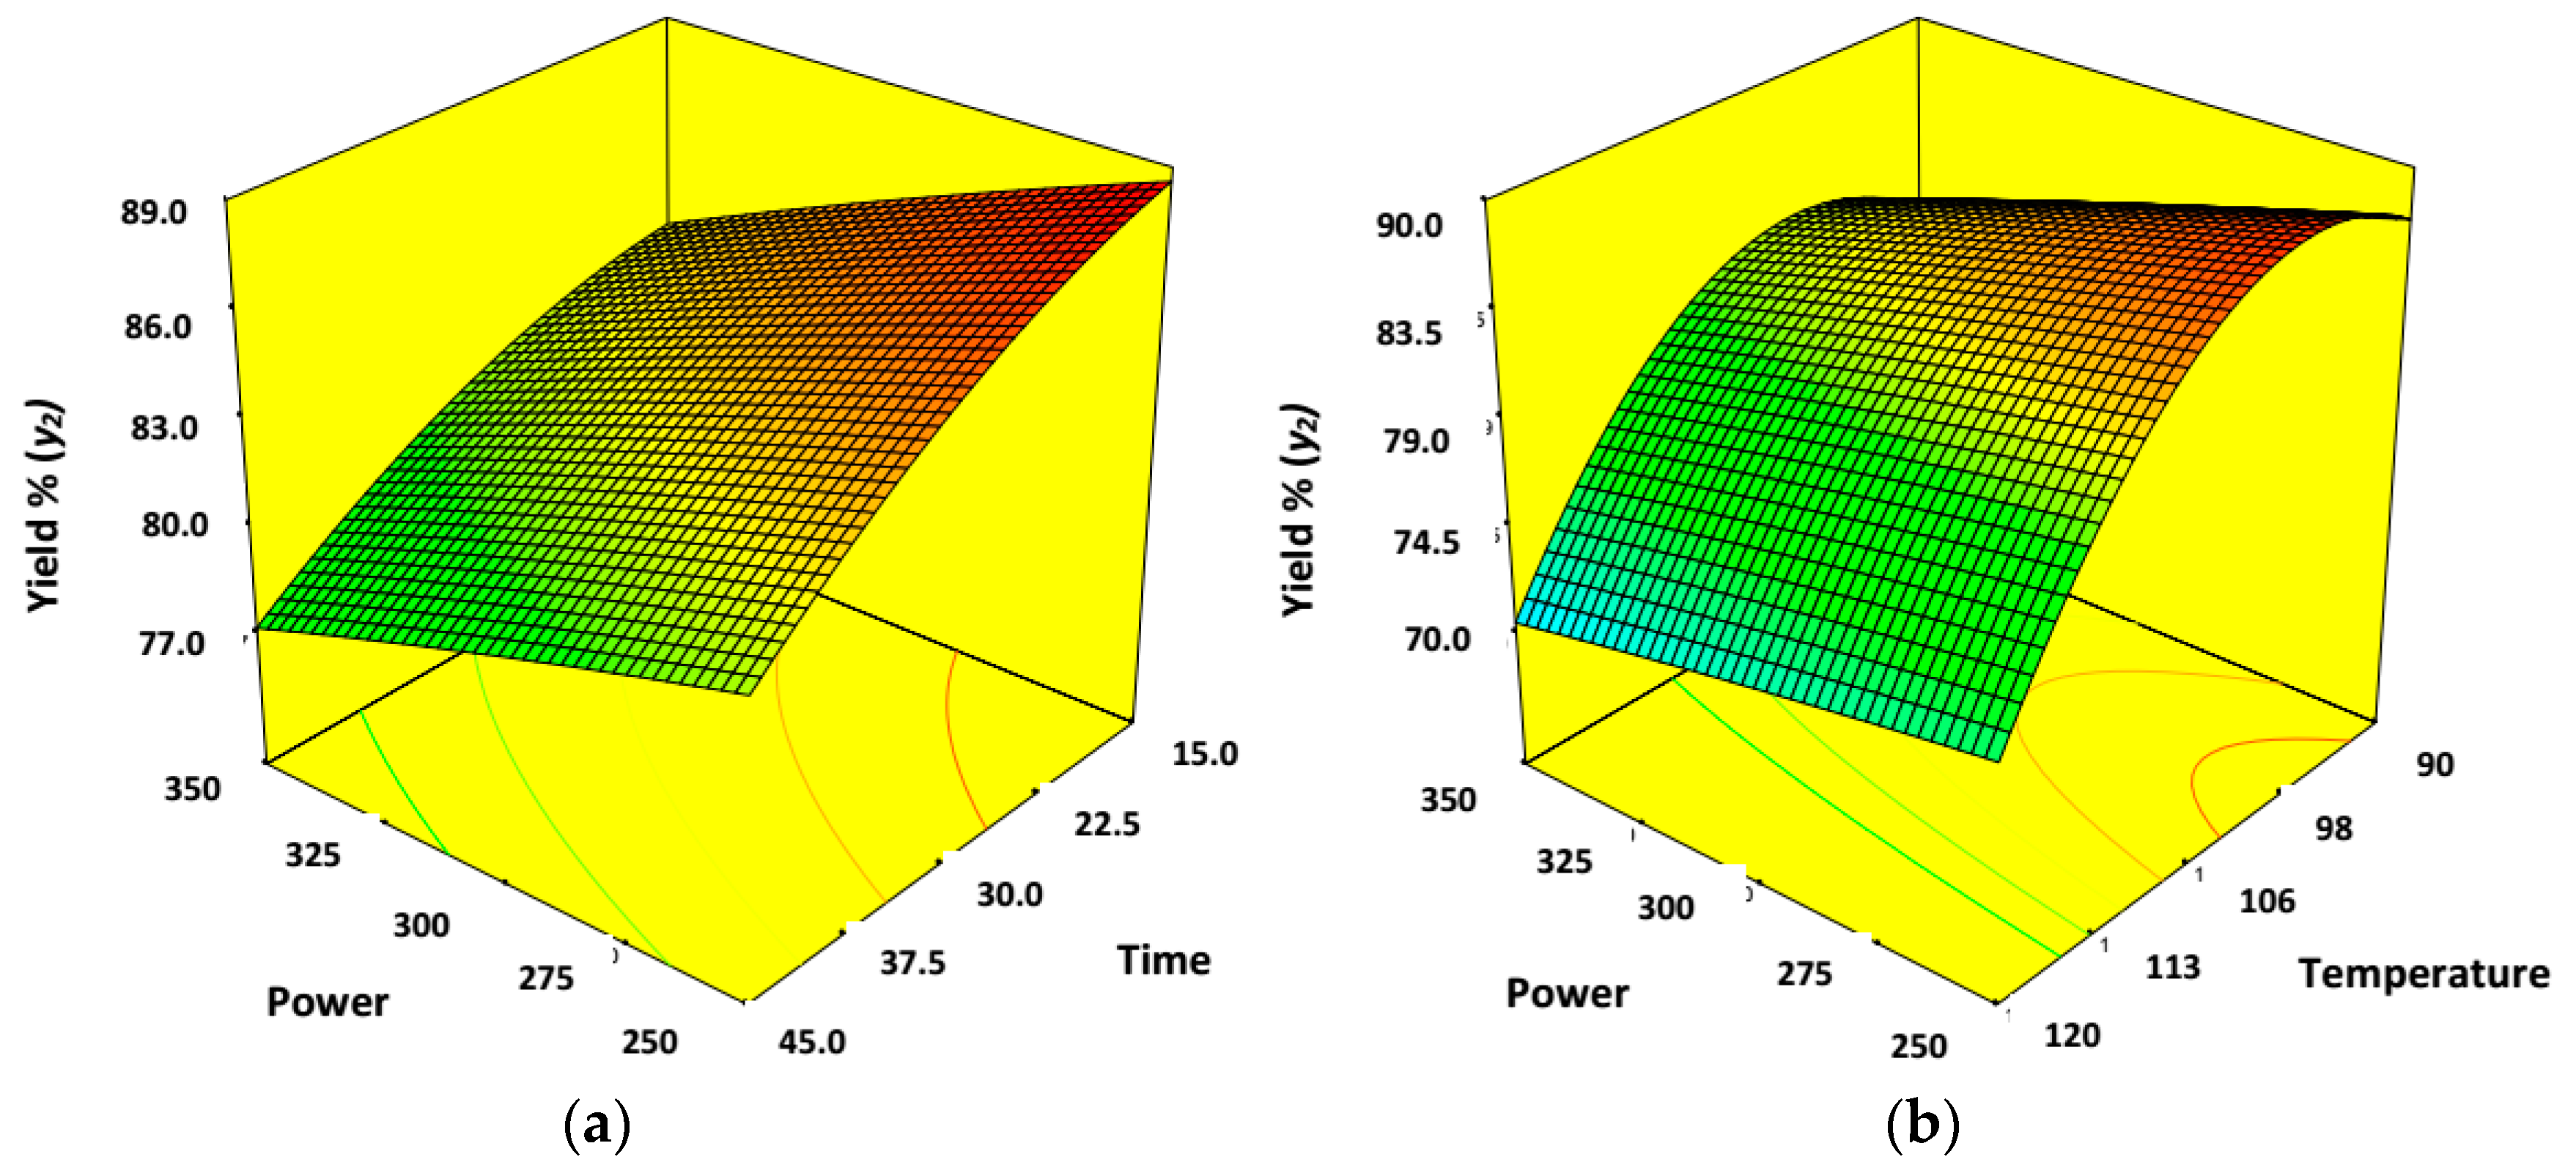
Figure 5a,b demonstrate the 3D response surface mesh with contour plots to exhibit the effect of process variables on CNWs yield% (y2). Figure 5a illustrates the collective effect of ultrasonication power (x1) and time (x2) on the yield% (y2) of the finally extracted CNWs where temperature (x3) was kept at fixed level of center point (105 °C). Figure 5b exhibits the effect of ultrasonication power (x1) and temperature (x3) over the yield% (y2), where ultrasonication time (x2) was fixed at center level (30 min). However, yield% (y2) of CNWs showed a decreasing trend with increasing power (x1), time (x2) and temperature (x3). Both the plots exhibited that (Figure 3a,b), temperature (x3) played most vital role for yield% (y2) whereas the other two variables of power (x1) and time (x2) had a relatively moderate impact on it. The yield% (y2) was lowest when power was maintained at 350 watts for time period of 45 min in presence of ILs at a maximum temperature of 120 °C (65.69%, Sample 7) as summarized by Table 2. This was evident due to dissolution of cellulose to other liquid fractions rather than forming solid fraction containing nanocellulose [1,29].

3.5. Characterizations

3.5.1. Surface Morphological Studies

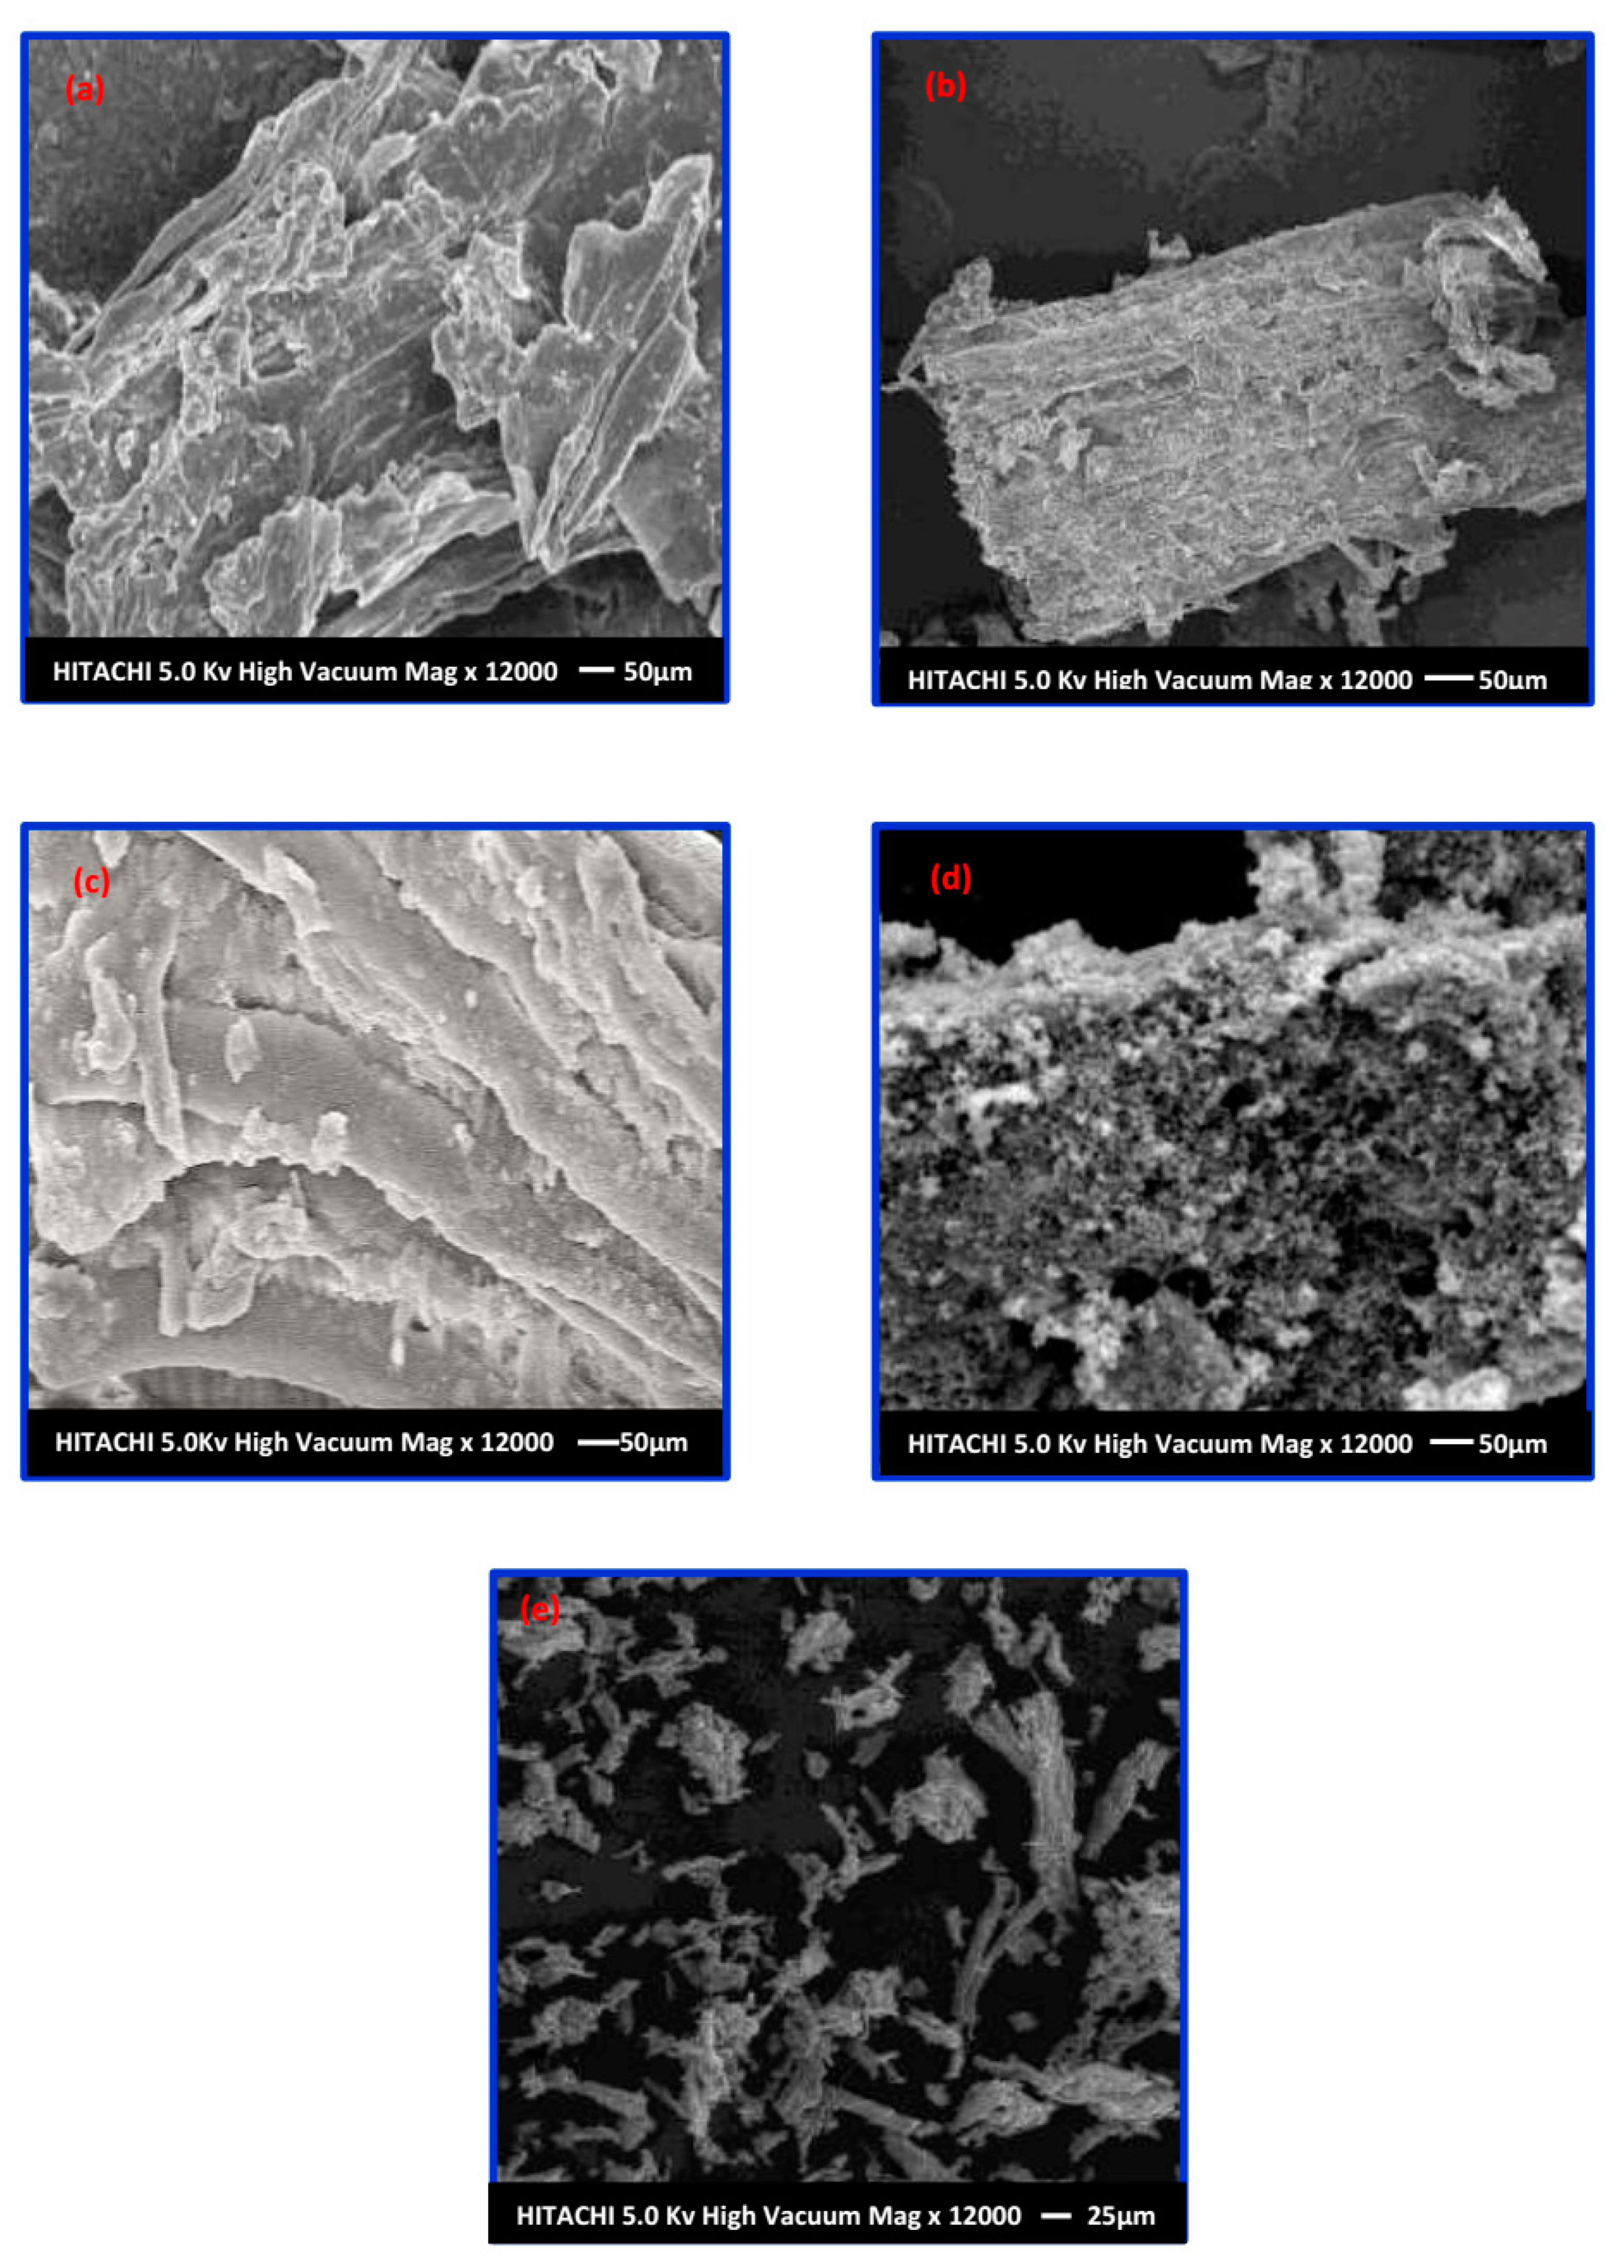
The surface morphological features of AKL-1, AKL-2, AKL-3, AKL-4 and AKL-5 samples are illustrated by Figure 6. The surface of AKL-1 was relatively even and smooth as there was a coating of pectin, wax, pigments, lignin, and hemicellulose over its surface (Figure 6a). After solvent extraction process, the smooth coating of pectin and wax was removed to obtain AKL-2 [28]. The surface of AKL-2 became rough and the sample contained some minor amounts of flakes or depositions (Figure 6b). Microwave heating in presence of KOH caused partial delignification and removed the residual lignin and hemicellulose fraction from AKL-2. Thus, the sample AKL-3 became uneven and to some extent, microfibrils were released from the compact binding of lignin (Figure 6c). Bleaching process had further removed the lignin and hemicellulose. Thus, long cellulosic strands were separated from each other, defragmented to smaller sizes and are visible in Figure 6d. At this stage, more micro-fibrillated cellulose was being released (AKL-4) [29,30].
After ultrasonication, the cavitation effect caused defibrillation as well as defragmentation via ruptures of intra-molecular and inter-molecular hydrogen bonding to obtain CNWs (AKL-5). However, the samples were aggregated after freeze drying and can be observed from FESEM images of AKL-5 (Figure 6e). The surfaces of AKL-4 and AKL-5 were eroded due to hydrolysis. The mechanical force of ultrasonication caused micro bubbles to form which moved with high speed and aided in defragmentation of the micro-fibers to nano size. The nano-dimensional sample thus obtained (CNWs) contained lot of –OH groups (AKL-5) and was found to be agglomerated after the drying process [29,30,31,32,33].
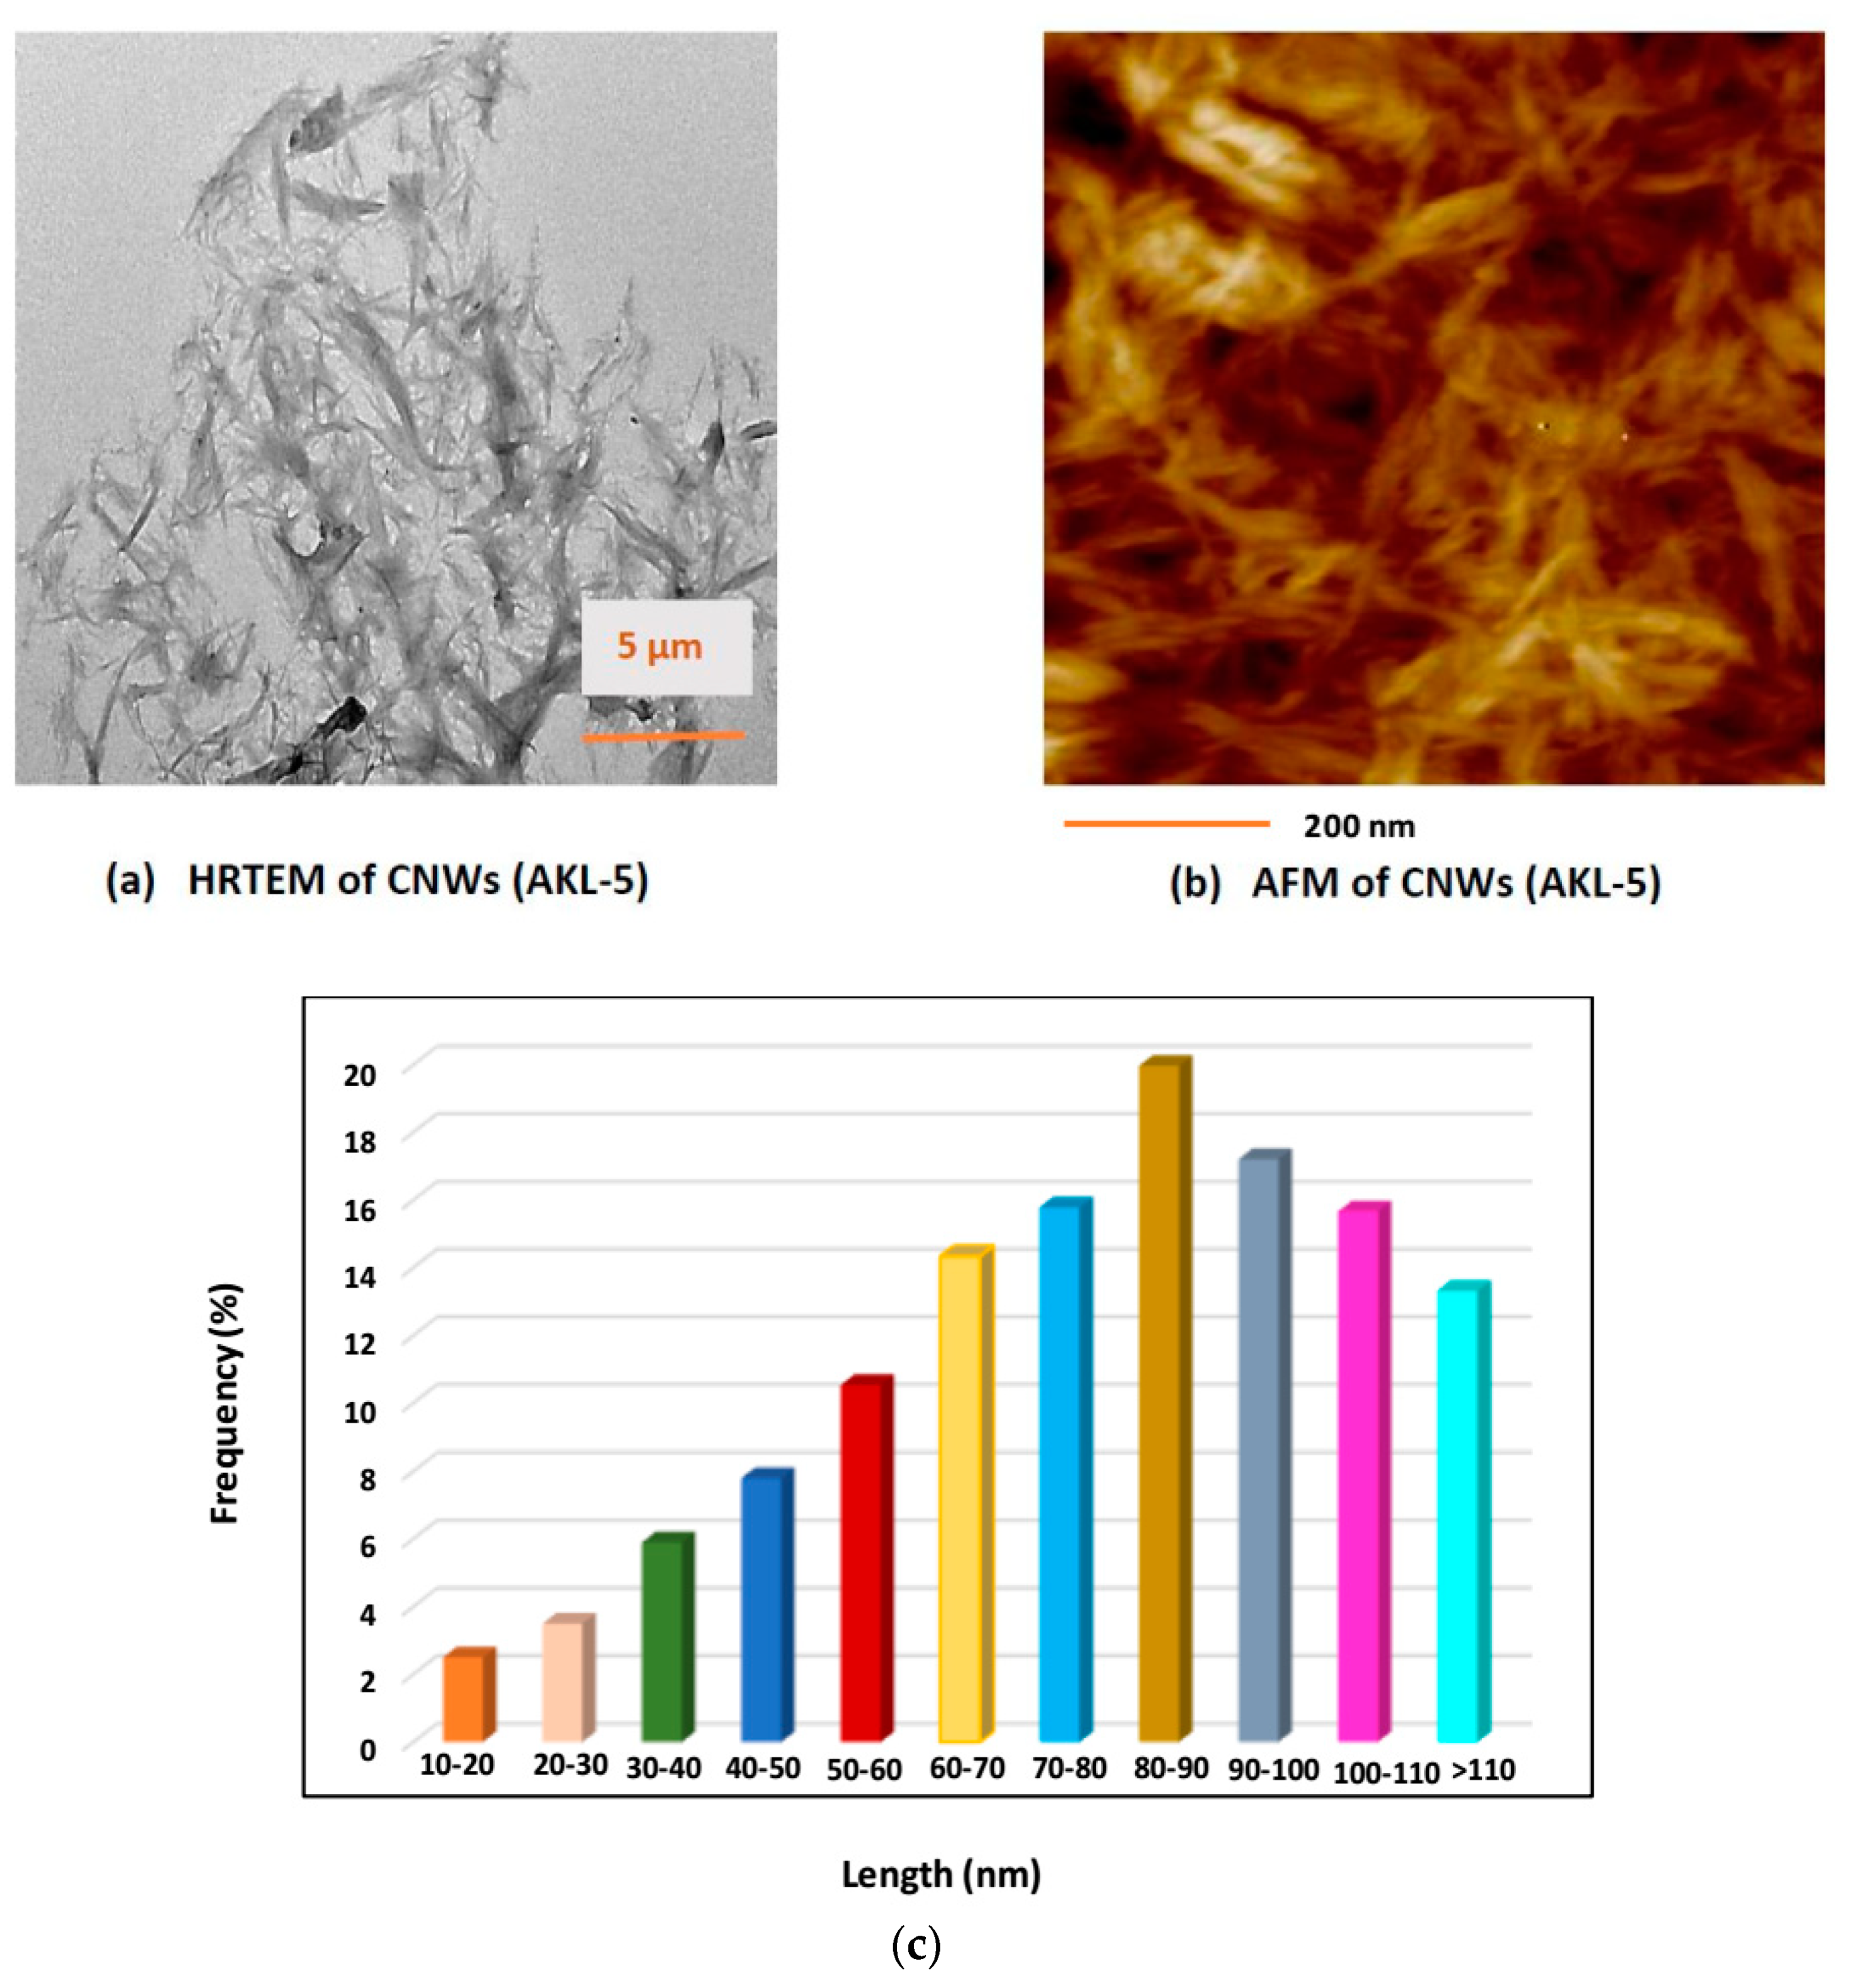
The HRTEM and AFM images after the ultrasonication process in presence of ILs were taken and shown by Figure 7. The CNWs obtained were needle-shaped and overlapping each other to form larger aggregates (Figure 7a). Microwave-assisted heating with KOH and subsequent peroxide bleaching process yielded crude cellulose which contained amorphous and crystalline domain. The anions and cations present in hydrolyzing medium have strong influence for dissolution of amorphous region of cellulose to obtain purified CNW crystals having high crystallinity index. During ultrasonication BmimHSO4 would form [Bmim]+ cations which would interact with the negative –OH groups of cellulose. The negative anions of [HSO4] would interact β-1-4 glycosidic bonds. The positive cations of the ILs have electron rich ᴫ system which could attack the negative oxygen atoms of β-1-4 glycosidic bonds [34]. This would cause disintegration of intra-molecular hydrogen bonding between two cellulosic chains. It would further initiate the rupture of β-1-4 glycosidic linkages inside the single, long chain of cellulose resulting defragmented, smaller CNW crystals [35,36]. Most of the CNW crystals finally obtained had the length of 80–110 nm and width of 15–20 nm (Figure 7c). The AFM images (Figure 7b) of AKL-5 clearly showed the presence of needle-shaped cellulosic nano crystal (CNWs) samples finally after ultrasonication at optimal condition [37].
The mechanical process of ultra-sonication leads to solvo-dynamic shear force, that is, the cavitation effect inside the hydrolyzing medium of ILs used here. Thus, lots of micro-bubbles are formed in presence of heat during ultrasonication. The growth of micro-bubbles increases with lapse of time and after a certain time, it collapses causing shock waves inside the hydrolyzing medium. This initiates the erosion as well as disintegration of micro-sized fiber to nano-size during the ultrasonication process [35,36,38].

3.5.2. XRD Analysis

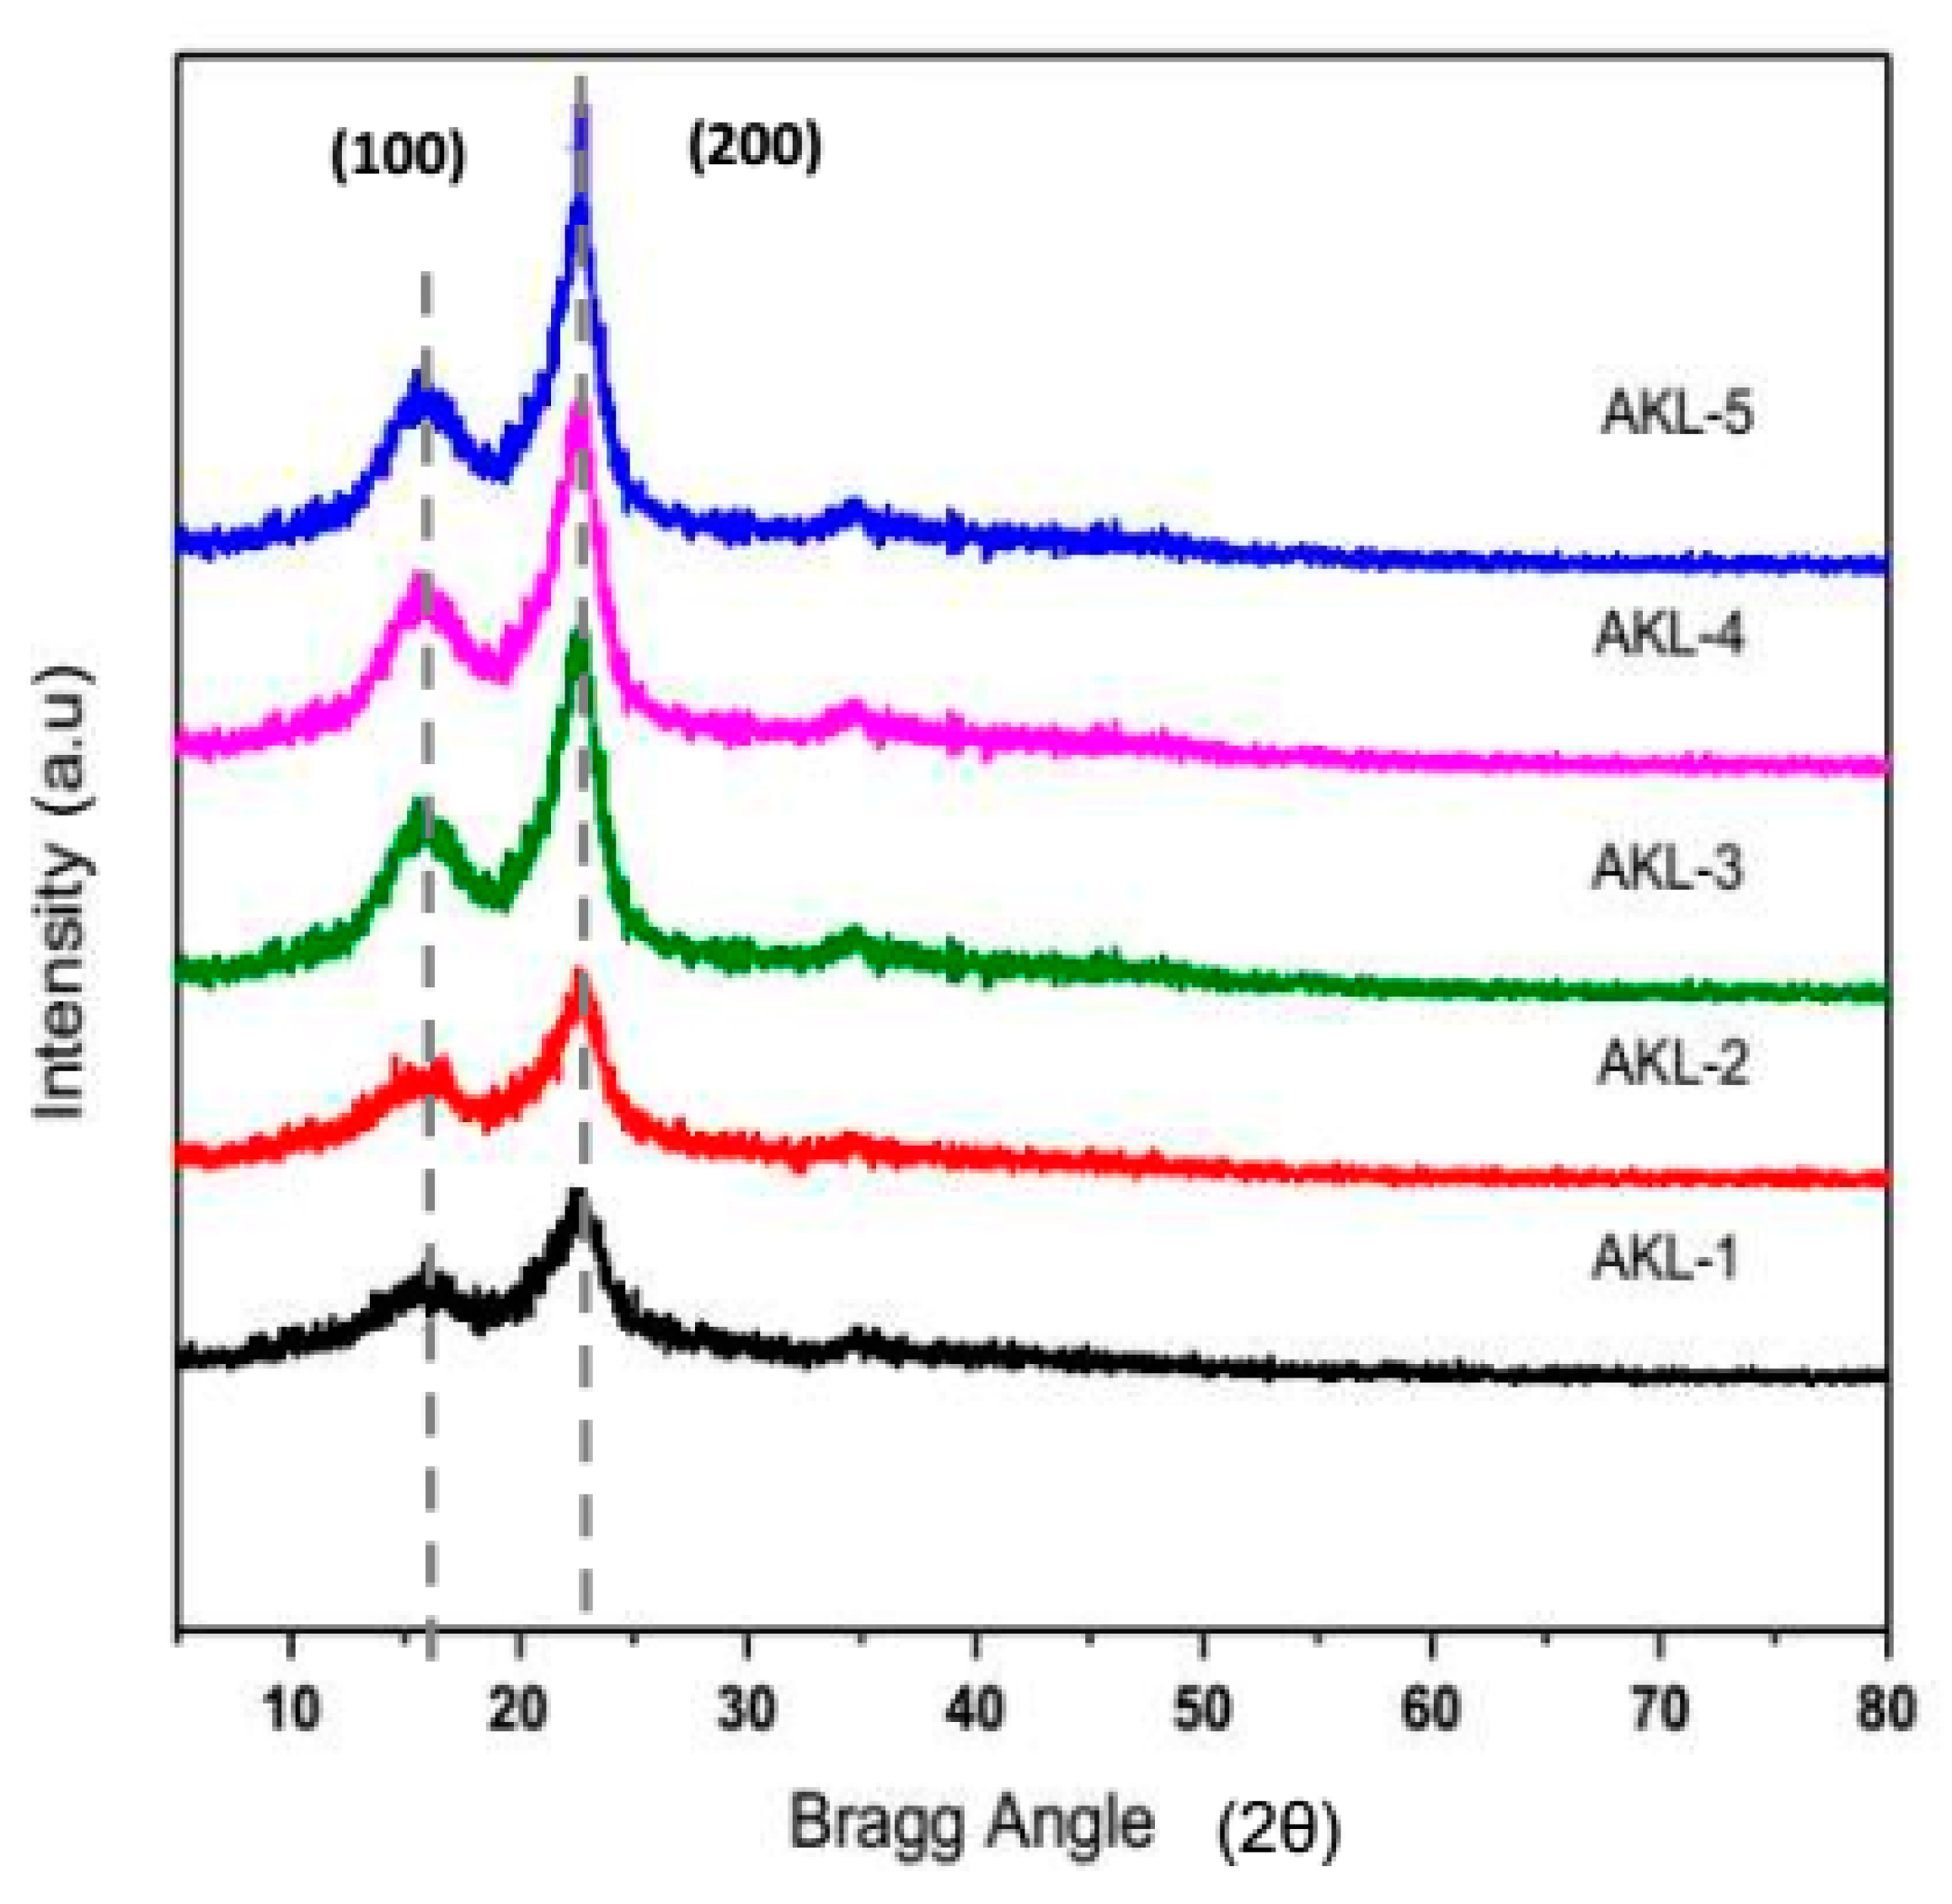
Figure 8 exhibits the XRD pattern of starting lignocellulosic residues (AK), solvent extracted, microwave-assisted KOH pretreated, bleached and ultrasonicated samples in presence of Bmim-HSO4 ILs under optimum condition. The crystallinity index along with the crystallite size of the extracted sample after each treatment step was calculated and the results obtained are summarized in Table 7.
It was observed that after each treatment the crystallinity index was increased subsequently but the crystallites sizes were reduced. Solvent extraction process had removed pectin, wax, pigments, etc. from untreated sample of AKL-1 to yield AKL-2 with negligible change in crystallinity index and crystallite sizes. KOH pretreatment using microwave heating, lignin, hemicellulose and amorphous regions of cellulose were partially degraded (AKL-3). Peroxide bleaching of AKL-3 sample further reduced the amount of lignin to yield AKL-4 where the amorphous region of cellulose was more exposed for selective hydrolysis during ultrasonication. After ultrasonication, in presence of Bmim-HSO4, ILs, the sample AKL-5 (CNWs) showed comparatively high crystallinity index with smaller crystallite size than the other samples. The cavitation effect of ultrasonication had initiated the removal of the intra-and intermolecular hydrogen bonds, releasing the micro fibrillated cellulosic fiber resulting in a higher crystallinity index than the untreated (AKL-1), solvent extracted (AKL-2), KOH treated (AKL-3) and bleached (AKL-4) samples.
All the XRD diffraction patterns showed two major peaks approximately at 2θ = 14° to 16° (110) and 22° to 24° (200) representing typical cellulose I structure [39,40]. The results demonstrated the presence of monoclinic crystalline cellulose having Iβ structure. It was reported earlier that cellulose I structure contains around 85 repetitive units β-D-glucopyranose molecules linked together by strong networking of intermolecular hydrogen bonds [41]. However, after ultrasonication in presence of ILs, the intra- and intermolecular hydrogen bonds will be broken, and the amorphous domain will be hydrolyzed to finally yield the cellulose nano-whiskers (CNWs) with a higher crystallinity index. Thus, a sharper peak at 2θ = 22–24° (200) was observed for the samples after being ultrasonicated in presence of ILs.

3.5.3. Thermogravimetric Analysis

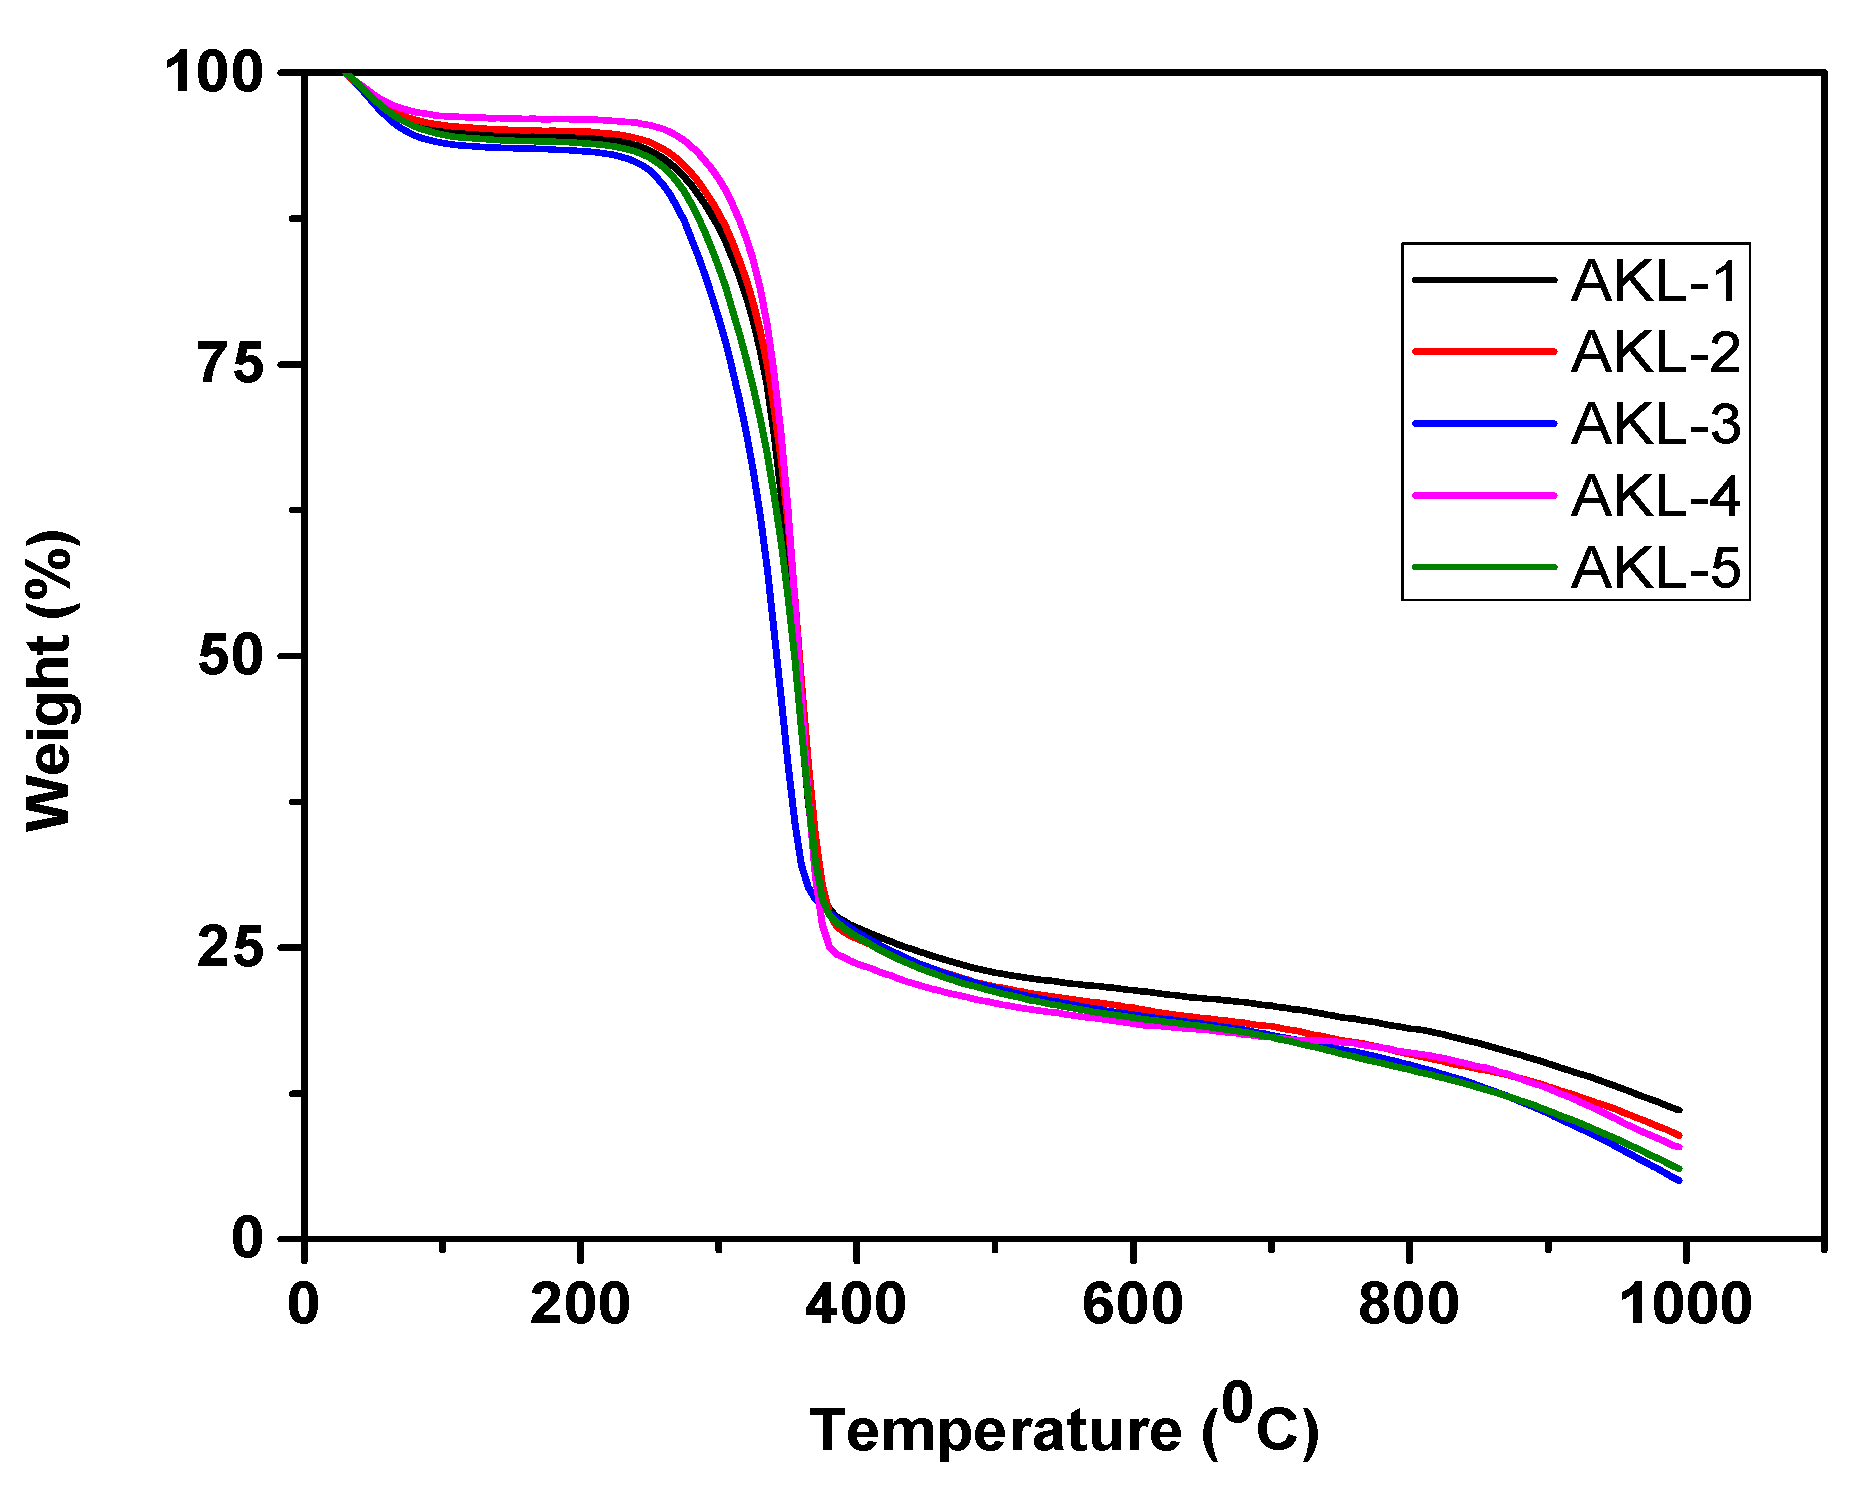
Thermogravimetric analyses of all the samples (AKL-1, AKL-2, AKL-3, AKL-4 and AKL-5) were carried out and are shown by Figure 9. The thermal stability of each sample changed after the consecutive steps of treatment. Thermal stability of the synthesized sample basically depends on the extent of lignin proportion and intra- and intermolecular hydrogen bonding present inside the lignocellulosic matrix of the biomass residues.
Initially all the samples lost some weight at temperature 100–120 °C which was due to the evaporation of adsorbed moisture. The first steps of weight loss observed for all the samples (AKL-1, AKL-2, AKL-3, AKL-4 and AKL-5) were 3.5%, 3.1%, 2.8%, 2.3% and 1.9%, respectively. During the second degradation step, around 76.74%, 80.68%, 81.31%, 83.26% and 85.02% of weight loss, respectively, were observed for all the samples (AKL-1, AKL-2, AKL-3, AKL-4 and AKL-5). After that, decomposition of cellulose, hemicellulose and residual lignin took place around the temperature range 230–370 °C. At a higher temperature range, around 300–400 °C, pyrolysis of cellulose mainly takes place [39]. The third degradation step is observed after that, and was recorded until 1000 °C. Lignin decomposition is relatively difficult, and it starts from 200 °C until 1000 °C. This is due to presence of high temperature resistant phenyl groups inside the lignin molecules.
Table 8 summarizes the major decomposition peak (DTGmax), crystallinity index, amount of char and weight loss for all the samples obtained here.
Table 8 illustrates that the thermal decomposition temperature of the synthesized cellulosic substrates was reduced after each treatment. This is obviously due to elimination of lignin as well as dissolution of hemicellulose from the lignocellulosic samples [1,29]. However, the IL-assisted ultrasonicated sample (AKL-5) showed lowest decomposition temperature compared to the other samples of AKL-1, AKL-2, AKL-3 and AKL-4. The mechanical force of ultrasonication with the application of ILs was able to defibrillate the crude cellulose sample obtained after the bleaching (AKL-4) process. Presence of acidic ILs during the ultrasonication process would further enhance the breaking of intra-molecular hydrogen bond to release the microfiber and convert it to nano size by disrupting the intermolecular hydrogen bonds as well. Thus, the finally extracted CNWs (AKL-5) sample would have a larger number of free ends of chain, resulting lower thermal stability [40,41,42]. The amount of char was maximum for untreated AKL-1 sample reflecting the presence of hemicellulose and lignin inside the cellulosic fiber. However, after the successive treatment of solvent extraction would reduce the amount of pectin and wax from AKL-1. Microwave heating in presence of KOH and bleaching would decompose the hemicellulose and lignin fraction from the starting sample of AKL-1 to yield AKL-3 and AKL-4, respectively. Thus AKL-3 and AKL-4 would have lower char residues. The mechanical force of ultrasonication would further reduce the trace amount of lignin present in AKL-4 and would partially hydrolyze the amorphous segment of cellulosic chain to obtain the sample of AKL-5 having cellulose nano-whiskers (CNWs) with high crystallinity index. The combined force of mechanical treatment (ultrasonication) and chemical (ionic liquid, IL) hydrolyzing medium would enhance defibrillation and defragmentation of long cellulosic chains by disrupting the intra- and intermolecular hydrogen bonds, respectively. The sample AKL-5 thus obtained will have lower amount of char residues. Similar observation was reported earlier for extracting nano-cellulosic fiber from sisal fiber and pulp derived from sugar beet [30,43].

3.5.4. Surface Functional Groups Analysis

FTIR spectroscopic analysis was carried out to observe the surface functional groups of starting lignocellulosic residues of AKL-1 and other samples of AKL-2, AKL-3, AKL-4 and AKL-5 after each treatment. All the samples used here had some common peaks which were almost similar [28,34,44]. The absorbance peak around 3400–3300 cm−1 represented the stretching of –OH groups [9]. The presences of –OH groups in cellulosic materials enable them to form different kinds of intra-and intermolecular hydrogen bonding between the different cellulosic strands and each cellulosic chain, respectively [45]. The stretching of –CH functional groups was visible in all the samples around 2900–2800 cm−1 [46]. Peaks around 1620–1650 cm−1 were related to O–H bending vibrations which showed the presence of absorbed moisture in all the samples [47]. The minor peaks obtained around 1420–1450 cm−1 showed the intermolecular hydrogen bonding in C-6 groups of cellulosic substrates [44]. Peaks around 1510 to 1530 cm−1 exhibited the presence of aromatic ring vibration in AKL-1, AKL-2 and AKL-3. In AKL-4 and AKL-5, the peak disappeared showing complete elimination of lignin from the synthesized sample. The bending vibration of –CH groups as well as presence of –CO groups were visible for all the samples in the range 1320–1380 cm−1 [44]. All the samples contained the peaks around 1045 cm−1 reflecting the presence of C–O–C stretching vibration of pyranose ring and glycosides linkages between two monosaccharaides units of cellulose [48]. The peaks around 800–900 cm−1 typically represented the cellulosic chain which can be ascribed to β-glycosidic linkages between glucose units in cellulosic chain [44]. During microwave-induced heating, the alkali acts as microwave energy absorber and initiates easy penetration of solvent inside the cellulosic substrates. Thus, partial dissolution of hemicellulose and lignin takes place due to uniform heating process of microwaves. This makes the surface area of AKL-3 more accessible for the peroxide bleaching process which initiates the defibrillation process. Therefore, in AKL-3 and AKL-4, more micro- and nano-fibrillated fiber were released, which was supported earlier by our FESEM images. Table 9 summarizes the major peaks with their frequency regions usually observed for ligno-cellulosic biomass and the micro- and nano-dimensional cellulose extracted from them.

3.5.5. Surface Charge Analysis

Zeta potential analysis was carried out for the samples (AKL-3, AKL-4, AKL-5). It was observed that the surface charge of the synthesized samples was increasing after each consecutive treatment. Initially the ligno-cellulosic residue (AKL-1) was covered with pectin and wax and the cellulosic matrix was embedded inside the lignin molecules. Thus, for sample AKL-1 and AKL-2, zeta potential values were not measured. However, after KOH pre-treatment, delignification was carried out partially and a fractional amount of cellulosic chain was released containing negative –OH groups over its surface (AKL-3) exhibiting zeta potential values of −19.56 mV. After bleaching, more micro-fibrillated fiber was further released from compact binding of lignin. Thus, more negative-OH groups were exposed resulting in higher zeta potential values (AKL-4) of −23.54 mV. Finally extracted CNWs sample (AKL-5) showed the highest zeta potential value of –29.9 mV. This is expected as ultrasonication in presence of ILs caused disruption of intra- and intermolecular hydrogen bonding of long cellulosic chains, leading to the formation of milky, white, colloidal suspension of CNWs (AKL-5) containing defragmented smaller versions of cellulosic chain having lots of –OH groups [42]. The strong mechanical force of ultrasonication and acidic hydrolyzing medium of [Bmim]HSO4 ILs had initiated the defibrillation as well as defragmentation of long cellulosic chain resulting CNWs [28,37]. Thus, more negative –OH groups were exposed resulting higher zeta potential values [49,50].

4. Conclusions

Ultrasonication in presence of ILs can effectively extract CNWs with high crystallinity index after the microwave-assisted delignification and bleaching of the dried leaves of Adansonia kilima (AK). Presence of ILs under optimum condition of ultrasonication can selectively degrade the amorphous domain of crude cellulose obtained from AK. Application of ILs can enhance the crystallinity index of CNWs up to a satisfactory level. X-ray crystallographic analysis demonstrated that the CrI% (y1) was increasing with successive decrease in particle size of the synthesized sample. HRTEM and AFM images showed development of needle like CNWs. Highly negative zeta potential values of finally extracted sample (AKL-5) clearly reflected higher density of –OH groups over the defragmented nano-sized crystals (CNWs). The experimental design matrix was made based on Box–Behnken (BBD) design and ultrasonication variables were optimized. CrI% (y1) was influenced mostly by ultrasonication power (x1) and temperature (x3), whereas ultrasonication time (x2) had a moderate impact on it. On the other hand, yield% (y2) was affected more prominently by temperature (x3) and time (x2) rather than the power (x1) itself. Model validation with analysis of variance (ANOVA) test was carried out to check the adequacy of the proposed polynomial Equations (2) and (3). Theoretical optimization to obtain maximum CrI% (y1) and yield% (y2) was done. The suggested values by the software for CrI% (y1) and yield% (y1) were very close with the actual ones illustrating negligible error percentages of 1.61% and 1.30% for both the responses, respectively. The findings of this research revealed that the BBD design using mathematical modeling and statistical analysis concurrently is appropriate for detecting and optimizing the input variables influencing the IL-assisted ultrasonic extraction process of CNWs from the delignified, dried leaves of Adansonia kilima (AK) plants.

Author Contributions

Z.Z.C. conceived and designed the experiments. A.J., K.K., O.A. have performed the experiment. The data was analyzed by Z.Z.C., M.M.R. and M.A.N.A.H., Y.A.W. and M.R.B.J. has provided all reagents and chemicals support. I.A.B., T.M.Y.K., G.A.A. and S.K. had contributed for manuscript editing, publication charges and characterizations. Z.Z.C., R.R.R.C., M.A. and A.J. had compiled the results and written the paper. R.R.R.C and G.A.A. had calculated particle size distribution and provided the software to analyze the data.

Funding

The authors extend their appreciation to the Deanship of Scientific Research at King Khalid University for funding this work through a research groups program under grant number R.G.P. 2/11/39. The research was also conducted under 17AET-RP44C under Dr. Zaira Zaman Chowdhury as Principal Investigator from University of Malaya, Malaysia.

Acknowledgments

The authors are thankful for the funding provided by Grant Number R.G.P. 2/11/39 from King Khalid University and RP044C-17AET University of Malaya, Malaysia. The authors are also grateful for using the testing lab facilities of RMIT University, Australia, Universiti Utara Malaysia, Malaysia and Nanotechnology & Catalysis Research Center, University of Malaya, Malaysia.

Conflicts of Interest

The authors declare no conflict of interest.

References

  1. Abd Hamid, S.B.; Chowdhury, Z.Z.; Karim, M.Z. Catalytic Extraction of Microcrystalline Cellulose (MCC) from Elaeis guineensis using Central Composite Design (CCD). BioResources 2014, 9, 7403–7426. [Google Scholar] [CrossRef]
  2. Ma, Y.; Xia, Q.; Liu, Y.; Chen, Y.; Liu, S.; Wang, Q.; Liu, Y.; Li, J.; Yu, H. Production of Nanocellulose Using Hydrated Deep Eutectic Solvent Combined with Ultrasonic Treatment. ACS Omega 2019, 4, 8539–8547. [Google Scholar] [CrossRef] [PubMed]
  3. Ravindran, L.; Sreekala, M.S.; Thomas, S. Novel processing parameters for the extraction of cellulose nanofibers (CNF) from environmentally benign pineapple leaf fibres (PALF): Structure-property relationships. Int. J. Biol. Macromol. 2019, 131, 858–870. [Google Scholar] [CrossRef] [PubMed]
  4. Vanitjinda, G.; Nimchua, T.; Sukyai, P. Effect of xylanase-assisted pretreatment on the properties of cellulose and regenerated cellulose films from sugarcane bagasse. Int. J. Biol. Macromol. 2019, 122, 503–516. [Google Scholar] [CrossRef] [PubMed]
  5. Mangalam, A.P.; Simonsen, J.; Benight, A.S. Cellulose/DNA hybrid nanomaterial. Biomacromolecules 2009, 10, 497–504. [Google Scholar] [CrossRef] [PubMed]
  6. Mendez, J.D.; Weder, C. Synthesis, electrical properties, and nanocomposites of poly (3, 4-ethylenedioxythiophene) nanorods. Polym. Chem. 2010, 1, 137–1244. [Google Scholar] [CrossRef]
  7. Zhou, C.; Wu, Q.; Yue, Y.; Zhang, Q. Application of rod-shaped cellulose nanocrystals in polyacrylamide hydrogels. J. Colloid Interface Sci. 2011, 353, 116–123. [Google Scholar] [CrossRef] [PubMed]
  8. Chen, W.; Yu, H.; Liu, Y.; Chen, P.; Zhang, M.; Hai, Y. Individualization of Cellulose Nanofibers from Wood using High Intensity Ultrasonication Combined with Chemical Pretreatments. Carbohydr. Polym. 2011, 83, 1804–1811. [Google Scholar] [CrossRef]
  9. Khalil, H.P.S.A.; Davoudpour, Y.; Nazrul Islam, M.; Mustapha, A.; Sudesh, K.; Dungani, R.; Jawaid, M. Production and Modification of Nanofibrillated Cellulose using Various Mechanical Processes: A Review. Carbohydr. Polym. 2014, 99, 649–665. [Google Scholar] [CrossRef]
  10. Jiang, F.; Hsieh, Y.-L. Chemically and Mechanically Isolated Nanocellulose and Their Self-Assembled Structures. Carbohydr. Polym. 2013, 95, 32–40. [Google Scholar] [CrossRef]
  11. Meng, X.; Pu, Y.; Yoo, C.G.; Li, M.; Bali, G.; Park, D.Y.; Gjersing, E.; Davis, M.F.; Muchero, W.; Tuskan, G.A.; et al. An In-Depth Understanding of Biomass Recalcitrance using Natural Poplar Variants as the Feedstock. ChemSusChem 2017, 10, 39–150. [Google Scholar] [CrossRef] [PubMed]
  12. Li, N.; Li, Y.; Yoo, C.G.; Yang, X.; Lin, X.; Ralph, J.; Pan, X. An Uncondensed Lignin Depolymerized in the Solid State and Isolated from Lignocellulosic Biomass: A Mechanistic Study. Green Chem. 2018, 20, 4224–4235. [Google Scholar] [CrossRef]
  13. Xu, J.; Hou, H.; Liu, B.; Hu, J. The integration of different pretreatments and ionic liquid processing of eucalyptus: hemicellulosic products and regenerated cellulose fibers. Ind. Crop. Prod. 2017, 101, 11–20. [Google Scholar] [CrossRef]
  14. Liu, Z.; Sun, X.; Hao, M.; Huang, C.; Xue, Z.; Mu, T. Preparation and characterization of regenerated cellulose from ionic liquid using different methods. Carbohydr. Polym. 2015, 117, 99–105. [Google Scholar] [CrossRef] [PubMed]
  15. Chen, J.; Xu, J.; Wang, K.; Qian, X.; Sun, R. Highly thermostable, flexible, and conductive films prepared from cellulose, graphite, and polypyrrole nanoparticles. ACS Appl. Mater. Interfaces 2015, 7, 15641–15648. [Google Scholar] [CrossRef] [PubMed]
  16. Mao, J.; Heck, B.; Reiter, G.; Laborie, M.P. Cellulose nanocrystals’ production in near theoretical yields by 1-butyl-3-methylimidazolium hydrogen sulfate ([Bmim]HSO4)–mediated hydrolysis. Carbohydr. Polym. 2015, 117, 443–451. [Google Scholar] [CrossRef] [PubMed]
  17. Tian, D.; Han, Y.; Lu, C.; Zhang, X.; Yuan, G. Acidic ionic liquid as “quasi-homogeneous” catalyst for controllable synthesis of cellulose acetate. Carbohydr. Polym. 2014, 113, 83–90. [Google Scholar] [CrossRef]
  18. Jin, Z.; Wang, S.; Wang, J.; Zhao, M. Effects of plasticization conditions on the structures and properties of cellulose packaging films from ionic liquid [BMIM] Cl. J. Appl. Polym. Sci. 2012, 125, 704–709. [Google Scholar] [CrossRef]
  19. Chen, W.S.; Yu, H.P.; Liu, Y.X. Preparation of millimetre- long cellulose I nanofibers with diameters of 30–80 nm from bamboo fibers. Carbohydr. Polym. 2011, 86, 453–461. [Google Scholar] [CrossRef]
  20. Chen, W.S.; Yu, H.P.; Liu, Y.X.; Hai, Y.F.; Zhang, M.X.; Chen, P. Isolation and characterization of cellulose nanofibers from four plant cellulose fibers using a chemical-ultrasonic process. Cellulose 2011, 18, 433–442. [Google Scholar] [CrossRef]
  21. Cheng, Q.Z.; Wang, S.Q.; Han, Q.Y. Novel process for isolating fibrils from cellulose fibres by high-intensity ultra-sonication. II. Fibril characterization. J. Appl. Polym. Sci. 2010, 115, 2756–2762. [Google Scholar] [CrossRef]
  22. Cheng, Q.; Wang, S.Q.; Rials, T.G. Poly (vinyl alcohol) nanocomposites reinforced with cellulose fibrils isolated by high intensity ultrasonication. Compos Part A. Appl. Sci. 2009, 40, 218–224. [Google Scholar] [CrossRef]
  23. Wang, S.Q.; Cheng, Q.Z. A novel process to isolate fibrils from cellulose fibers by high intensity ultrasonication part 1: process optimization. J. Appl. Polym. Sci. 2011, 113, 1270–1275. [Google Scholar] [CrossRef]
  24. Sun, Y.; Cheng, J. Hydrolysis of Lignocellulosic materials for Ethanol Production: A Review. Bioresour. Technol. 2002, 83, 1–11. [Google Scholar] [CrossRef]
  25. Chowdhury, Z.; Zain, S.; Khan, R.; Ahmad, A.; Islam, M.; Arami-Niya, A. Application of central composite design for preparation of Kenaf fiber based activated carbon for adsorption of manganese (II) ion. Int. J. Phys. Sci. 2011, 6, 7191–7202. [Google Scholar] [CrossRef]
  26. Chowdhury, Z.Z.; Zain, S.M.; Khan, R.A.; Arami-Niya, A.; Khalid, K. Process variables optimization for preparation and characterization of novel adsorbent from Lignocellulosic Waste. Bioresources 2012, 7, 3732–3754. [Google Scholar]
  27. Agbor, V.B.; Cicek, N.; Sparling, R.; Belin, A.; Levin, D.B. Biomass Pretreatment: Fundamental towards Application. Biotechnol. Adv. 2011, 29, 675–685. [Google Scholar] [CrossRef]
  28. Mazlita, Y. Catalytic Synthesis of Nanocellulose from Oil Palm Empty Fruit Bunch Fiber. Master’s Thesis, University of Malaya, Kuala Lumpur, Malaysia, 2016. [Google Scholar]
  29. Karim, Md. Z.; Chowdhury, Z.Z.; Abd Hamid, S.B.; Ali, E.M. Statistical Optimization for Acid Hydrolysis of Microcrystalline Cellulose and Its Physiochemical Characterization by Using Metal Ion Catalyst. Materials 2014, 7, 6982–6999. [Google Scholar] [CrossRef]
  30. Li, W.; Wang, R.; Liu, S. Nanocrystalliline cellulose prepared from softwood craft pulp via ultrasonic assisted acid hydrolysis. Bioresources 2011, 6, 4271–4281. [Google Scholar]
  31. Abraham, E.; Deepa, B.; Pothan, L.A.; Jacob, M.; Thomas, S.; Cvelbar, U.; Anand, R. Extraction of Nanocellulosic fibers from lignocellulosic fibers: A novel approach. Carbohydr. Polym. 2011, 86, 1468–1475. [Google Scholar] [CrossRef]
  32. Jiang, F.; Hsieh, Y.L. Controlled defibrillation of rice straw cellulose nanofibrills into highly crystalline fibrous materials. RSC Adv. 2013, 3, 12366–12375. [Google Scholar] [CrossRef]
  33. Holmes, J.; Lassi, U. Ionic Liquids in Pretreatment of Lignocellulosic Biomass in Ionic Liquids Application and Perspectives; Intech Open: London, UK, 2011; pp. 545–560. ISBN 978-953-307-248-7. [Google Scholar]
  34. Han, J.; Zhou, C.; French, A.D.; Han, G.; Wu, Q. Characterizations of cellulose II nanoparticles regenerated from 1-butyl-3methylimidazolium chloride. Carbohydr. Polym. 2013, 94, 773–781. [Google Scholar] [CrossRef] [PubMed]
  35. Moon, R.J.; Martini, A.; Narin, J.; Simonsen, J.; Youngblood, J. Cellulose nanoparticles review: Structure, Properties and Nanocomposites. Chem. Soc. Rev. 2011, 40, 3941–3994. [Google Scholar] [CrossRef] [PubMed]
  36. Tischer, P.C.S.F.; Sierakowski, M.R.; Westfahl, H.; Tischer, C.A. Nanostructural Reorganization of Bacterial Cellulose by Ultrasonic Treatment. Biomacromolecules 2010, 11, 1217–1224. [Google Scholar] [CrossRef] [PubMed]
  37. Abd Hamid, S.B.; Chowdhury, Z.Z.; Karim, M.Z.; Ali, M.E. Catalytic Isolation and Physicochemical Propertiesof Nanocrystalline Cellulose(NCC) using HCl-FeCl3System Combined with Ultrasonication. BioResources 2016, 11, 3840–3855. [Google Scholar] [CrossRef]
  38. Tang, A.M.; Zhang, H.; Chen, G.; Xie, G.; Liang, W.Z. Influence of ultrasound treatment on accessibility and Region-selective oxidation reactivity of cellulose. Ultrason. Sonochem. 2005, 12, 467–472. [Google Scholar]
  39. Chowdhury, Z.Z.; Abd Hamid, S.B. 'Preparation and Characterization of Nanocrystalline Cellulose Using Ultrasonication Combined with a Microwave-Assisted Pretreatment Process. BioResources 2016, 11, 3397–3415. [Google Scholar] [CrossRef]
  40. Nishiyama, Y.; Sugiyama, J.; Chanzy, H.; Langan, P. Crystal structure and hydrogen bonding system in cellulose I from synchrotron X-ray and neuron fiber diffraction. J. Am. Chem. Soc. 2003, 125, 14300–14306. [Google Scholar] [CrossRef]
  41. Lu, Q.; Lin, W.; Tang, L.; Wang, S.; Chen, X.; Huang, B. A mechanochemical approach to manufacturing bamboo cellulose nanocrystals. J. Mater. Sci. 2015, 50, 611–619. [Google Scholar] [CrossRef]
  42. Deepa, B.; Eldho, A.; Nerieda, C.; Miran, M.; Mathew, A.P.; Oksman, K.; Faria, M.; Thomas, S.; Pothan, L.A. Utilization of various lignocellulosic biomass for the production of nanocellulose: A comparative study. Cellulose 2015, 22, 1075–1090. [Google Scholar] [CrossRef]
  43. Li, M.; Wang, L.; Li, D.; Cheng, Y.; Adhikari, B. Preparation and characterizations of cellulose nanofiber from depectinized sugar beet pulp. Carbohydr. Polym. 2014, 102, 136–143. [Google Scholar] [CrossRef] [PubMed]
  44. Johar, N.; Ahmad, I.; Dufresne, A. Extraction, preparation and characterization of cellulose fibres and nanocrystals from rice husk. Ind. Crops Prod. 2012, 37, 93–99. [Google Scholar] [CrossRef]
  45. Habibi, Y.; Lucia, L.A.; Rojas, O.J. Cellulose nanocrystals: chemistry, self-assembly, and applications. Chem. Rev. 2010, 110, 3479–3500. [Google Scholar] [CrossRef] [PubMed]
  46. Chirayil, C.J.; Mathew, L.; Thomas, S. Review of recent research in nano cellulose preparation from different lignocellulosic fibers. Rev. Adv. Mater. Sci. 2014, 37, 20–28. [Google Scholar]
  47. Mandal, A.; Chakrabarty, D. Isolation of nanocellulose from waste sugarcane bagasse (SCB) and its characterization. Carbohydr. Polym. 2011, 86, 1291–1299. [Google Scholar] [CrossRef]
  48. Maiti, S.; Jayaramudu, J.; Das, K.; Reddy, S.M.; Sadiku, R.; Ray, S.S.; Liu, D. Preparation and characterization of nano-cellulose with new shape from different precursor. Carbohydr. Polym. 2013, 98, 562–567. [Google Scholar] [CrossRef] [PubMed]
  49. Zhao, D.; Li, H.; Zhang, J.; Fu, L.; Liu, M.; Fu, J.; Ren, P. Dissolution of cellulose in phosphate-based ionic liquids. Carbohydr. Polym. 2012, 87, 1490–1494. [Google Scholar] [CrossRef]
  50. Guo, J.; Guo, X.; Wang, S.; Yin, Y. Effects of ultrasonic treatment during acid hydrolysis on the yield, particle size and structure of cellulose nanocrystals. Carbohydr. Polym. 2016, 135, 248–255. [Google Scholar] [CrossRef]
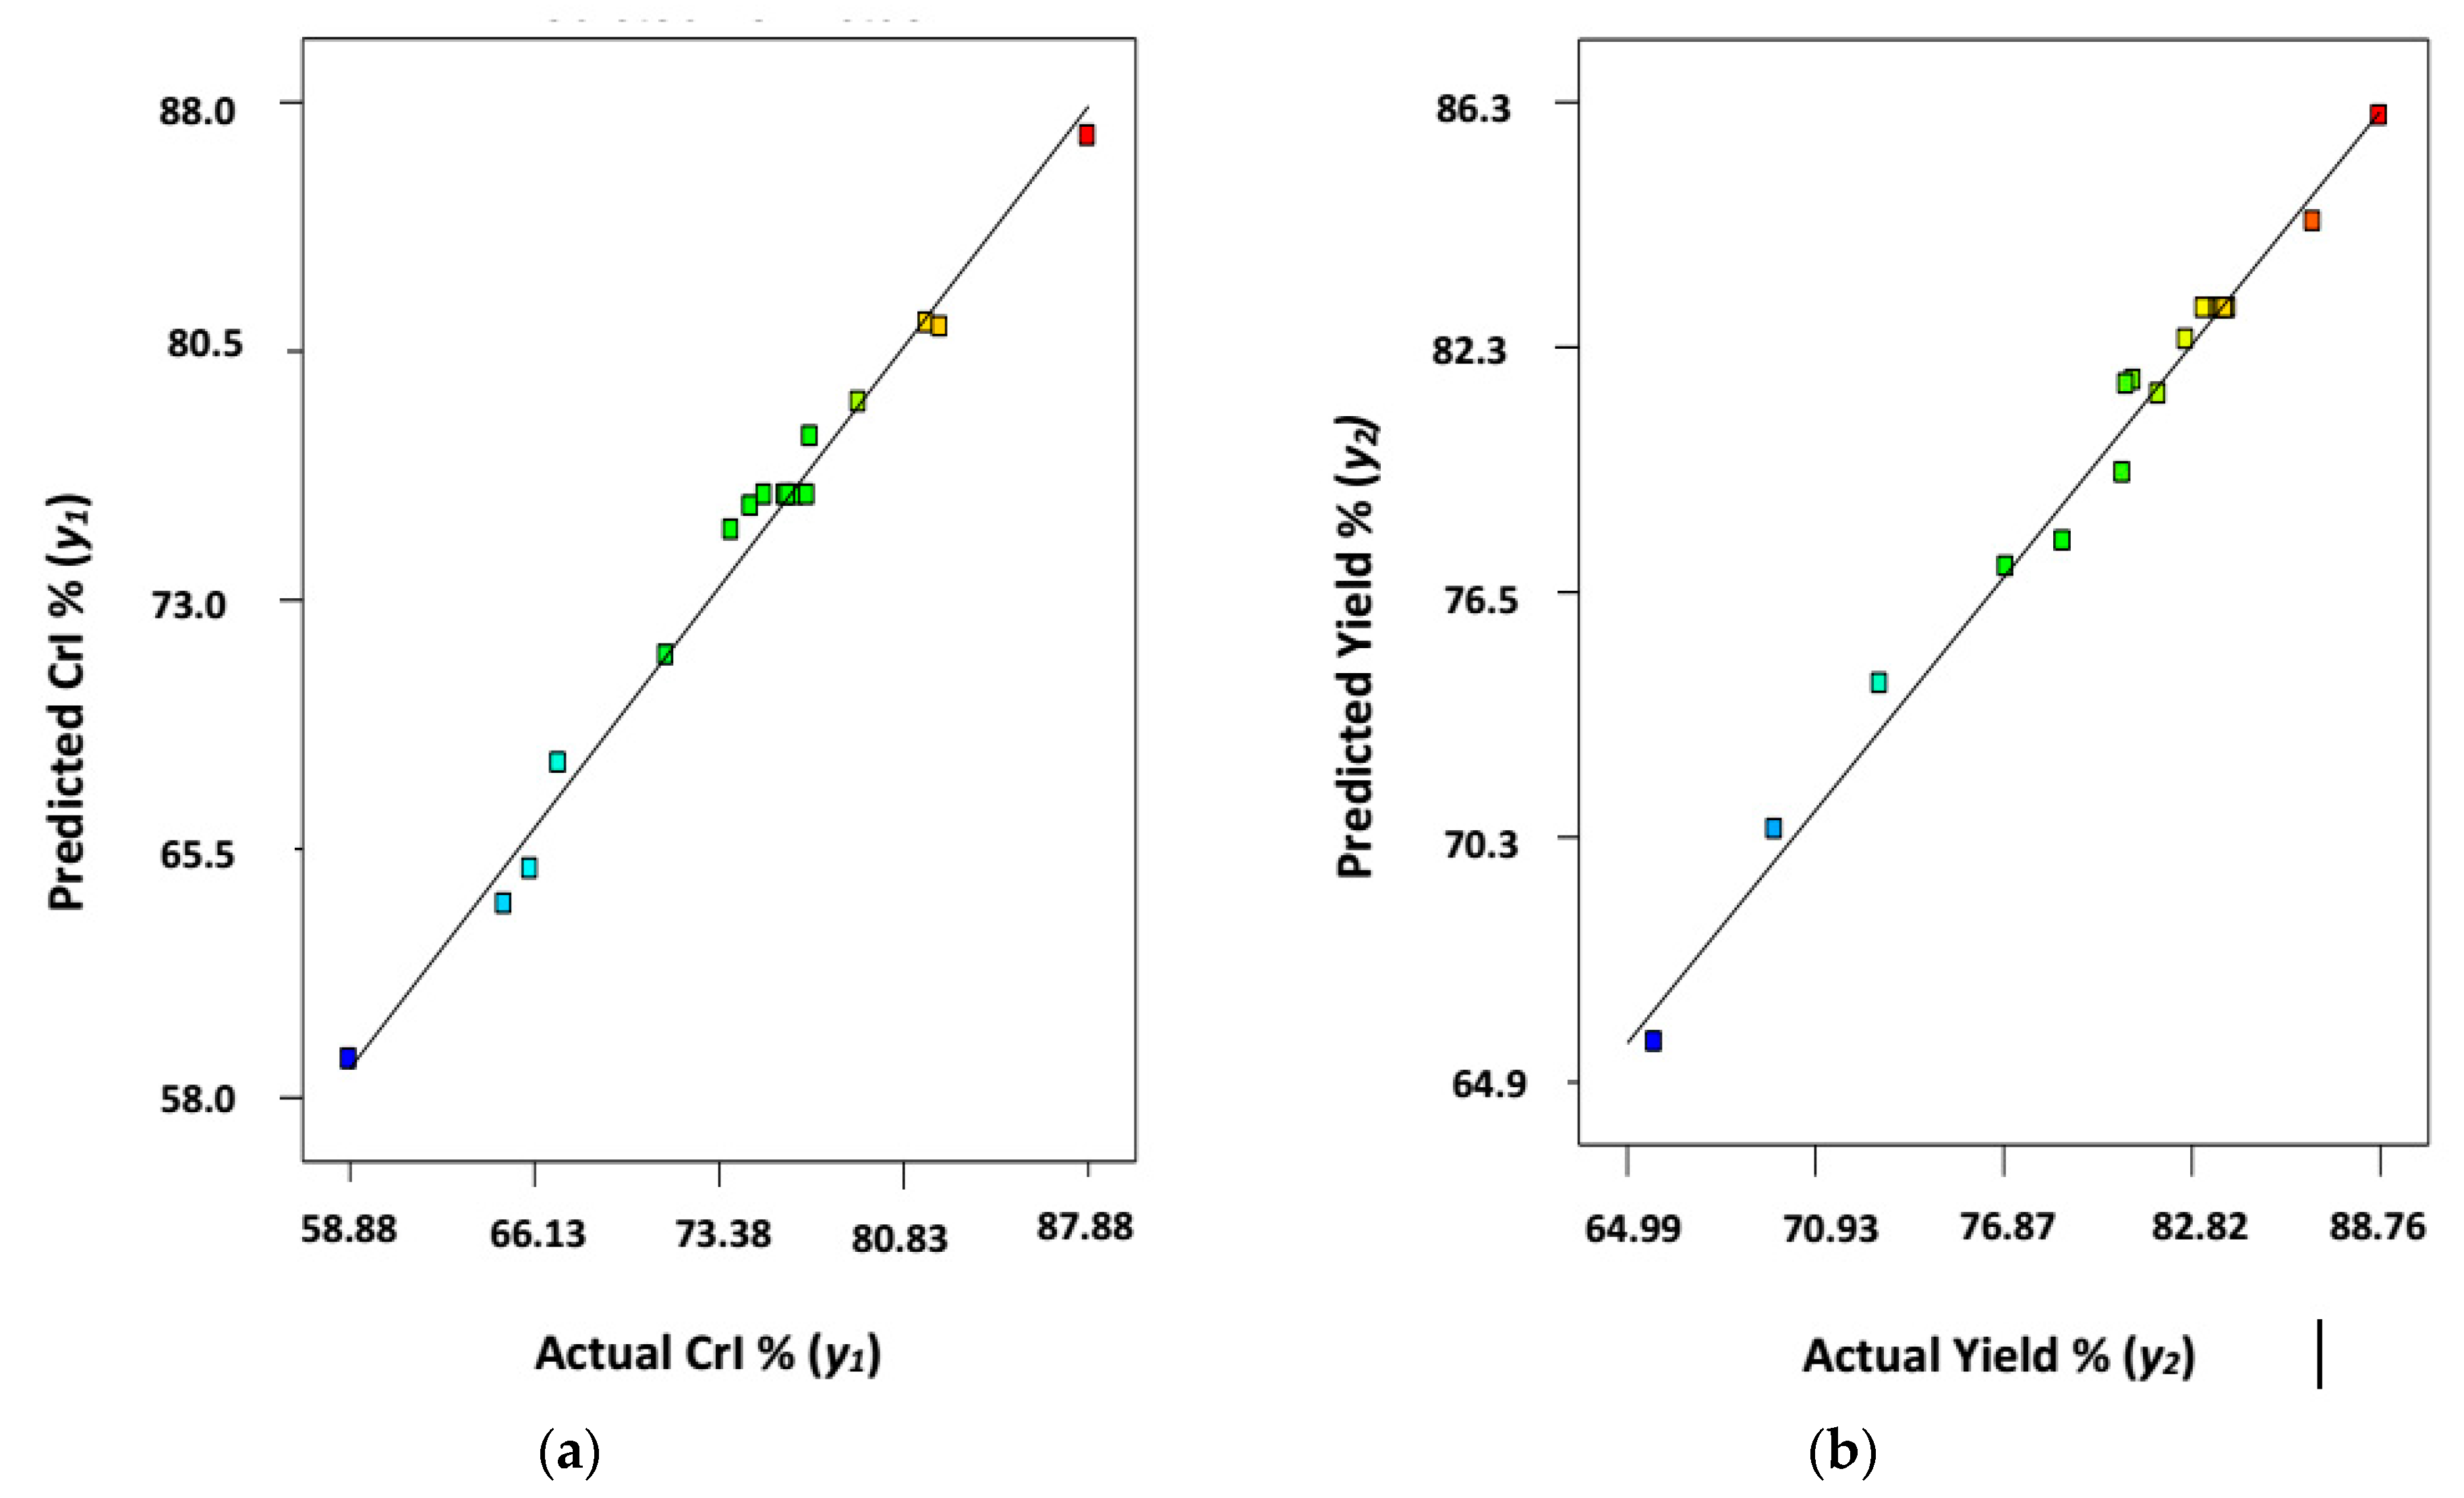
Figure 1. Predicted versus actual (a) crystallinity Index, CrI% (y1); and (b) yield% (y2) of CNWs (AKL-5).
Symmetry 11 01148 g001
Figure 2. Studentized residuals versus run number for (a) crystallinity index, CrI% (y1); and (b) yield% (y2) of CNWs (AKL-5).
Symmetry 11 01148 g002
Figure 3. Optimization ramp for crystallinity index, CrI% (y1) and yield% (y2) of CNWs (AKL-5) with desirability.
Symmetry 11 01148 g003
Figure 4. 3D surface mesh and contour plots. (a) Combined effects of power (x1) and time (x2); (b) combined effect of power (x1) and temperature (x3) on percentage crystallinity, CrI% (y1) of CNWs when the other two variables were at center level.
Symmetry 11 01148 g004
Figure 5. 3D surface mesh and contour plots. (a) Combined effects of power (x1) and time (x2); (b) combined effect of power (x1) and temperature (x3) on yield% (y2) of CNWs when the other two variables were at center level.
Symmetry 11 01148 g005
Figure 6. FESEM images of Adansonia kilima. (AK) (a) untreated leaves, AKL-1 (b) solvent extracted leaves, AKL-2; (c) KOH treated leaves, AKL-3; (d) bleached leaves, AKL-4; and (e) IL-assisted ultrasonicated sample, AKL-5 (CNWs).
Symmetry 11 01148 g006
Figure 7. (a) HRTEM image; (b) AFM image; and (c) size distribution (length) of Adansonia kilima (AK) leaves-based cellulose nano-whiskers (CNWs) from FESEM after IL-assisted ultrasonication process under optimum condition, AKL-5.
Symmetry 11 01148 g007
Figure 8. X-ray diffraction pattern of Adansonia kilima (AK): Untreated leaves, AKL-1; solvent extracted leaves, AKL-2; KOH treated leaves, AKL-3; bleached leaves AKL-4; and IL-assisted ultrasonicated sample, AKL-5 (CNWs).
Symmetry 11 01148 g008
Figure 9. Thermogravimetric analysis of Adansonia kilima (AK). Untreated leaves, AKL-1; solvent extracted leaves, AKL-2; KOH treated leaves, AKL-3; bleached leaves, AKL-4; and IL-assisted ultrasonicated sample, AKL-5 (CNWs).
Symmetry 11 01148 g009
Table 1. Input and output parameters with their levels using BBD design for extraction of cellulose nano-whiskers (CNWs) (AKL-5).
FactorInput ParametersUnitsLow ActualHigh ActualLow CodedHigh CodedOutput Responses
x1PowerWatt250350−1+1
x2TimeMinutes1545−1+1y1 = Crystallinity Index (%)
x3Temperature°C90120−1+1y2 = Yield of CNWs (%)
Table 2. Box-Behnken experimental design (BBD) for extraction of CNWs using ultrasonication.
Std. OrderRunPoint TypePower (watt)Time (Minutes)Temperature (°C)Crystallinity Index (CrI) (%)Yield (%)
143Center300.0030.00105.0076.8783.66
164Center300.0030.00105.0076.1183.77
155Center300.0030.00105.0075.9983.21
1310Center300.0030.00105.0076.4383.99
1716Center300.0030.00105.0075.1883.89
51IBFact250.0030.0090.0078.8886.66
42IBFact350.0045.00105.0065.9976.98
96IBFact250.0015.0090.0064.9780.99
127IBFact350.0045.00120.0073.8965.87
108IBFact350.0045.0090.0076.9980.77
19IBFact250.0015.00105.0074.6588.76
211IBFact350.0015.00105.0067.1182.65
612IBFact350.0030.0090.0058.8880.65
313IBFact250.0045.00105.0087.8881.78
814IBFact350.0030.00120.0071.3369.67
1115IBFact250.0015.00120.0082.0878.77
717IBFact300.0030.00120.0081.5572.99
Table 3. Statistical accuracy test for proposed polynomial models (crystallinity index% and CNWs yield%).
Statistical VariablesCrystallinity Index (CrI%)CNWs Yield%
y1y2
Standard Deviation, SD%1.221.06
Correlation Coefficient, R20.9870.986
Adjusted R20.9700.968
Mean74.4080.30
Coefficient of Variation, CV1.641.31
Adequate Precision29.8229.20
Table 4. Analysis of variance test (ANOVA) test for regression polynomial equation for crystallinity index, CrI% (y1) of CNWs.
SourceSum of SquaresDegree of FreedomMean SquareF-ValueProb > FComments
Model787.93987.5559.15<0.0001Significant
x1444.771444.77300.49<0.0001
x231.76131.7621.460.0024
x3106.071106.0771.66<0.0001
x1x251.48151.4834.780.0006
x1x323.91123.9116.160.0051
x2x3102.111102.1168.99<0.0001
x1217.10117.1011.560.0115
x220.1610.160.110.7543
x338.7418.745.900.0454
Residuals10.3671.48
Lack of Fit8.8032.937.530.0039Not Significant
Pure Error1.5640.39
Table 5. Analysis of variance test (ANOVA) test for regression polynomial equation for yield% (y2) of CNWs.
SourceSum of SquaresDegree of FreedomMean SquareF-ValueProb > FComments
Model559.08962.1255.79<0.0001Significant
x151.21151.2145.990.0003
x283.01183.0174.55<0.0001
x3218.091218.09195.87<0.0001
x1x20.4310.430.390.5544
x1x31.8111.811.620.2431
x2x340.20140.2036.100.0005
x120.7610.760.0680.8012
x224.4414.443.990.0860
x33155.491155.49139.65<0.0001
Residuals7.7971.11
Lack of Fit7.4332.4827.000.0041Not Significant
Pure Error0.3740.09
Table 6. Process parameter optimization for ultrasonication in presence of ILs.
Ultrasonication PowerTimeTemperatureCrystallinity Index of CNWs (%) (y1)Yield of CNWs (%) (y2)
(Watt)(Minutes)(°C)PredictedExperimentalErrorPredictedExperimentalError
20043.119487.8886.461.6185.2984.181.30
Table 7. X-ray crystallographic parameters for synthesized sample (AKL-1, AKL-2, AKL-3, AKl-4 and AKL-5).
SampleCrystallinity Index (%)Crystallites Sizes (nm)
AKL-151.4312.34
AKL-252.2210.34
AKL-364.777.54
AKL-471.324.24
AKL-586.463.43
Table 8. Thermogravimetric parameters for synthesized samples (AKL-1, AKL-2, AKL-3, AKl-4 and AKL-5).
SampleStep-1Char Residues (%)DTGmax (°C)
Temperature (°C)Weight Loss (%)
AKL-1100-1203.519.76362.01
AKL-2100-1203.117.22360.56
AKL-3100-1202.815.89359.70
AKL-4100-1202.314.44356.87
AKL-5100-1201.912.99351.09
Table 9. List of FTIR peaks with their frequency region for synthesized samples (AKL-1, AKL-2, AKL-3, AKl-4 and AKL-5).
Wave Number (cm−1)/Frequency LevelPeak Assignment
3200–3400–OH Stretching
2800–2900–CH Stretching
1640–1650–OH bending for moisture adsorbed
1400–1450CH2 Bending
1020–1054C–O–C pyranose ring stretching
1150–1200Asymmetric vibration of C–O–C bond
890–900Glycocidic β linkages of cellulosic chain