Weighted h-index for Identifying Influential Spreaders


Abstract
1. Introduction
2. Methods
2.1. Measures
2.2. Single Seed SIR Model
2.3. Evaluation Methods
3. Results
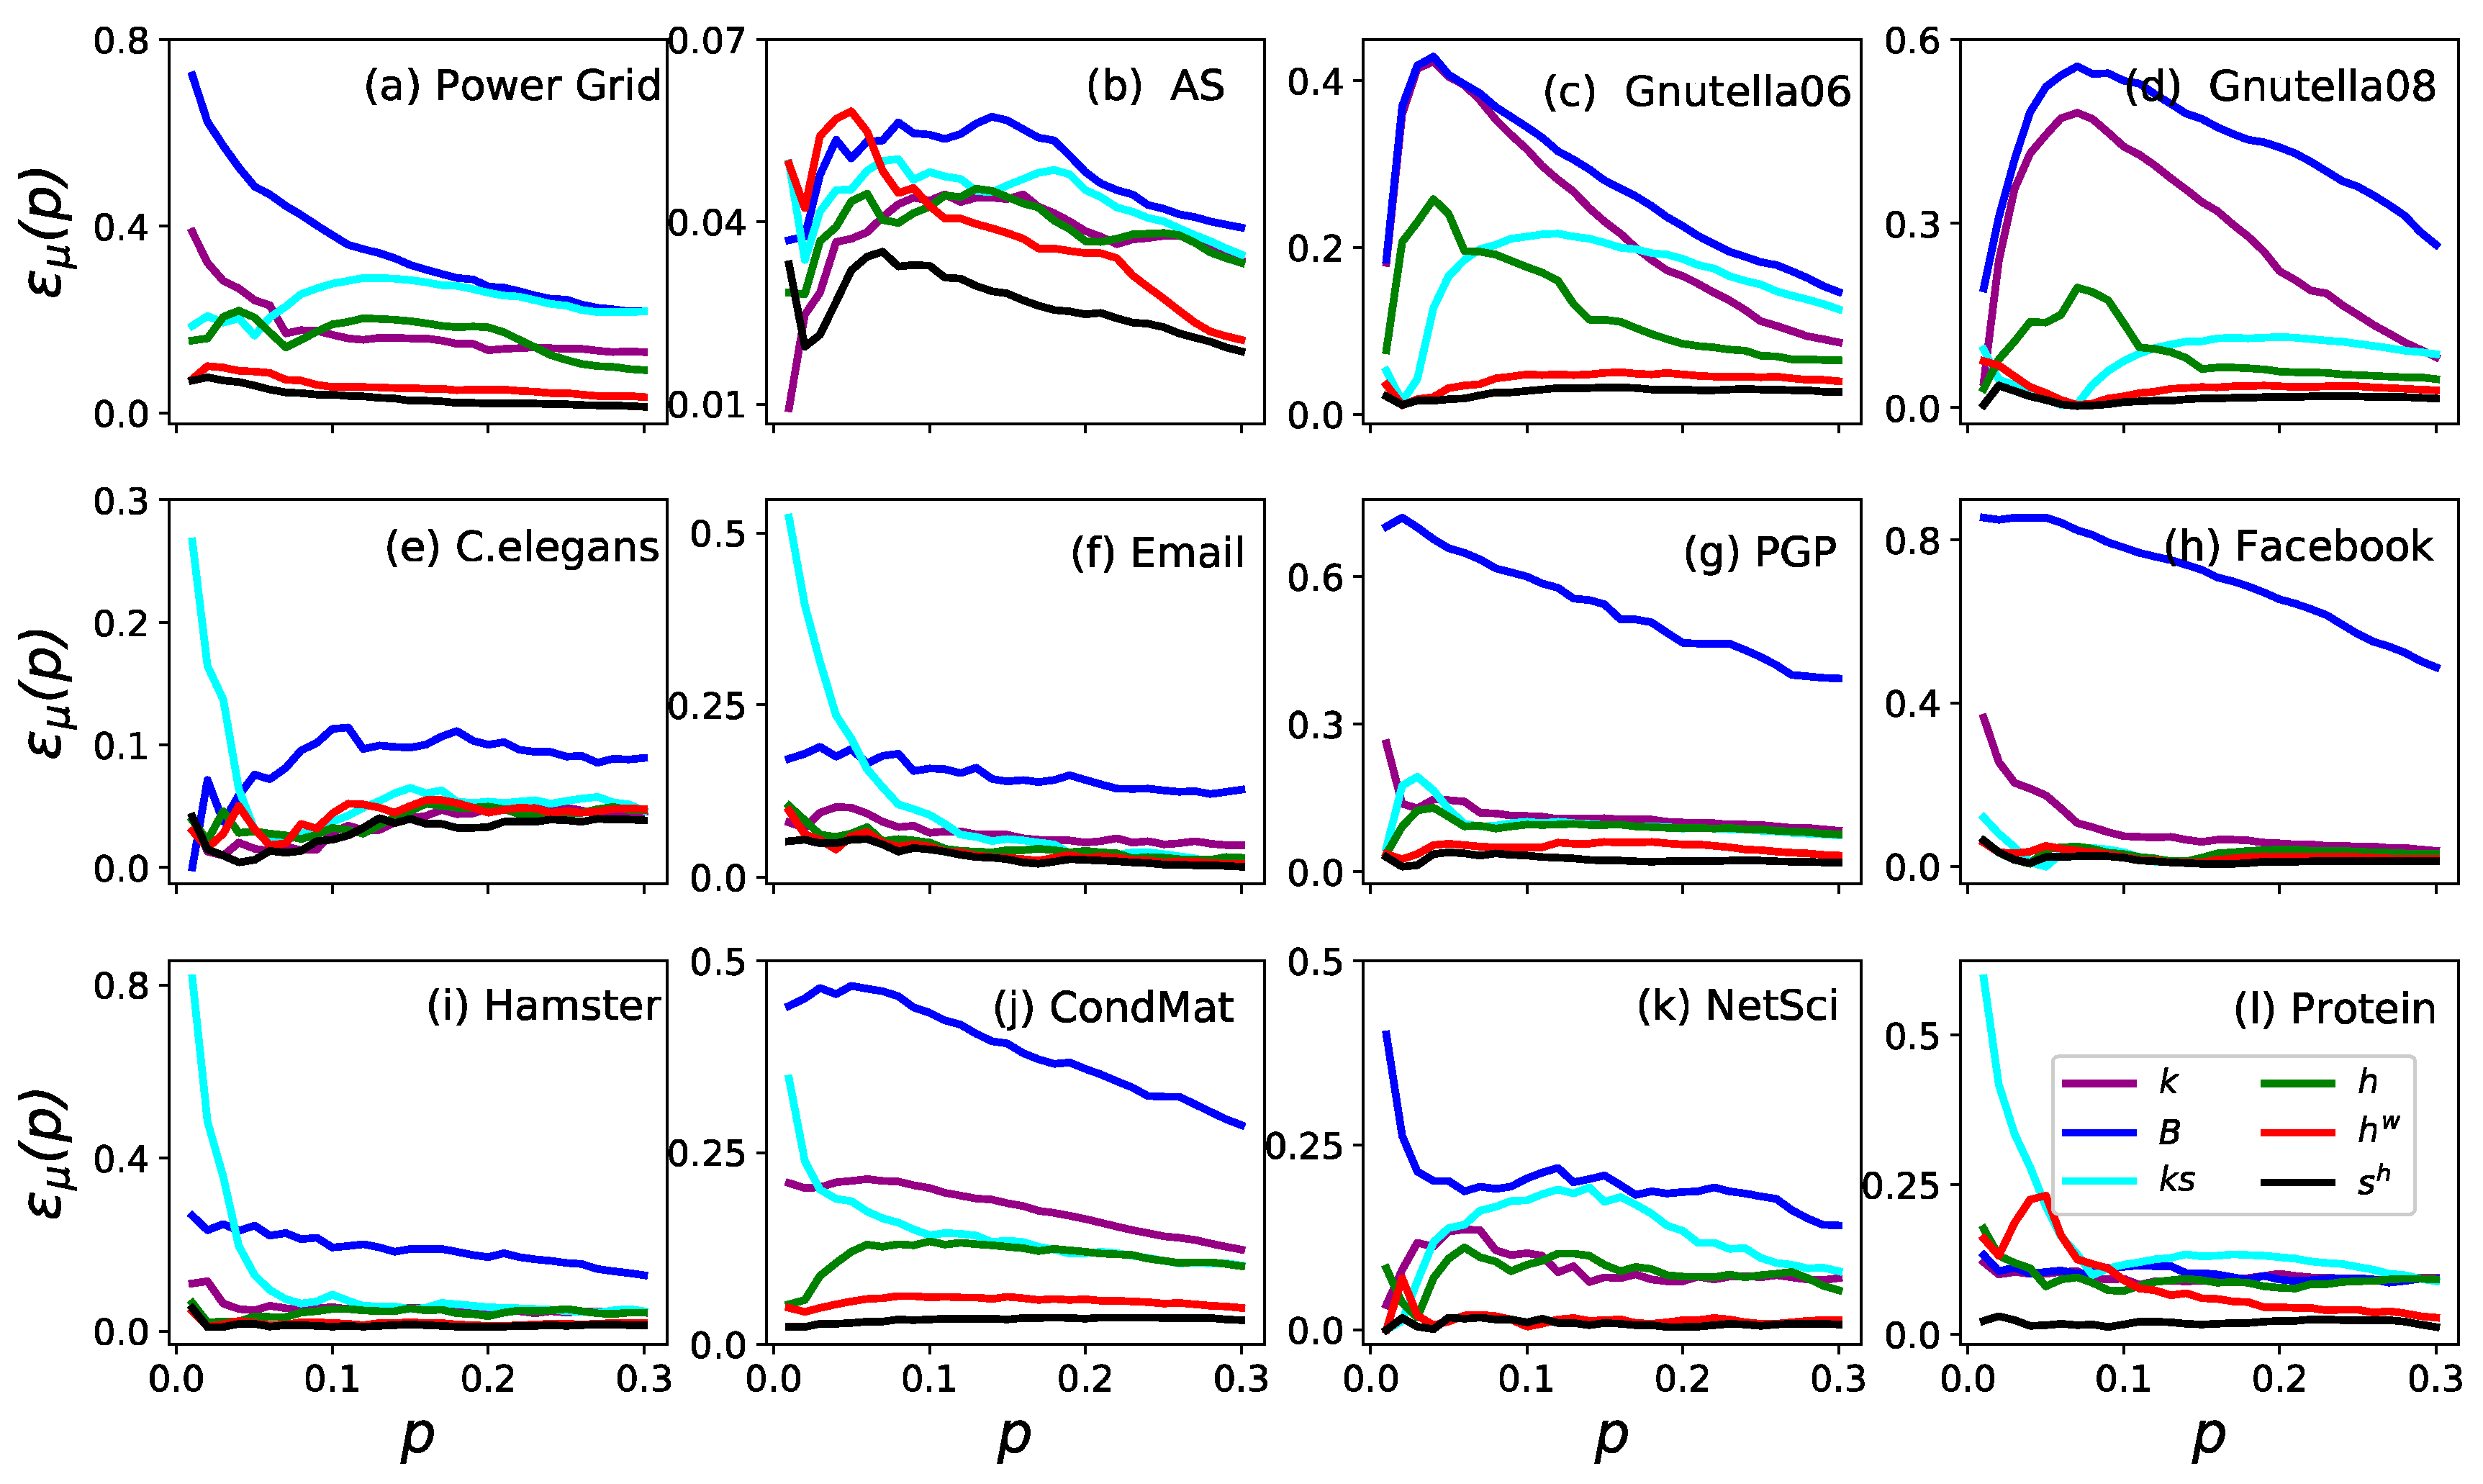
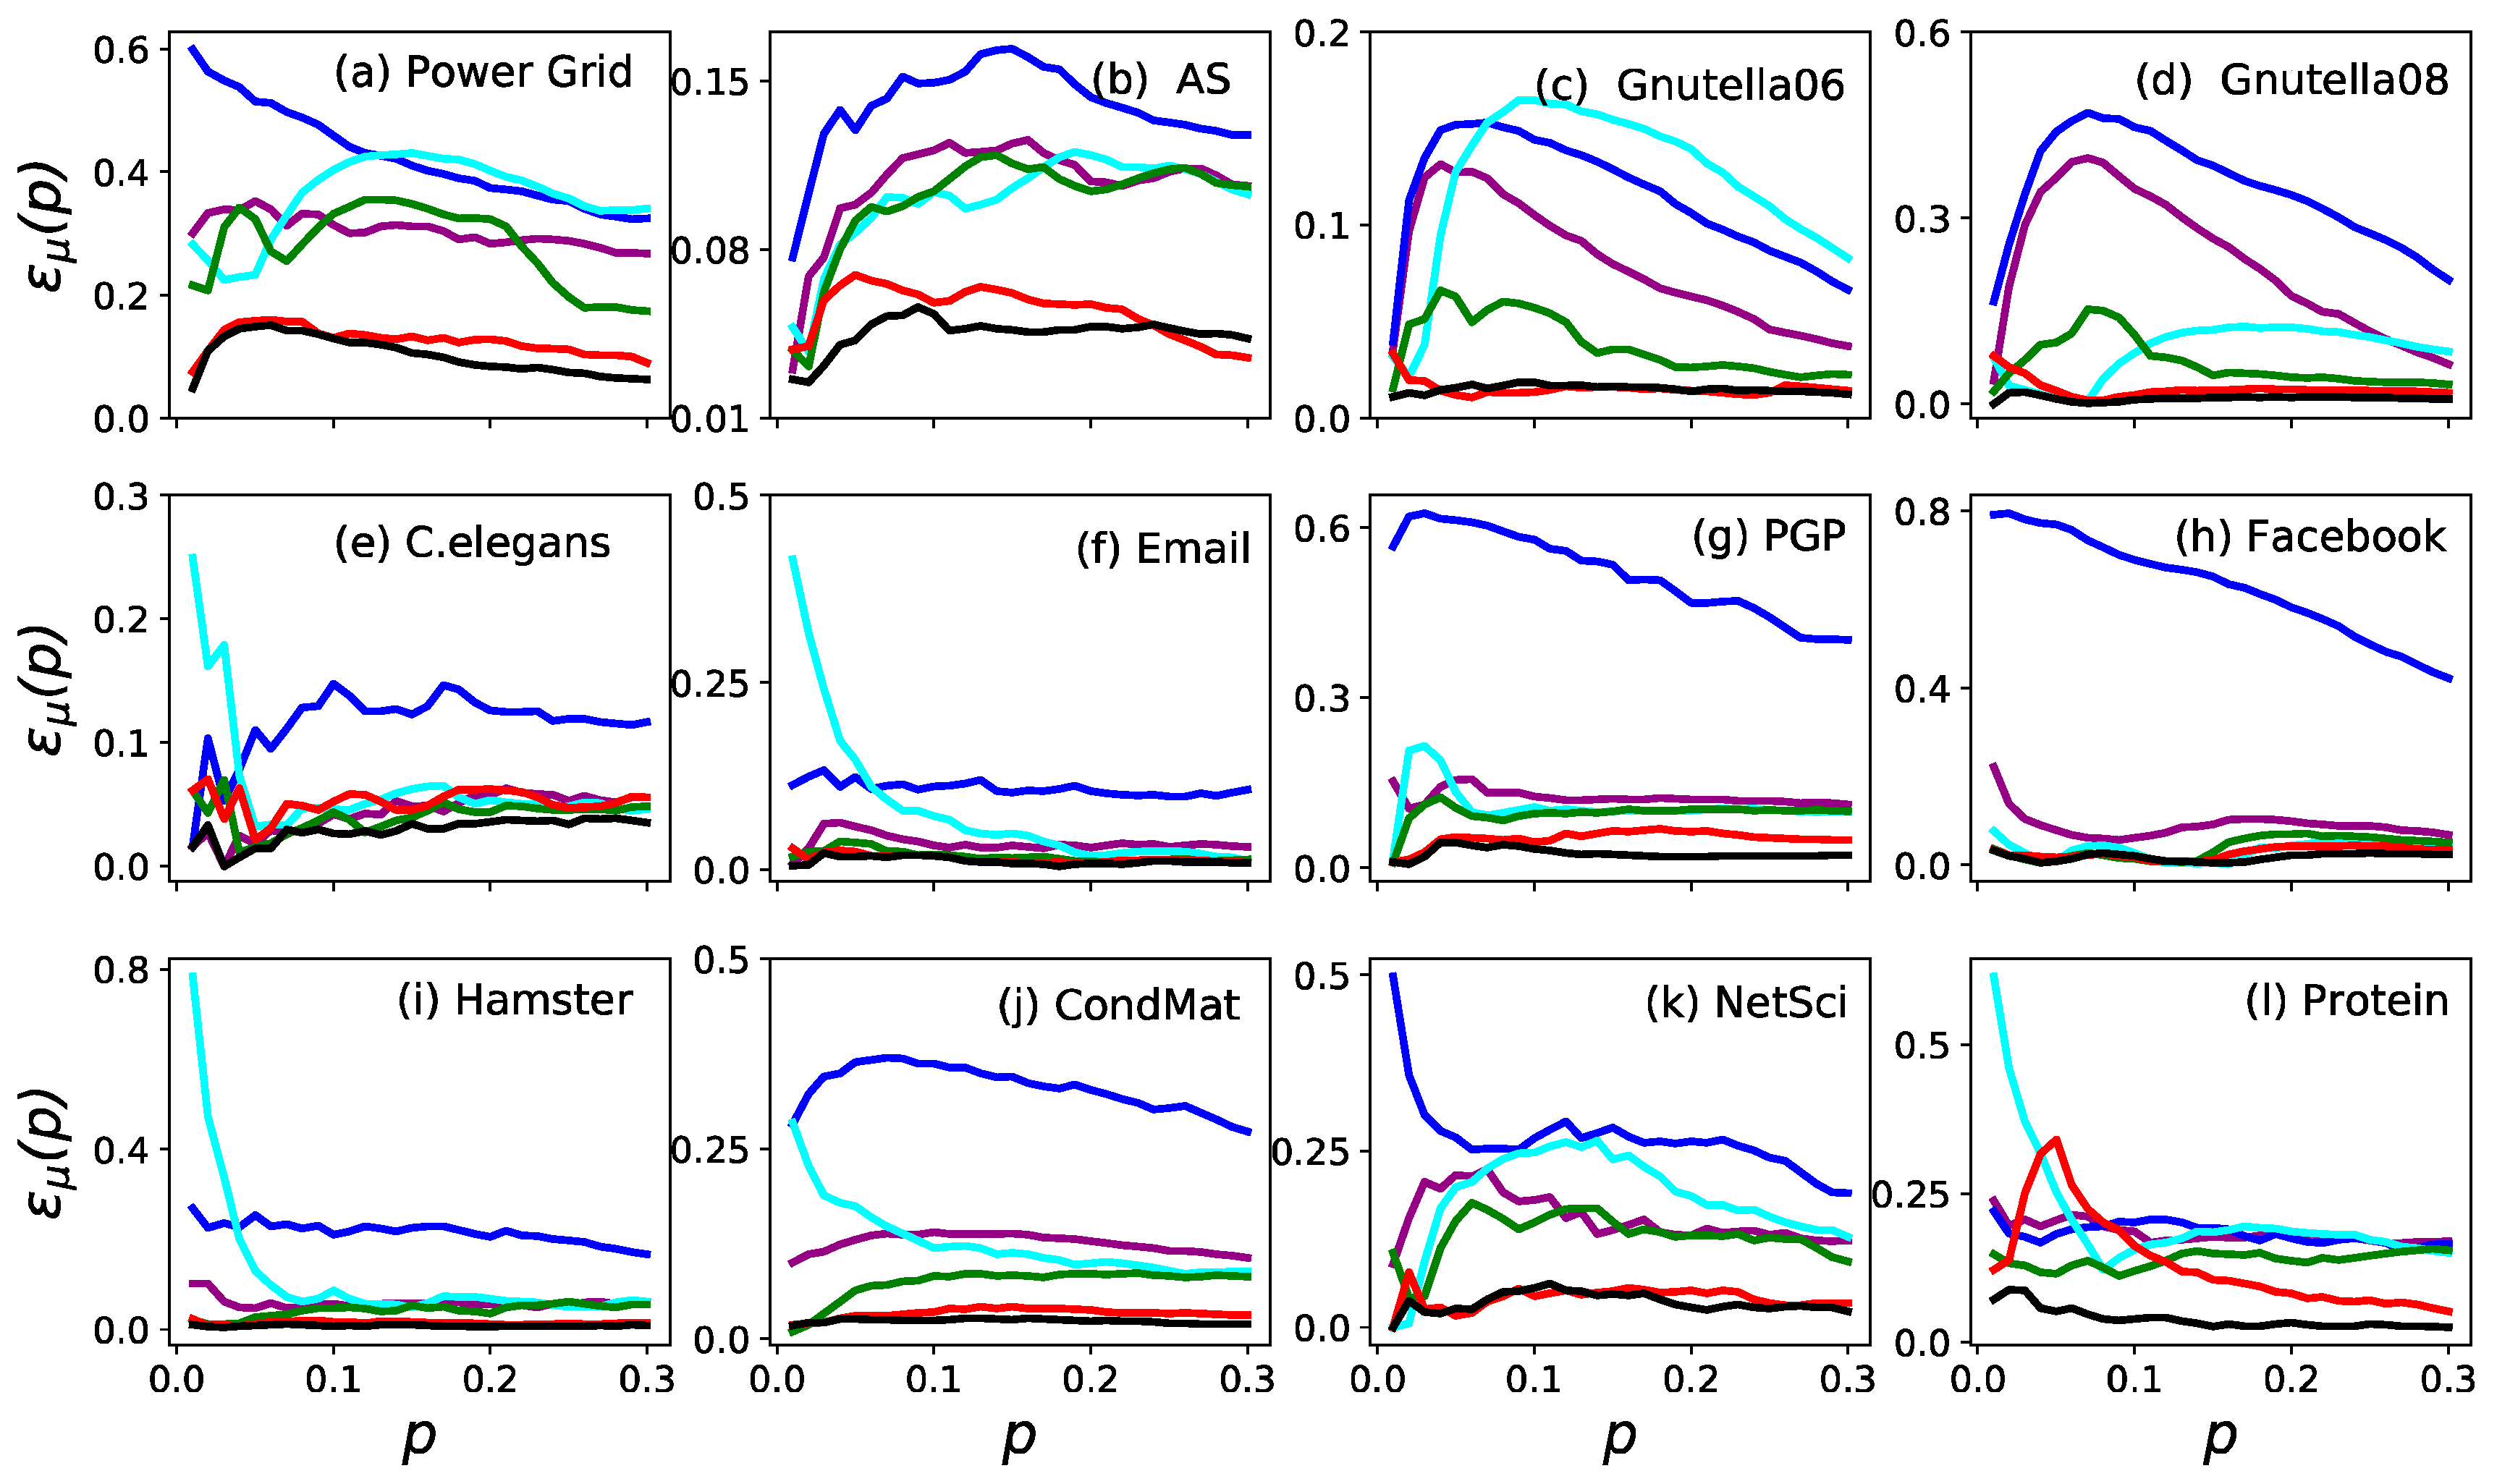
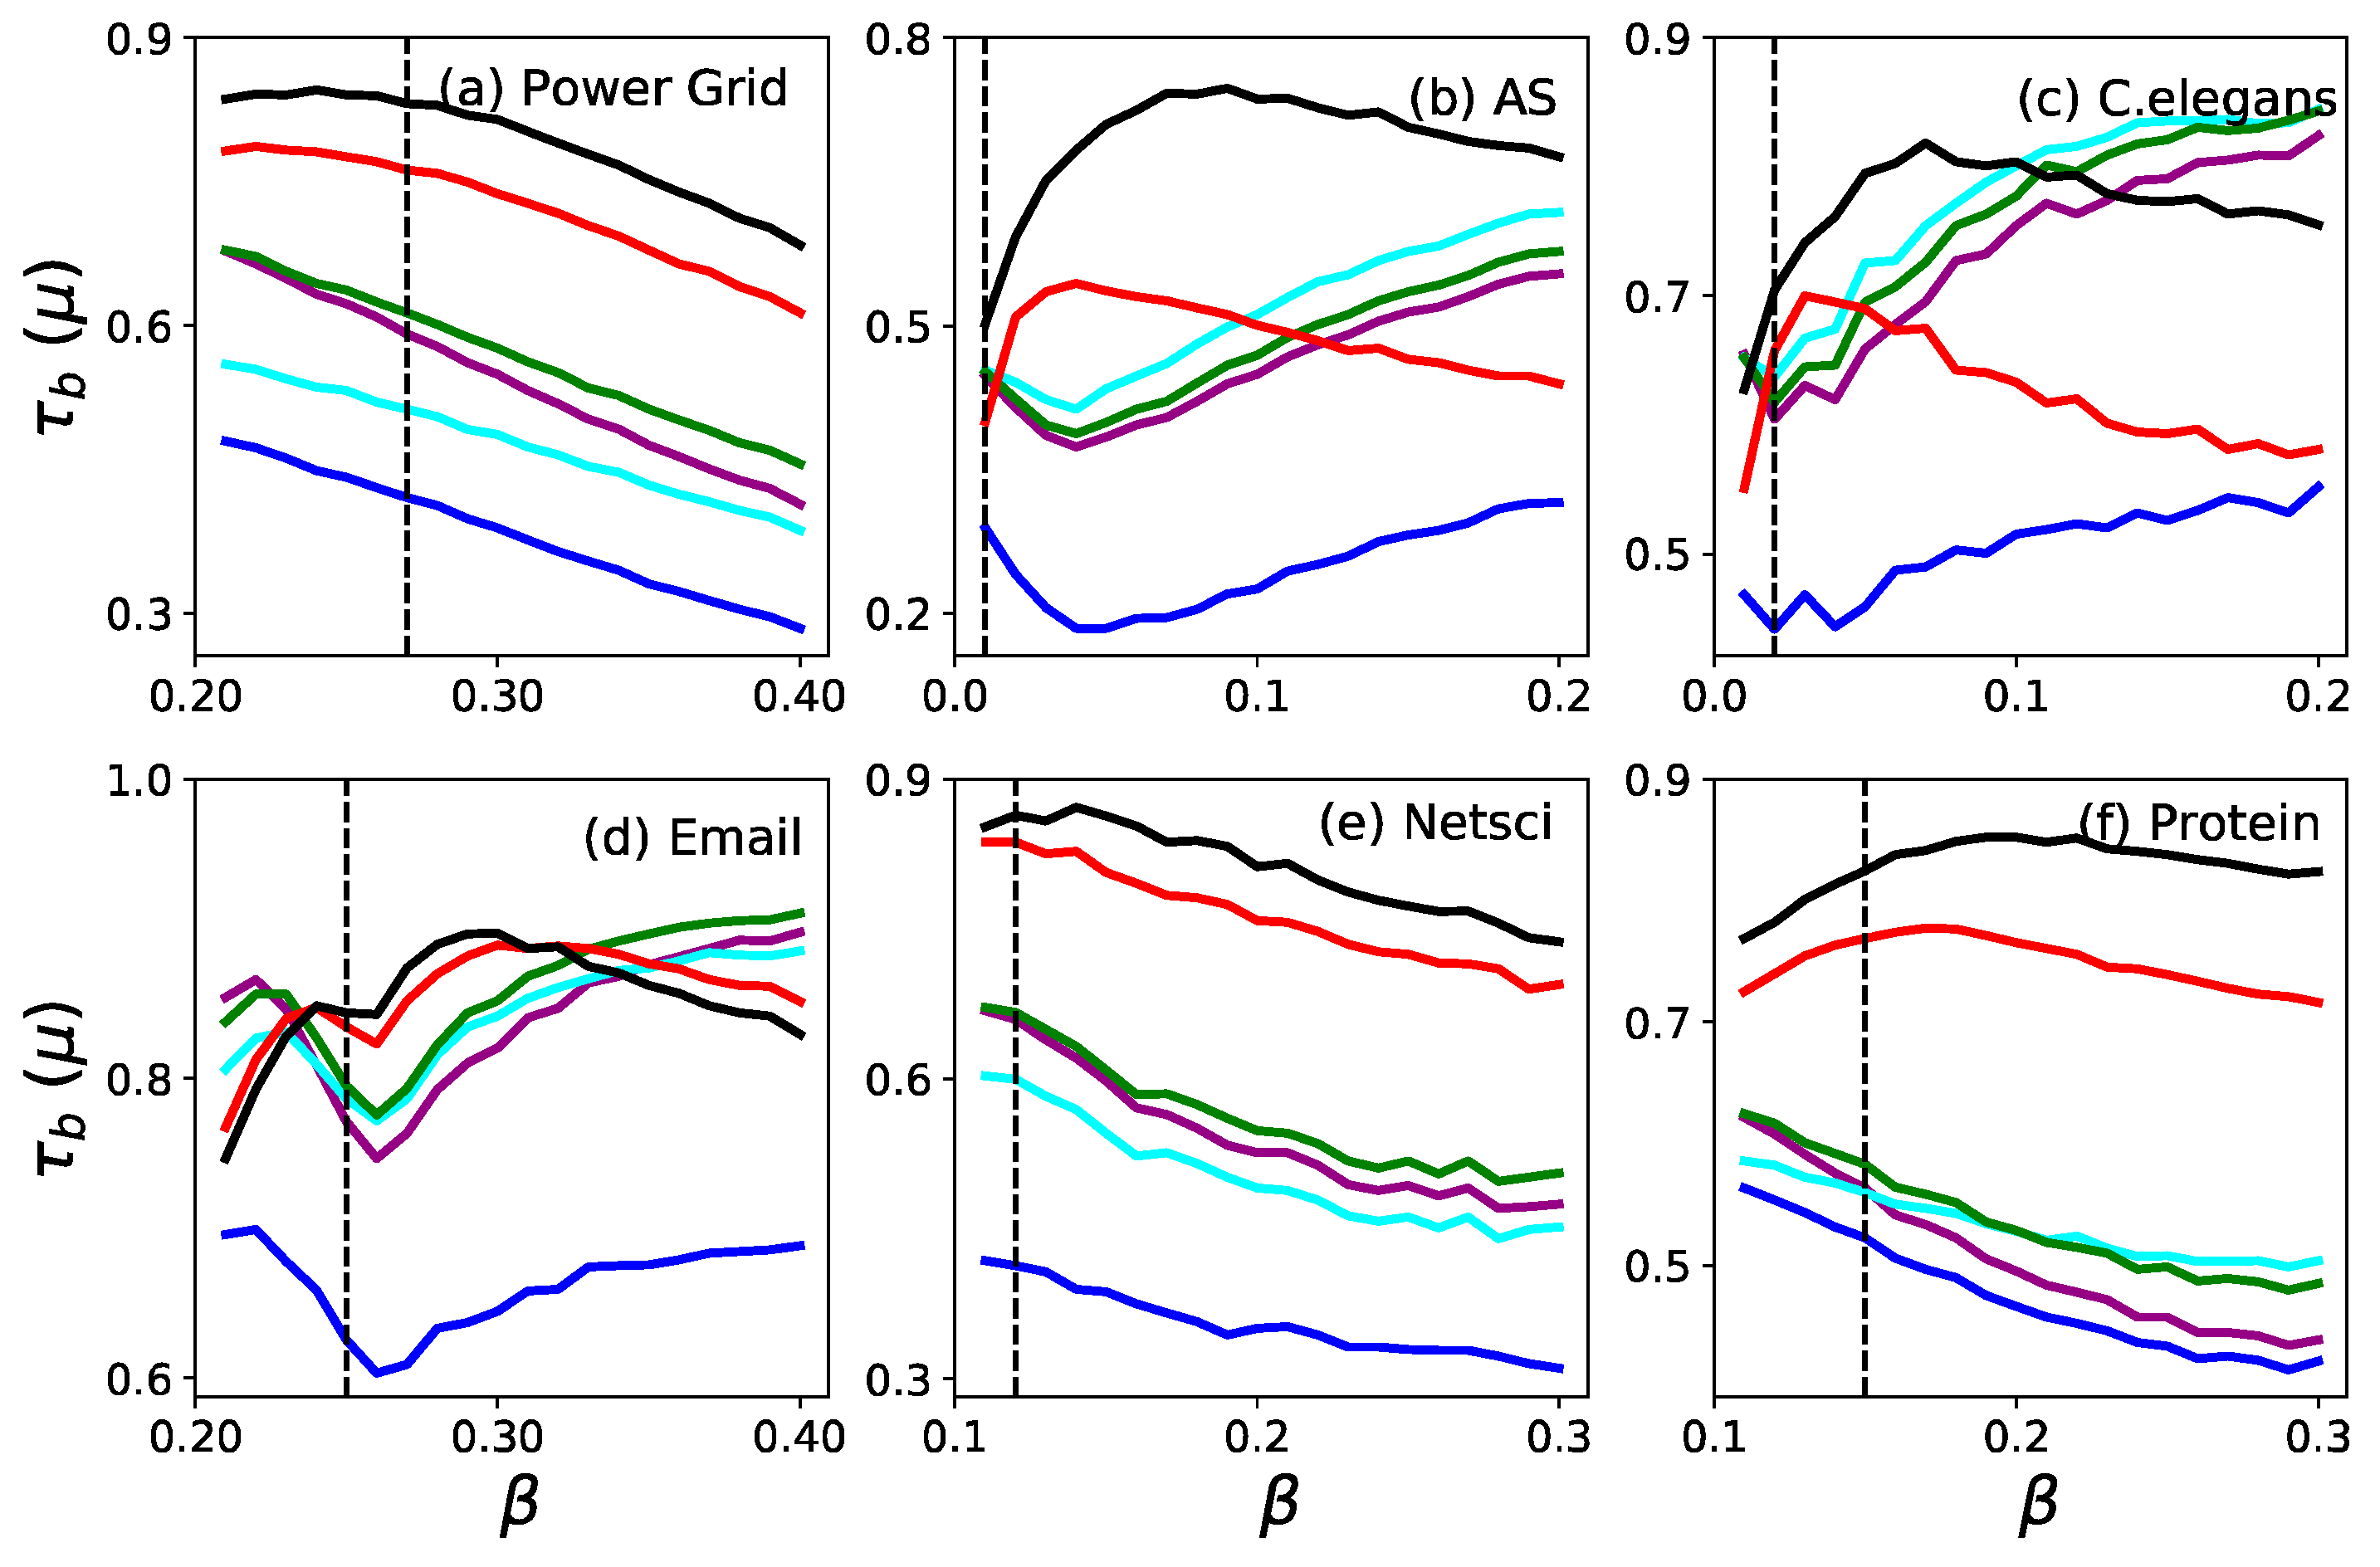
3.1. Accuracy
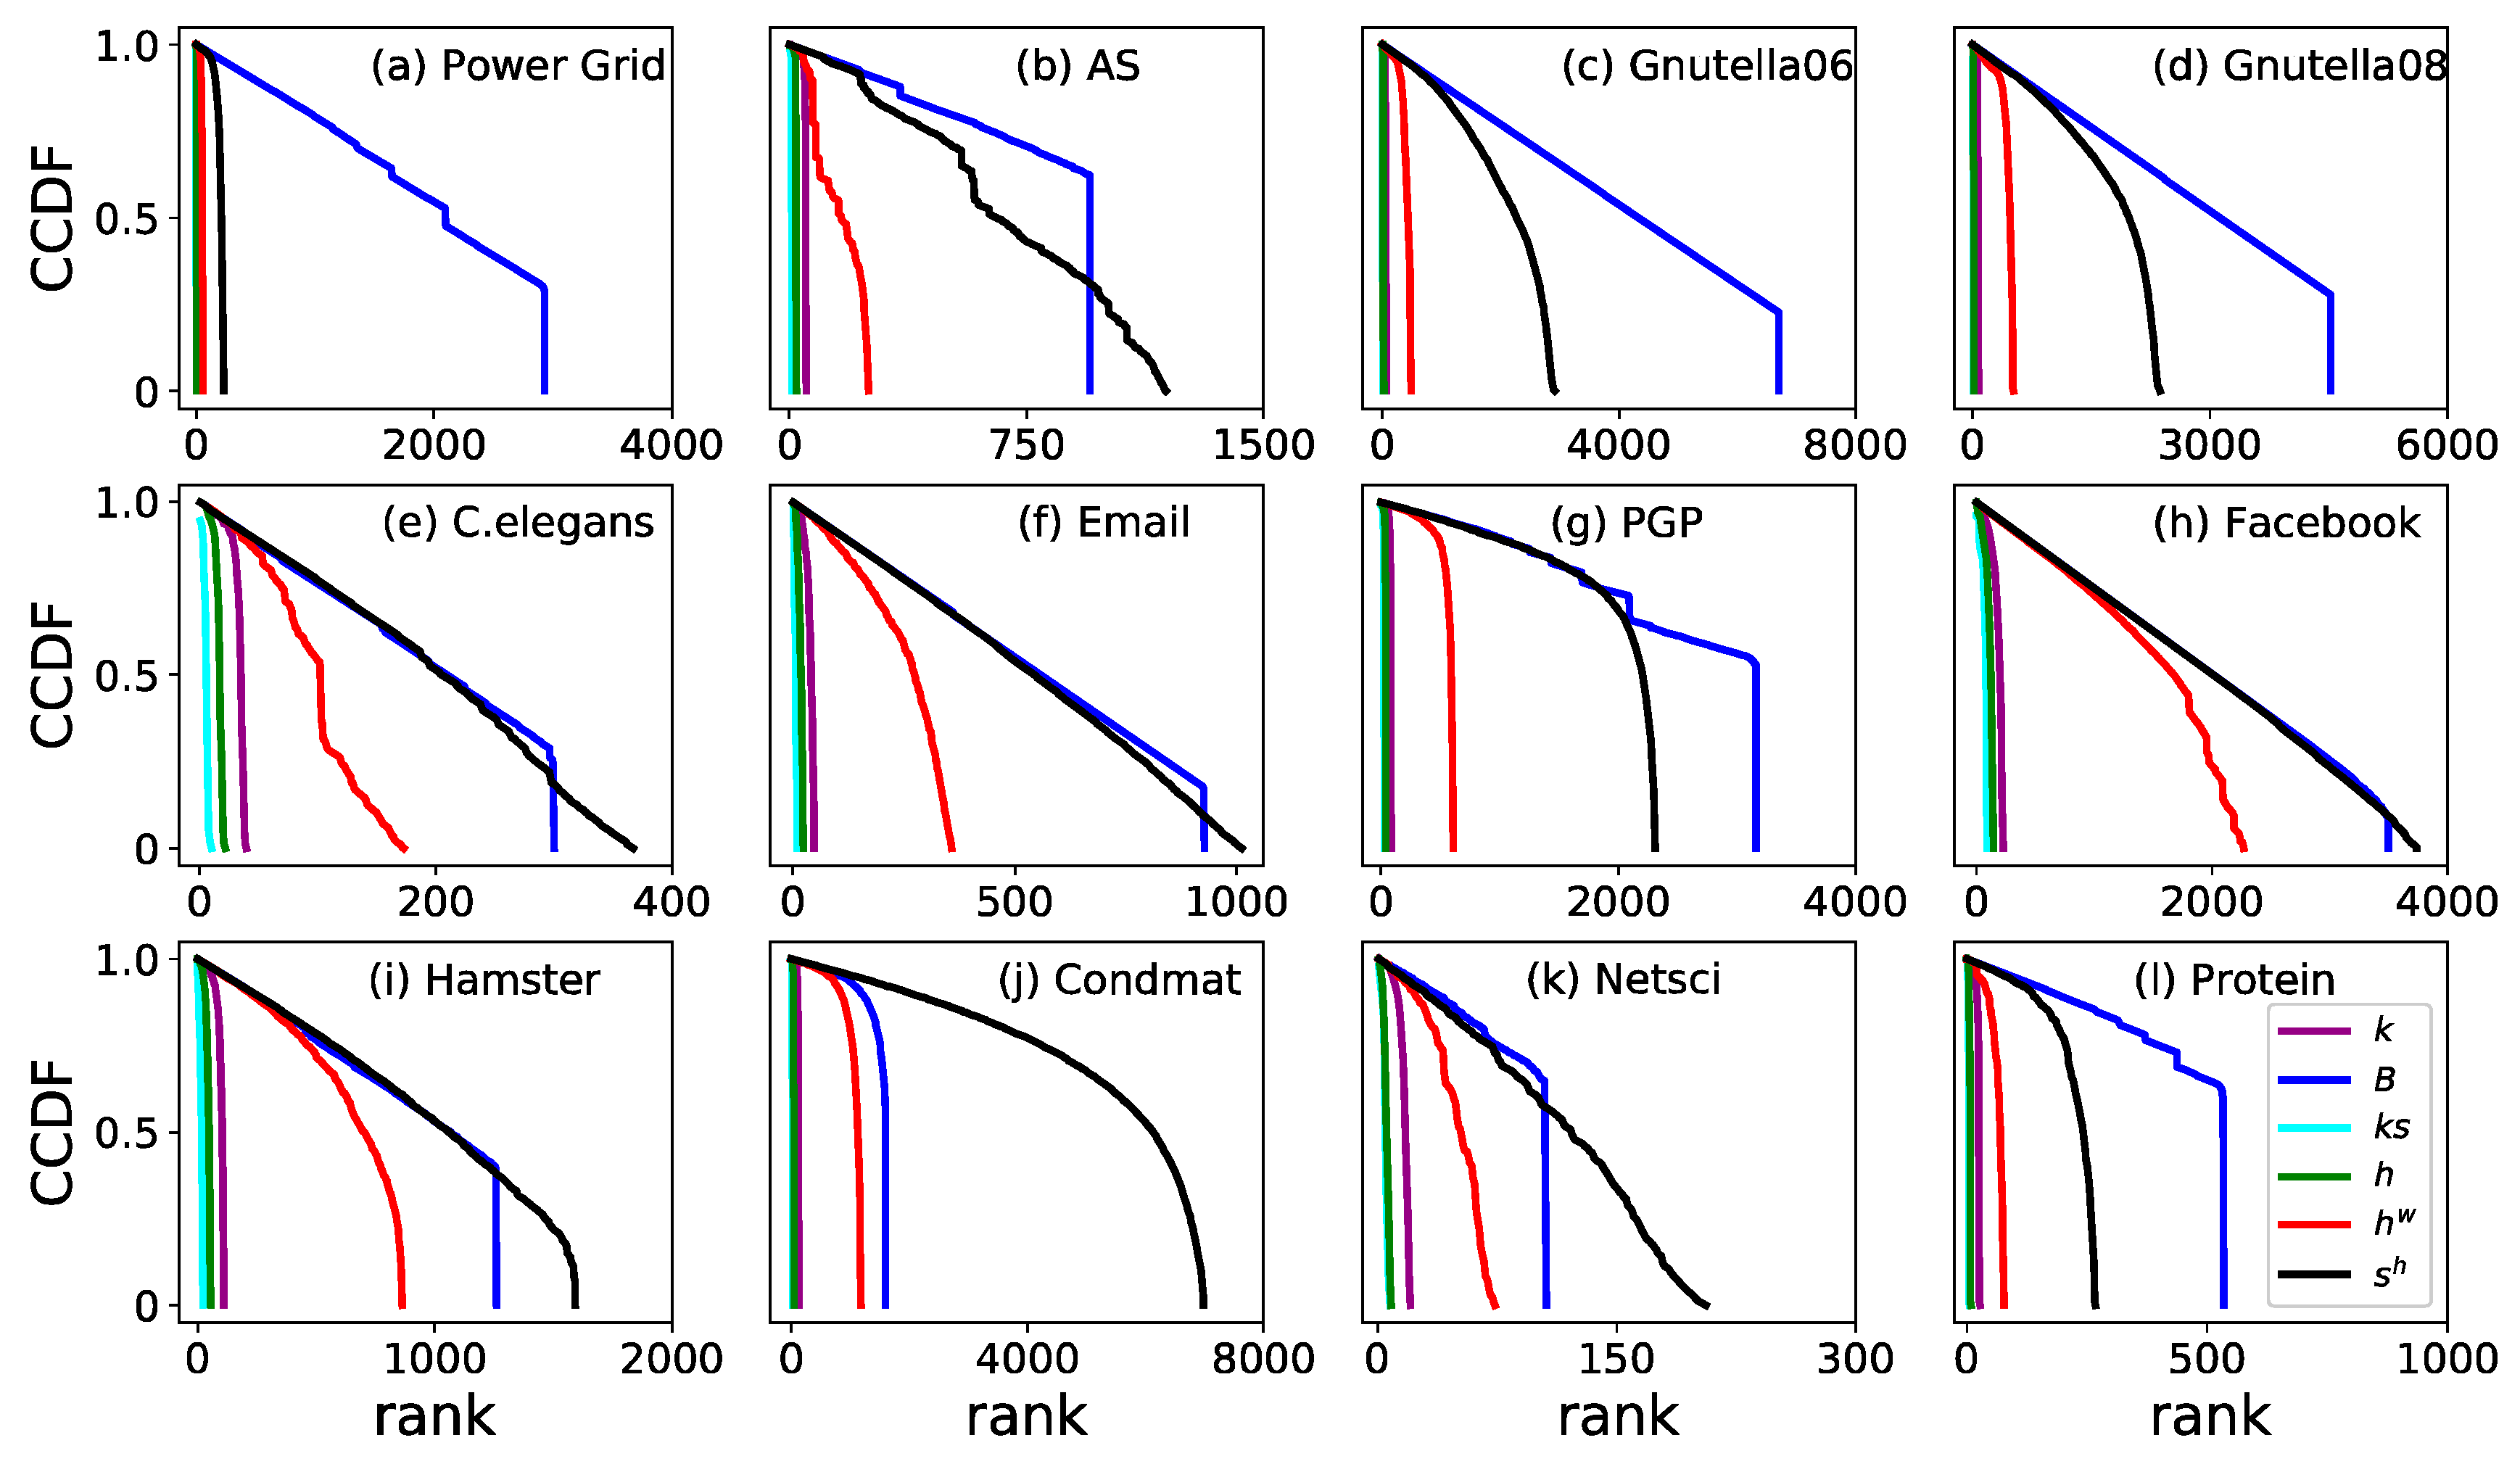
3.2. Monotonicity
4. Discussion
Author Contributions
Funding
Acknowledgments
Conflicts of Interest
References
- Motter, A.E. Cascade control and defense in complex networks. Phys. Rev. Lett. 2004, 93, 098701. [Google Scholar] [CrossRef] [PubMed]
- Moreno, Y.; Nekovee, M.; Pacheco, A.F. Dynamics of rumor spreading in complex networks. Phys. Rev. E 2004, 69, 066130. [Google Scholar] [CrossRef] [PubMed]
- Leskovec, J.; Adamic, L.A.; Huberman, B.A. The dynamics of viral marketing. ACM Trans. Web 2007, 1, 5. [Google Scholar] [CrossRef]
- Shen, Z.; Wang, W.; Fan, Y.; Di, Z.; Lai, Y.C. Reconstructing propagation networks with natural diversity and identifying hidden sources. Nat. Commun. 2014, 5, 4323. [Google Scholar] [CrossRef] [PubMed]
- Shen, Z.; Cao, S.; Wang, W.; Di, Z.; Stanley, H.E. Locating the source of diffusion in complex networks by time-reversal backward spreading. Phys. Rev. E 2016, 93, 032301. [Google Scholar] [CrossRef]
- Gao, L.; Gao, G.; Ma, D.; Xu, L. Coreness variation rule and fast updating algorithm for dynamic networks. Symmetry 2019, 11, 477. [Google Scholar] [CrossRef]
- Gao, L.; Shan, X.; Qin, Y.; Yu, S.; Xu, L.; Gao, Z.Y. Scaling tunable network model to reproduce the density-driven superlinear relation. Chaos 2018, 28, 033122. [Google Scholar] [CrossRef]
- Qin, Y.; Zhao, Z.; Cai, S.; Gao, L.; Stanley, H.E. Dual-induced multifractality in online viewing activity. Chaos 2018, 28, 013114. [Google Scholar] [CrossRef]
- Song, J.; Gao, L.; Shan, X. Historical street network GIS datasets of Beijing within 5th ring-road. China Sci. Data 2017, 2, 114. [Google Scholar] [CrossRef]
- Lv, L.Y.; Chen, D.B.; Ren, X.L.; Zhang, Q.M.; Zhang, Y.C.; Zhou, T. Vital nodes identification in complex networks. Phys. Rep. 2016, 650, 1–63. [Google Scholar] [CrossRef]
- Zeng, G.; Li, D.; Guo, S.; Gao, L.; Gao, Z.Y.; Stanley, H.E.; Havlin, S. Switch between critical percolation modes in city traffic dynamics. Proc. Natl. Acad. Sci. USA 2019, 116, 23–28. [Google Scholar] [CrossRef] [PubMed]
- Yu, S.; Gao, L.; Wang, Y.; Xu, L.; Gao, Z.Y. Identifying influential spreaders based on indirect spreading in neighborhood. Physica A 2019, 523, 418–425. [Google Scholar] [CrossRef]
- Albert, R.; Jeong, H.; Barabási, A.-L. Error and attack tolerance of complex networks. Nature 2000, 406, 378–382. [Google Scholar] [CrossRef] [PubMed]
- Pastor-satorras, R.; Vespignani, A. Epidemic spreading in scale-free networks. Phys. Rev. Lett. 2001, 86, 3200–3203. [Google Scholar] [CrossRef] [PubMed]
- Freeman, L.C. A set of measures of centrality based on betweenness. Sociometry 1977, 40, 35–411. [Google Scholar] [CrossRef]
- Katz, L. A new status index derived from sociometric analysis. Psychometrika 1953, 18, 39–43. [Google Scholar] [CrossRef]
- Sabidussi, G. The centrality index of a graph. Psychometrika 1966, 31, 581–603. [Google Scholar] [CrossRef]
- Kitsak, M.; Gallos, L.K.; Havlin, S.; Liljeros, F.; Muchnik, L.; Stanley, H.E.; Makse, H.A. Identification of influential spreaders in complex networks. Nat. Phys. 2010, 6, 888–893. [Google Scholar] [CrossRef]
- Chen, D.B.; Lu, L.Y.; Shang, M.S.; Zhang, Y.-C.; Zhou, T. Identifying influential nodes in complex networks. Physica A 2019, 391, 1777–1787. [Google Scholar] [CrossRef]
- Zeng, A.; Zhang, C.J. Ranking spreaders by decomposing complex networks. Phys. Lett. A 2013, 377, 1031–1035. [Google Scholar] [CrossRef]
- Liu, J.-G.; Ren, Z.-M.; Guo, Q. Ranking the spreading influence in complex networks. Physica A 2013, 392, 4154–4159. [Google Scholar] [CrossRef]
- Bae, J.; Kim, S. Identifying and ranking influential spreaders in complex networks by neighborhood coreness. Physica A 2014, 395, 549–559. [Google Scholar] [CrossRef]
- Wang, Y.; Zhao, J.K.; Xi, C.J.; Du, Z.X. Fast ranking influential nodes in complex networks using a k-shell iteration factor. Physica A 2016, 461, 171–181. [Google Scholar] [CrossRef]
- Xu, S.; Wang, P.; Lü, J.H. Iterative neighbour-information gathering for ranking nodes in complex networks. Sci. Rep. 2017, 7, 41321. [Google Scholar] [CrossRef] [PubMed]
- Liu, Y.; Tang, M.; Zhou, T.; Do, Y.H. Improving the accuracy of the k-shell method by removing redundant links: From a perspective of spreading dynamics. Sci. Rep. 2015, 5, 13172. [Google Scholar] [CrossRef] [PubMed]
- Liu, Y.; Tang, M.; Zhou, T.; Do, Y. Core-like groups result in invalidation of identifying super-spreader by k-shell decomposition. Sci. Rep. 2015, 5, 9602. [Google Scholar] [CrossRef]
- Wang, Z.X.; Du, C.J.; Fan, J.P.; Xing, Y. Ranking influential nodes in social networks based on node position and neighborhood. Neurocomputing 2017, 260, 466–477. [Google Scholar] [CrossRef]
- Yang, F.; Zhang, R.S.; Yang, Z.; Hu, R.J.; Li, M.T.; Yuan, Y.N.; Li, K.Q. Identifying the most influential spreaders in complex networks by an Extended Local K-Shell Sum. Int. J. Mod. Phys. C 2017, 28, 1750014. [Google Scholar] [CrossRef]
- Al-garadi, M.A.; Varathan, K.D.; Ravana, S.D. Identification of influential spreaders in online social networks using interaction weighted K-core decomposition method. Physica A 2017, 468, 278–288. [Google Scholar] [CrossRef]
- Hou, B.N.; Yao, Y.P.; Liao, D.S. Identifying all-around nodes for spreading dynamics in complex networks. Physica A 2012, 391, 4012–4017. [Google Scholar] [CrossRef]
- Ren, Z.M.; Liu, J.-G.; Shao, F.; Hu, Z.-L.; Guo, Q. Analysis of the spreading influence of the nodes with minimum K-shell value in complex networks. Acta. Phys. Sin. 2013, 62, 108902. [Google Scholar] [CrossRef]
- Poulin, R.; Boily, M.-C.; Mâsse, B.R. Dynamical systems to define centrality in social networks. Soc. Netw. 2000, 22, 187–220. [Google Scholar] [CrossRef]
- Estrada, E.; Rodríguez-Velázquez, J.A. Subgraph centrality in complex networks. Phys. Rev. E 2005, 71, 056103. [Google Scholar] [CrossRef] [PubMed]
- Grady, D.; Thiemann, C.; Brockmann, D. Robust classification of salient links in complex networks. Nat. Commun. 2012, 3, 864. [Google Scholar] [CrossRef] [PubMed]
- Opsahl, T.; Agneessens, F.; Skvoretz, J. Node centrality in weighted networks: Generalizing degree and shortest paths. Soc. Netw. 2010, 32, 245–251. [Google Scholar] [CrossRef]
- Chu, X.W.; Zhang, Z.Z.; Guan, J.H.; Zhou, S.G. Epidemic spreading with nonlinear infectivity in weighted scale-free networks. Physica A 2011, 390, 471–481. [Google Scholar] [CrossRef]
- Wei, D.J.; Deng, X.Y.; Zhang, X.G.; Deng, Y.; Mahadevan, S. Identifying influential nodes in weighted networks based on evidence theory. Physica A 2013, 392, 2564–2575. [Google Scholar] [CrossRef]
- Wang, J.Y.; Hou, X.N.; Li, K.Z.; Ding, Y. A novel weight neighborhood centrality algorithm for identifying influential spreaders in complex networks. Physica A 2017, 475, 88–105. [Google Scholar] [CrossRef]
- Liu, Y.; Tang, M.; Do, Y.; Hui, P.M. Accurate ranking of influential spreaders in networks based on dynamically asymmetric link weights. Phys. Rev. E 2017, 96, 022323. [Google Scholar] [CrossRef]
- Lu, L.Y.; Zhou, T.; Zhang, Q.-M.; Stanley, H.E. The H-index of a network node and its relation to degree and coreness. Nat. Commun. 2016, 7, 10168. [Google Scholar] [CrossRef]
- Yu, S.B.; Gao, L.; Wang, Y.-F. Finding the proper node ranking method for complex networks. arXiv 2018, arXiv:1812.10616. [Google Scholar]
- Ma, L.-L.; Ma, C.; Zhang, H.-F.; Wang, B.-H. Identifying influential spreaders in complex networks based on gravity formula. Physica A 2016, 451, 205–212. [Google Scholar] [CrossRef]
- Castellano, C.; Pastor-Satorras, R. Thresholds for epidemic spreading in Networks. Phys. Rev. Lett. 2010, 105, 218701. [Google Scholar] [CrossRef] [PubMed]
- Watts, D.J.; Strogatz, S.H. Collective dynamics of ‘small-world’ networks. Nature 1998, 393, 440–442. [Google Scholar] [CrossRef] [PubMed]
- Duch, J.; Arenas, A. Community identification using extremal optimization. Phys. Rev. E 2005, 72, 027104. [Google Scholar] [CrossRef] [PubMed]
- Guimerà, R.; Danon, L.; Díaz-Guilera, A.; Giralt, F.; Arenas, A. Self-similar community structure in a network of human interactions. Phys. Rev. E 2003, 68, 065103. [Google Scholar] [CrossRef] [PubMed]
- Boguñá, M.; Pastor-Satorras, R.; Díaz-Guilera, A.; Arenas, A. Models of social networks based on social distance attachment. Phys. Rev. E 2004, 70, 056122. [Google Scholar] [CrossRef]
- Leskovec, J.; McAuley, J.J. Learning to discover social circles in ego networks. In Proceedings of the 25th International Conference on Neural Information Processing Systems—Volume 1, Lake Tahoe, NV, USA, 3–6 December 2012; pp. 539–547. [Google Scholar]
- Kunegis, J. Hamsterster Full Network Dataset. KONECT. 2015. Available online: http://konect.uni-koblenz.de/networks/petster-hamster (accessed on 1 October 2018).
- Leskovec, J.; Kleinberg, J.; Faloutsos, C. Graph evolution: Densification and shrinking diameters. ACM Trans. Knowl. Discov. Data 2007, 1, 1556–4681. [Google Scholar] [CrossRef]
- Newman, M.E.J. Finding community structure in networks using the eigenvectors of matrices. Phys. Rev. E 2006, 74, 036104. [Google Scholar] [CrossRef]
- Jeong, H.; Mason, S.P.; Barabási, A.-L.; Oltvai, Z.N. Lethality and centrality in protein networks. Nature 2001, 411, 41–42. [Google Scholar] [CrossRef]


| Network | ||||||
|---|---|---|---|---|---|---|
| Power Grid | 4941 | 6594 | 0.26 | 2.6691 | 19 | 5 |
| AS | 3015 | 5156 | 0.01 | 3.4202 | 590 | 9 |
| Gnutella06 | 8717 | 31,525 | 0.07 | 7.2330 | 115 | 9 |
| Gnutella08 | 6301 | 20,777 | 0.06 | 6.5948 | 97 | 10 |
| C. elegans | 453 | 2025 | 0.02 | 8.9404 | 237 | 10 |
| 1133 | 5451 | 0.05 | 9.6222 | 71 | 11 | |
| PGP | 10,680 | 24,316 | 0.05 | 4.5536 | 205 | 31 |
| 4039 | 88,234 | 0.01 | 43.6910 | 1045 | 115 | |
| Hamster | 2426 | 16,630 | 0.02 | 13.7098 | 273 | 24 |
| CondMat | 23,133 | 93,497 | 0.05 | 8.0830 | 279 | 25 |
| NetSci | 379 | 914 | 0.12 | 4.8232 | 34 | 9 |
| Protein | 1870 | 2203 | 0.15 | 2.3562 | 56 | 5 |
| Network | ||||||
|---|---|---|---|---|---|---|
| Power Grid | 0.6020 | 0.4238 | 0.5142 | 0.6177 | 0.7466 | 0.8060 |
| AS | 0.4478 | 0.2896 | 0.4540 | 0.4522 | 0.3999 | 0.5023 |
| Gnutella06 | 0.6715 | 0.6393 | 0.6811 | 0.6940 | 0.7206 | 0.7578 |
| Gnutella08 | 0.6549 | 0.5987 | 0.6887 | 0.6913 | 0.7139 | 0.7527 |
| C. elegans | 0.5729 | 0.4361 | 0.5969 | 0.5820 | 0.5868 | 0.6289 |
| 0.7222 | 0.5862 | 0.7486 | 0.7483 | 0.7694 | 0.7868 | |
| PGP | 0.6027 | 0.4160 | 0.5707 | 0.6051 | 0.6481 | 0.6566 |
| 0.6818 | 0.4491 | 0.7135 | 0.7074 | 0.7320 | 0.7575 | |
| Hamster | 0.7477 | 0.5773 | 0.7378 | 0.7523 | 0.8390 | 0.8383 |
| CondMat | 0.6158 | 0.3884 | 0.6337 | 0.6432 | 0.7312 | 0.7564 |
| NetSci | 0.6391 | 0.4071 | 0.5830 | 0.6499 | 0.8256 | 0.8592 |
| Protein | 0.5642 | 0.5227 | 0.5598 | 0.5835 | 0.7690 | 0.8246 |
| Network | ||||||
|---|---|---|---|---|---|---|
| Power Grid | 0.4241 | 0.2921 | 0.3987 | 0.4646 | 0.6206 | 0.6893 |
| AS | 0.4148 | 0.2409 | 0.4412 | 0.4237 | 0.5091 | 0.5927 |
| Gnutella06 | 0.8135 | 0.7626 | 0.8073 | 0.8438 | 0.8599 | 0.8645 |
| Gnutella08 | 0.7214 | 0.6597 | 0.7525 | 0.7627 | 0.7844 | 0.8254 |
| C. elegans | 0.5759 | 0.4137 | 0.6140 | 0.5867 | 0.6355 | 0.6842 |
| 0.7738 | 0.6171 | 0.7964 | 0.8050 | 0.8438 | 0.8601 | |
| PGP | 0.5153 | 0.3500 | 0.5118 | 0.5287 | 0.6575 | 0.7099 |
| 0.6220 | 0.4251 | 0.6660 | 0.6526 | 0.7353 | 0.7875 | |
| Hamster | 0.7151 | 0.5727 | 0.7110 | 0.7232 | 0.8484 | 0.8745 |
| CondMat | 0.6051 | 0.3942 | 0.6316 | 0.6422 | 0.7714 | 0.8152 |
| NetSci | 0.5335 | 0.3443 | 0.5019 | 0.5609 | 0.7747 | 0.8330 |
| Protein | 0.4718 | 0.4466 | 0.5147 | 0.5103 | 0.7452 | 0.8429 |
| Network | ||||||
|---|---|---|---|---|---|---|
| Power Grid | 0.5927 | 0.8322 | 0.2460 | 0.4776 | 0.8523 | 0.9606 |
| AS | 0.4506 | 0.3728 | 0.3734 | 0.4336 | 0.9557 | 0.9803 |
| Gnutella06 | 0.8110 | 0.8990 | 0.5625 | 0.7945 | 0.9738 | 0.9986 |
| Gnutella08 | 0.7636 | 0.8511 | 0.5990 | 0.7575 | 0.9644 | 0.9979 |
| C. elegans | 0.7922 | 0.8743 | 0.6962 | 0.7599 | 0.9301 | 0.9961 |
| 0.8874 | 0.9400 | 0.8088 | 0.8661 | 0.9914 | 0.9996 | |
| PGP | 0.6193 | 0.5099 | 0.4806 | 0.5836 | 0.9495 | 0.9920 |
| 0.9740 | 0.9855 | 0.9419 | 0.9674 | 0.9838 | 0.9998 | |
| Hamster | 0.8980 | 0.7128 | 0.8714 | 0.8892 | 0.9796 | 0.9854 |
| CondMat | 0.8524 | 0.4506 | 0.7980 | 0.8268 | 0.9863 | 0.9974 |
| NetSci | 0.7642 | 0.3387 | 0.6421 | 0.6976 | 0.9472 | 0.9907 |
| Protein | 0.4264 | 0.4053 | 0.2534 | 0.3825 | 0.9084 | 0.9563 |
© 2019 by the authors. Licensee MDPI, Basel, Switzerland. This article is an open access article distributed under the terms and conditions of the Creative Commons Attribution (CC BY) license (http://creativecommons.org/licenses/by/4.0/).
Share and Cite
Gao, L.; Yu, S.; Li, M.; Shen, Z.; Gao, Z. Weighted h-index for Identifying Influential Spreaders. Symmetry 2019, 11, 1263. https://doi.org/10.3390/sym11101263
Gao L, Yu S, Li M, Shen Z, Gao Z. Weighted h-index for Identifying Influential Spreaders. Symmetry. 2019; 11(10):1263. https://doi.org/10.3390/sym11101263
Chicago/Turabian StyleGao, Liang, Senbin Yu, Menghui Li, Zhesi Shen, and Ziyou Gao. 2019. "Weighted h-index for Identifying Influential Spreaders" Symmetry 11, no. 10: 1263. https://doi.org/10.3390/sym11101263
APA StyleGao, L., Yu, S., Li, M., Shen, Z., & Gao, Z. (2019). Weighted h-index for Identifying Influential Spreaders. Symmetry, 11(10), 1263. https://doi.org/10.3390/sym11101263