Article

Experimental Study on Plasma Flow Control of Symmetric Flying Wing Based on Two Kinds of Scaling Models

1
Science and technology on plasma dynamics laboratory, Air Force Engineering University, Xi’an 710038, China
2
Air Force Harbin Flight Academy, Harbin 150000, China
3
AVIC Aerodynaiviics Research Institute, Harbin 150001, China
*
Author to whom correspondence should be addressed.
Symmetry 2019, 11(10), 1261; https://doi.org/10.3390/sym11101261
Submission received: 8 September 2019 / Revised: 30 September 2019 / Accepted: 6 October 2019 / Published: 9 October 2019
(This article belongs to the Special Issue Aero/Hydrodynamics and Symmetry)

Abstract

:
The symmetric flying wing has a simple structure and a high lift-to-drag ratio. Due to its complicated surface design, the flow field flowing through its surface is also complex and variable, and the three-dimensional effect is obvious. In order to verify the effect of microsecond pulse plasma flow control on the symmetric flying wing, two different sizes of scaling models were selected. The discharge energy was analyzed, and the force and moment characteristics of the two flying wings and the particle image velocimetry (PIV) results on their surface flow field were compared to obtain the following conclusions. The microsecond pulse surface dielectric barrier discharge energy density is independent of the actuator length but increases with the actuation voltage. After actuation, the stall angle of attack of the small flying wing is delayed by 4°, the maximum lift coefficient is increased by 30.9%, and the drag coefficient can be reduced by 17.3%. After the large flying wing is actuated, the stall angle of attack is delayed by 4°, the maximum lift coefficient is increased by 15.1%, but the drag coefficient is increased. The test results of PIV in the flow field of different sections indicate that the stall separation on the surface of the symmetric flying wing starts first from the outer side, and then the separation area begins to appear on the inner side as the angle of attack increases.

1. Introduction

Compared with the conventional layout aircraft, the flying wing has no flat tail and vertical tail, and the wing and the fuselage are highly integrated, so it is subjected to greater lift and less drag [1,2]. High aerodynamic efficiency, light weight structure, large loading space, and good stealth performance are the characteristics of the flying wing [3,4]. As the use of the air field is getting deeper, in future development, the aircraft of the flying wing layout seems to be the seed candidate [5]. However, just like the aircraft of the conventional layout, after the angle of attack exceeds the critical value, the surface boundary layer of the flying wing will be separated, the lift will drop sharply, and its maneuverability will deteriorate [6]. The flying wing is similar to a delta wing aircraft. At moderate angles of attack, both sides of the wing are subjected to a pair of asymmetric flow axial vortex systems. At high angles of attack, the left and right asymmetrical vortices are formed in the leeward area of the fore body, resulting in yawing and rolling moments, affecting its maneuverability [7,8].
Through the technical means of flow control, improving the stall characteristics of the wing surface and then improving the aerodynamic performance of the aircraft at a high angle of attack have become an important research direction in the field of aviation [9,10]. At present, there are many research methods to improve the flow field by active flow control, such as acoustic excitation [11], oscillating jet [12], synthetic jet [13], blow and suction air [14], microelectromechanical system (MEMS) [15], and plasma flow control [16]. Plasma flow control has many types of research in the field of flow control because of its simple structure, no moving parts, rapid response and flexible function [17,18,19,20]. The plasma flow control technology is used to delay the flow separation under the low speed condition to improve the stall angle of attack and is also used to reduce the shock angle under the high speed condition to weaken the shock wave [21,22]. The common methods of using plasma to control the flow field are alternating current dielectric barrier discharge (ac-DBD) and nanosecond dielectric barrier discharge (ns-DBD). When the incoming flow velocity is low (less than 0.4 Ma), the ac-DBD control effect is good, mainly by generating body force in the flow field, inducing the near-wall airflow to accelerate, thereby suppressing flow separation [23]. When the incoming flow velocity is higher, it is more suitable for ns-DBD, which produces instantaneous heating in the flow field, and can effectively suppress airfoil flow separation at a large flow velocity (0.8 Ma) [24,25].
Servant et al. proposed a method for optimizing aerodynamic design, which was successfully applied to the design of 3D flying wing by parameterizing complex surfaces and removing invalid noise data by partial differential equation (PED) and response surface methodology (RSM) methods [26]. Huber et al. studied and analyzed the interaction between the vortex structure and the vortex on the upper surface of the DLR-F17 wing model by numerical simulation to evaluate the aerodynamic behavior in the flight envelope in order to study the requirements for stability and maneuverability [27]. Xu et al. used the synthetic jet control method to improve the lateral aerodynamic characteristics of the asymmetric vortex of the flying wing and control the lateral aerodynamic force through the interaction of the asymmetric vortex [28]. Han et al. studied the actuation frequency of ns-DBD to improve the aerodynamic performance of the flying wing under different Reynolds numbers. The results show that there is an optimal actuation frequency and it is more effective to delay the breakdown of the leading edge vortex at low frequencies [29]. Yao et al. studied the optimal actuation position of the ns-DBD to improve the aerodynamic performance of the flying wing. When plasma actuation is applied to the leading edge of the inner and middle wing, the control effect is obvious. The actuation effect is best when the corresponding dimensionless frequency is 1 under low frequency conditions, and the variation of actuation voltage has little effect on the effect of the lift increasing [30].
In this paper, the microsecond pulse surface dielectric barrier discharge (μs-DBD) actuation method is used to carry out flow control experiment on two flying wings with different sizes. The actuation effect of μs-DBD plasma flow control on improving the aerodynamic performance of the flying wing is compared. The energy of μs-DBD is analyzed in this paper. The optimal actuation frequency is studied from the dimensionless frequency by force measurement, and the variation of the flow field on the surface of the symmetric flying wing is analyzed by particle image velocimetry (PIV).

2. Experimental Setup

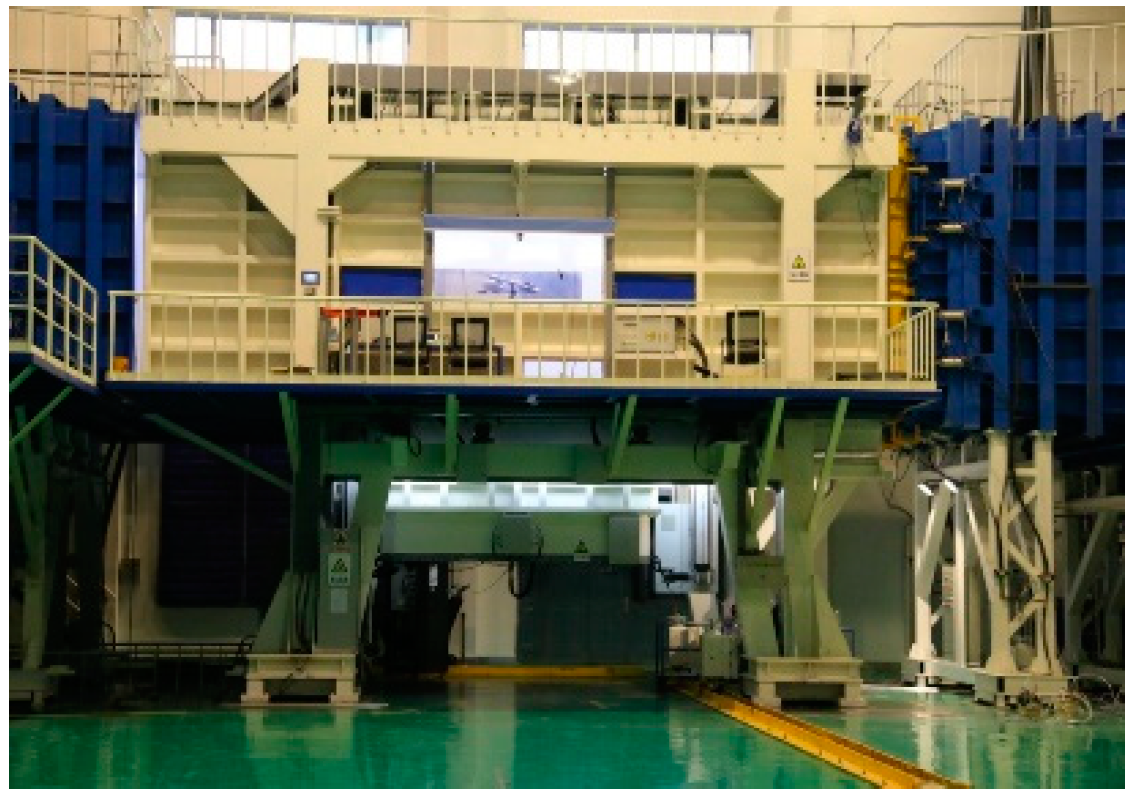
The experiment was carried out in Harbin AVIC Aerodynaiviics Research Institute, and two wind tunnels were selected for experiments. The wind tunnel in Figure 1 is FL-5, which was an open low-speed wind tunnel with an experimental section size of 1.5 m × 1.95 m (diameter × length), a maximum wind speed of 53 m/s, and a turbulence intensity of 1%. Figure 2 shows the FL-51 wind tunnel, which is a single-loop continuous wind tunnel with replaceable open/closed ports. The test section was 11 m × 4.5 m × 3.5 m (length × width × height), and the maximum airflow velocity of the closed experimental section was 100 m/s; the turbulence intensity was 0.10%.
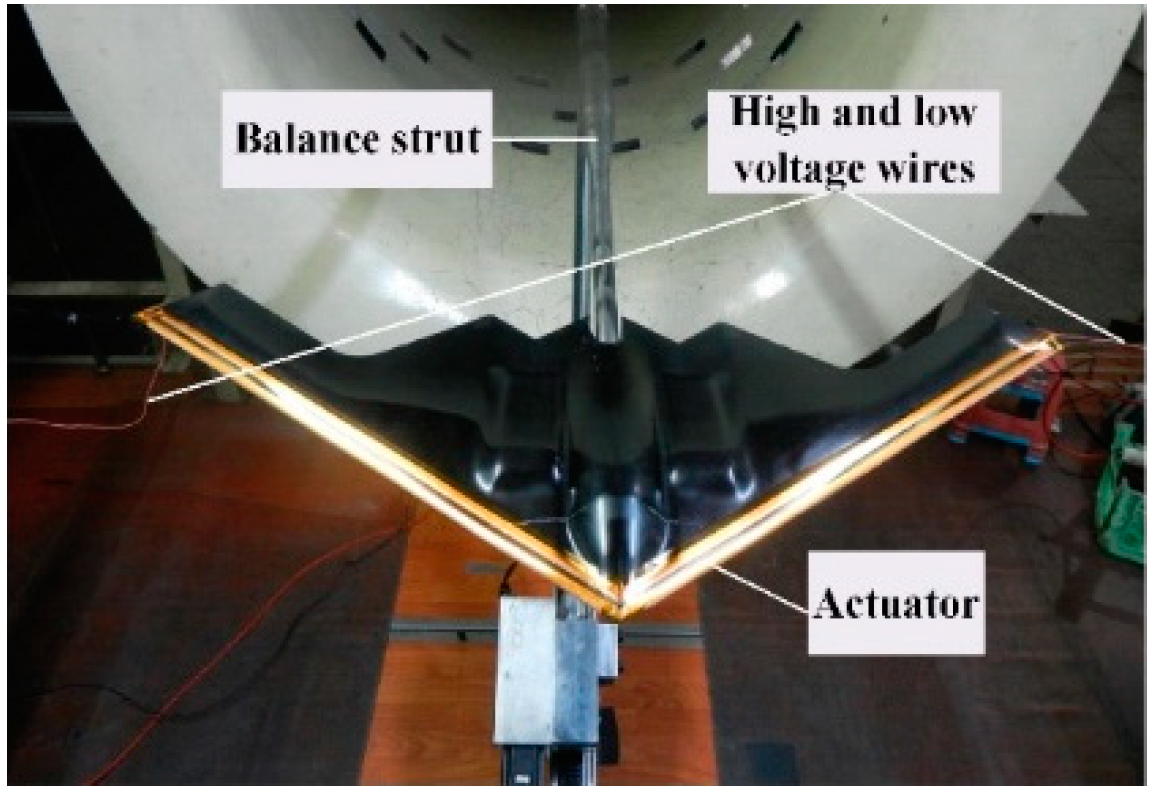
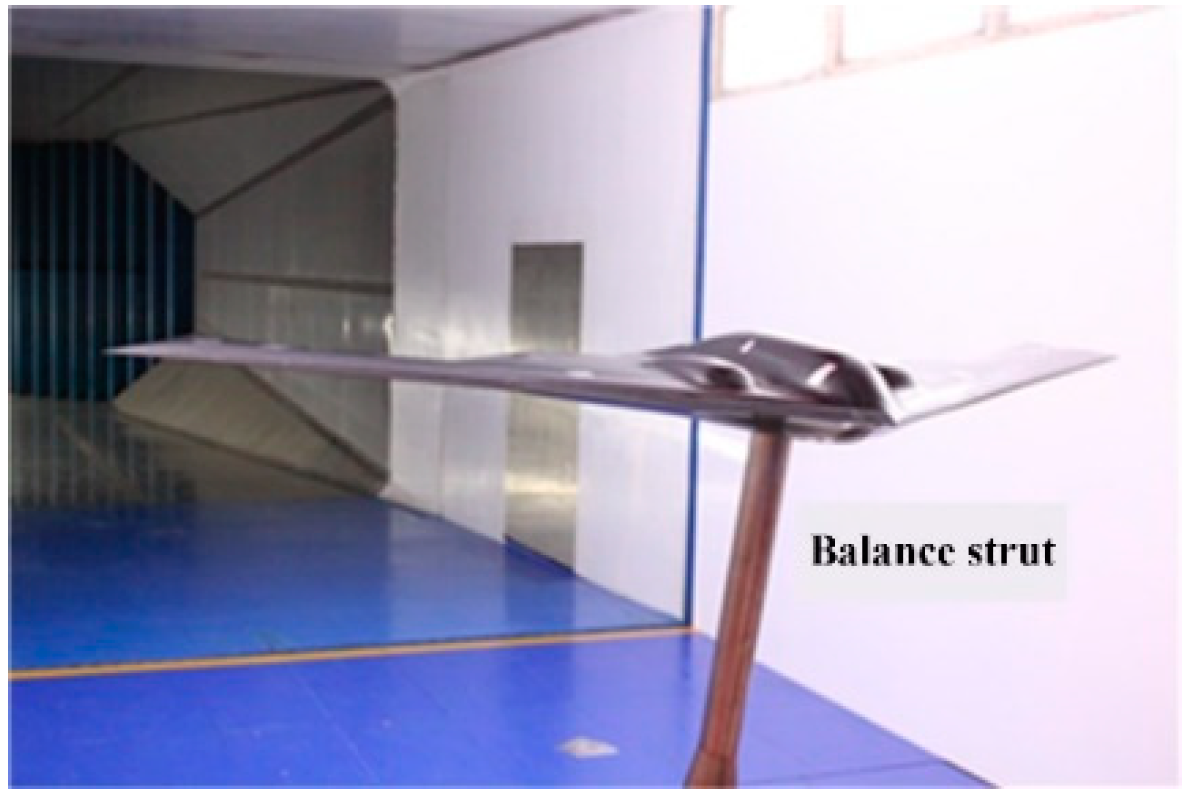
The two kinds of scaling flying wing models are shown in Figure 3 and Figure 4. The small flying wing was double "W" shape, the leading edge sweep angle was 35°, the spanwise length was 0.953 m, the fuselage length was 0.386 m, and the average aerodynamic chord length was 0.214 m. The geometric parameters of the large flying wing were 2.5 times those of the small flying wing.
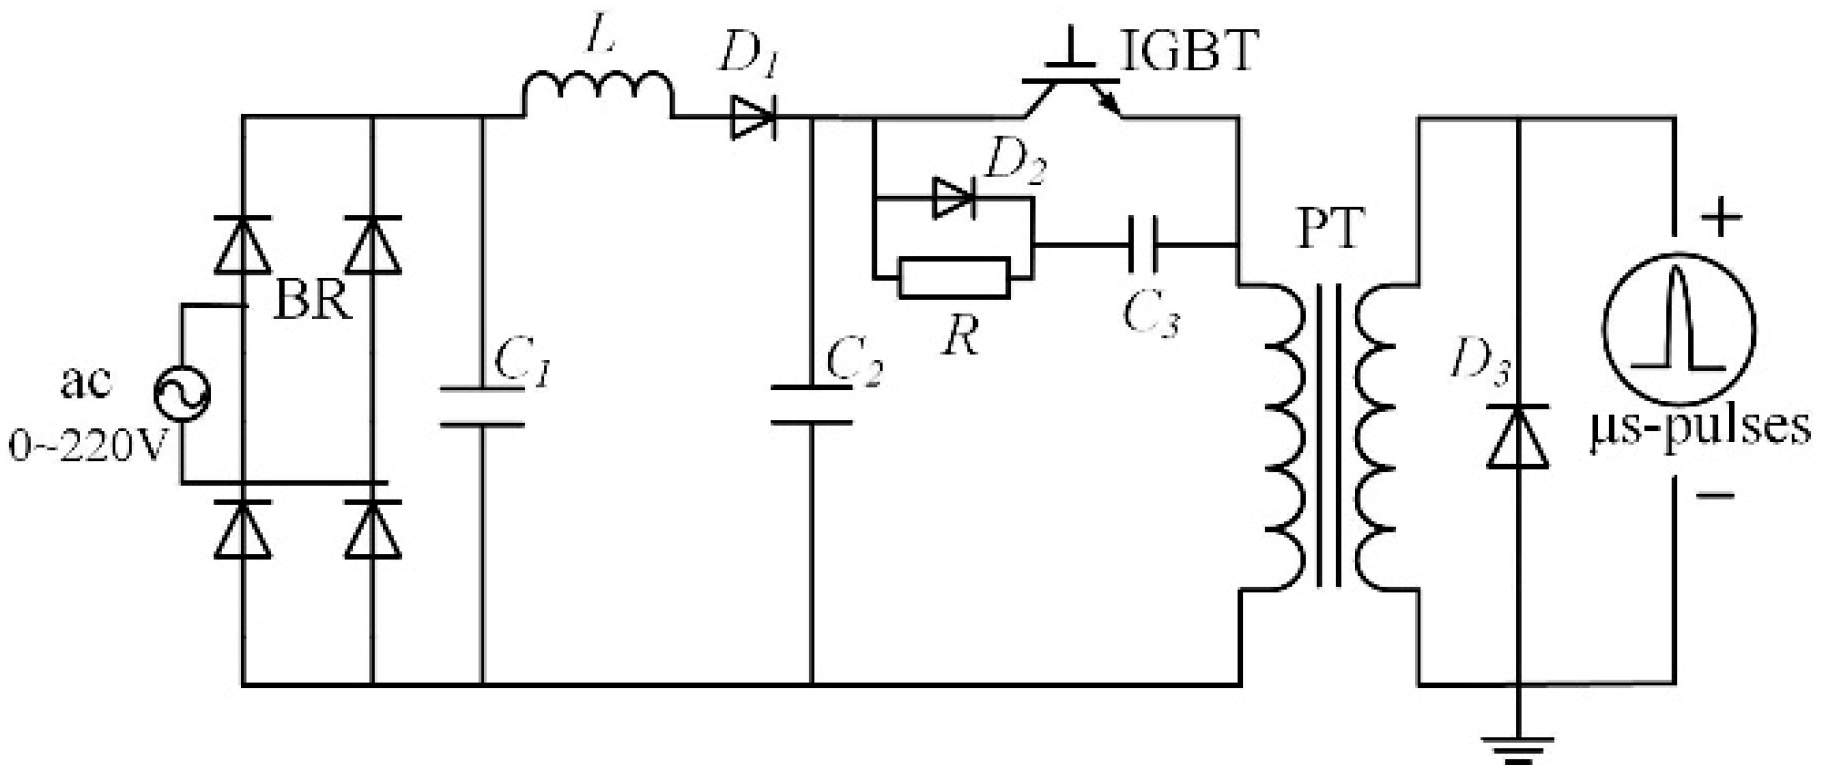
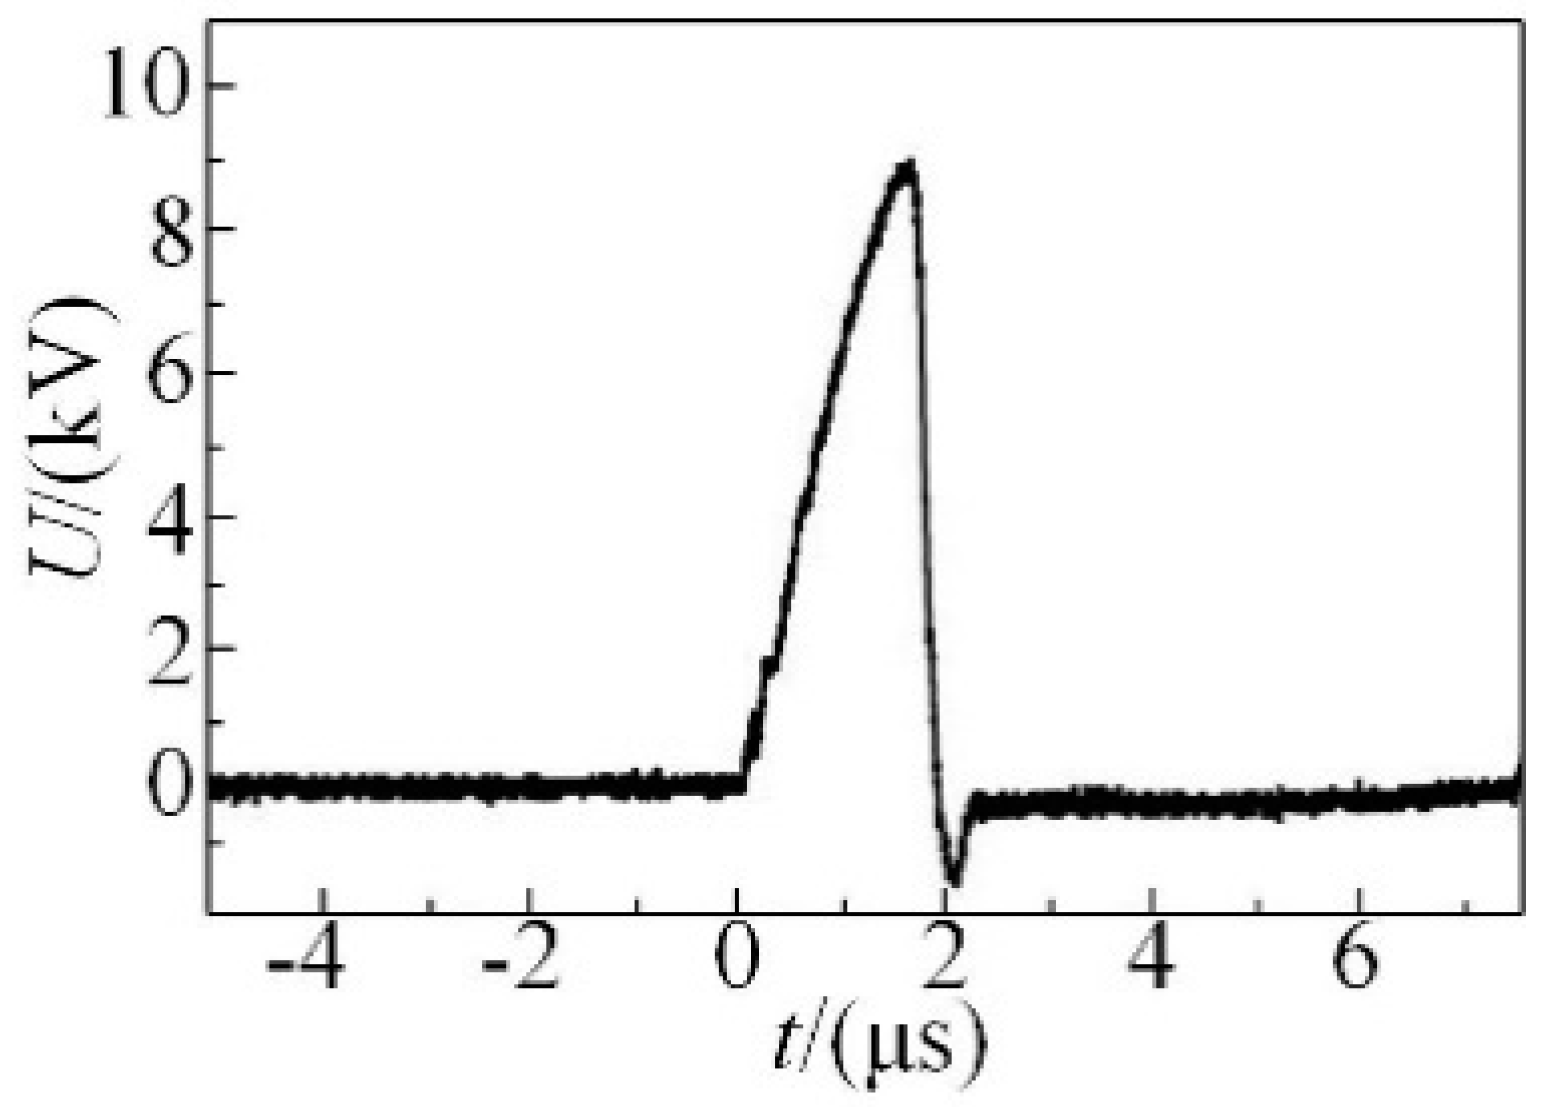
An adjustable parameter microsecond pulse power supply was used for the power supply of the plasma actuator. The schematic circuit diagram is shown in Figure 5. The input AC voltage was between 0–220 V, and a relatively stable DC voltage was obtained through the full bridge rectifier (BR) and the voltage regulator capacitor C1. Then, it charged the primary energy storage capacitor C2 through the charging inductor L and the diode D1. The voltage of the primary storage capacitor C2 was about 1.4 times of the input voltage by C1. When the semiconductor switching insulated gate bipolar transistor (IGBT) was working, C2 performs pulse discharge. A positive high voltage pulse was generated by potential transformer (PT) boost and diode D3 unidirectional conduction. The output actuation voltage (peak voltage) was adjustable from 0 to 10 kV, and the pulse frequency was adjustable from 0 to 2 kHz. The waveform of the no-load maximum output voltage is shown in Figure 6. Each single pulse duration time was microsecond magnitude. When the circuit exported a high-voltage pulse, the actuator performed a single pulse discharge. The number of high-voltage pulses produced in a second was the pulse repetition frequency.
The actuator in the experiment was composed of exposed electrode, covered electrode, and insulation dielectric, as shown in Figure 7. The covered electrode was 3 mm wide and 0.06 mm thick and its lower edge was aligned with the leading edge of the flying wing. The exposed electrode was 2 mm wide and 0.06 mm thick and the upper edge was aligned with the leading edge of the symmetric flying wing. The insulation dielectric was made of polyimide, with a thickness of 0.18 mm, a dielectric constant of 3.5, and could withstand a high voltage of 15 kV. It was placed between the two electrodes to separate them.
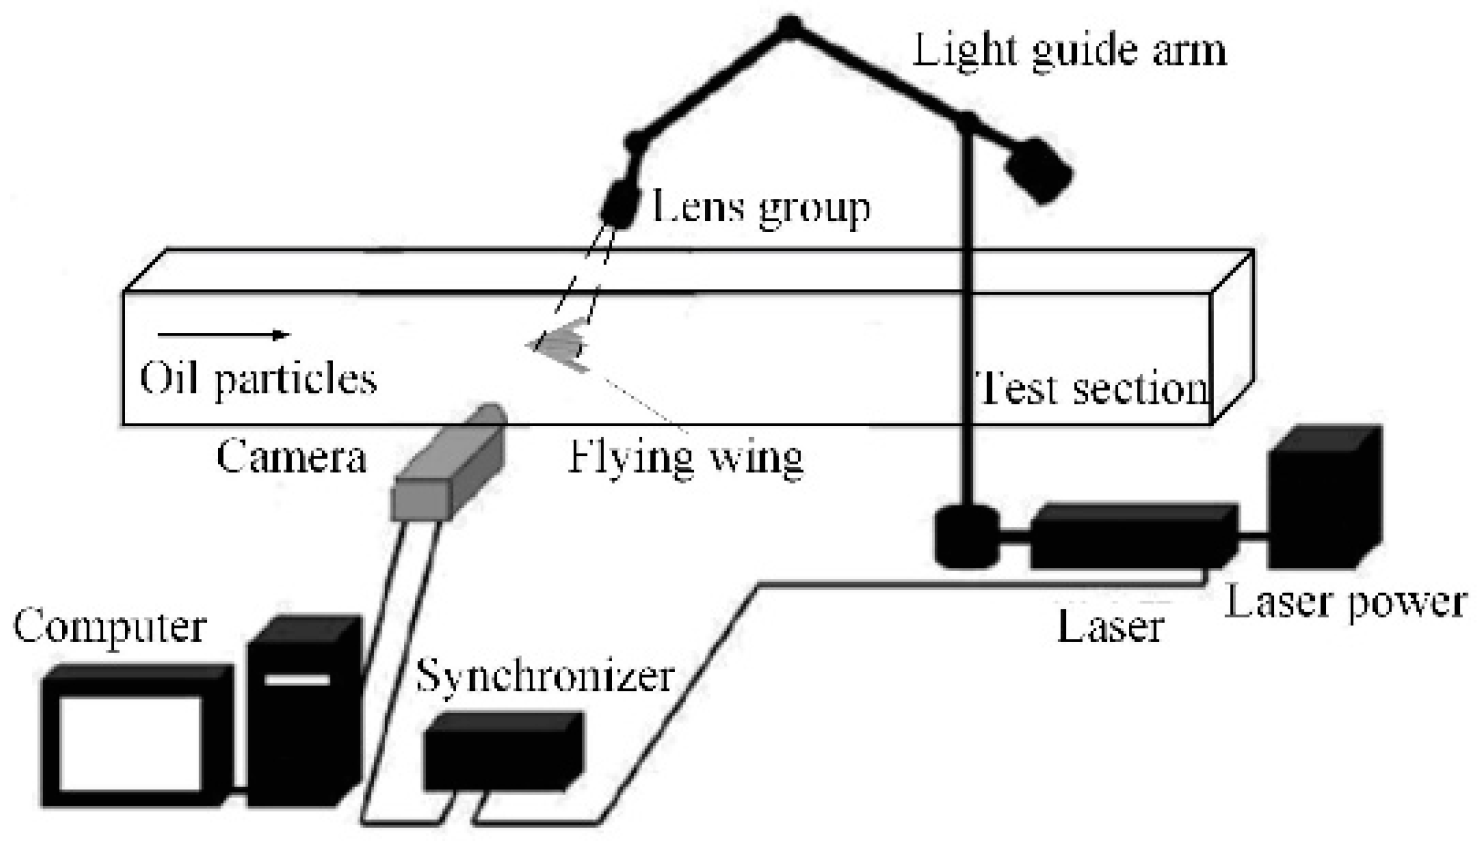
The experiment used the PIV velocity measurement system to measure the flow field parameters by the non-contact method and study the characteristics of the plasma actuation inducing flow field. Figure 8 shows the placement of the PIV test system. The laser was an integrated double Nd:YAG laser with a single pulse energy of up to 500 mJ and a wavelength of 532 nm. The CCD camera has a pixel resolution of 16 MP (4904 × 3280 pixels), a grayscale resolution of 12 bits, and an image acquisition frequency of 3.2 fps. The system was synchronized using a programmable time controller (PTU) with a control signal time resolution of 0.3 ns. PIV data acquisition and processing were carried out by Davis 8.3 software. The tracer particles were produced by pressure atomization. The particle medium was olive oil, and the tracer particles were about 1 μm in diameter. In the time scale of microseconds, two images were taken in succession. The images captured the oil mist particles applied to the flow field. The position of the particles in the second image was obtained by image correlation theory, so as to calculate the velocity of particles in the flow field by the position of particles in two images.
The wind tunnel force measurement was measured by a rod-type strain balance, and the model was supported by a single-strut. The test photographs are shown as Figure 3 and Figure 4. The rod-type six-component strain balance was installed inside the model, and the model is connected with the abdominal support rod through a balance. VXI (VMEbus Extension for Instrumentation) data acquisition system was used for balance force data acquisition.
The small and the large flying wings were tested in two different size wind tunnels, FL-5 and FL-51, respectively. The wind speed of FL-5 was a constant 30 m/s. The wind speed of FL-51 was a constant 75 m/s. The test conditions are shown in Table 1.

3. Experimental Results

3.1. Analysis of Discharge and Energy

3.1.1. Effect of Actuation Length on Discharge Energy

Figure 9a shows the relationship between the length of the actuator and the instantaneous power of the discharge. The corresponding actuator lengths of P1, P2, P3, and P4 were 27 cm, 40 cm, 56 cm, and 112 cm, respectively. It can be seen that with the increase of the length of the actuator, the peak power of the discharge increased. However, the peak power was not proportional to the length of the actuator. As shown in Figure 9b, when the length of the actuator increased from P1 to P2, the peak power changed greatly. The length was increased by 48%, while the peak power was increased by 33%. From P2 to P4, the length was increased by 180% but the peak power was increased by only 47%. Figure 9b also shows the relationship between discharge single pulse energy and actuator length. It can be seen that the total change trend of discharge energy was approximately proportional to the increase of length. The calculation result shows that the discharge energy densities per unit length of P1, P2, P3, and P4 were 17 mJ/m,19 mJ/m,18 mJ/m, and 16 mJ/m, respectively, so the pulse energy per unit length was independent of the length of the actuator.

3.1.2. Effect of Actuation Voltage on Discharge Energy

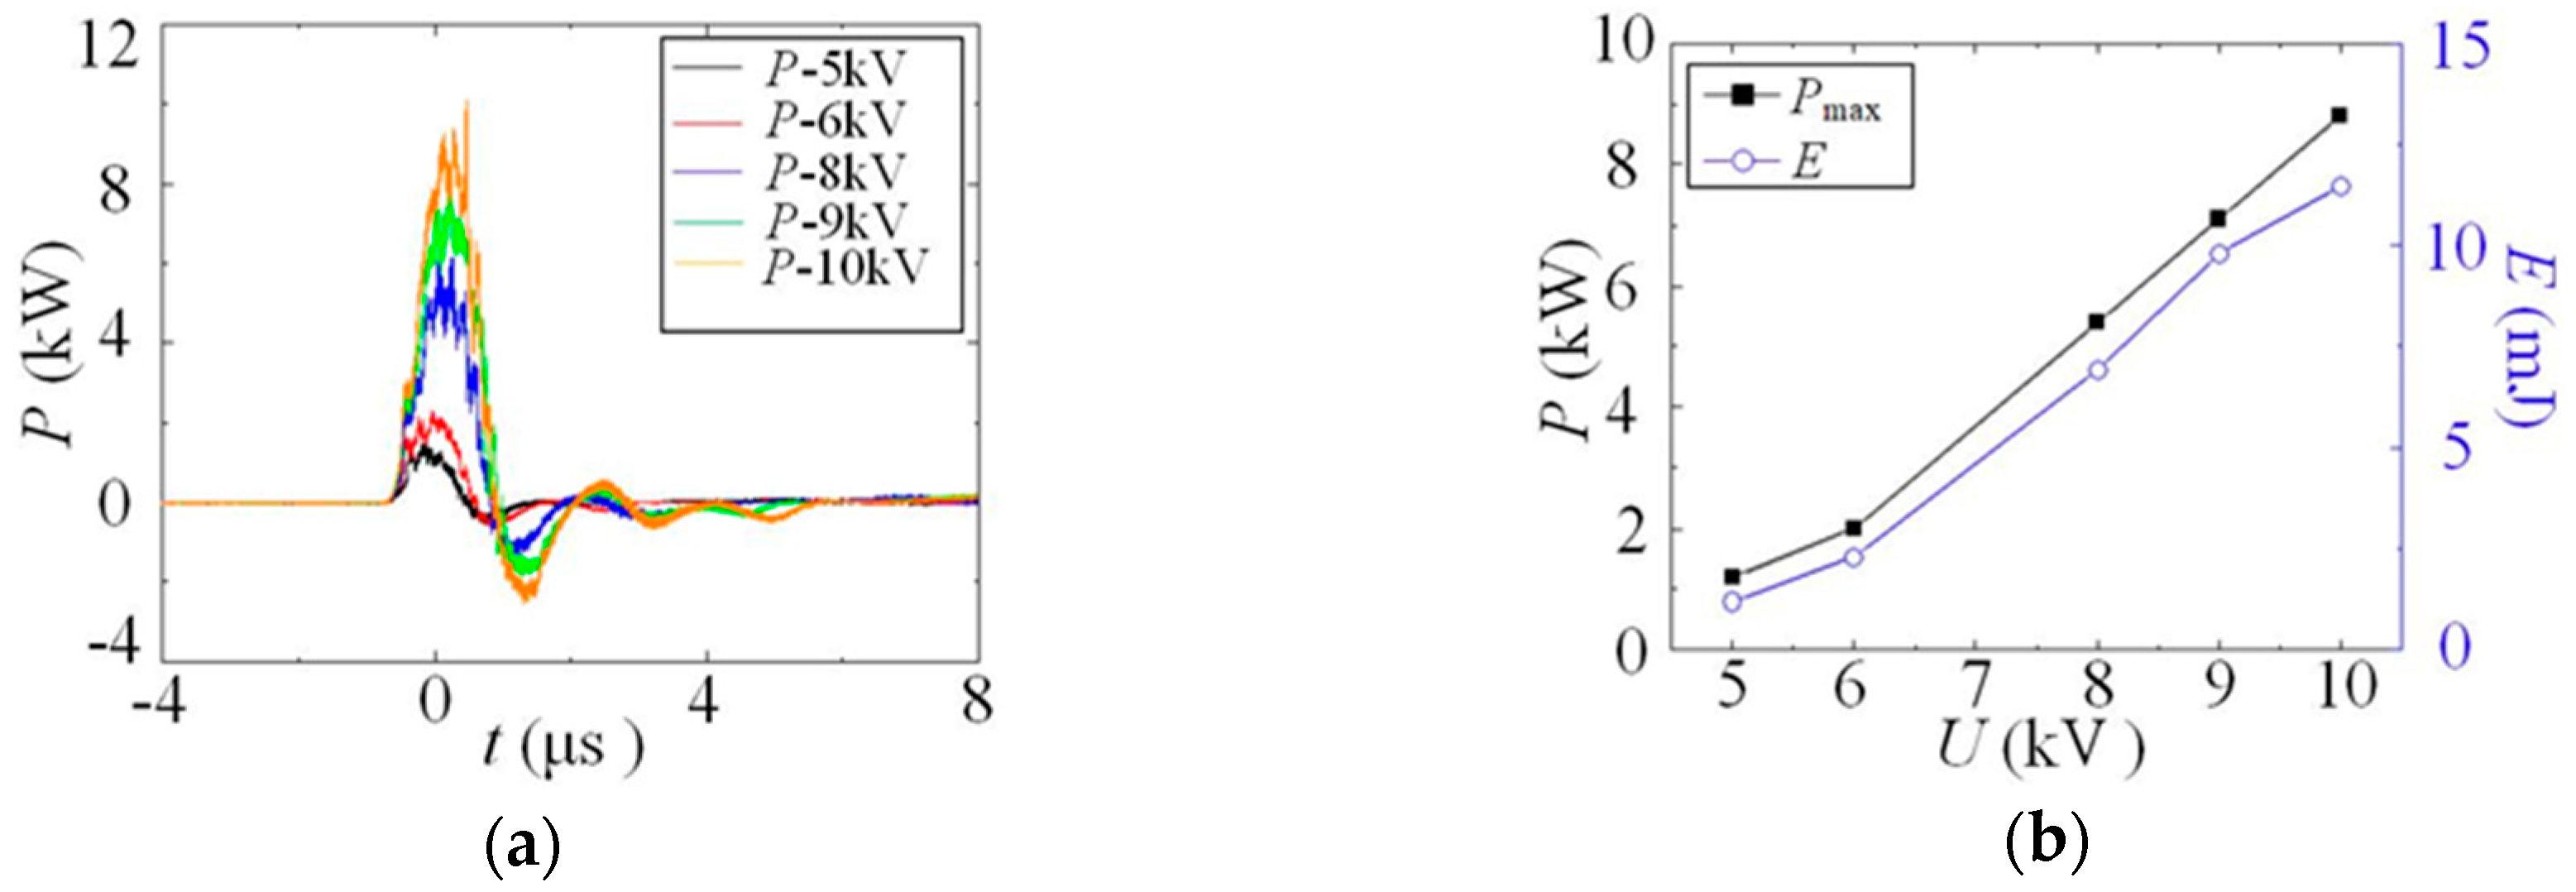
Figure 10a shows the relationship between the actuation voltage and the instantaneous power of the discharge. As the discharge voltage increased, the discharge power increased, the instantaneous power peak also increased, and the time scale of the discharge power remained substantially unchanged. The actuation voltage was below 8 kV, the power was small, and the discharge intensity was relatively low. When the actuation voltage was above 8 kV, the discharge intensity was high. This is because the electric field strength increased and more ionized positive and negative particles were directed to the two poles of the actuation under the action of the electric field force. The current increased more, and the power output power increased significantly. Figure 10b also shows the relationship between the actuation voltage and the peak power and discharge energy. It can be seen that the variation of discharge energy was similar to that of peak power. As the actuation voltage increased, both the peak power and the discharge energy increased.

3.1.3. Effect of Actuation Frequency on Discharge Energy

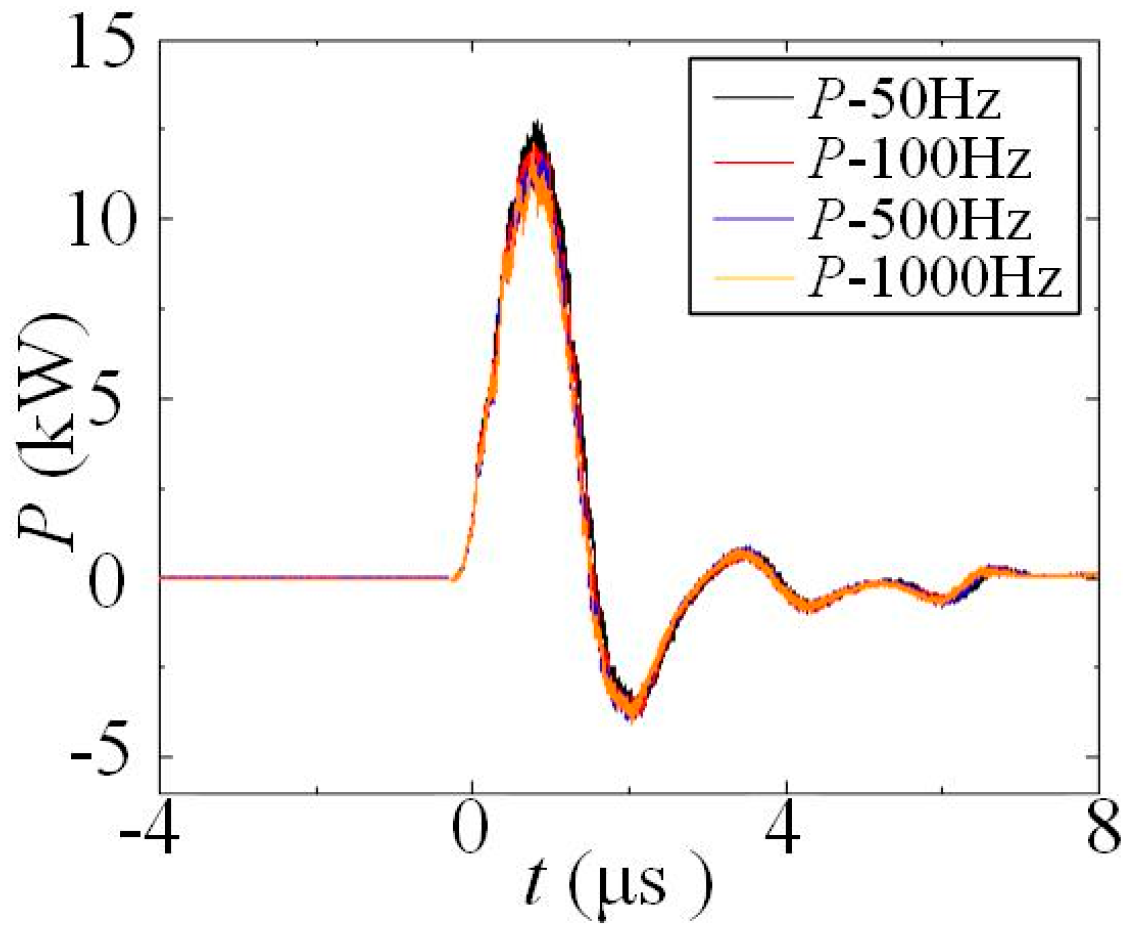
Figure 11 shows the relationship between the actuation frequency and the discharge instantaneous power. It can be seen that when the actuation voltage was the same, the discharge instantaneous power curves at different actuation frequencies coincided well, indicating that the discharge power was basically unaffected by the actuation frequency, and the single pulse energy of the discharge was independent of the actuation frequency. It also shows that the effect of frequency change on the flow field was not affected by the discharge, but the result of the unsteady disturbance was caused by different actuation frequencies in the flow field.

3.2. Force Characteristics

When the airflow flows through the surface of the symmetric flying wing at a certain speed, the velocity in its vertical direction is different, which is the most obvious near the wall, and there is a thin boundary layer. When the angle of attack of the symmetric flying wing exceeds the critical value, the boundary layer is separated, and the separation vortex seriously disturbs the flow field, thus the aerodynamic performance of the symmetric flying wing is poor. The plasma flow control effect of two flying wing models under different actuation frequencies is studied in this paper. According to the similarity criterion of Strouhal, the dimensionless frequency formula is F+ = f × l/U, in which f is the output actuation frequency of the power supply, l is the average aerodynamic chord length of the symmetric flying wing model, and U is the incoming flow velocity. In order to ensure that the dimensionless frequency was consistent, the incoming flow velocity of the large flying wing was 2.5 times that of the small flying wing. When the incoming flow velocity of the small flying wing was 30 m/s, the incoming flow velocity the large flying wing was 75 m/s. The dimensional frequencies F+ were 0.36, 0.71, 1.07, 2.14, 3.57 and 7.13 with corresponding actuation frequencies f of 50 Hz, 100 Hz, 150 Hz, 300 Hz, 500 Hz, and 1000 Hz, respectively, to study the effect of the unsteady actuation on the lift and drag of the two-scale flying wing model.
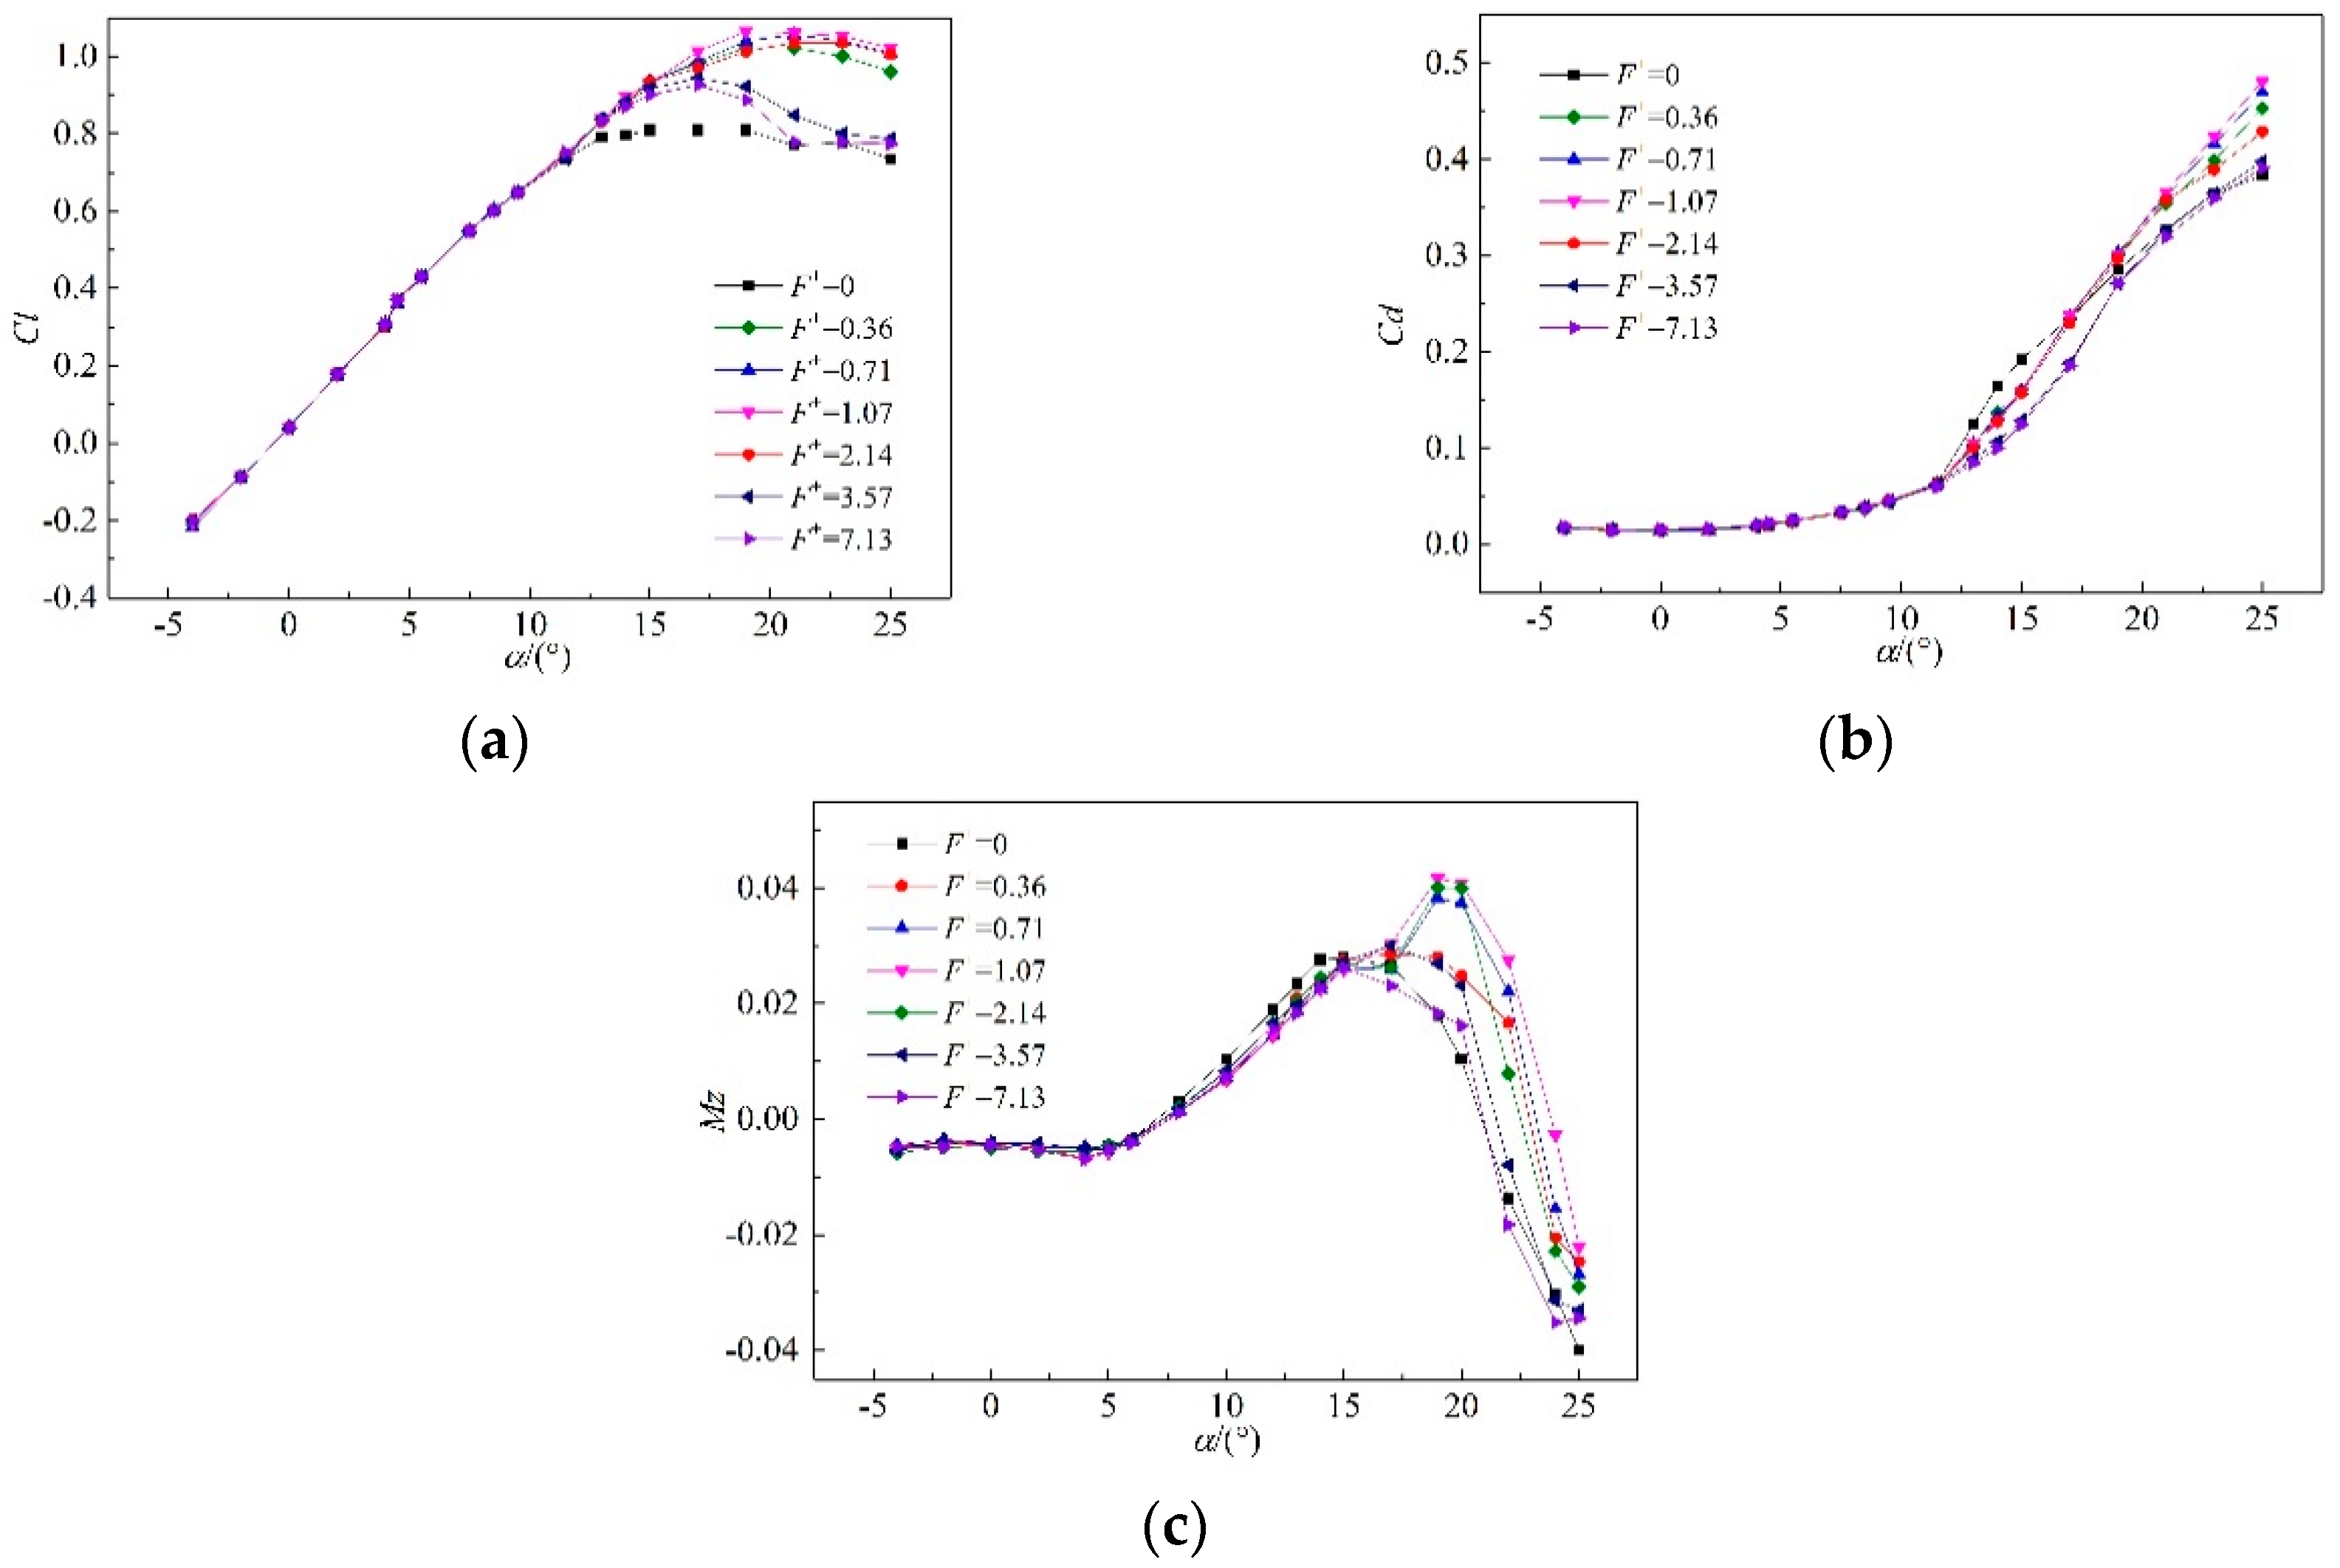
Figure 12 shows the lift, drag, and pitch moment coefficient curves of the small flying wing at different dimensionless frequencies when the incoming flow velocity was 30 m/s. Figure 12a shows that when the dimensionless frequency was between 0.71 and 2.14, the effect of actuation increase is obvious. The optimal dimensionless frequency was 1.07 and the maximum lift coefficient increased from 0.81 to 1.06, which was increased by 30.9%. The stall angle of attack was delayed from 15° to 19°. The maximum lift coefficient increased by 28.5% and 25.3% under the dimensional frequency actuations of 0.71 and 2.14, respectively, and the stall angle of attack was delayed by 4°. When the dimensionless frequency was greater than 1, with the increase of the corresponding actuation frequency, the increasing effect was reduced and the ability to suppress the flow separation was reduced. Figure 12b shows the variation trend of the drag coefficient with the dimensionless frequency. When the angle of attack was between 12° and 17°, the drag coefficient was gradually reduced with the increase of the dimensionless frequency, indicating that the drag reduction effect was good at high frequency actuation when the angle of attack was greater than 12°. For low frequency actuation, it can be seen that when the angle of attack was greater than 17°, the drag coefficient was greater than that without actuation, which indicates that the low-frequency actuation had a negative effect on the drag when the attack angle was greater than 17°, and the drag increased. At the angle of attack of 15°, the dimensionless frequency was 1.07, the lift coefficient could be increased by 15.1%, the drag coefficient could be reduced by 17.3%, and the effect of lift increasing and drag decreasing was good.
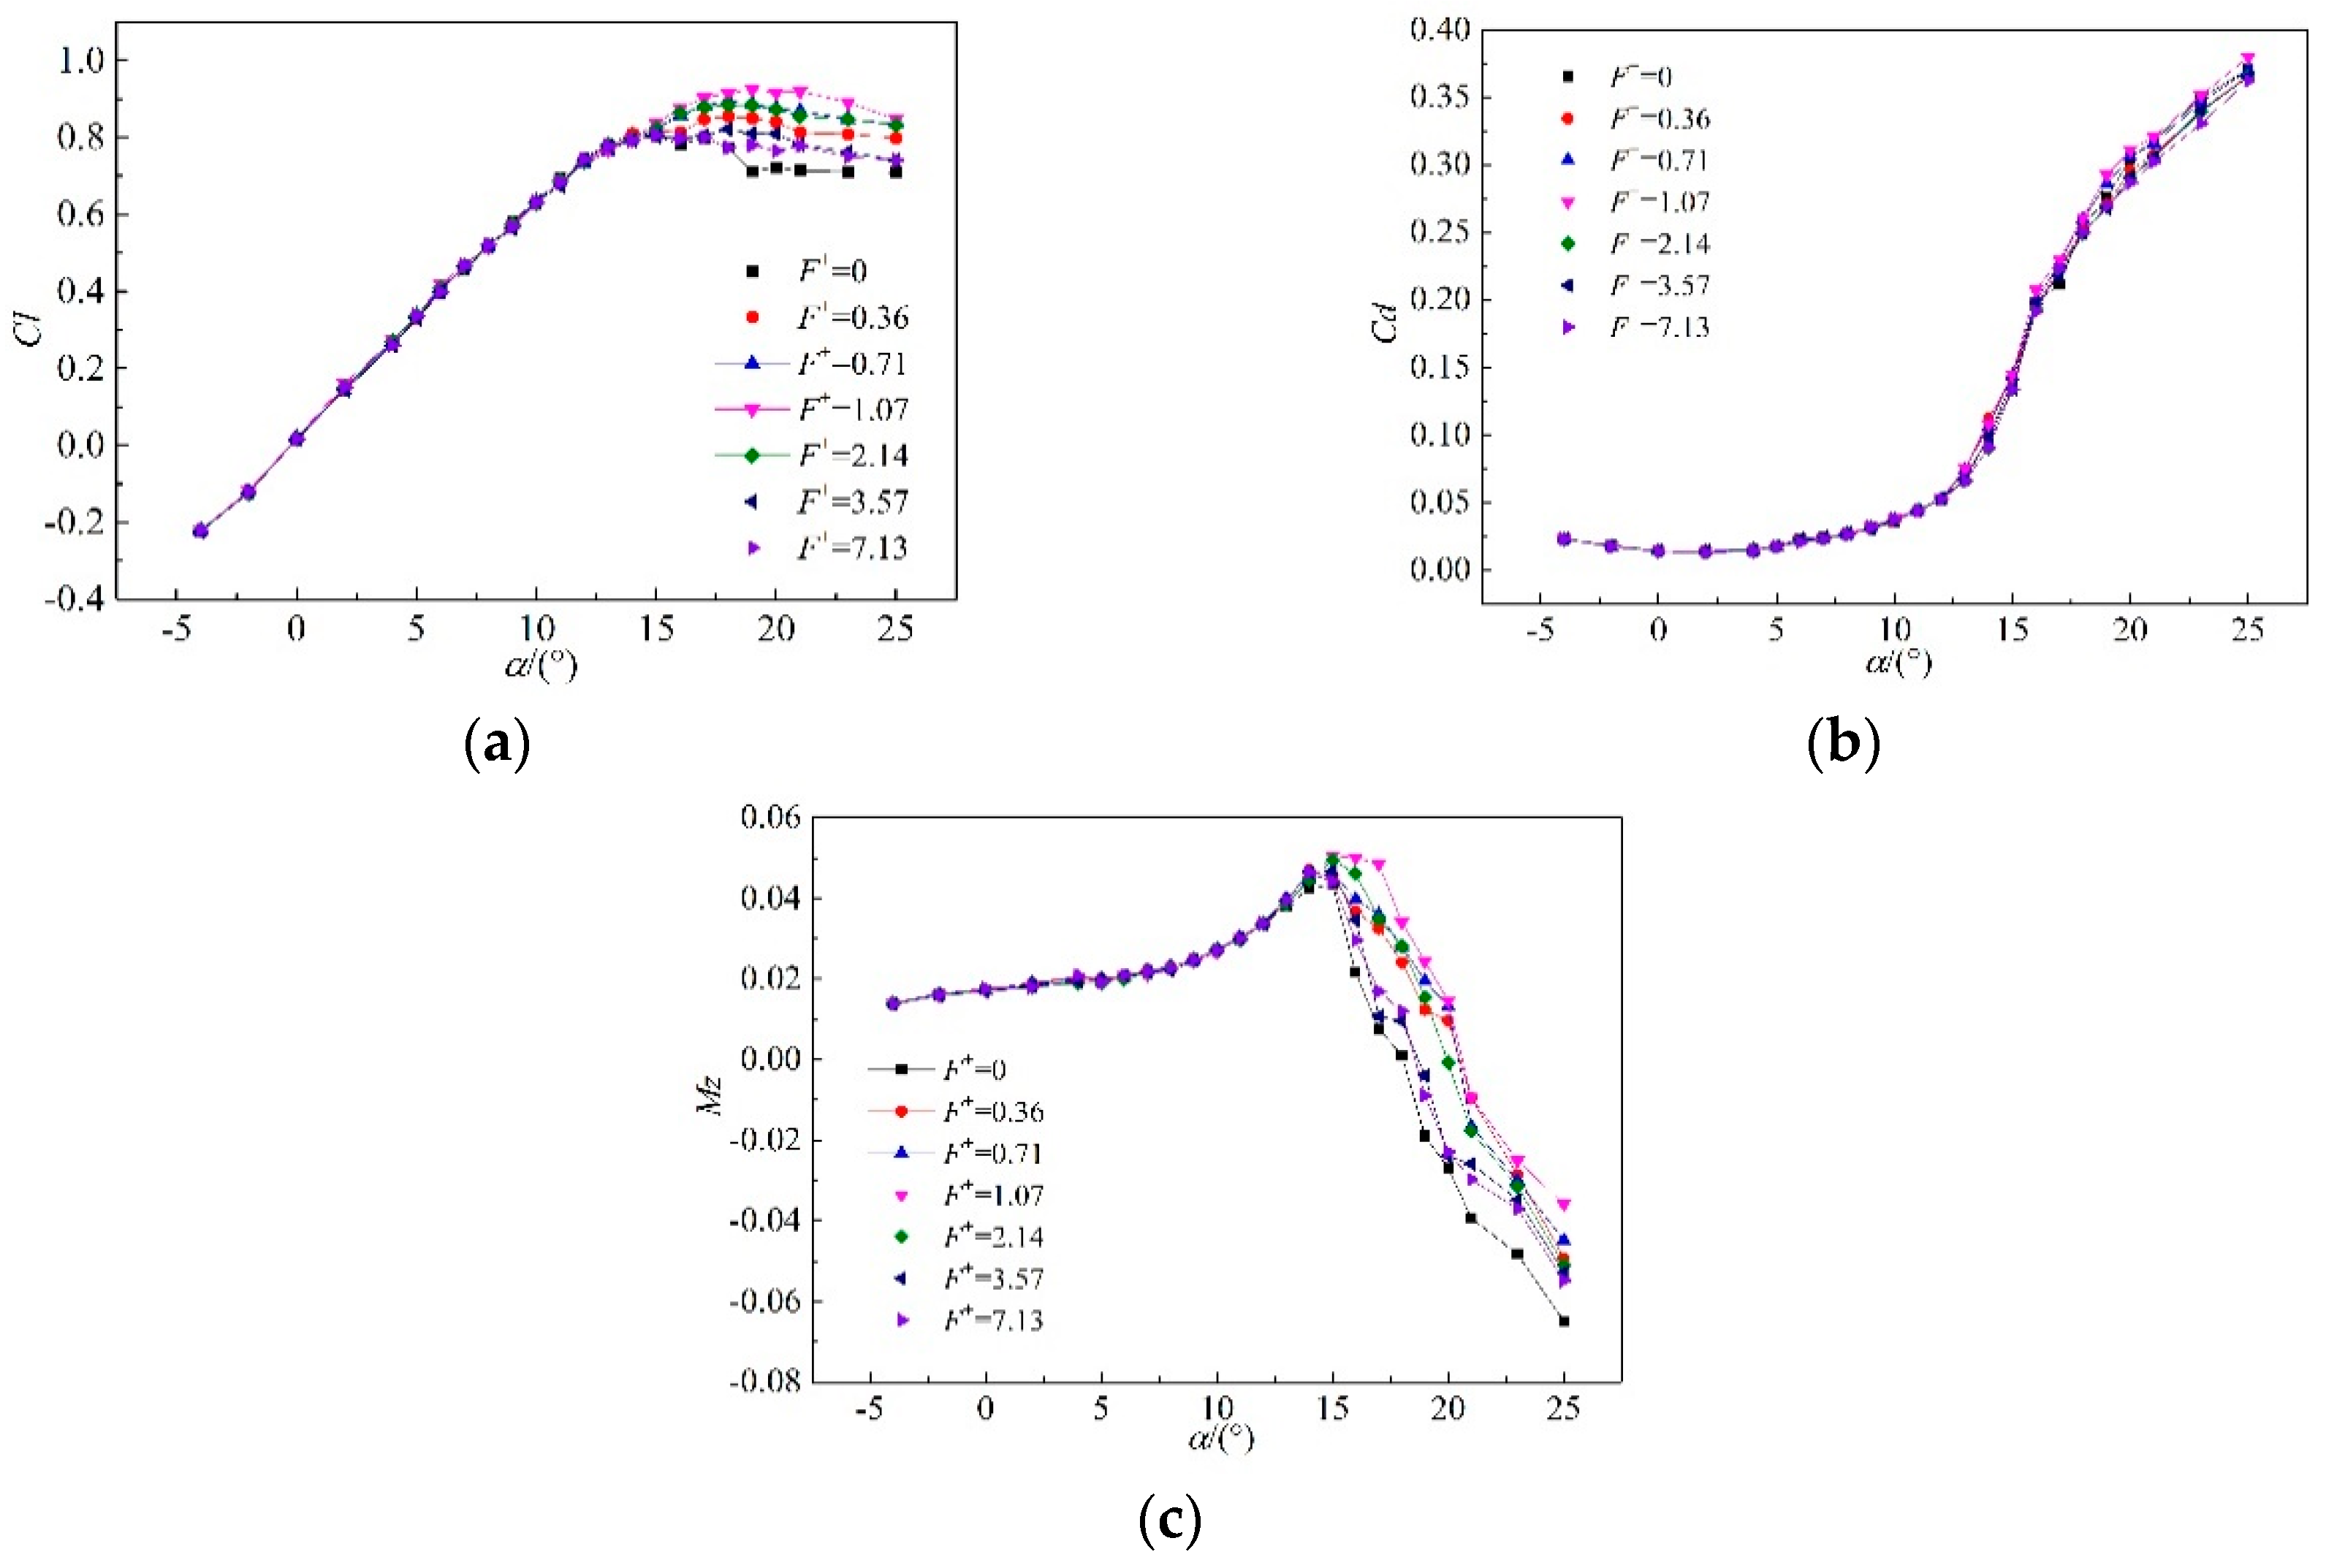
Figure 13 shows the lift, drag, and pitch moment coefficient curves of the large flying wing at different dimensionless frequencies when the flow velocity was 75 m/s. With the increase of model size and incoming flow velocity, the changing trend of lift coefficient curve without actuation corresponding F+ = 0 was the same as that at 30 m/s, and the stall angle of attack was 15°. The microsecond pulse plasma actuation could also improve the aerodynamic performance of the large flying wing surface and delay the stall separation. It can be seen from Figure 13a that the actuation effect was more obvious when the dimensionless frequency was between 0.71 and 2.14, and the optimal dimensionless frequency was 1.07. The maximum lift coefficients corresponding to the dimensionless frequencies of 0.71, 1.07, and 2.14 were increased by 10.4%, 15.1%, and 10%, respectively, and the stall angles of attack were delayed by 3°, 4° and 3°, respectively. As can be seen in conjunction with Figure 12a and Figure 13a, the effect of high frequency actuation to improve the aerodynamic performance of the symmetric flying wing surface was lower than that of low frequency. It can be seen from Figure 13b that the air resistance of the large flying wing was affected by the actuation frequency. When the actuation was performed under low frequency condition, the drag coefficient was greater than that without plasma actuation, but the drag coefficient under the high frequency actuation condition was lower than that of no plasma actuation.
For different sizes of flying wings, the trends of the lift and drag coefficient were basically consistent at different actuation frequencies, with the same unit intensity actuation carried out at different incoming flow velocities. When the dimensionless frequency F+ was equal to 1, the actuation effectwas most obvious and the similarity criterion was matched. The increase of the maximum lift coefficient of the large flying wing was less than that of the small flying wing. Because the incoming flow velocity increased, the separation vorticity in the flow field became stronger. It was necessary to inject more unit intensity energy into the flow field to suppress the separation of the surface boundary layer.
Figure 12c shows the pitch moment coefficient curve at different dimensionless frequencies with an incoming flow velocity of 30 m/s. When there was no plasma actuation, the pitch moment coefficient increased as the angle of attack increased under the stall angle of attack. When the stall angle of attack was increased to 15°, the symmetric flying wing was completely stalled and the pitch moment reached the maximum value, with the two corresponding to each other. After the actuation was applied, the pitch moment coefficient could still be increased until the angle of attack was 19°. Since the actuation still had the lift increment after the 15° stall angle of attack and the pitch moment of the symmetric flying wing continued to increase, the flow separation was effectively suppressed. The dimensionless frequencies were 0.71, 1.07 and 2.14; the pitch moment coefficient increased significantly, indicating that the lift increment was significant. Figure 13c shows the pitch moment coefficient curve at different dimensionless frequencies with an incoming flow velocity of 75 m/s. When the dimensionless frequency F+ was equal to 1, the inflection point of the pitch moment coefficient curve was delayed by 2°, while in other dimensionless frequencies, the inflection point was the same as that of no plasma actuation. On the one hand, there was an optimal actuation frequency when the unsteady actuation dimensionless frequency was equal to 1, which was related to the incoming flow velocity, the feature size of the symmetric flying wing model. On the other hand, the effect of flow control was different from the same actuation intensity at different inflow speeds.
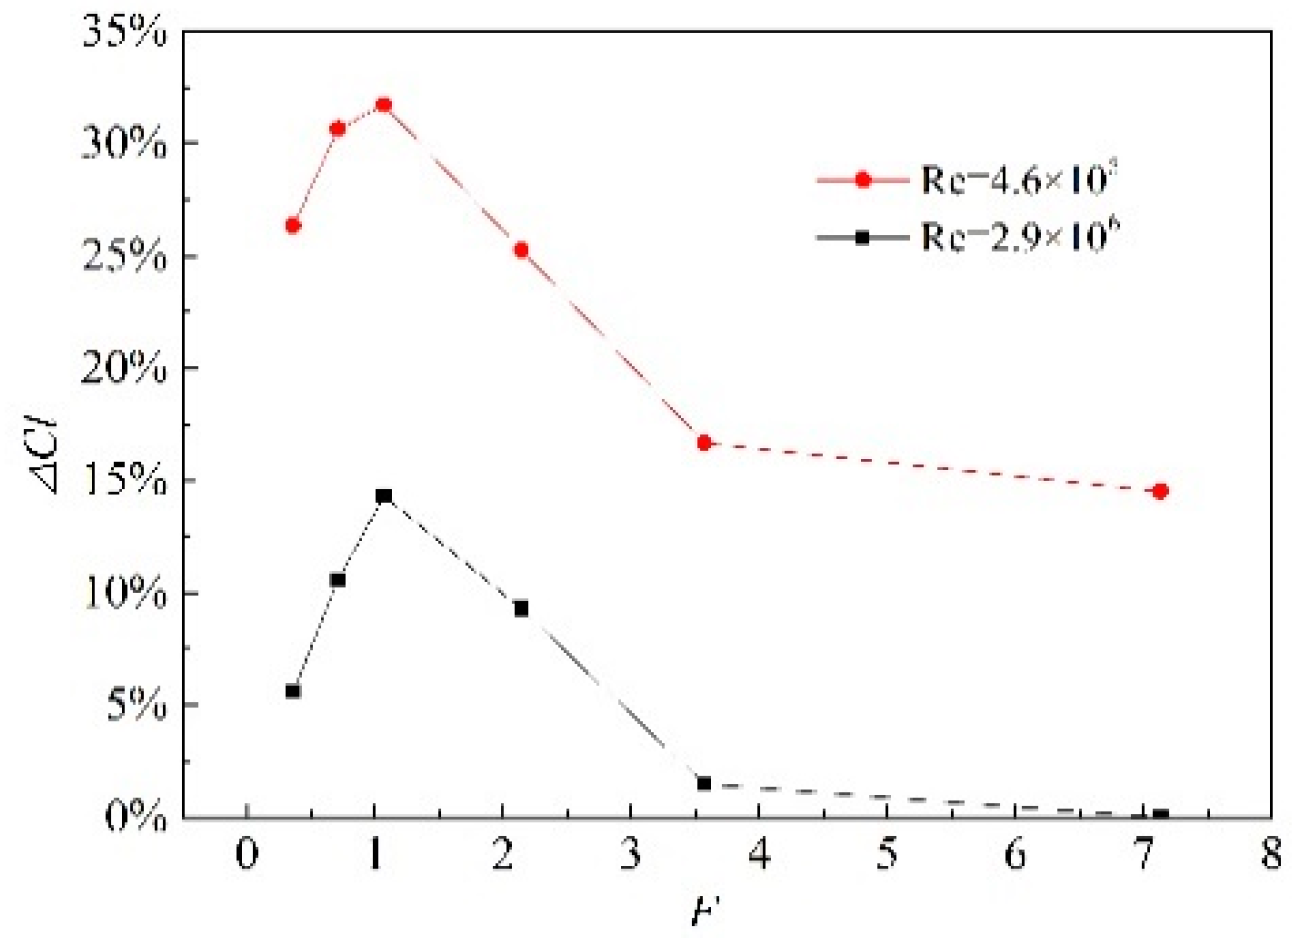
The Reynolds number of the small flying wing corresponding to the incoming flow velocity of 30 m/s was 4.6 × 10⁵, and the Reynolds number of the large flying wing corresponding to the incoming flow velocity of 75 m/s was 2.9 × 10⁶. As shown in Figure 14, with the increase of the dimensionless frequency, the variation trend of the lift coefficient increment under different Reynolds numbers was consistent. The lift coefficient increment increased first and then decreased. The increment of the plasma actuation at low Reynolds number was more obvious. It can be seen that the optimal dimensionless frequency of flow control at low velocity was independent of the Reynolds number. However, the higher the Reynolds number, the greater the inertial force in the flow field, resulting in the flow field not being easy to control after stalling. Therefore, the effect of the same intensity disturbance on controlling the flow field stall separation at different incoming flow velocities was different. Increasing the intensity of unsteady actuation to improve the lift coefficient of the symmetric flying wing model at a higher Reynolds number and increasing the pitching moment coefficient are worthy of further study.
Han et al. studied ns-DBD plasma actuation used for aerodynamic control on the small flying wing. Their results show that the ns-DBD plasma actuator offers tremendous potential as an active flow control device to enhance the aerodynamic performance of the present model. There exists an optimal actuation frequency (f = 0.2 kHz) to reach maximum lift coefficient value. Given the high pulsed frequency of f = 1 kHz, an obvious decrease in the drag coefficient is observed. The results indicate that a 44.5% increase in the lift coefficient, a 34.2% decrease in the drag coefficient and a 22.4% increase in the maximum lift-to-drag ratio could be achieved as compared with the baseline case. In this article, μs-DBD plasma actuation was used for controlling the aerodynamics performance of two different scaling flying wings. The optimal frequency of the plasma actuation was 150 Hz and the corresponding dimensionless frequency F+ was 1.07. The effect of low frequency actuation was better than that of higher frequency. After actuation, the stall angle of attack of the small flying wing was delayed by 4°, the maximum lift coefficient was increased by 30.9%, and the drag coefficient could be reduced by 17.3%. After the large flying wing was actuated, the stall angle of attack was delayed by 4°, the maximum lift coefficient was increased by 15.1%, but the drag coefficient was increased.

3.3. Flow Field Characteristics

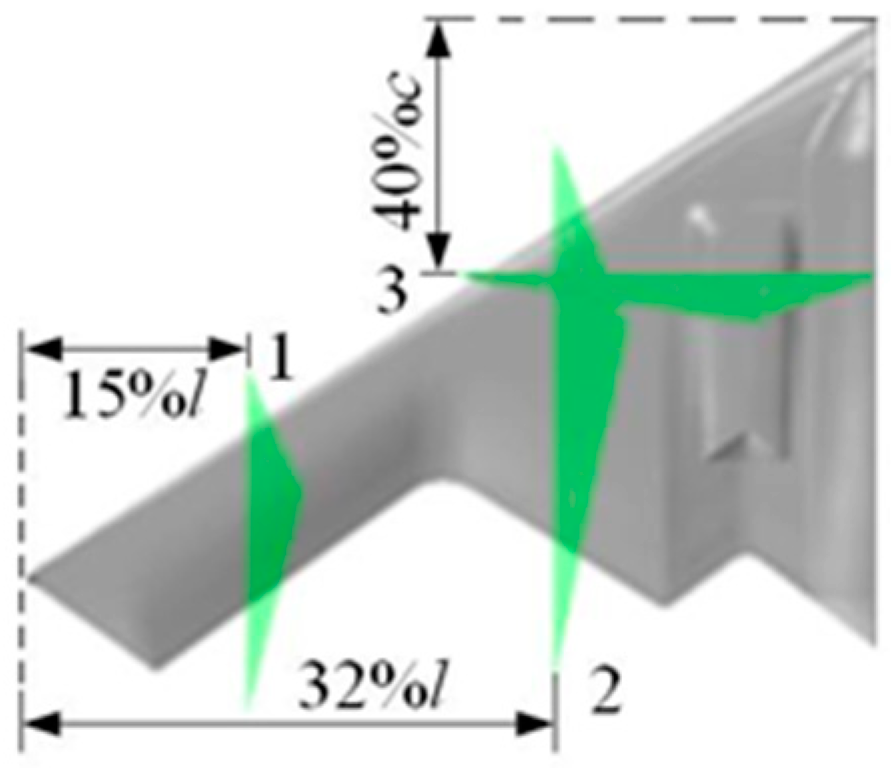
The structure of the symmetric flying wing is complex, and the flow field flowing through its surface is also very complicated. Through the PIV test method, the state of the surface flow fields of the two flying wing models is clearly and intuitively observed. Three cross-sections were taken in the chord direction and the span direction of the symmetric flying wing. As shown in Figure 15, the cross-sections 1 and 2 were located at 15% l and 32% l from the left wing tip, respectively, and cross-section 3 was located at 40% c from the forefront of the left wing.
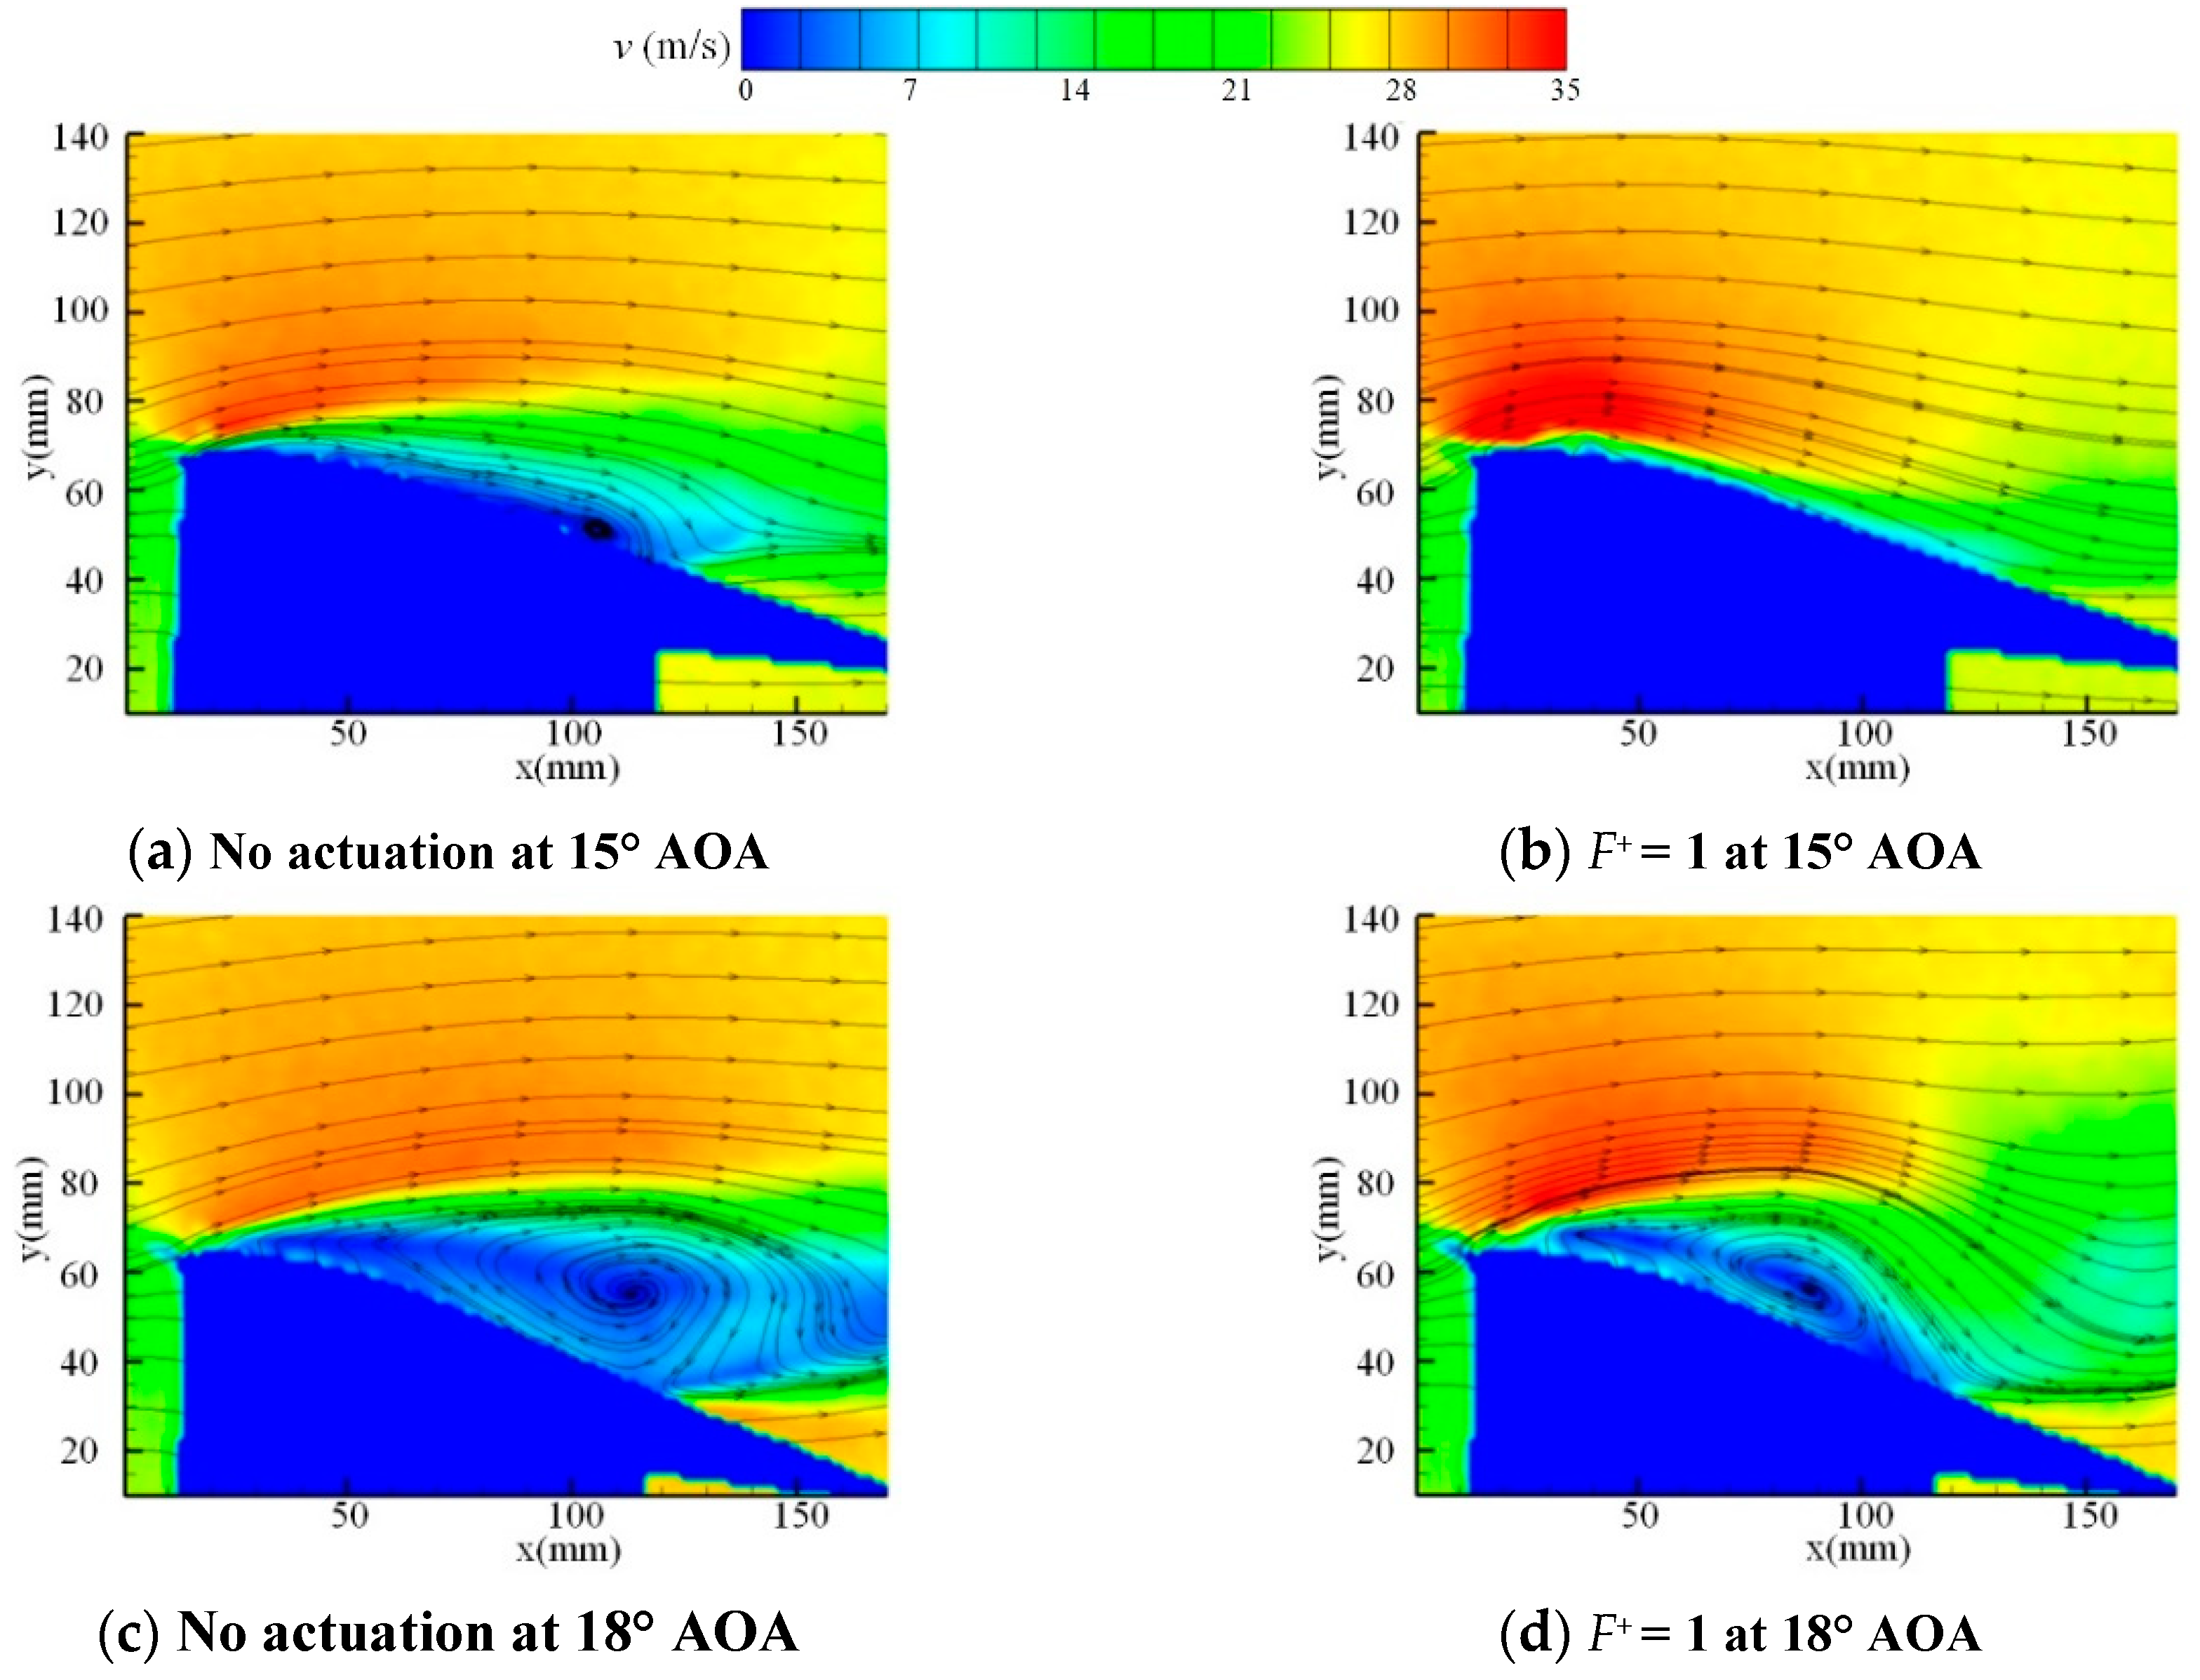
The flow field of measured cross-section 1 is shown in Figure 16. When the angle of attack (AOA) was 15°, the flow field measurement results in Figure 16a show that the flow separation had developed to the leading edge of the wing. After the plasma actuation was applied, the separation was completely suppressed and the leading edge airflow velocity increased slightly as shown in Figure 16b. When the angle of attack was 18°, the flow separation on the upper surface of the wing was very serious, and a large area of reflux appeared, as shown in Figure 16c. After the actuation, the flow separation could no longer be completely suppressed, as shown in Figure 16d; a large separation bubble was formed on the upper surface of the wing, and the flow velocity of the leading edge of the wing was slightly higher than that of no plasma actuation.
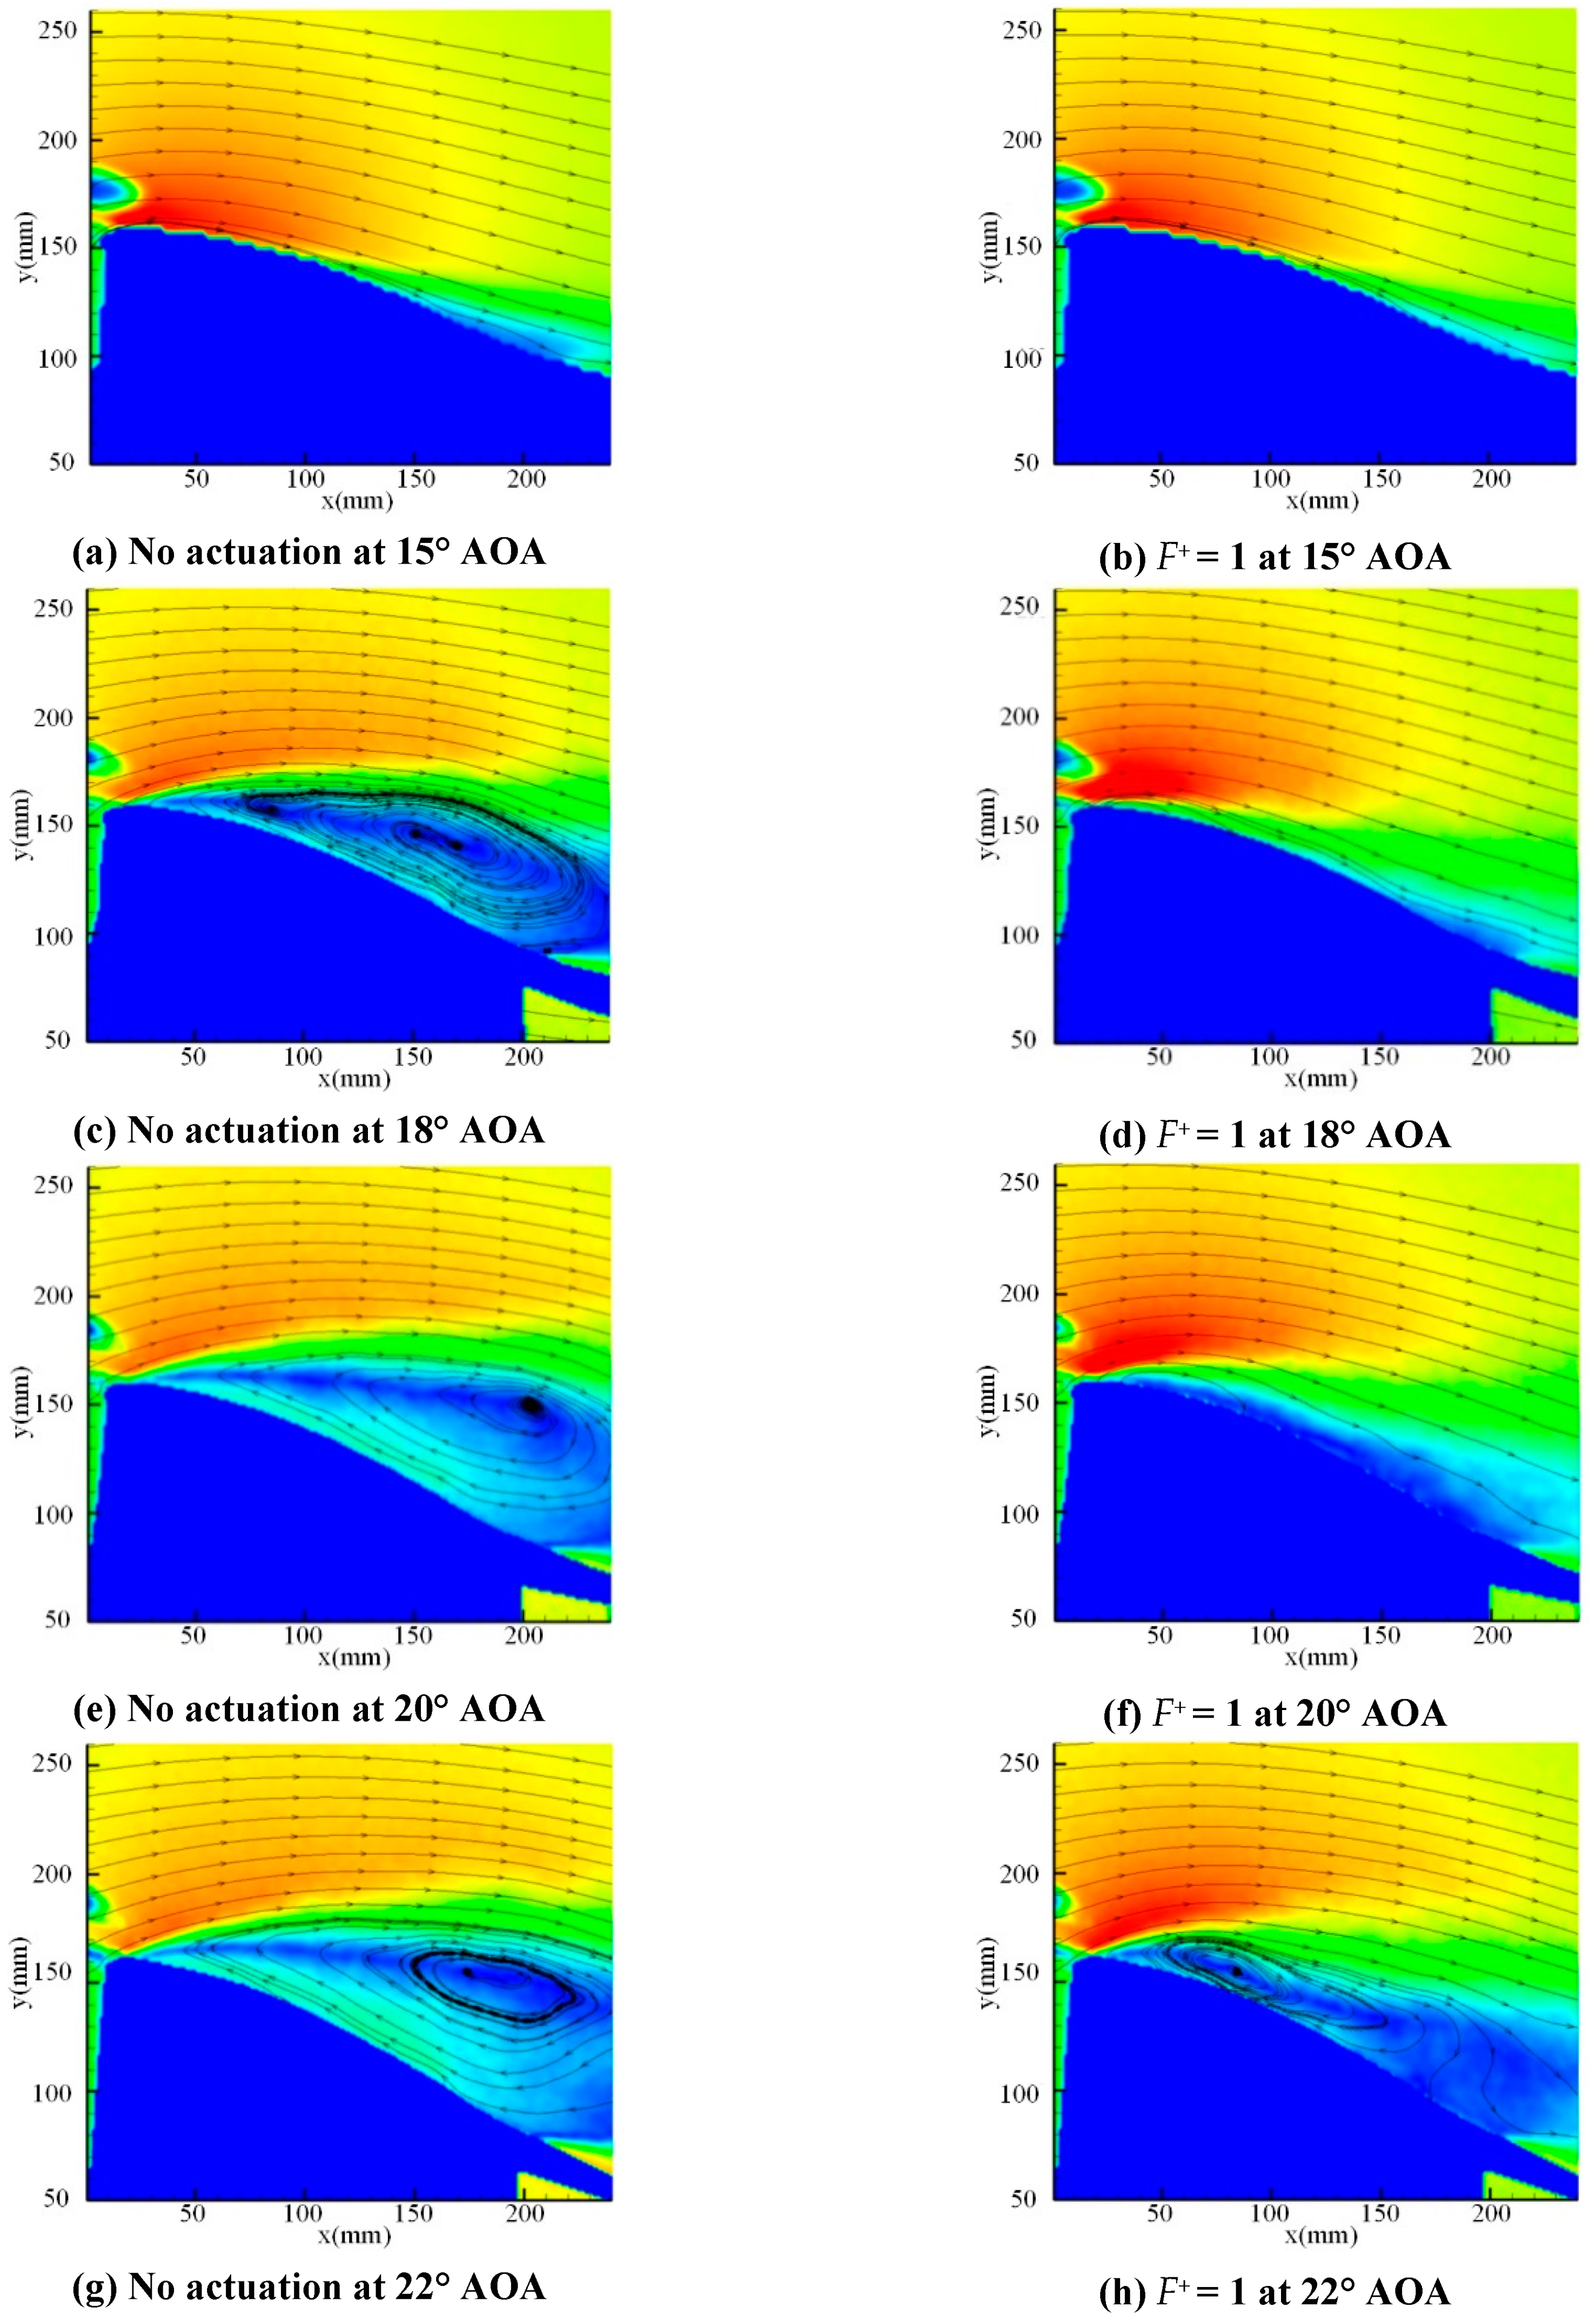
Cross-section 2 was closer to the wing root and was in the middle wing. Figure 17 shows the flow field velocity cloud diagram and streamline of cross-section 2. As shown in Figure 17a, when the angle of attack was 15°, the separation just occured at the trailing edge, which was different from that of cross-section 1. Because of the sweepback effect, the separation of cross-section 1 had developed to the leading edge of the wing at the angle of attack of 15°. As shown in Figure 17c, when the angle of attack increased to 18°, the flow separation was very serious and developed to the leading edge of the wing; the actuated flow field is shown in Figure 17d. The boundary layer of the separated flow field was reattached. Compared with cross-section 1, the separation at 18° angle of attack on the middle wing surface of the symmetric flying wing was effectively controlled. When the angle of attack was 20°, the flow separation shown in Figure 17e was more serious. As shown in Figure 17f, after plasma actuation, the large separation of wing surface was improved, but the separation of symmetric flying wing surface could not be completely suppressed. At the angle of attack of 22°, plasma actuation could no longer completely inhibit the flow separation.Although the separation area decreased, the separation still occured at the front edge. The velocity of the flow field at the leading edge increased because of actuation.
The force measurement experiment shows that when the stall angle of attack of the symmetric flying wing model was 15°, the flow field of cross-section 1 had completely stalled, while the flow field of cross-section 2 had only a slight stall at the trailing edge. When the angle of attack was 18°, both cross-sections had stalled. It can be seen that as the angle of attack increased, the stall on the surface of the symmetric flying wing first occurred on both sides and then moved to the inside. The effect of plasma actuation was to inject energy into the flow field so that the separation area at the stall angle of attack was reattached.
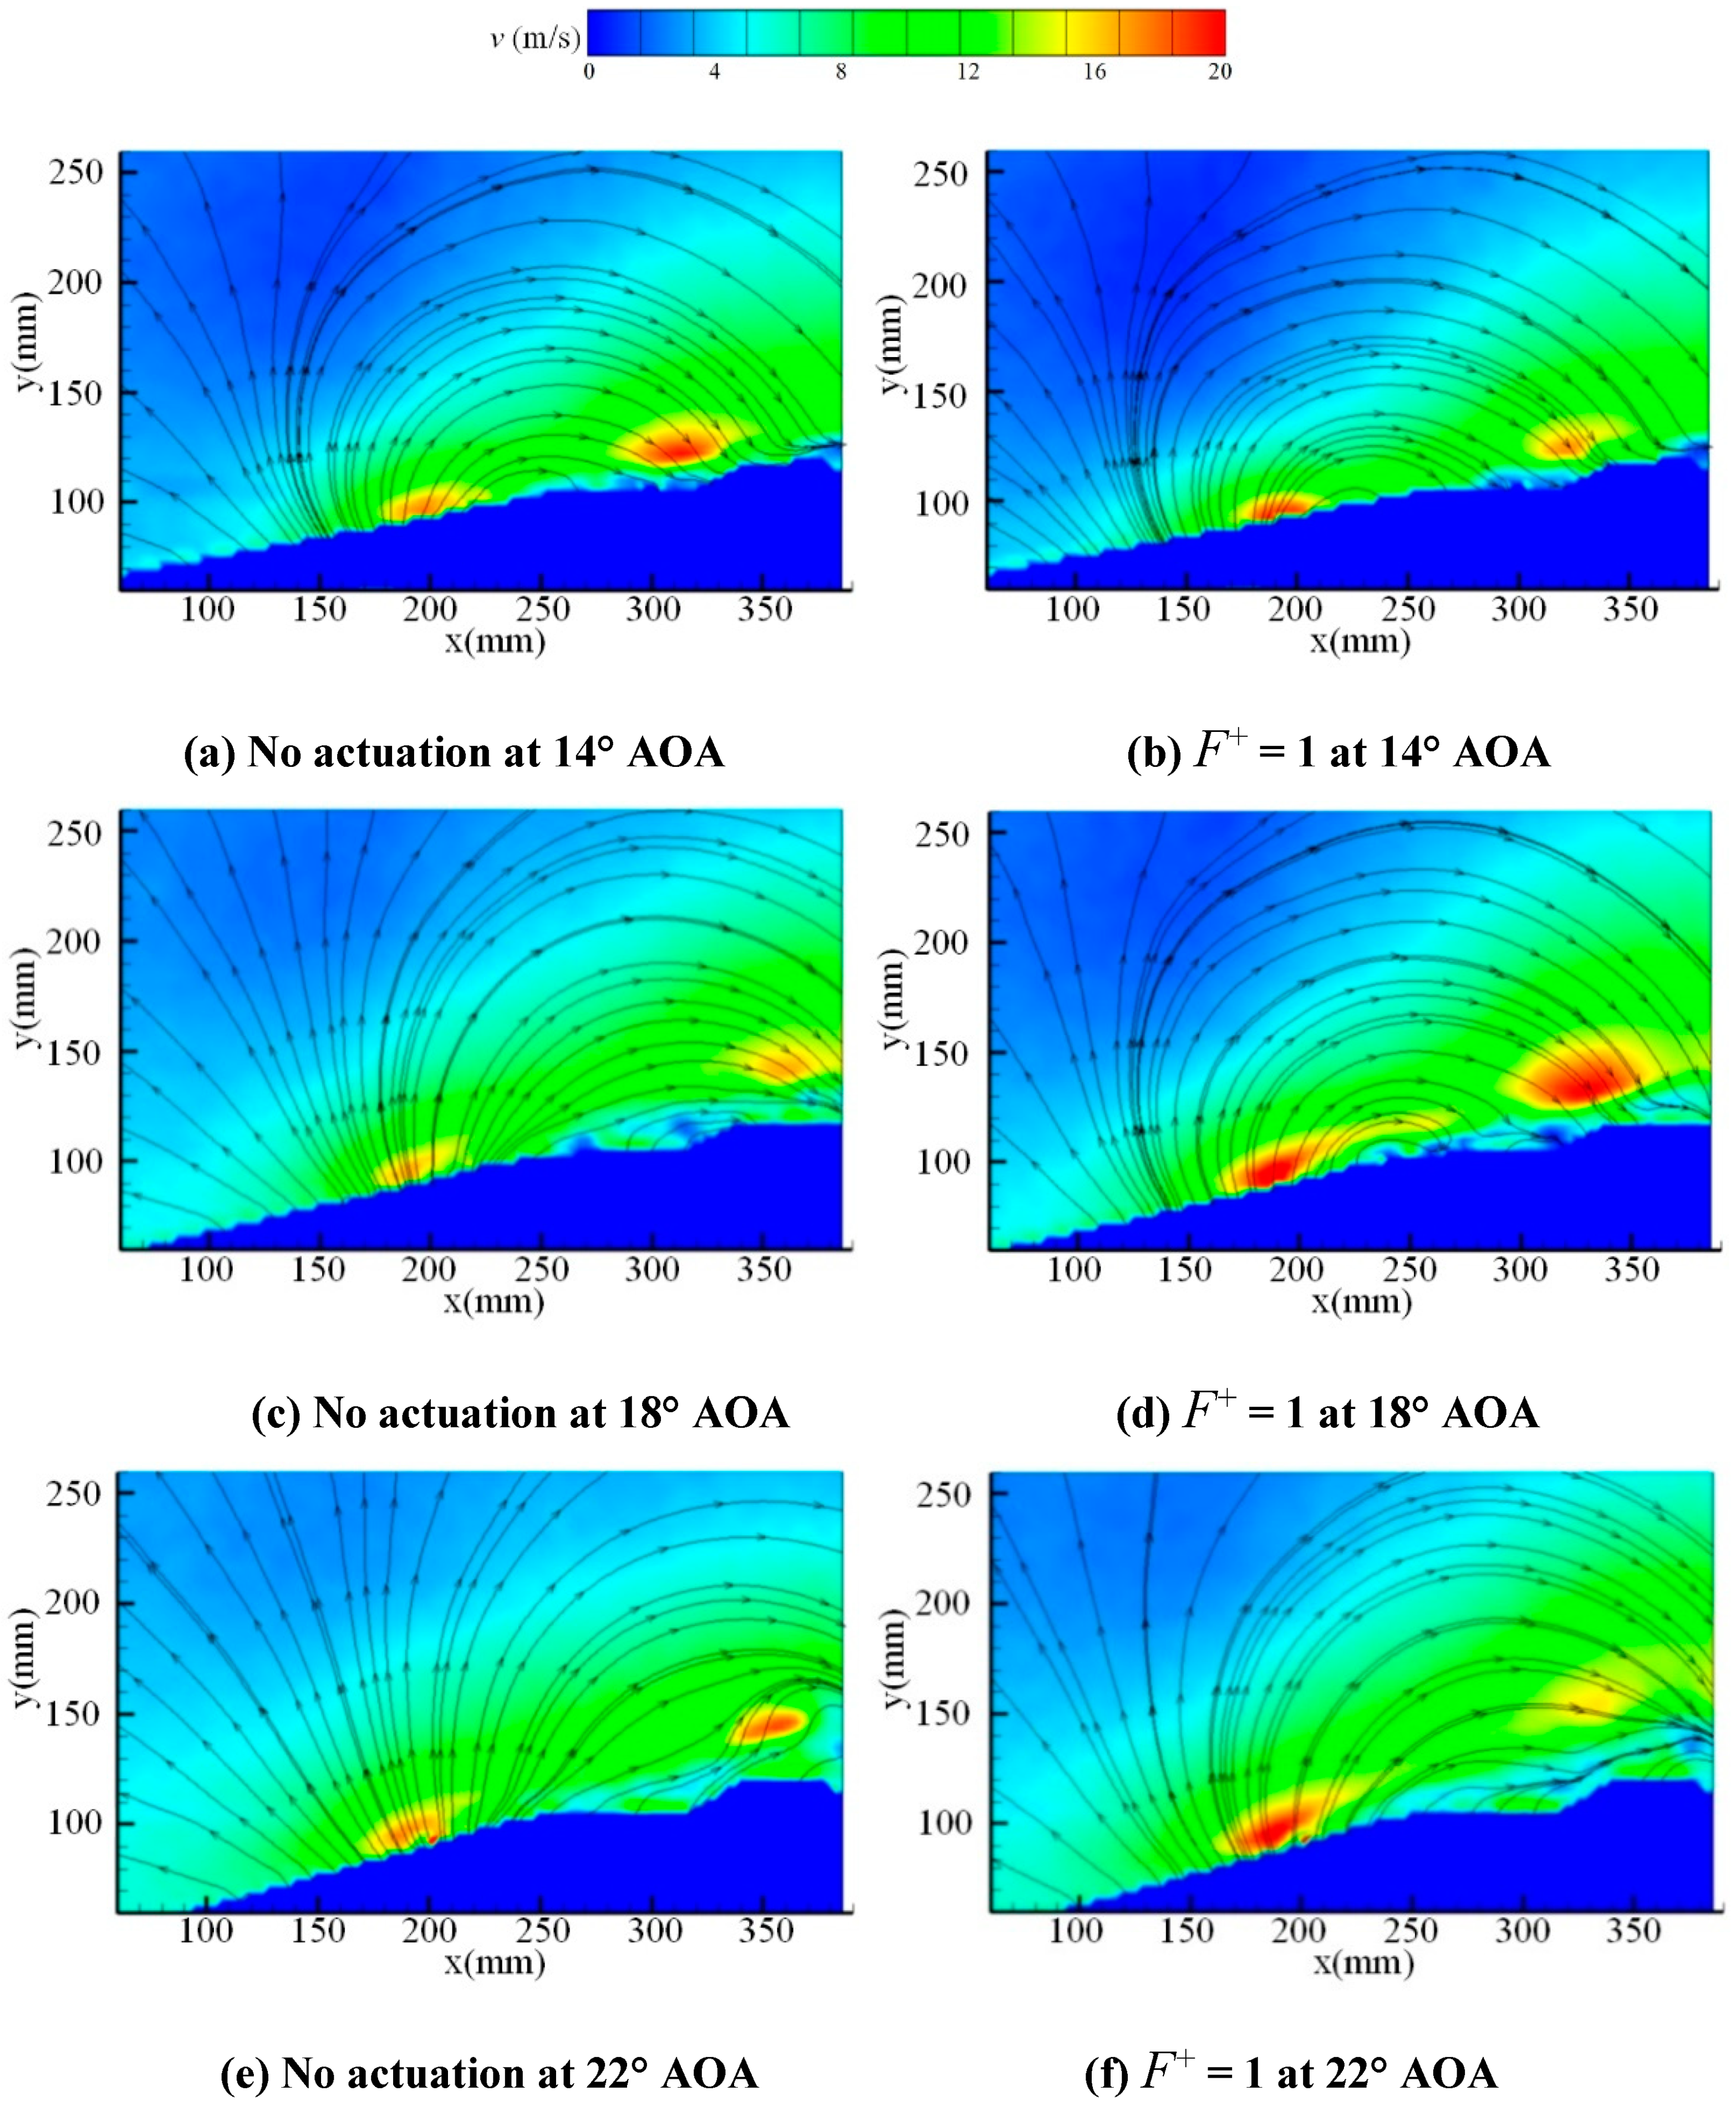
It can be seen from the time-average flow field diagram of measured cross-section 3 in Figure 18 that there was lateral flow on the upper wing surface of the symmetric flying wing model, and its velocity was small. As the angle of attack increased, the range of lateral flow gradually increased. Stall separation was likely to occur when the lateral flow area is too large on the symmetric flying wing surface. It can be seen from Figure 18a that in no-plasma-actuation state, the outer edge airflow flowed through the edge of the wing to the inner edge of the wing, which occurred at x > 260 mm. However, after actuation it was advanced to x > 240 mm, the velocity at the outer edge of the wing had a slight increase, the flow trend toward the airfoil increased, and the point source flowing in the direction of the wing root was advanced from x = 150 mm to x = 140 mm. When the angle of attack was 18°, it can be seen from Figure 18c that there was nearly no tendency for the airflow to flow to the wing near it. After the plasma actuation was applied, the tendency of the airflow to the wing at 18° angle of attack was advanced to 270 mm. and the lateral flow velocity at x = 300–370 mm was increased. When the angle of attack was increased to 22°, the control ability of the plasma actuation to the lateral flow was weakened, as shown in Figure 18f.
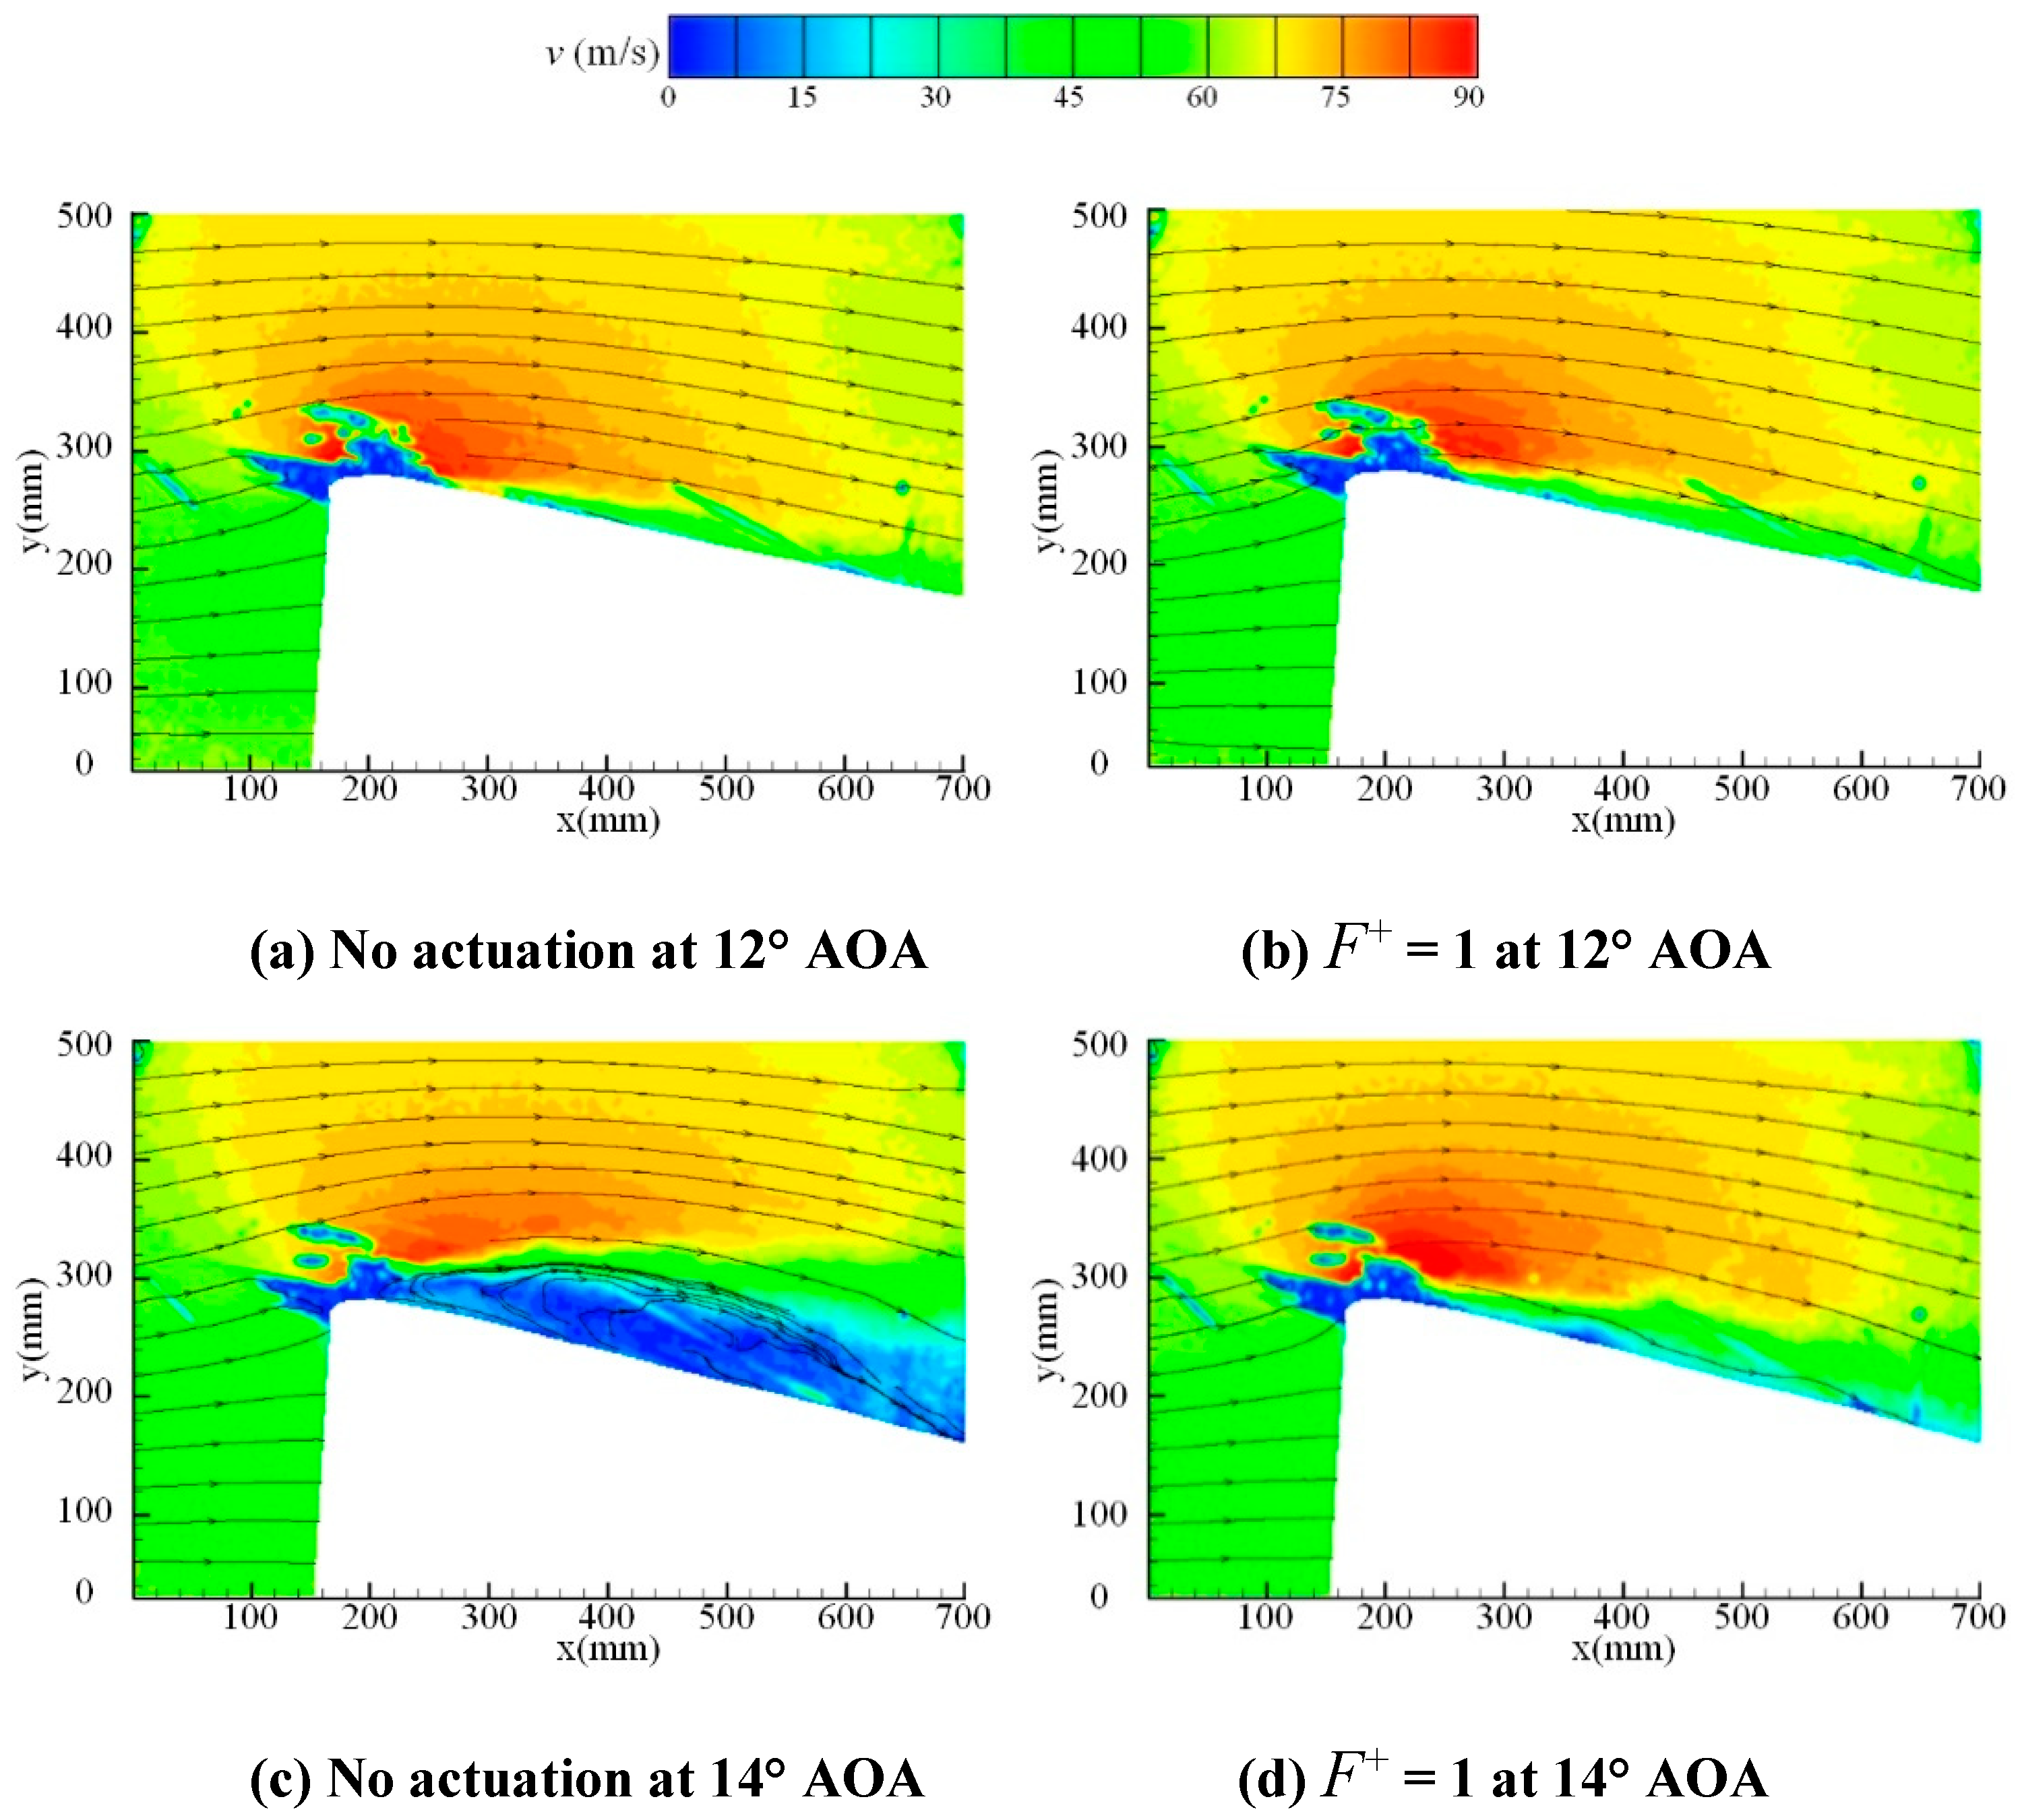
Figure 19 shows the flow field of the large flying wing at the incoming flow velocity of 75 m/s. When the angle of attack was small, the flow field was attached to the surface of the symmetric flying wing without flow separation just as the phenomenon shown in Figure 16. Due to the large incoming flow velocity, the flow velocity near the stagnation point of the leading edge of the symmetric flying wing was relatively low. As shown in Figure 19a, the flow field was affected by the lateral vortex at 12° angle of attack, so it was unstable at the leading edge of the symmetric flying wing and the lift coefficient was smaller than that of the small flying wing at the same angle of attack. At the 14° stall angle of attack, as shown in Figure 19c, the flow separation of the large flying wing in cross-section 1 was severe. After the plasma actuation, as shown in Figure 19d, the flow separation was suppressed and the control effect was good.

4. Conclusions

The discharge energy of μs-DBD is to demonstrate that different length actuators mounted on the small flying wing and the large flying wing have similar energy density. The single energy intensity is positively correlated with input voltage but has nothing to do with the pulse repetition frequency. So, other interference factors were eliminated when the dimensionless frequency is contrasted and analyzed for two symmetric flying wings based on two kinds of scale models. Force and flow field characteristics of the two symmetric flying wings are the topic of the article.
The large flying wing is 2.5 times the size of the small flying wing. The purpose of this paper is to study whether the optimal dimensionless frequency of two flying wing scale models at different incoming flow velocities is consistent by measuring the lift, drag, moment, and surface flow field variation of the two scaling flying wing model before and after μs-DBD plasma flow control actuation. Through the corresponding experiments, the following conclusions can be drawn. The discharge energy results show that the longer the length of the μs-DBD actuator is, the greater the discharge output energy is, but the energy density is basically unchanged and is independent of the length of the actuator. With the increase of actuation voltage, the output energy and the energy density increase. The single pulse energy of the microsecond pulse at different actuation frequencies is basically unchanged and has nothing to do with actuation frequency.
The force measurement and flow field PIV of the small and large flying wing models are compared by experiments. The results show that the stall angles of attack at the corresponding Reynolds numbers of 4.6 × 10⁵ and 2.9 × 10⁶ are both 15°. When the actuation frequency of plasma flow control is 150 Hz, the unsteady actuation effect is the best, and the corresponding dimensionless frequency F+ is 1.07, which is appropriate for the Strouhal similarity criterion. After actuation of the small flying wing, the stall angle of attack is delayed by 4°, the maximum lift coefficient is increased by 30.9% and the drag coefficient can be reduced by 17.3%. The effect of lift increase and drag reduction is good. For a large flying wing, the stall angle of attack is delayed by 4°, the maximum lift coefficient is increased by 15.1%, and the drag coefficient is increased. Similarly, the inflection point of the pitch moment is delayed at the optimal dimensionless frequency. In addition, the effect of low frequency actuation is better than that at a high frequency. The inertia force of the incoming flow at a low Reynolds number is small, and the plasma actuation effect is obvious, but at a high Reynolds number, the ability to promote the complete reattachment of the separation area is not enough due to the limitation of actuation intensity. The PIV test results of the flow field at different cross-sections show that the stall separation on the surface of the symmetric flying wing begins from the outer side, and then with the increase of the angle of attack the separation area begins to appear on the inside. The plasma flow control can not only delay the separation of the longitudinal boundary layer but also slow down the movement of the lateral vortex and inject momentum and energy into the flow field, thus effectively increasing the lift and reducing the drag.

Author Contributions

Conceptualization, H.L. and L.X.; Methodology, M.H.; Formal Analysis, B.W.; Investigation, Z.S.; Data Curation, Z.N.; Writing-Review & Editing, B.T.

Funding

This research was founded by the National Natural Science Foundation of China (Grant Nos. 11802341 and 11472306), Open Project of State Key Laboratory of Aerodynamics in 2018 (Grant No. SKLA20180207).

Acknowledgments

Thanks for the experimental platform and technical support provided by AVIC Aerodynaiviics Research Institute.

Conflicts of Interest

The authors declare no conflict of interest.

References

  1. Wang, F. The Comparison of Aerodynamic and Stability Characteristics between Conventional and Blended Wing Body Aircraft. Master’s Thesis, Cranfield University, Cranfield, UK, 2012. [Google Scholar]
  2. Patil, M.J.; Hodges, D.H. Flight Dynamics of Highly Flexible Flying Wings. J. Aircr. 2006, 43, 1790–1799. [Google Scholar] [CrossRef] [Green Version]
  3. Zhang, L.; Zhou, Z.; Xu, X.P.; Wang, H.B. Comparison on aerodynamic and stealthy performance of flying wing unmanned aerial vehicle with three conformal intake inlets. J. Aerosp. Power 2015, 30, 1651–1660. [Google Scholar]
  4. Chen, S.; Lyu, Z.; Kenway, G.K.; Martins, J.R. Aerodynamic Shape Optimization of the Common Research Model Wing-Body-Tail Configuration. In Proceedings of the AIAA Aerospace Sciences Meeting, Kissimmee, FL, USA, 5–9 January 2015. [Google Scholar]
  5. Nangia, R.; Palmer, M. Flying-Wings (Blended Wing Bodies) with Aft & Forward Sweep, Relating Design Camber & Twist to Longitudinal Control. In Proceedings of the AIAA Atmospheric Flight Mechanics Conference & Exhibit, Monterey, CA, USA, 5–8 August 2002. [Google Scholar]
  6. Mardanpour, P.; Richards, P.W.; Nabipour, O.; Hodges, D.H. Effect of multiple engine placement on aeroelastic trim and stability of flying wing aircraft. J. Fluids Struct. 2014, 44, 67–86. [Google Scholar] [CrossRef]
  7. Huang, A.; Folk, C.; Silva, C.; Christensen, B.; Chen, Y.F.; Ho, C.M.; Jiang, F.; Grosjean, C.; Tai, Y.C. Applications of MEMS devices to delta wing aircraft: From concept development to transonic flight test. In Proceedings of the 39th Aerospace Sciences Meeting and Exhibit, Reno, NV, USA, 8–11 January 2001. [Google Scholar]
  8. Roos, F.W. Microblowing for High-Angle-of-Attack Vortex Flow Control on a Fighter Aircraft. J. Aircr. 2001, 38, 454–457. [Google Scholar] [CrossRef]
  9. Patel, M.P.; Ng, T.T.; Vasudevan, S.; Corke, T.C.; He, C. Plasma Actuators for Hingeless Aerodynamic Control of an Unmanned Air Vehicle. J. Aircr. 2007, 44, 1264–1274. [Google Scholar] [CrossRef] [Green Version]
  10. Su, Z.; Li, J.; Liang, H.; Zheng, B.R.; Wei, B.; Chen, J.; Xie, L.K. UAV flight test of plasma slats and ailerons with microsecond dielectric barrier discharge. Chin. Phys. B 2018, 27, 459–468. [Google Scholar] [CrossRef]
  11. Hsiao, F.B.; Liu, C.F.; Shyu, J.Y. Control of wall-separated flow by internal acoustic excitation. AIAA J. 2012, 28, 1440–1446. [Google Scholar] [CrossRef]
  12. Krishnappa, S.; Jogi, N.; Nguyen, L.D.; Gudmundsson, S.; MacKunis, W.T.; Golubev, V.V. Towards Experimental Validation of Robust Control of Gust-induced Airfoil Limit Cycle Oscillations Using Synthetic Jet Actuators. In Proceedings of the AIAA Fluid Dynamics Conference, Washington, DC, USA, 13–17 June 2016. [Google Scholar]
  13. Zong, H.; Kotsonis, M. Effect of slotted exit orifice on performance of plasma synthetic jet actuator. Exp. Fluids 2017, 58, 17. [Google Scholar] [CrossRef] [Green Version]
  14. Campbell, J.F. Augmentation of Vortex Lift by Spanwise Blowing. J. Aircr. 1976, 13, 727–732. [Google Scholar] [CrossRef]
  15. Joseph, P.; Amandolese, X.; Edouard, C.; Aider, J.L. Flow control using MEMS pulsed micro-jets on the Ahmed body. Exp. Fluids 2013, 54, 1–12. [Google Scholar] [CrossRef]
  16. Little, J. High-Lift Airfoil Separation Control with Dielectric Barrier Discharge Plasma Actuators. Ph.D. Thesis, The Ohio State University, Columbus, OH, USA, 2010. [Google Scholar]
  17. Yun, W.U.; Yinghong, L.I. Progress in Research of Plasma-assisted Flow Control, Ignition and Combustion. High Volt. Eng. 2014, 40, 2024–2038. [Google Scholar]
  18. Little, J.; Takashima, K.; Nishihara, M.; Adamovich, I.; Samimy, M. Separation Control with Nanosecond-Pulse-Driven Dielectric Barrier Discharge Plasma Actuators. AIAA J. 2012, 50, 350–365. [Google Scholar] [CrossRef]
  19. Tang, M.; Wu, Y.; Wang, H.; Guo, S.; Sun, Z.; Sheng, J. Characterization of transverse plasma jet and its effects on ramp induced separation. Exp. Therm. Fluid Sci. 2018, 99, 584–594. [Google Scholar] [Green Version]
  20. Zheng, B.; Xue, M.; Ke, X.; Ge, C.; Wang, Y.; Liu, F.; Luo, S. Unsteady Vortex Structure Induced by a Trielectrode Sliding Discharge Plasma Actuator. AIAA J. 2018, 57, 467–471. [Google Scholar] [CrossRef]
  21. Sidorenko, A.; Budovsky, A.; Pushkarev, A.; Maslov, A. Flight testing of DBD plasma separation control system. In Proceedings of the AIAA Aerospace Sciences Meeting & Exhibit, Reno, NV, USA, 7–10 January 2008. [Google Scholar]
  22. Wang, J.; Li, Y.; Xing, F. Investigation on oblique shock wave control by arc discharge plasma in supersonic airflow. J. Appl. Phys. 2009, 106, 073307. [Google Scholar] [CrossRef]
  23. Benard, N.; Moreau, E. Electrical and mechanical characteristics of surface AC dielectric barrier discharge plasma actuators applied to airflow control. Exp. Fluids 2014, 55, 1846. [Google Scholar] [CrossRef]
  24. Roupassov, D.V.; Nikipelov, A.A.; Nudnova, M.M.; Starikovskii, A.Y. Flow Separation Control by Plasma Actuator with Nanosecond Pulsed-Periodic Discharge. In Proceedings of the 46th AIAA Aerospace Sciences Meeting and Exhibit, Reno, NV, USA, 7–10 January 2008. [Google Scholar]
  25. Durasiewicz, C.; Singh, A.; Little, J. A Comparative Flow Physics Study of Ns-DBD vs. Ac-DBD Plasma Actuators for Transient Separation Control on a NACA 0012 Airfoil. In Proceedings of the 2018 AIAA Aerospace Sciences Meeting, Kissimmee, FL, USA, 8–12 January 2018. [Google Scholar]
  26. Sevant, N.E.; Bloor, M.I.G.; Wilson, M.J. Aerodynamic Design of a Flying Wing Using Response Surface Methodology. J. Aircr. 2015, 37, 562–569. [Google Scholar] [CrossRef]
  27. Huber, K.; Schutte, A.; Rein, M. Numerical Investigation of the Aerodynamic Properties of a Flying Wing Configuration. In Proceedings of the 30th AIAA Applied Aerodynamics Conference, New Orleans, LA, USA, 25–28 June 2012. [Google Scholar]
  28. Xu, X.; Zhou, Z. Analytical study on the synthetic jet control of asymmetric flow field of flying wing unmanned aerial vehicle. Aerosp. Sci. Technol. 2016, 56, 90–99. [Google Scholar] [CrossRef]
  29. Han, M.; Li, J.; Niu, Z.; Liang, H.; Zhao, G.; Hua, W. Aerodynamic performance enhancement of a flying wing using nanosecond pulsed DBD plasma actuator. Chin. J. Aeronaut. 2015, 28, 377–384. [Google Scholar] [CrossRef] [Green Version]
  30. Yao, J.K.; Zhou, D.J.; He, H.B.; He, C.J.; Shi, Z.W.; Du, H. Experimental investigation of lift enhancement for flying wing aircraft using nanosecond DBD plasma actuators. Plasma Sci. Technol. 2017, 19, 11–18. [Google Scholar] [CrossRef]
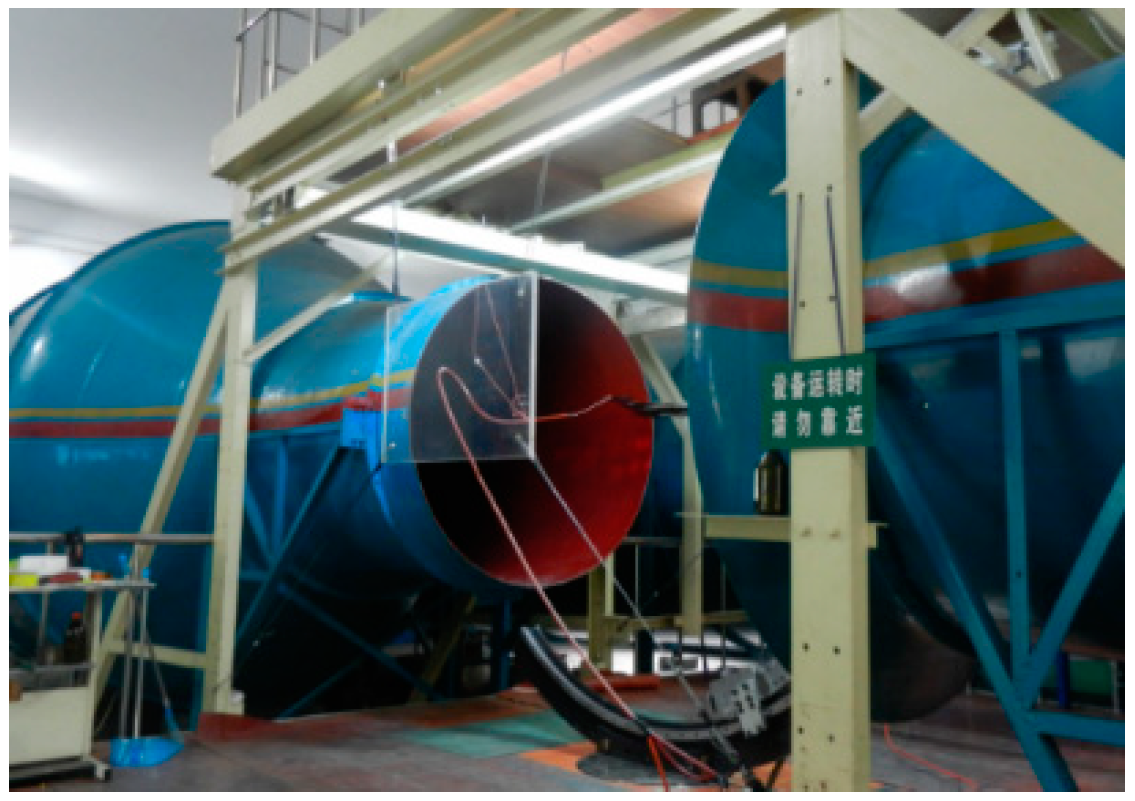
Figure 1. FL-5 wind tunnel open test section.
Symmetry 11 01261 g001
Figure 2. FL-51 wind tunnel closed test section.
Symmetry 11 01261 g002
Figure 3. Small flying wing model.
Symmetry 11 01261 g003
Figure 4. Large flying wing model.
Symmetry 11 01261 g004
Figure 5. Microsecond pulse power supply schematic circuit diagram.
Symmetry 11 01261 g005
Figure 6. Waveform of no-load maximum output voltage (U).
Symmetry 11 01261 g006
Figure 7. Surface dielectric barrier discharge actuator. (a): structure; (b): position layout.
Symmetry 11 01261 g007
Figure 8. Particle image velocimetry (PIV) test system layout diagram.
Symmetry 11 01261 g008
Figure 9. Variation of instantaneous power and energy at different actuator lengths. (a): comparison of instantaneous power; (b) comparison of energy.
Symmetry 11 01261 g009
Figure 10. Variation of instantaneous power and energy at different actuator voltages. (a): comparison of instantaneous power; (b) comparison of energy.
Symmetry 11 01261 g010
Figure 11. Variation of instantaneous power at different actuator frequencies.
Symmetry 11 01261 g011
Figure 12. Lift, drag, and pitch moment coefficient curves of the small flying wing at different dimensionless frequencies (U = 30 m/s, FL-5). (a): Lift coefficient curves; (b) Drag coefficient curves; (c) Pitch moment coefficient curves.
Symmetry 11 01261 g012
Figure 13. Lift, drag, and pitch moment coefficient curves of the large flying wing at different dimensionless frequencies (U = 75 m/s, FL-51). (a): Lift coefficient curves; (b) Drag coefficient curves; (c) Pitch moment coefficient curves.
Symmetry 11 01261 g013
Figure 14. Lift coefficient increment at different dimensionless actuation frequencies in incoming flow velocities of 30 m/s and 75 m/s.
Symmetry 11 01261 g014
Figure 15. Schematic diagram of PIV test cross-section.
Symmetry 11 01261 g015
Figure 16. Time-averaged flow field of measured cross-section 1 of the small flying wing (U = 30 m/s, FL-5).
Symmetry 11 01261 g016
Figure 17. Time-averaged flow field of measured cross-section 2 of the small flying wing (U = 30 m/s, FL-5).
Symmetry 11 01261 g017aSymmetry 11 01261 g017b
Figure 18. Time-averaged flow field of measured cross-section 3 of the small flying wing (U = 30 m/s, FL-5).
Symmetry 11 01261 g018
Figure 19. Time-averaged flow field of measured cross-section 1 of the large flying wing (U = 75m/s, FL-51).
Symmetry 11 01261 g019
Table 1. The test conditions.
ModelAspect RatioWind TunnelVelocityForce MeasurementPIV Measurement
Small
flying wing
2.47FL-530 m/sLift, drag, and momentSection 1, Section 2 and Section 3
Large
flying wing
2.47 FL-5175 m/sLift, drag, and momentSection 1