Article

Effect of pH, Acid and Thermal Treatment Conditions on Co/CNT Catalyst Performance in Fischer–Tropsch Reaction

by
Omid Akbarzadeh
1,*,
Noor Asmawati Mohd Zabidi
2,
Nor Aliya Hamizi
1,
Yasmin Abdul Wahab
1,
Zulkifli Merican Aljunid Merican
2,
Wageeh A. Yehya
1,
Shamima Akhter
3,
Md. Shalauddin
1,
Elisa Rasouli
1 and
Mohd Rafie Johan
1
1
Nanotechnology & Catalysis Research Centre, University of Malaya, Kuala Lumpur 50603, Malaysia
2
Department of Fundamental and Applied Sciences, Universiti Teknologi PETRONAS, Bandar Seri Iskandar, Perak 32610, Malaysia
3
Department of Chemistry, University of Malaya, Kuala Lumpur 50603, Malaysia
*
Author to whom correspondence should be addressed.
Symmetry 2019, 11(1), 50; https://doi.org/10.3390/sym11010050
Submission received: 1 December 2018 / Revised: 21 December 2018 / Accepted: 3 January 2019 / Published: 4 January 2019
(This article belongs to the Special Issue Nanocatalysis and Symmetry in Chemistry)

Abstract

:
Multiwalled carbon nanotubes (CNT) supported cobalt oxide was prepared as a catalyst by strong electrostatic adsorption (SEA) method. The CNT support was initially acid- and thermal-treated in order to functionalize the support to uptake more Co clusters. The Co/CNT were characterized by a range of analytical methods including transmission electron microscopy (TEM), temperature programmed reduction with hydrogen (H2-TPR), X-ray diffraction (XRD), Fourier-transform infrared spectroscopy (FTIR), Raman spectroscopy, atomic absorption spectroscopy (AAS), Zeta sizer particle size analysis and Brunauer–Emmett–Teller (BET) surface area analysis. TEM images showed cobalt particles were highly dispersed and impregnated at both exterior and interior walls of the CNT support with a narrow particle size distribution of 6–8 nm. In addition, the performance of the synthesized Co/CNT catalyst was tested using Fischer–Tropsch synthesis (FTS) reaction which was carried out in a fixed-bed micro-reactor. H2-TPR profiles indicated the lower reduction temperature of 420 °C was required for the FTS reaction. The study revealed that cobalt is an effective metal for Co/CNT catalysts at pH 14 and at 900 °C calcination temperature. Furthermore, FTS reaction results showed that CO conversion and C5+ selectivity were recorded at 58.7% and 83.2% respectively, which were higher than those obtained using a Co/CNT catalyst which pre-treated at a lower thermal treatment temperature and pH.

1. Introduction

In Fischer–Tropsch synthesis (FTS), syngas (H2 + CO) is consumed to produce hydrocarbons and chemical products where FTS itself plays a significant energy production role between all environmentally friendly fuels and renewable energy resources. While there is an early prediction of a rapid decline in crude oil reserves, the abundant presence of natural gas and coal reserves can be an alternative feedstock for the FTS technique to remain popular. In addition, having a less sulfur and aromatic ring content, fuel prepared from an FTS technique could offer a practical non-toxic environment strategy. In the fabrication of FTS catalyst, the most common metals are iron, cobalt, nickel, and ruthenium. Within the metal series, nickel-based catalysts produce a higher amount of methane while ruthenium-based catalysts are costly when exploited on a large scale. Generally, iron and cobalt based catalysts are considered more economical and cost saving. Iron catalysts have high selectivity towards olefins and water gas shift reaction (WGSR), and give lower activities in comparison to cobalt catalysts [1]. For the FTS technique, cobalt catalyst is one of the effective catalysts with high selectivity for linear hydrocarbons (paraffin) and less complicated reaction conditions [2,3]. The FTS technique depends on several factors including cobalt loading percentage, dispersion of cobalt particles on the support and the metal reducibility property. Specifically, the catalyst support could help in homogeneous dispersion of cobalt particles on its surface hence, ensuring complete reduction of the metal [4]. In recent years, the performance of cobalt-based catalysts and properties of common supports including alumina, silica, and titania have been investigated [5]. On the other hand, carbon nanotubes [6], carbon nanofibers [7,8], carbon spheres [9], and graphene [10] have emerged and are considered as a new series of catalyst supports. Carbon-based supports as compared to conventional supports have weak interaction between catalyst active sites and the support material and this leads to a higher degree of reduction and enhanced catalyst activity. Carbon nanotubes (CNT) play a special support role for FTS reaction due to their unique mechanical and electrical properties [11]. On the other hand, the unique tubular shape structure of a CNT support could offer several advantages including the presence of confinement for the active sites and encapsulation of catalyst particles within the support [12]. These combined factors lead to the easier reduction, lower agglomeration, higher catalyst activity and performance [13], longer catalyst’s lifetime and last but not least increased catalyst activity from other metal (such as Co, Ru, and K) loadings [14,15]. However, these earlier reports have been lacking further studies on the effect of catalyst preparation conditions such as pH, acid, and thermal treatment against catalyst performance in the FTS reaction. The aim of this research, therefore, is to synthesize a series of cobalt catalyst supported on CNT by applying the SEA technique and to investigate further the effect of pH, acid and thermal treatment on the overall performance of the Co/CNT catalysts in the FTS reaction.

2. Experimental

2.1. Carbon Nanotube Support Purification/Functionalization

Functionalization and activation of CNT (purity > 95%, chemical vapor deposition, length: 10−20 µm and diameter: 30−50 nm, purchased from ILJIN Nanotech Co. Ltd., Seoul, Korea), prior to metal loading is very crucial. The objective of these processes is to expand the interaction of foreign molecules with the surface of CNT. This process introduces oxygen-containing groups (OH) on the surface, purifies and produces pristine CNT, and helps to uncap the CNT end-terminals. Approximately 2 g of commercially available and as-received CNT were added to a flask fitted with a reflux condenser containing 35 vol% nitric acid (Merck, Petaling Jaya, Malaysia) where the solution was kept at 25 °C and 110 °C for 5, 10, 15, and 20 h respectively. The slurry solution was dried in an oven overnight at 110 °C. The acid-treated CNT were thermally treated at 600 °C, 700 °C, 800 °C, and 900°C in flowing argon gas at 20 mL min−1 [16]. In this study, at different temperature, samples with acid and thermal treatments were designated as follows: as-received CNT, CNT.A.600, CNT.A.700, CNT.A.800, and CNT.A.900. The last 3 digits after the letter A (which denotes the acid) in the sample name represent the respective temperature at which thermal pre-treatment was conducted prior to impregnation of the metal cobalt particles.

2.2. Preparation of Catalysts Using SEA Method

The synthesis of the Co/CNT catalyst via the usual impregnation methods has resulted in cobalt particles being dispersed heterogeneously on the CNT support. The strong electrostatic adsorption (SEA) method was exploited to give higher levels of catalyst dispersion on the support and narrower particle size distribution [17,18,19]. Electrostatic attraction of oppositely charged particles is the basis of the SEA method. Supports such as alumina, CNT, silica, and other metal oxides contain a hydroxyl group on their surface, therefore in the SEA method, the point of zero charges (PZC) is the pH of a medium that the hydroxyl group on the support’s surface remains neutral. If the pH value is smaller than PZC, the hydroxyl group protonates and the positive charges, therefore, attract anions. On the other hand, if the pH is higher than PZC, the hydroxyl group deprotonates and the resulting negative charges would attract cations [20]. In this study, Co/CNT catalyst samples were synthesized via the SEA method at an optimum pH with a total of 10% cobalt loading.

2.3. Determination of PZC and Co Uptake on CNT

In order to find out a point of zero charges (PZC) of a CNT support, the equilibrium-pH-at-high-oxide-loading (EpHL) method was applied [21]. By adding nitric acid or ammonium hydroxide into a series of distilled water containing solutions, a pH range of 2–14 was prepared. A pre-weighed amount of CNT was then added to 50 mL of each solution. The mixtures were shaken for one hour on a rotary shaker prior to the final pH value measurements. The PZC of the CNT support was found on the plateau plotted from the final pH versus initial pH graph. As for the measurement of optimum pH during the cobalt uptake, a series of pH values for a cobalt nitrate precursor was prepared within a range of 2–14. Accordingly, to the prepared solutions were added the pre-weighed CNT and they were then shaken for 1 h and the final pH was measured. In order to find out an optimum pH for the Co uptake, 5 mL of each cobalt solution was subjected to atomic absorption spectrophotometry (AAS) analysis and a plot can be obtained from the Co uptake versus pH. To prevent pH shift, cobalt precursor adsorbs to CNT support at selected pH. The as-synthesized catalyst samples were air dried after 24 h and followed by calcination at 400 °C for 4 h in a tubular furnace under an Ar flow to remove residual reactants.

2.4. Catalyst Characterisation and Equations

Fischer–Tropsch synthesis (FTS) catalysts can be characterized by a range of methods including a physical adsorption method, temperature-programmed reduction method carried out using a Thermo Finnigan (TPDRO 1100 MS, Waltham, MA, USA), and transmission electron microscopy (TEM) analysis performed on Zeiss LIBRA 200 FE, (Jena, Germany). Furthermore, Fourier transform infrared spectroscopy (FTIR, Perkin Elmer, Petaling Jaya, Malaysia), X-ray diffraction (XRD) on a Bruker (A&S D8 Advanced Diffractometer, Singapore) and atomic absorption spectroscopy (AAS) by Agilent Technologies GTA 120 (Santa Clara, CA, USA) were also used to measure the extent of uptake of Co particles on the CNT support. Thermogravimetric analysis (TGA) analysis was performed on a Perkin Elmer STA 4000 (Petaling Jaya, Malaysia) analyser. Pore volume and average pore size of the calcined catalysts, total surface area, and unmodified support (CNT) were observed using Micromeritics, (ASAP 2020, Norcross, GA, USA) adsorption equipment.
Equations (1)–(4) were used to calculate reduction percentage based on result derived from TPR figure peak area, dispersion % and Equations (5)–(9) applied to calculate selectivity and conversion of catalyst samples [10,22,23,24].
% R e d u c t i o n = H 2 U p t a k e × S t o i c h i o m e t r y × A t o m i c W e i g h t % M e t a l
where: H2 uptake = amount of H2 in μmol/g.cat, calculated from TPD spectra of catalyst. Atomic weight = molecular weight (MW) of metal. % metal = weight percentage of metal in catalyst.
% D i s p e r s i o n ( T o t a l C o ) = H 2 U p t a k e × A t o m i c W e i g h t × S t o i c h i o m e t r y % M e t a l = N u m b e r o f C o A t o m s o n S u r f a c e T o t a l N u m b e r o f C o A t o m s i n S a m p l e × 100
where: H2 uptake = amount of H2 consumed in mmol/g.cat calculated from peak area of H2-TPD spectra. Atomic weight = MW of metal. % metal = weight percentage of metal in catalyst. Stoichiometry = 2.
Number of active sites of catalysts calculated using % dispersion and % reduction calculated using Equation (3) [23].
N o . o f A c t i v e S i t e s = W e i g h t o f C o i n S a m p l e × R e d u c t i o n × D i s p e r s i o n × N A M W
where: NA = Avogadro’s number. MW = atomic weight of metal.
H 2 u p t a k e ( M o l e s g c a t ) = A n a l y t i c a l A r e a f r o m T P D × C a l i b r a t i o n V a l u e S a m p l e W e i g h t × 24.5
The performance of nano catalyst in Fischer–Tropsch (FT) reactions was studied by using Microactivity-reference equipment (Micromeritics, GA 30093-2901, USA). An online gas chromatograph (Agilent Hewlett-Packard Series 6890, Santa Clara, CA, USA) equipped with TCD and FID) system was used to analyze gaseous products. Percentage of conversion for CO, methane (CH4) selectivity and C5+ selectivity were calculated using Equations (5)–(7) respectively [23].
C O C o n v e r s i o n ( % ) = C O i n C O o u t C O i n × 100
C H 4 S e l e c t i v i t y ( % ) = M o l e o f C H 4 T o t a l M o l e s o f H y d r o c a r b o n s × 100
C 5 + S e l e c t i v i t y ( % ) = M o l e s o f C 5 + T o t a l M o l e s o f H y d r o c a r b o n s × 100
FTS rate shown in Equation (8) and water gas shift reaction rate Equation (8) is equal to formation rate of carbon dioxide (RFCO2) and can be defined by [25,26,27,28]:
R F T S ( g H C / g c a t . h 1 ) = g H y d r o c a r b o n s P r o d u c e d / g c a t h 1
R W G S ( g C O 2 / g c a t . h 1 ) = R F C O 2 = g C O 2 P r o d u c e d / g c a t h 1

3. Results and Discussion

From a plateau plotted from the data of the final pH versus initial pH values shown in Figure 1a, the PZC of the CNT support was found to be 9.5. Figure 1b shows plot of Co uptake versus pH. From this plot, optimum pH for Co uptake is 14. Prior to the FT reaction, the catalysts were reduction and activated under the flow of H2 at the rate of 1.8 L/h at 220 °C for 2.5 to 10 h. After catalyst activation at the high reduction temperature, the catalysts were cooled down to reaction temperature and flushed with helium gas for 10 min. Fischer–Tropsch reactions were done at 2/1 H2/CO (v/v) ratio, 40 L/g-cat.h, 240 °C, and at 20 atm pressure.

3.1. Effect of Acid Pre-Treatment Conditions on Co/CNT Properties and Performance

The influence of different conditions of CNT acid treatment on physicochemical properties of the catalysts, FTS activity and selectivity was studied. 
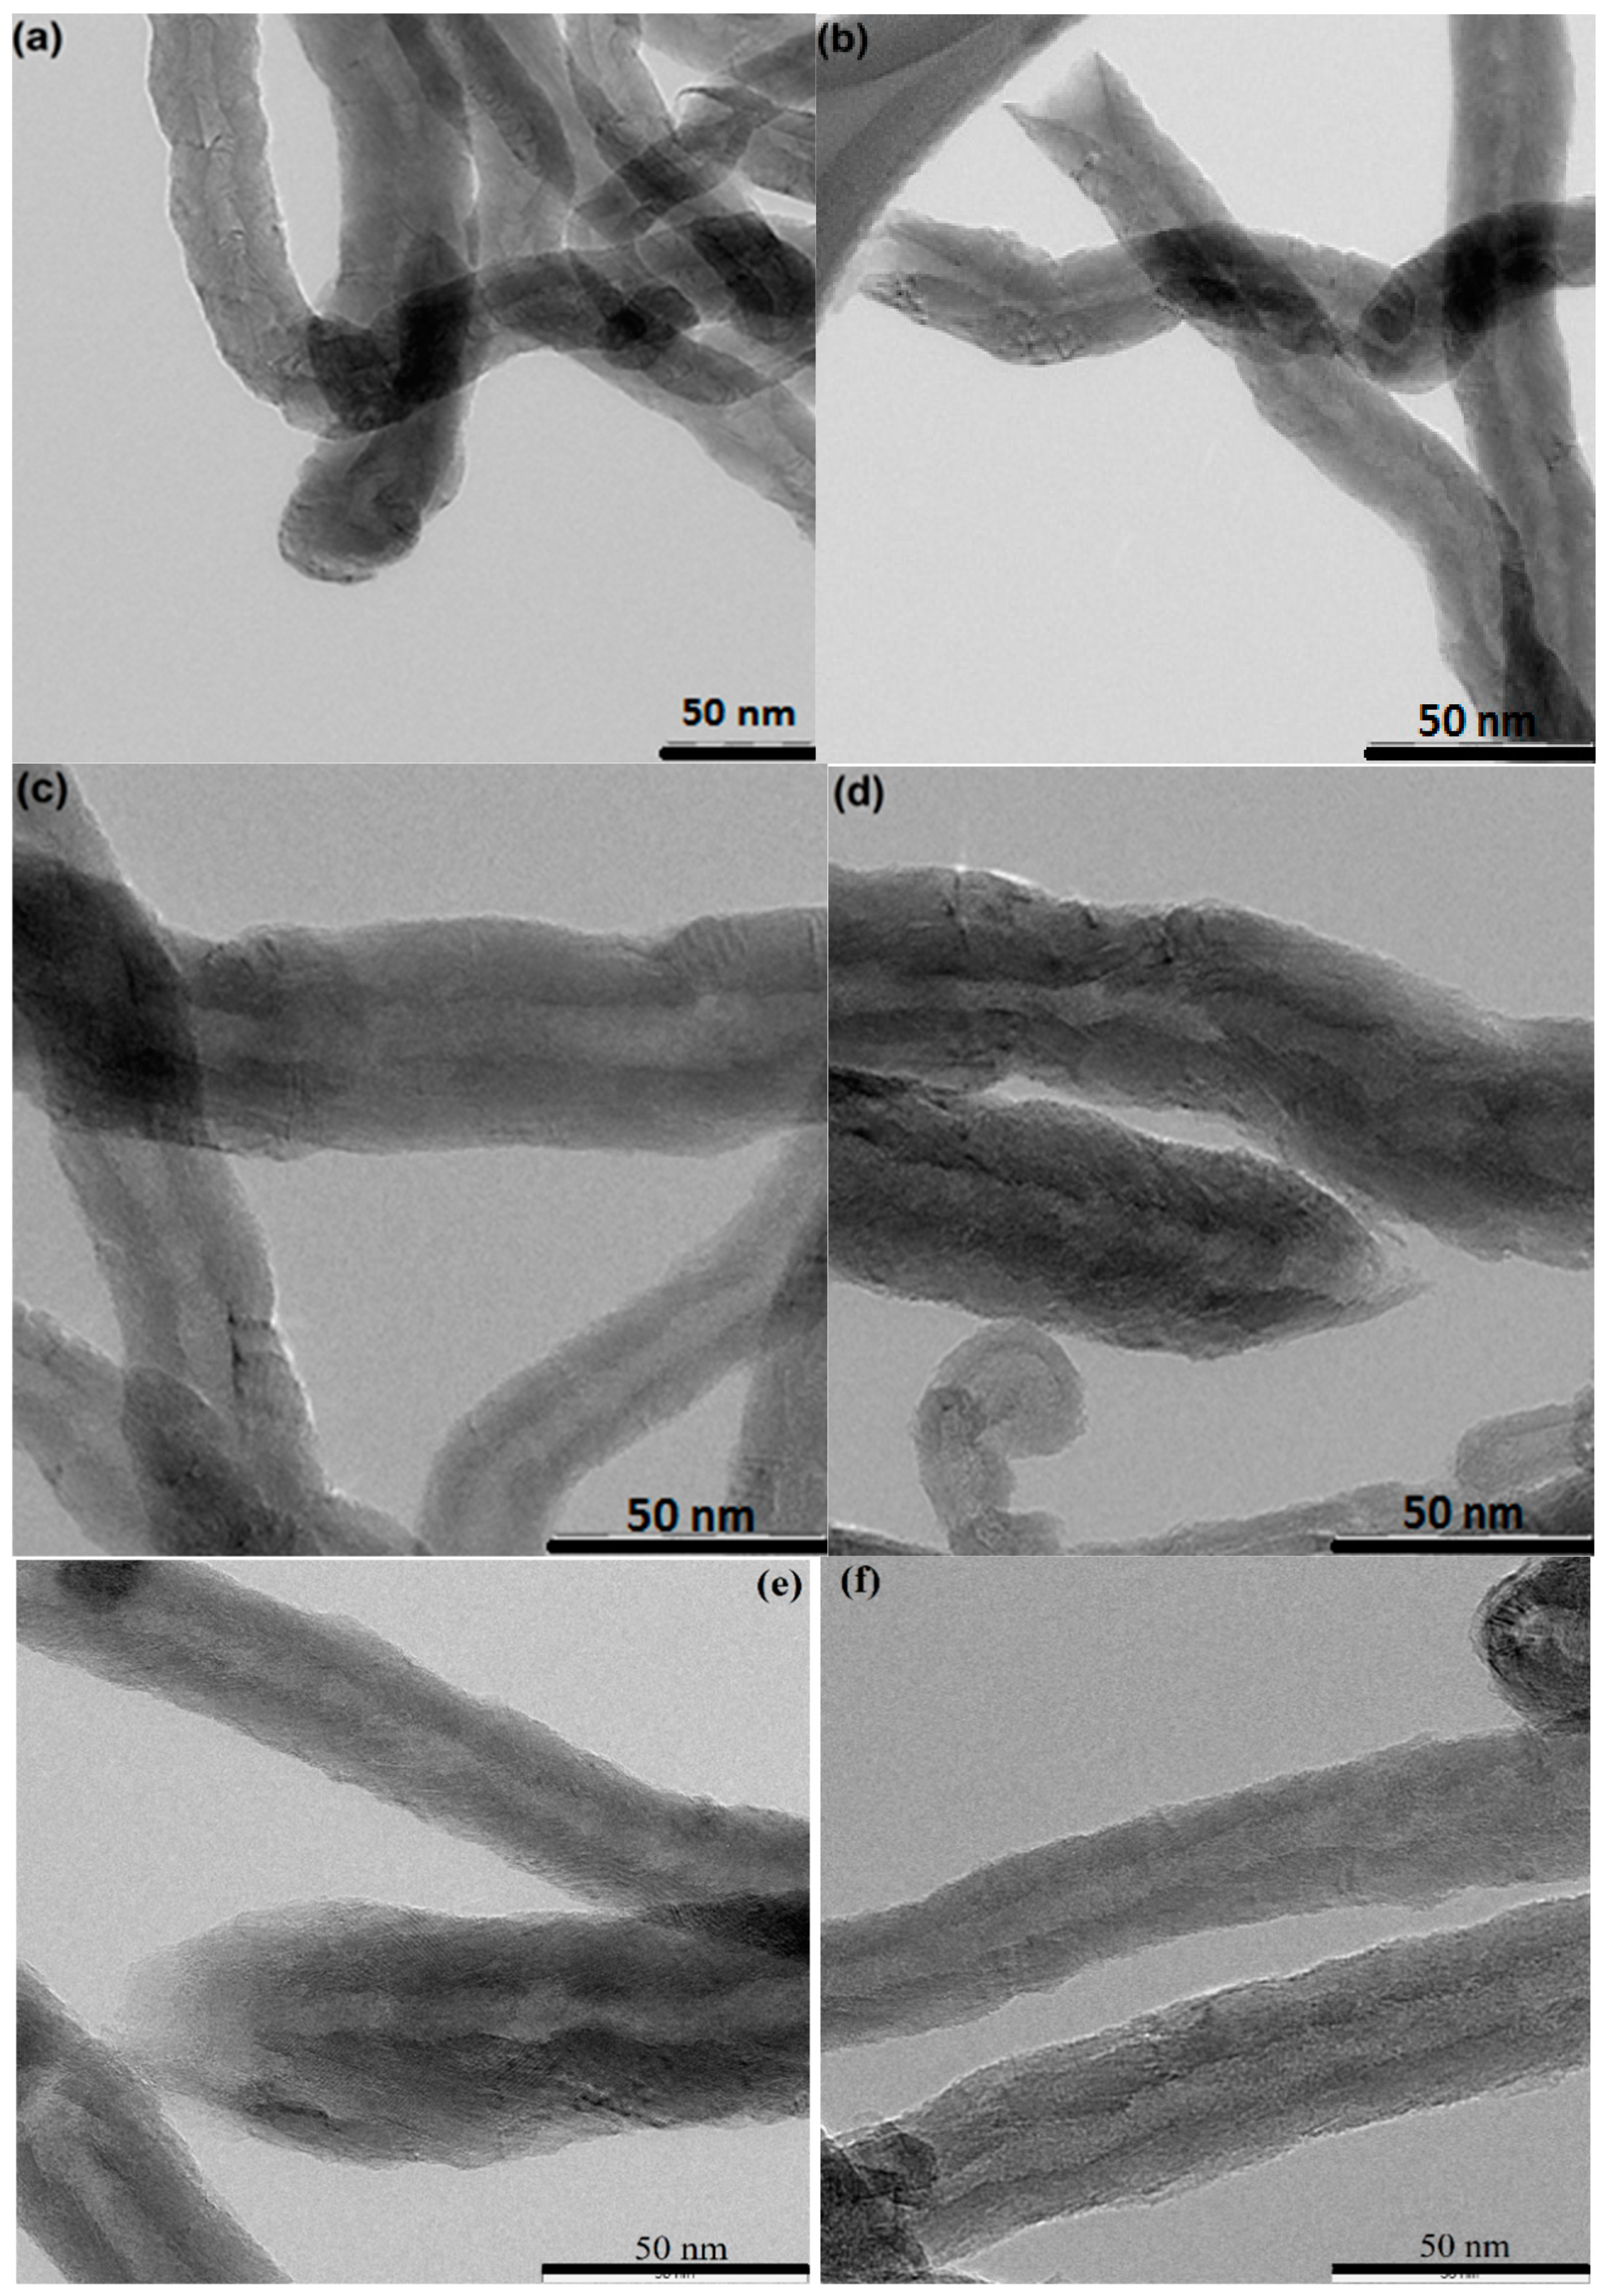
Figure 2a–f shows TEM micrographs of as-received CNT, CNT.5A.25, CNT.5A.110, CNT.10A.110, CNT.15A.110, and CNT.20A.110. For the naming of the catalyst samples the numbers before the letter A (which means “acid treated”) represent the duration of acidic treatment (in hours) and last three digits represent temperature used during the acid treatment. From the TEM micrographs they collectively show the acid treatment method was able to uncap the terminal cappings of the CNT and secondly, it introduced defects over the external surface of the CNT. Acid treatment has been shown to be an effective method to uncap CNT and cleave the nanotubes into segments [29]. Furthermore, Figure 2 shows the image of as-received CNT and that of the uncapped CNT after refluxing in concentrated nitric acid. As a result of uncapping the CNT it now could allow the cobalt nitrate to enter the various CNT tubular channels with ease during catalyst preparation [30].
Figure 3 shows FTIR spectra of the as-received CNT where a peak around 1700 cm−1 can be attributed to the oscillation of carboxylic groups. Upon acid treatments, the peak slightly shifted to a higher wavenumber. The presence of carboxylic groups in the CNT support can be described from possible elimination of the impregnated cobalt nanoparticles from the CNT during the purification process. In addition, a peak at 3430 cm−1 could possibly be associated with the –OH bending distortion in carboxylic acid groups. Moreover, comparable to that observed by Novoselov et al. [10]. Finally, it should be noted that the spectra of samples before and after HNO3 treatment, have no significant difference. However, the intensity of OH peak at 3500 cm−1 was found to escalate with escalation duration of the acid treatment.
Table 1 shows the surface area and pore volume of the as-received CNT and catalyst samples prepared in different experimental conditions. Removal of CNT caps via acid treatment increased the surface area and pore volume. Increasing acid treatment temperature and duration enhanced surface area and pore volume of the catalysts. Cold acid treatment at room temperature leads to an increase of BET surface area from 138.2 to 163.4 m2/g and for hot acid treatment in 110 °C increased to 270.6 m2/g.
Simultaneously, for cold treated CNT at 25 °C, pore volume of CNT increased from 0.26 to 0.35 cm3/g and for hot treated CNT increased to 0.56 cm3/g which could be due to presence of defects on CNT as indicated by the TEM results.
Figure 4 shows the Raman spectra of the as-received and acid-treated CNT at various experimental conditions. A peak for a disordered carbon at 1340 cm−1 attributed to the D-band tangential mode and a peak at 1580 cm−1 is for G-band peak for an ordered carbon [31,32]. Moreover, the second-order 2D feature at about 2700 cm−1 is observed for the as-received CNT samples and the C–H stretching vibration at 2920 cm−1 is related to treated samples only. Table 2 shows the Raman band intensity ratios ID/IG for treated CNT samples. Ratios of ID/IG represent the quality of carbon nanotubes of the catalyst supports. Ratios of ID/IG increased slightly with increasing duration of acid treatments. The results revealed the number of defects on the outer surface of CNT which increased with prolonged acid treatments. Therefore, the treated CNT as catalyst support could lead to enhanced dispersion, reduction in sintering and deactivation of metal catalytic particles during a Fischer–Tropsch reaction.
XRD patterns of CNT which were pre-treated under different experimental conditions are shown in Figure 5. Peaks at 2θ of 25° and 43° on Figure 5 correspond to those of carbon nanotubes and increasing acid treatment temperature has no influence on the intensity of the peaks.
Figure 6 shows the XRD patterns of Co supported CNT that have undergone various acid treatments. While the 2θ peaks at 25° and 43° in Figure 6 correspond to those of carbon nanotubes, other 2θ peaks at 32°, 36.8°, and 45° can be attributed to different crystal structures of Co3O4 and CoO [33]. The most intense peak at 36.8° in the XRD patterns was attributed to CoO and no peak for the CNT support was observed. Table 3 shows further data for the average particle size of the Co3O4 catalyst calculated from the XRD patterns and the Scherrer equation using peak at 36.8° and TEM images [34].
Increasing BET surface area and uncapping of the CNT tubular ends helped to increase catalyst active site distribution and lower the overall particle size. From Figure 2, by increasing acid treatment temperature from 25 to 100 °C, it led to an increase in the number of defects on CNT and provided an anchoring site for metal particles. On the other hand, acid treatments cleaved CNT and as a result, introduced functional groups on the surface of nanotubes [35]. Acidic functional groups on the surface of the CNT support have provided active sites during the preparation of the catalyst. Incipient wetness impregnation is the most common method of heterogeneous catalyst preparation and is carried out with a solution of the catalyst precursor, then dried and further captivated by either calcination and/or reduction. CNT are naturally hydrophobic and have low solubility in water-based solvents. Acidic functional groups decrease CNT hydrophobicity and introduce further surface modifications making them more susceptible to the aqueous solution of a catalyst precursor [35]. In addition, acid treatments could lead to more homogeneously dispersed impregnation of metal particles and a reduction in metal particle size as observed by the data from the TEM images and XRD patterns (Table 3).
Figure 7 displays the TPR spectra of the catalyst samples. The first peak in the TPR profile was in the range of 177 °C to 220 °C which was contributed to a reduction of Co3O4 to CoO. Furthermore, the second peak was attributed to the decline of the second step, CoO species to Co which was in a range of 377 to 477 °C. Gasification of the CNT support was represented by peak (f) at 600 °C. Acid treatments of the CNT support led to a decrease reduction temperature (from 294 to 200 °C) for the first TPR peak and for the second peak, the reduction temperature declined from 481 to 456 °C. In addition, for the acid treatment temperature at 100 °C, the first peak in the TPR profile decreased from 384 °C to 363 °C and the second TPR peak decreased from 481 to 448 °C. Acid treatments could result in uncapping of the CNT terminal end caps and cleaving the tubes at defects and imperfections caused by the acid treatment. This led to a lower temperature needed for cobalt particles reduction. While the reduction percentage from the H2-TPR profile can be calculated from Equation (4). Table 4 shows a catalyst reduction percentage during the H2-TPR analysis and Table 4 also shows that by increasing acid treatment duration up to 15 h it leads to an increase in reduction percentage up to 18.5%. Acid treatment applied in other to introduce OH functional groups to CNT surface and opening of CNT caps for catalyst encapsulation purpose. Tube shape CNT structure with open caps resulted confinement of particles in CNT channels and prevent metal active sites from agglomeration, sintering and deactivation. Increasing the acid treatment duration more than 15 h makes CNT to break down to the shorter segments and change the tube-shape CNT unique structure and properties and consequently lower reduction rate.
Table 5 shows the effect of different condition of acid treatments on the CNT thermal treated support against catalyst performance. With increasing acid treatment temperature and duration from 25 °C and 5 h to 110 °C and 15 h, FTS rate and % CO conversion, increased from 0.17 to 0.24 and 41% to 58.7% respectively. Table 5 also shows the WGS reaction rate decreased from 0.45 to 0.35 for higher temperature and longer duration of acid-treated CNT supports. By applying acid treatments on a CNT support it could increase the BET surface area, catalyst reducibility, number of surface active sites, FTS reaction rate and on the other hand, decrease catalyst particle size [36]. After the CNT acid treatments and an opening of the CNT terminal caps, the exterior surface of the CNT becomes more electron-rich relative to their electron-deficient interior surface [37]. The effect of surface electron distribution could influence the catalyst’s active sites. Table 5 shows CO conversion increased by up to 58.7%. Figure 8d shows confinement of catalyst active sites inside the CNT channels could lead to an interaction formed between the CNT internal surface Co particles and hence, causing more CO conversion.
In addition to the removal of the CNT end-caps, acid treatments could present a large number of functional groups on carbon nanotubes [38]. Acidic functional groups enhance hydrogen adsorption on the catalyst surface and increase the FTS rate. On the one hand, confinement of catalyst particles localized in certain areas across the CNT channels could lead to the increased density of reactants, higher local pressure and a suitable condition for syngas conversion to hydrocarbons [37].
Table 5 indicates a drop-in selectivity of methane from 44.3% to 9.5% and an increase from 35.1% to 83.2% for C5+ selectivity for the acid treated Co/CNT catalysts at various experimental conditions. The rate of olefin to paraffin ratio increased from 0.42 to 0.60 for the acid-treated CNT support and such an increase is due to a lower termination rate for the paraffin reaction.

3.2. Effects of Thermal Pre-Treatment Conditions on Co/CNT Properties and Performance

Thermal treatments were applied to induce structural changes in acid treated CNT. Thermal treatments can be exploited to introduce certain defects on nanotubes and also change their electrical properties. The application temperature for thermal treatment ranges from 600 °C to 900 °C [39,
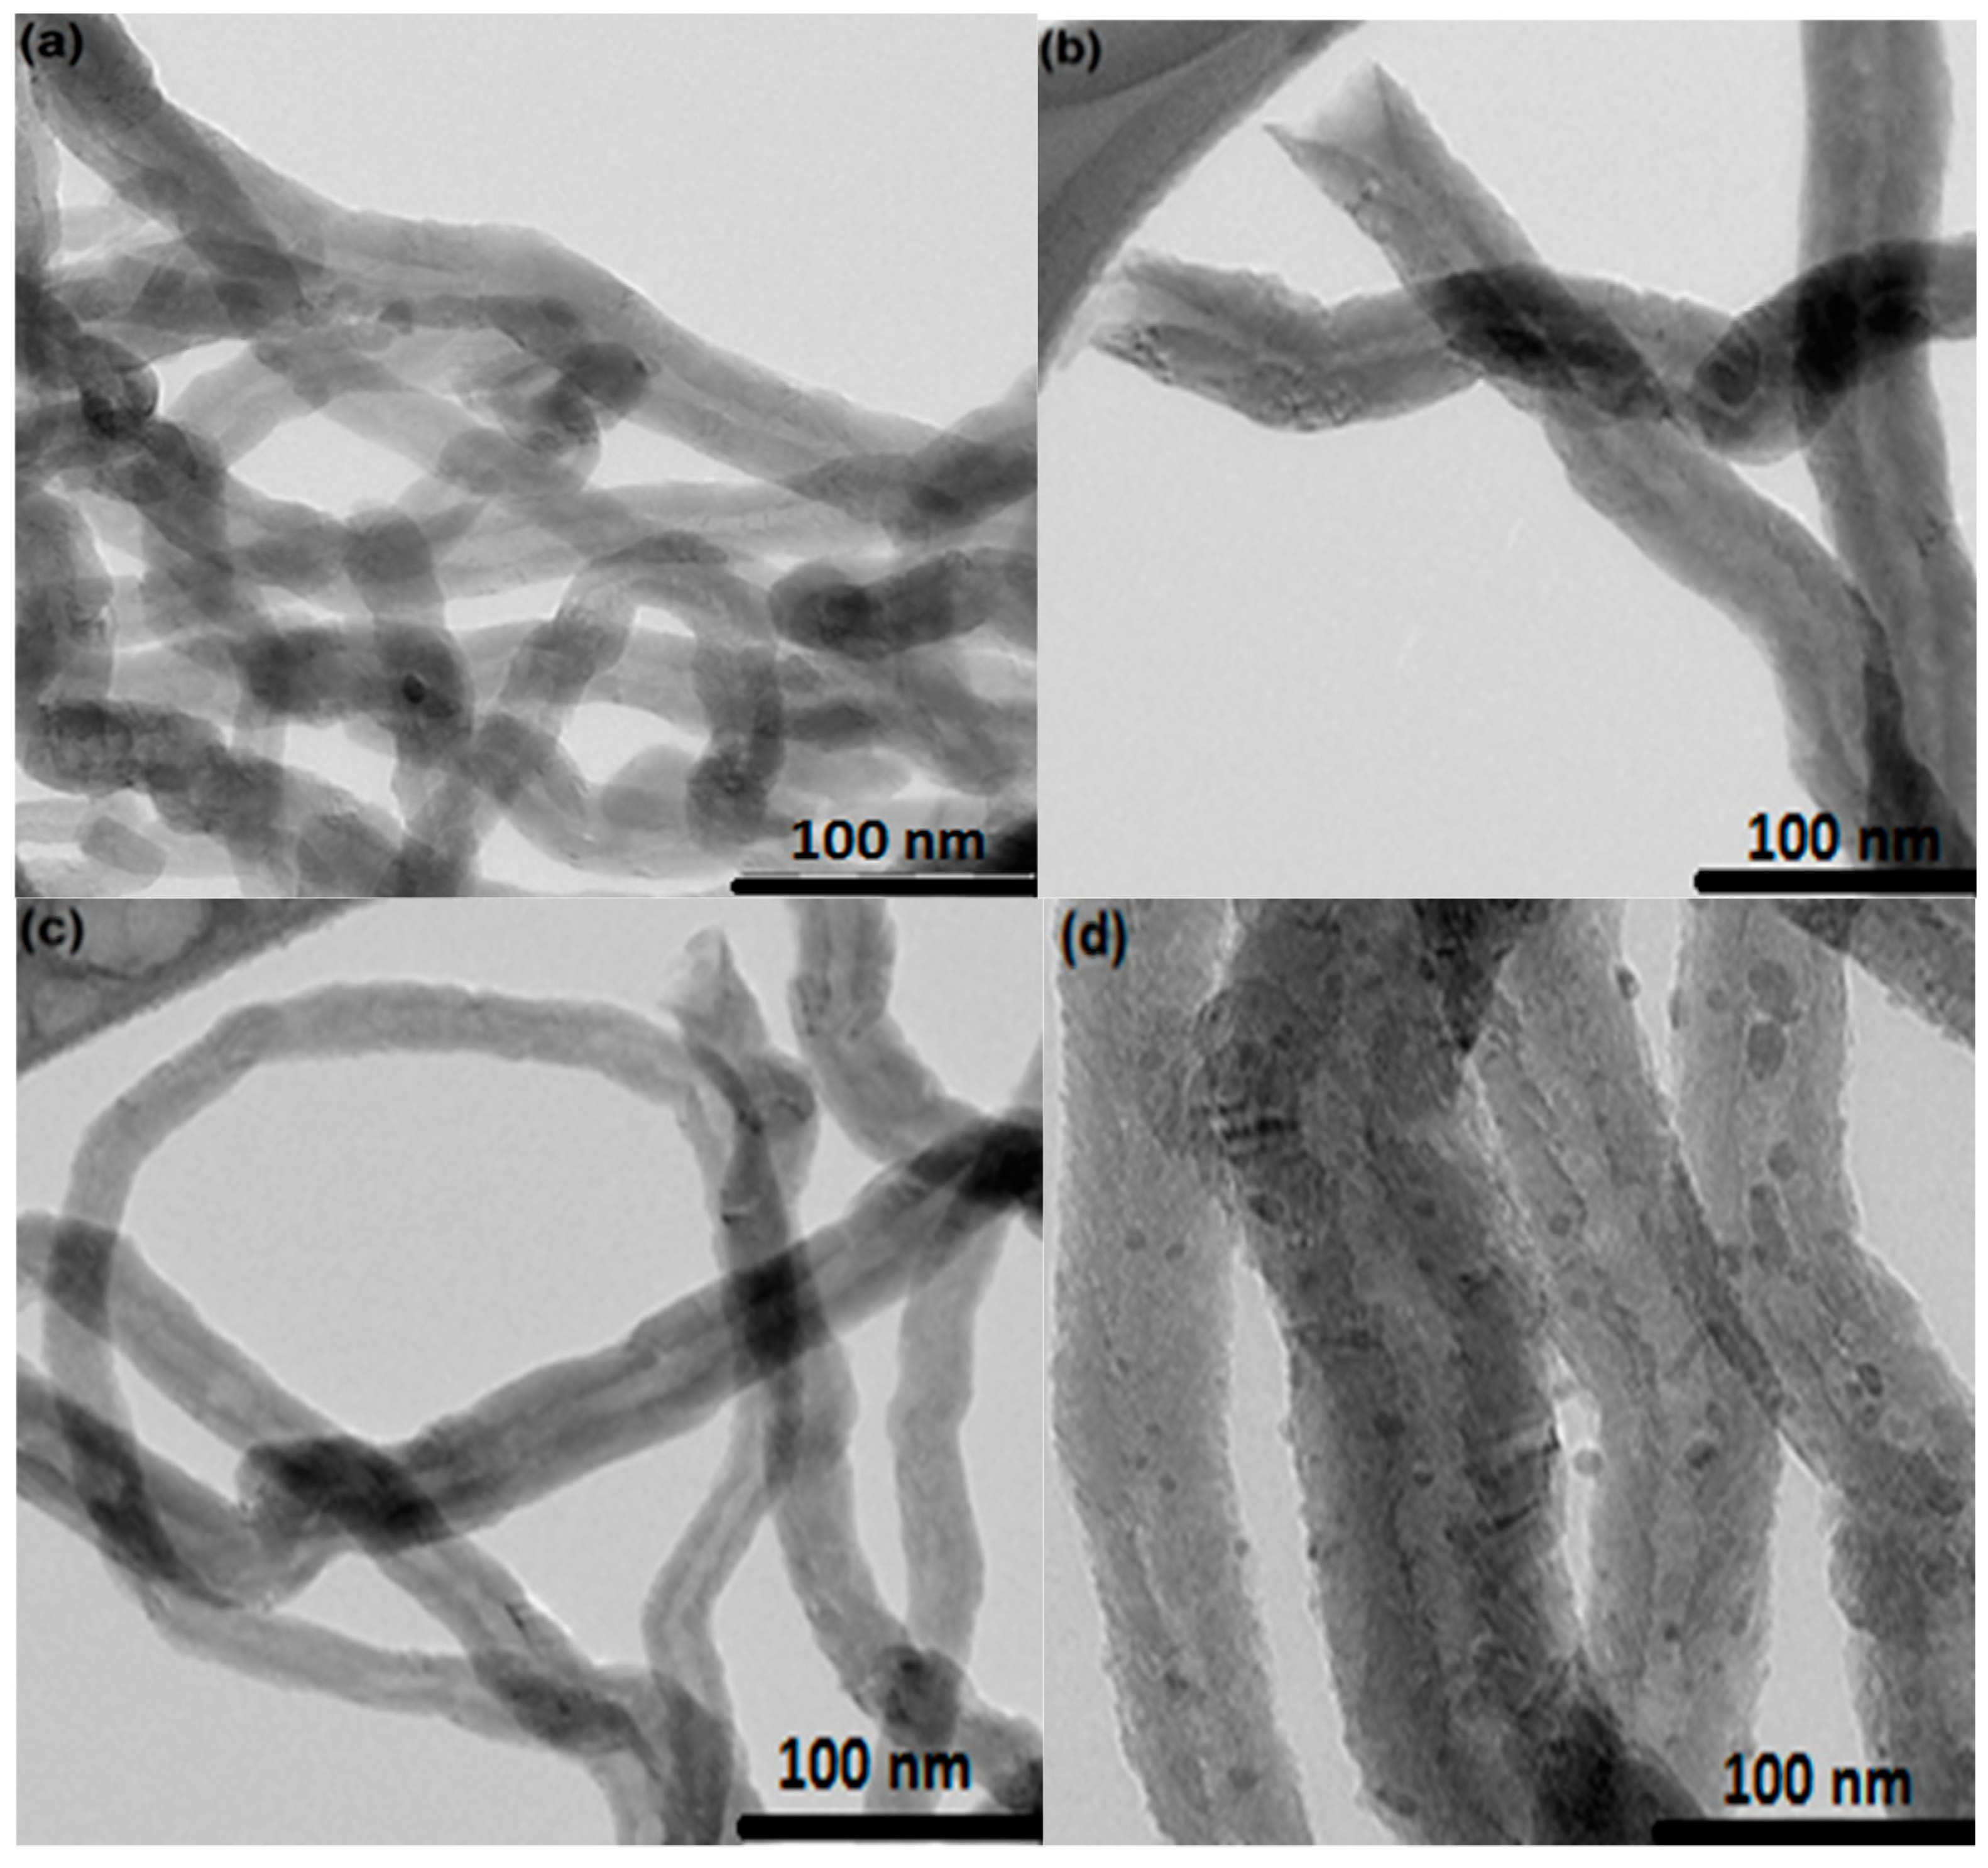
40]. In this study, the effects of acid and thermal treatments on the properties of CNT is introduced. The TEM micrographs of the CNT support and Co/CNT samples are shown in Figure 8. In this study also, thermal treatments were carried out after the acid treatments. TEM analysis shows that thermal treatments on CNT changed their morphology and introduced defects on the outer surface of CNT. After the thermal treatments, metal Co particles were presented on the CNT by a strong electrostatic adsorption method.
Following the acid pre-treatment step, functional groups containing oxygen such as –OH introduced on the surface of CNT could adsorb Co ions during impregnation method through the SEA process [41]. The –OH groups needs to be removed from the external surface of CNT due to a subsequent thermal treatment on nitric acid-treated CNT. But the –OH group was maintained in the interior surface of the CNT channels. By increasing temperature of the thermal pre-treatment, this feature resulted in increased encapsulation of cobalt oxide nanoparticles in CNT channels.
Table 6 shows the elemental composition of the calcined 10% total metal loading of Co/CNT catalysts after the acid and thermal treatment studied using energy-dispersive X-ray spectrometry. After the acid and thermal treatment, the purity of carbon nanotubes did not change (purity > 95%). The O content indicates functionalization has taken place and Co content was comparable to that observed from the AAS result.
Reducibility of a catalyst is one of the key factors affecting catalyst performance. The TPR profiles of pristine and acid-treated CNT are shown in Figure 7. Two reduction peaks were detected for the Co/CNT samples. The first peak was recorded around 300 °C which was associated with the reduction of Co3O4 to CoO [42] and the second peak was recorded at around 550 °C which was related to the reduction of CoO to Co [42].
The amount of the chemisorbed hydrogen calculated from the H2-TPR profiles and other associated parameters are tabulated in Table 7. Hydrogen consumption by the Co/CNT samples increased with increasing temperature of the thermal pre-treatment of the CNT support which could be due confinement of Co particles inside the CNT channels, a bigger particle size, and a lower metal-support interaction. Equations (1) and (2) were used to calculate reduction and dispersion percentage, respectively [43].
Reduction % and the number of Co active sites [44] on the catalysts can be obtained from H2-TPD profiles [45] and the results are presented in Table 7. Increasing temperature of the thermal pre-treatment from 600 °C to 900 °C resulted in a significant improvement of the catalyst reducibility and dispersion of Co nanoparticles. Increasing Co/CNT reducibility could be related to unique textural properties of CNT and low interaction of Co nanoparticles with the thermal pre-treated CNT support at high temperature (900 °C). CNT-supported catalysts contained a high number of active sites inside the CNT channels which increased with increasing temperature of thermal pre-treatment. The observed trend could be because of narrow particle size distribution, improvement in reducibility, and high dispersion of Co oxide nanoparticles inside the CNT support channels [46,47].
Thermogravimetric analysis results are shown in Figure 9 for the CNT acid and thermally treated sample at a high temperature of 900 °C (CNT.A.900). A sharp weight loss for the catalyst was observed to start around 300 °C and continued up to 500 °C. After 500 °C the weight loss became negligible. Calcination of the catalyst at 300 °C for 3 h removed moisture and counter ions present in the catalyst.

3.3. Effect of pH and Thermal Pre-Treatment on Catalyst Properties and Performance

In an aqueous medium like water, when particles were dispersed in a polar medium, surface charges on particles could determine the state of aggregation or dispersion. With a change in pH, the state of particles like aggregation or dispersion is influenced by polarity and extent of surface charges developed by particles [48]. Figure 10 shows a plot of pH values versus particle size in a 10 wt% metal particle suspension. With increasing pH to 14, the particle size increased and reached its optimum largest size (6–8 nm) when pH increased to 14. In order to measure the average particle size of the catalyst particles, 150 cobalt particles were analyzed by micrographs obtained from TEM analysis.
Figure 11 shows the influence of thermal treatment temperature on cobalt particle size for the prepared samples at pH 14. With increasing thermal treatment temperature from 600 to 900 °C, the cobalt particle size decreased from 10.2 to 7.3 nm accordingly. A decrease in cobalt particle size was due to thermal treatments which removed more OH functional groups from the external surface of the CNT support channels and therefore, led to a higher uptake of particles inside the CNT channels.
The following describes the Fischer–Tropsch synthesis (FTS) reaction that was carried out for the Co catalyst samples prepared on the CNT support that have undergone thermal pre-treatment at various temperatures. Table 8 shows at same thermal treatment temperature (900 °C), increasing pH during the FTS reaction from 12 to 14, led to an increase in CO conversion from 40.4% to 58.7% respectively.
During the preparation of the studied catalysts via the strong electrostatic adsorption (SEA) method, increasing the pH led to a higher uptake of metal Co nanoparticles on the CNT surface and thus resulted in a higher CO conversion. Increasing the pH during the Co uptake step via adding concentrated nitric acid led to introduce higher rate of OH functional group and consequently led to uptake more catalytic active sites on the CNT support and led to an increase in C5+ from 69.7% to 83.2%. The highest C5+ selectivity (83.2%) for the 10% Co/CNT catalyst belongs to the sample prepared at 900 °C thermal treatment and pH 14. Decreasing the pH and thermal treatment temperature led to a decrease in C5+ selectivity as low as 69.7%. In addition, the olefin to paraffin ratio also followed the same trends with those observed for the C5+ selectivity. The highest olefin to paraffin ratio (0.60) belongs to the 10% Co/CNT catalyst sample which was prepared at 900 °C thermal treatment and pH 14. On the other hand, decreasing the thermal treatment temperature and pH led to a decrease in olefin to paraffin ratio as low as 0.50. In order to confirm results reproducibility, all catalysts were reproduced twice.
Figure 12 indicated the effects of cobalt particle size on C5+ and CH4 selectivity, olefin/paraffin mass ratio and FTS rate. The results show increasing metal particles beyond 8 nm in particle size led to a decline in the FTS activity. Bezemer et al. reported a higher FTS activity and a higher cobalt active sites on the CNT surface having less than 10 nm particle size distribution on carbon nano-fiber supports [49,50]. Chen et al. reported that particle size is not the only role player in an FTS activity but also confinement of catalytic active sites inside CNT support channels has a significant effect (Figure 8d) [51]. Figure 12 shows a decline in selectivity of CH4 and an increase in C5+ in the range of 6–8 nm catalyst particle size.

4. Conclusions

In this study, a Co catalyst prepared on acid- and thermal- treated CNT support using an SEA method was reported. Acid and thermal pre-treatments on the CNT influenced structural, morphological and physicochemical properties of the catalyst. Acid treatment and increasing acid treatment duration and temperature to 20 h and 110 °C resulted in an increase in the BET surface area from 138.2 to 270.6 m2/g. Dispersion of Co metal nanoparticles on the acid-treated CNT improved to 29.1% for the CNT sample which was thermally pre-treated at 900 °C. Increasing temperature of CNT pretreatment also resulted in a better deposition of Co nanoparticles within the inner walls of the CNT. Performance of the Co catalyst supported CNT were verified using an FTS reaction which were previously thermally treated at various temperatures. The results show that for the Co catalyst which was thermally pre-treated at 900 °C, a greater fraction of nanoparticles was found in the interior surface of the CNT support channels, leading to enhanced activity and C5+ selectivity compared to those deposited on CNT which were pre-treated at lower temperatures.

Author Contributions

Conceptualization, O.A.; methodology, O.A.; validation, Y.A.W.; formal analysis, N.A.H.; investigation, O.A.; resources, M.S., S.A. and E.R.; data curation, O.A.; writing—original draft preparation, O.A.; writing—review and editing, Z.M.A.M.; visualization, W.A.Y.; supervision, M.R.J. and N.A.M.Z.; funding acquisition, M.R.J. and N.A.M.Z.

Funding

Universiti Teknologi PETRONAS, University of Malaya, Nanotechnology and Catalysis Research Centre (RU011-2017 Grant) and Ministry of Education of Malaysia under the Fundamental Research Grant Scheme FRGS/1/2012/SG01/UTP/02/01.

Acknowledgments

The authors acknowledge the Universiti Teknologi PETRONAS and University of Malaya for support.

Conflicts of Interest

The authors declare no conflict of interest.

References

  1. Davis, B.H. Fischer−Tropsch Synthesis:  Comparison of Performances of Iron and Cobalt Catalysts. Ind. Eng. Chem. Res. 2007, 46, 8938–8945. [Google Scholar] [CrossRef]
  2. Iglesia, E. Design, synthesis, and use of cobalt-based Fischer-Tropsch synthesis catalysts. Appl. Catal. A Gen. 1997, 161, 59–78. [Google Scholar] [CrossRef]
  3. Akbarzadeh, O.; Mohd Zabidi, N.; Abdul Wahab, Y.; Hamizi, N.; Chowdhury, Z.; Merican Aljunid Merican, Z.; Ab Rahman, M.; Akhter, S.; Rasouli, E.; Johan, M. Effect of Cobalt Catalyst Confinement in Carbon Nanotubes Support on Fischer-Tropsch Synthesis Performance. Symmetry 2018, 10, 572. [Google Scholar] [CrossRef]
  4. Elbashir, N.O.; Roberts, C.B. Enhanced incorporation of α-olefins in the Fischer-Tropsch synthesis chain-growth process over an alumina-supported cobalt catalyst in near-critical and supercritical hexane media. Ind. Eng. Chem. Res. 2005, 44, 505–521. [Google Scholar] [CrossRef]
  5. Storsæter, S.; Tøtdal, B.; Walmsley, J.C.; Tanem, B.S.; Holmen, A. Characterization of alumina-, silica-, and titania-supported cobalt Fischer–Tropsch catalysts. J. Catal. 2005, 236, 139–152. [Google Scholar] [CrossRef]
  6. Zhu, Y.; Ye, Y.; Zhang, S.; Leong, M.E.; Tao, F.J. Synthesis and catalysis of location-specific cobalt nanoparticles supported by multiwall carbon nanotubes for Fischer–Tropsch synthesis. Langmuir 2012, 28, 8275–8280. [Google Scholar] [CrossRef] [PubMed]
  7. Den Breejen, J.; Radstake, P.; Bezemer, G.; Bitter, J.; Frøseth, V.; Holmen, A.; Jong, K. On the origin of the cobalt particle size effects in Fischer–Tropsch catalysis. J. Am. Chem. Soc. 2009, 131, 7197–7203. [Google Scholar] [CrossRef]
  8. Akbarzadeh, O.; Mohd Zabidi, N.A.; Abdullah, B.; Subbarao, D. Influence of Acid and Thermal Treatments on Properties of Carbon Nanotubes. Adv. Mater. Res. 2014, 832, 394–398. [Google Scholar] [CrossRef]
  9. Sun, X.; Li, Y. Colloidal carbon spheres and their core/shell structures with noble-metal nanoparticles. J. Catal. 2004, 116, 607–611. [Google Scholar]
  10. Novoselov, K.S.; Geim, A.K.; Morozov, S.V.; Jiang, D.; Katsnelson, M.I.; Grigorieva, I.V.; Dubonos, S.V.; Firsov, A.A. Two-dimensional gas of massless Dirac fermions in graphene. Nature 2005, 438, 197–200. [Google Scholar] [CrossRef] [Green Version]
  11. Abbaslou, R.M.M.; Tavassoli, A.; Soltan, J.; Dalai, A.K. Iron catalysts supported on carbon nanotubes for Fischer–Tropsch synthesis: Effect of catalytic site position. Appl. Catal. A Gen. 2009, 367, 47–52. [Google Scholar] [CrossRef]
  12. Akbarzadeh, O.; Zabidi, N.A.M.; Abdullah, B.; Subbarao, D. Dispersion of Co/CNTs via strong electrostatic adsorption method: Thermal treatment effect. AIP Conf. Proc. 2015, 1669, 020052. [Google Scholar]
  13. Chen, W.; Fan, Z.; Pan, X.; Bao, X. Effect of confinement in carbon nanotubes on the activity of Fischer− Tropsch iron catalyst. J. Am. Chem. Soc. 2008, 130, 9414–9419. [Google Scholar] [CrossRef] [PubMed]
  14. Tavasoli, A.; Trépanier, M.; Dalai, A.K.; Abatzoglou, N. Effects of confinement in carbon nanotubes on the activity, selectivity, and lifetime of Fischer− Tropsch Co/carbon nanotube catalysts. J. Chem. Eng. Data 2010, 55, 2757–2763. [Google Scholar] [CrossRef]
  15. Trépanier, M.; Tavasoli, A.; Dalai, A.K.; Abatzoglou, N. Co, Ru and K loadings effects on the activity and selectivity of carbon nanotubes supported cobalt catalyst in Fischer–Tropsch synthesis. Appl. Catal. A Gen. 2009, 353, 193–202. [Google Scholar] [CrossRef]
  16. Akbarzadeh, O.; Mohd Zabidi, N.A.; Abdullah, B.; Subbarao, D. Synthesis of Co/CNTs Catalyst via Strong Electrostatic Adsorption: Effect of Calcination Condition. Adv. Mater. Res. 2015, 1109, 1–5. [Google Scholar] [CrossRef]
  17. Maitlis, P.M.; Zanotti, V. The role of electrophilic species in the Fischer–Tropsch reaction. Chem. Commun. 2009, 0, 1619–1634. [Google Scholar] [CrossRef]
  18. Dry, M. Chemical concepts used for engineering purposes. Stud. Surf. Sci. Catal. 2004, 152, 196–257. [Google Scholar]
  19. Hexana, W.M. A systematic study of the effect of chemical promoters on the precipitated Fe-based Fischer-Tropsch Synthesis catalyst. Ph.D. Thesis, Faculty of Science, University of the Witwatersrand, Johannesburg, South Africa, 2009. [Google Scholar]
  20. Akbarzadeh, O.; Mohd Zabidi, N.A.; Abdullah, B.; Subbarao, D. Synthesis and Characterization of Co/CNTs Catalysts Prepared by Strong Electrostatic Adsorption (SEA) Method. Appl. Mech. Mater. 2014, 625, 328–332. [Google Scholar] [CrossRef]
  21. Park, J.; Regalbuto, J.R. A simple, accurate determination of oxide PZC and the strong buffering effect of oxide surfaces at incipient wetness. J. Colloid Interface Sci. 1995, 175, 239–252. [Google Scholar] [CrossRef]
  22. Davari, M.R.; Bayat Kazazi, S.; Akbarzadeh Pivehzhani, O. Nanomaterials: Implications on Agroecosystem. In Nanotechnology: An Agricultural Paradigm; Prasad, R., Kumar, M., Kumar, V., Eds.; Springer Singapore: Singapore, 2017; pp. 59–71. [Google Scholar]
  23. Zolfaghari, Z.; Tavasoli, A.; Tabyar, S.; Pour, A.N. Enhancement of bimetallic Fe-Mn/CNTs nano catalyst activity and product selectivity using microemulsion technique. J. Energy Chem. 2014, 23, 57–65. [Google Scholar] [CrossRef]
  24. Tavasoli, A.; Taghavi, S. Performance enhancement of bimetallic Co-Ru/CNTs nano catalysts using microemulsion technique. J. Energy Chem. 2013, 22, 747–754. [Google Scholar] [CrossRef]
  25. Jacobs, G.; Das, T.K.; Zhang, Y.; Li, J.; Racoillet, G.; Davis, B.H. Fischer–Tropsch synthesis: Support, loading, and promoter effects on the reducibility of cobalt catalysts. Appl. Catal. A Gen. 2002, 233, 263–281. [Google Scholar] [CrossRef]
  26. Jacobs, G.; Patterson, P.M.; Das, T.K.; Luo, M.; Davis, B.H. Fischer–Tropsch synthesis: Effect of water on Co/Al2O3 catalysts and XAFS characterization of reoxidation phenomena. Appl. Catal. A Gen. 2004, 270, 65–76. [Google Scholar] [CrossRef]
  27. Tavasoli, A.; Mortazavi, Y.; Khodadadi, A.A.; Mousavian, M.A.; Sadagiani, K.; Karimi, A. Effects of different loadings of Ru and Re on physico-chemical properties and performance of 15% Co/Al2O3 FTS catalysts. Iran. J. Chem. Chem. Eng. 2005, 24, 9–17. [Google Scholar]
  28. Hamizi, N.A.; Johan, M.R.; Chowdhury, Z.Z.; Wahab, Y.A.; Al-Douri, Y.; Saat, A.M.; Pivehzhani, O.A. Raman spectroscopy and FTIR spectroscopy studies of Mn-doped CdSe QDs at different particles size. Optik 2019, 179, 628–631. [Google Scholar] [CrossRef]
  29. D’souza, L.; Regalbuto, J.; Miller, J. Preparation of carbon supported cobalt by electrostatic adsorption of [Co (NH 3) 6] Cl 3. J. Catal. 2008, 254, 157–169. [Google Scholar] [CrossRef]
  30. Gosselink, R.; Van Den Berg, R.; Xia, W.; Muhler, M.; De Jong, K.; Bitter, J. Gas phase oxidation as a tool to introduce oxygen containing groups on metal-loaded carbon nanofibers. Carbon 2012, 50, 4424–4431. [Google Scholar] [CrossRef]
  31. Leofanti, G.; Padovan, M.; Tozzola, G.; Venturelli, B. Surface area and pore texture of catalysts. Catal. Today 1998, 41, 207–219. [Google Scholar] [CrossRef]
  32. Jing, L.; Huang, C.; Bai, S.; Jiang, Y.; Li, Z. Thermal decomposition and cobalt species transformation of carbon nanotubes supported cobalt catalyst for Fischer-Tropsch synthesis. J. Nat. Gas Chem. 2012, 21, 37–42. [Google Scholar]
  33. Jongsomjit, B.; Panpranot, J.; Goodwin, J.G. Co-support compound formation in alumina-supported cobalt catalysts. J. Catal. 2001, 204, 98–109. [Google Scholar] [CrossRef]
  34. Tavasoli, A.; Abbaslou, R.M.M.; Trepanier, M.; Dalai, A.K. Fischer–Tropsch synthesis over cobalt catalyst supported on carbon nanotubes in a slurry reactor. Appl. Catal. A Gen. 2008, 345, 134–142. [Google Scholar] [CrossRef]
  35. Winter, F.; Bezemer, G.L.; van der Spek, C.; Meeldijk, J.D.; van Dillen, A.J.; Geus, J.W.; de Jong, K.P. TEM and XPS studies to reveal the presence of cobalt and palladium particles in the inner core of carbon nanofibers. Carbon 2005, 43, 327–332. [Google Scholar] [CrossRef] [Green Version]
  36. Mirzaei, A.A.; Faizi, M.; Habibpour, R. Effect of preparation conditions on the catalytic performance of cobalt manganese oxide catalysts for conversion of synthesis gas to light olefins. Appl. Catal. A Gen. 2006, 306, 98–107. [Google Scholar] [CrossRef]
  37. Tavasoli, A.; Sadagiani, K.; Khorashe, F.; Seifkordi, A.; Rohani, A.; Nakhaeipour, A. Cobalt supported on carbon nanotubes—A promising novel Fischer–Tropsch synthesis catalyst. Fuel Process. Technol. 2008, 89, 491–498. [Google Scholar] [CrossRef]
  38. Li, C.-H.; Yao, K.-F.; Liang, J. Influence of acid treatments on the activity of carbon nanotube-supported catalysts. Carbon 2003, 41, 858–860. [Google Scholar] [CrossRef]
  39. Iglesia, E.; Reyes, S.C.; Soled, S.L. Reaction-Transport Selectivity Models and the Design of Fischer-Tropsch Catalysts; Chemical Industries; Marcel Dekker: New York, NY, USA, 1993; p. 199. [Google Scholar]
  40. Behler, K.; Osswald, S.; Ye, H.; Dimovski, S.; Gogotsi, Y. Effect of thermal treatment on the structure of multi-walled carbon nanotubes. J. Nanoparticle Res. 2006, 8, 615–625. [Google Scholar] [CrossRef]
  41. Akbarzadeh, O.; Mohd Zabidi, N.A.; Abdullah, B.; Subbarao, D. Synthesis of Co/CNTs via Strong Electrostatic Adsorption: Effect of Metal Loading. Adv. Mater. Res. 2014, 1043, 101–104. [Google Scholar] [CrossRef]
  42. Xiong, H.; Motchelaho, M.A.; Moyo, M.; Jewell, L.L.; Coville, N.J. Correlating the preparation and performance of cobalt catalysts supported on carbon nanotubes and carbon spheres in the Fischer–Tropsch synthesis. J. Catal. 2011, 278, 26–40. [Google Scholar] [CrossRef]
  43. Zhang, D.; Fu, H.; Shi, L.; Fang, J.; Li, Q. Carbon nanotube assisted synthesis of CeO 2 nanotubes. J. Solid State Chem. 2007, 180, 654–660. [Google Scholar] [CrossRef]
  44. Martínez, A.; López, C.; Márquez, F.; Díaz, I. Fischer–Tropsch synthesis of hydrocarbons over mesoporous Co/SBA-15 catalysts: The influence of metal loading, cobalt precursor, and promoters. J. Catal. 2003, 220, 486–499. [Google Scholar] [CrossRef]
  45. Storsæter, S.; Borg, Ø.; Blekkan, E.A.; Tøtdal, B.; Holmen, A. Fischer–Tropsch synthesis over Re-promoted Co supported on Al2O3, SiO2 and TiO2: Effect of water. Catal. Today 2005, 100, 343–347. [Google Scholar] [CrossRef]
  46. Chu, W.; Chernavskii, P.A.; Gengembre, L.; Pankina, G.A.; Fongarland, P.; Khodakov, A.Y. Cobalt species in promoted cobalt alumina-supported Fischer–Tropsch catalysts. J. Catal. 2007, 252, 215–230. [Google Scholar] [CrossRef]
  47. Saib, A.; Borgna, A.; Van de Loosdrecht, J.; Van Berge, P.; Geus, J.; Niemantsverdriet, J. Preparation and characterisation of spherical Co/SiO2 model catalysts with well-defined nano-sized cobalt crystallites and a comparison of their stability against oxidation with water. J. Catal. 2006, 239, 326–339. [Google Scholar] [CrossRef]
  48. Zangi, R.; Berne, B. Aggregation and dispersion of small hydrophobic particles in aqueous electrolyte solutions. J. Phys. Chem. B 2006, 110, 22736–22741. [Google Scholar] [CrossRef] [PubMed]
  49. Bezemer, G.L.; Radstake, P.; Koot, V.; Van Dillen, A.; Geus, J.; De Jong, K. Preparation of Fischer–Tropsch cobalt catalysts supported on carbon nanofibers and silica using homogeneous deposition-precipitation. J. Catal. 2006, 237, 291–302. [Google Scholar] [CrossRef] [Green Version]
  50. Bezemer, G.L.; Bitter, J.H.; Kuipers, H.P.; Oosterbeek, H.; Holewijn, J.E.; Xu, X.; Kapteijn, F.; van Dillen, A.J.; de Jong, K.P. Cobalt particle size effects in the Fischer-Tropsch reaction studied with carbon nanofiber supported catalysts. J. Am. Chem. Soc. 2006, 128, 3956–3964. [Google Scholar] [CrossRef] [PubMed]
  51. Akbarzadeh, O.; Mohd Zabidi, N.; Abdul Wahab, Y.; Hamizi, N.; Chowdhury, Z.; Aljunid Merican, Z.; Ab Rahman, M.; Akhter, S.; Shalauddin, M.; Johan, M. Effects of Cobalt Loading, Particle Size, and Calcination Condition on Co/CNT Catalyst Performance in Fischer–Tropsch Reactions. Symmetry 2018, 11, 7. [Google Scholar] [CrossRef]
Figure 1. Determination of (a) point of zero charges (PZC) of the carbon nanotubes (CNT) support, and (b) Co uptake versus pH analyzed by atomic absorption spectrophotometry (AAS).
Symmetry 11 00050 g001
Figure 2. TEM images of (a) as-received CNT, (b) CNT.5A.25, (c) CNT.5A.110, (d) CNT.10A.110, (e) CNT.15A.110, and (f) CNT.20A.110.
Symmetry 11 00050 g002
Figure 3. FTIR spectra of (a) as-received CNT, (b) CNT.5A.25, (c) CNT.5A.110, (d) CNT.10A.110, (e) CNT.15A.110, and (f) CNT.20A.110.
Symmetry 11 00050 g003
Figure 4. Raman spectra of (a) CNT.10A.110, (b) CNT.5A.25, (c) CNT.5A.110, and (d) as-received CNT.
Symmetry 11 00050 g004
Figure 5. XRD patterns of (a) as-received CNT, (b) CNT.A.25, and (c) CNT.A.110.
Symmetry 11 00050 g005
Figure 6. XRD patterns of (a) Co3O4 standard, (b) Co/as-received CNT, (c) Co/CNT.15A.25, (d) Co/CNT.15A.110, and (e) Co/CNT.20A.110.
Symmetry 11 00050 g006
Figure 7. TPR-H2 profile of (a) Co/CNT.5A.25, (b) Co/CNT.5A.110, (c) Co/CNT.10A.110, (d) Co/CNT.15A.110 (e) Co/CNT.20A.110, and (f) as-received CNT.
Symmetry 11 00050 g007
Figure 8. TEM images of (a) as-received CNT (b) CNT.A (c) CNT.A.900, and (d) Co/CNT.A.T900.
Symmetry 11 00050 g008
Figure 9. Thermo-gravimetric analysis of CNT.A.900 under argon flow.
Symmetry 11 00050 g009
Figure 10. Effect of pH on the cobalt average particle size using CNT.A.900.
Symmetry 11 00050 g010
Figure 11. Effect of the CNT thermal treatment on cobalt particle size prepared at pH 14.
Symmetry 11 00050 g011
Figure 12. Influence of cobalt particles size on (a) FTS rate (b) olefin to paraffin ratio, (c) C5+ selectivity, and (d) CH4 selectivity.
Symmetry 11 00050 g012
Table 1. Surface area and pore volume data for treated CNT samples under various conditions.
Sample *BET Surface Area (m2/g)Pore Volume (cm3/g)
CNT As-received138.20.26
CNT.5A.25163.40.35
CNT.5A.110216.80.41
CNT.10A.110245.30.49
CNT.15A.110266.40.54
CNT.20A.110270.60.56
* A number before letter A refer to a CNT sample with a specific acid (A) treatment duration (in hour) and last three-digit number refer to the acid treatment temperature.
Table 2. The intensity ratios ID/IG for acid treated CNT samples at various experimental conditions.
SamplesIDIGID/IG
As-received CNT1358.991593.200.853
CNT. 5A.251581.241411.811.1200
CNT.5A.1101591.631389.491.1454
CNT.10A.1101554.031346.891.1537
Table 3. Catalyst particle size determined from TEM and XRD data.
Samples XRD dCo3O4 (nm) TEM Size (nm)
Co/CNT.5A.259.79.8
Co/CNT.5A.1109.08.9
Co/CNT.10A.1108.28.1
Co/CNT.15A.1107.47.3
Co/CNT.20A.1107.37.2
Table 4. H2-TPR of the catalyst sample with various acid treatment duration and temperature.
Samples 1st TPR Peak (°C)2nd TPR Peak (°C)Reduction (%)
CNT as-received----600----
Co/CNT.5A.2520040011.4
Co/CNT.5A.11021140914.6
Co/CNT.10A.11021942016.7
Co/CNT.15A.11023042518.5
Co/CNT.20A.11025045512.0
Table 5. Effect of acid treatment conditions on performance of catalysts. *.
Catalysts%CO Conv.FTS RateWGS Rate%CO2%SCH4%C2-C4%SC5+O/P
Co/CNT as-received240.140.450.544.320.135.10.95
Co/CNT.5A.25410.170.430.515.317.167.10.42
Co/CNT.5A.110470.190.400.512.513.973.10.48
Co/CNT.10A.110530.220.370.511.58.979.10.52
Co/CNT.15A.11058.70.240.350.59.56.883.20.60
Co/CNT.20A.11059.00.210.380.511.521.966.10.55
* Reaction T =240 °C, P = 20 atm, and H2/CO = 2.
Table 6. Elemental composition of samples by energy-dispersive X-ray spectroscopy (EDX).
SamplesC (wt %)O (wt %)Co (wt %)
as-received CNT97.262.16----
CNT.A96.093.91----
CNT.A.60097.372.63----
CNT.A.70097.482.52----
CNT.A.80097.482.52----
CNT.A.90097.662.34----
Co/CNT.A.80085.682.129.20
Co/CNT.A.90086.842.049.12
Table 7. Dispersion, reducibility and chemisorption properties of 10% Co/CNT catalysts.
CatalystsH2-Consumption (µmol/g.cat)O2-Ads. (µmol/g.cat)H2-Desorption
(µmol/g.cat)
%Reduction%Disp.No. of Active Sites (×1020)
Co/CNT.A1520270.6233.538.48.73.8
Co/CNT.A.6001840353.4312.648.820.94.5
Co/CNT.A.7001910376.8351.655.224.54.9
Co/CNT.A.8002045397.6394.863.826.45.4
Co/CNT.A.9002093405.8410.768.129.15.8
Table 8. Effect of FTS reaction pH on catalyst performance. *.
CatalystspH%COConv.FTS Rate (mol/s)%CO2%SCH4%C2-C4%SC5+O/P
Co/as-received CNT ----22.40.100.544.320.135.10.93
Co/CNT.A.8001348.50.150.519.410.469.70.53
Co/CNT.A.8001454.20.200.512.67.479.50.57
Co/CNT.A.9001240.40.120.520.314.464.80.50
Co/CNT.A.9001351.60.180.514.38.876.40.55
Co/CNT.A.9001458.70.240.59.56.883.20.60
* Reaction T = 240 °C, H2/CO = 2, P = 20 atm.

