Application of Sliding Nest Window Control Chart in Data Stream Anomaly Detection

Abstract
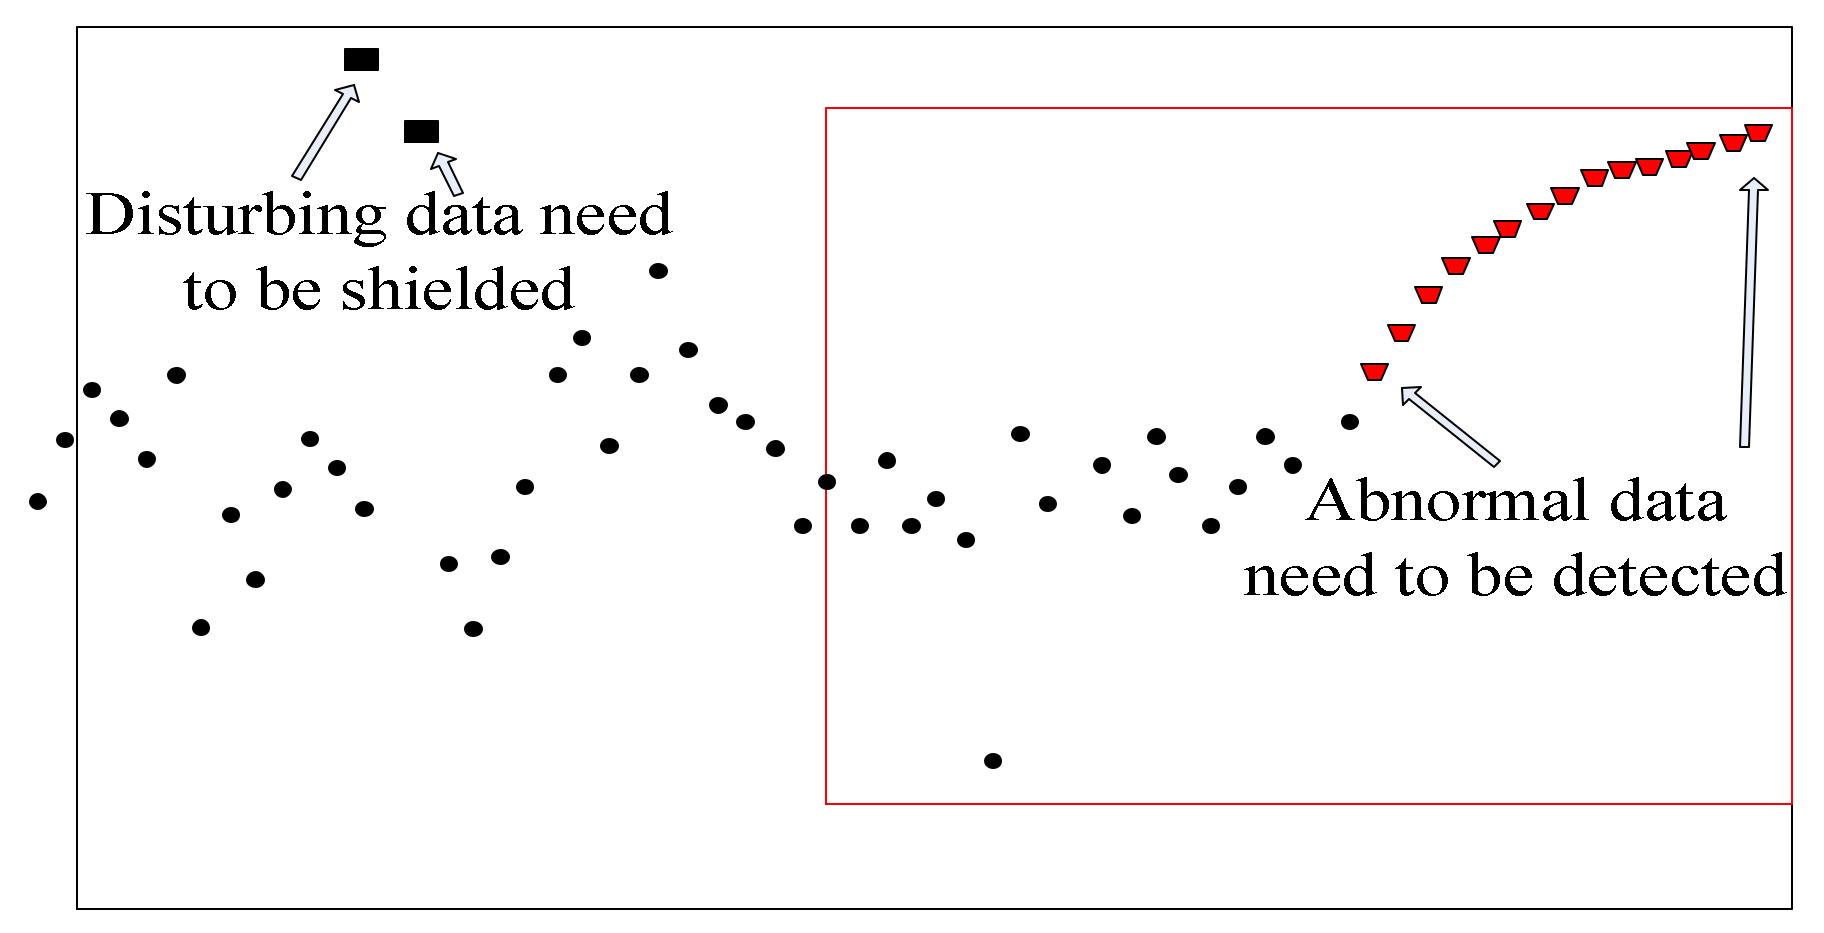
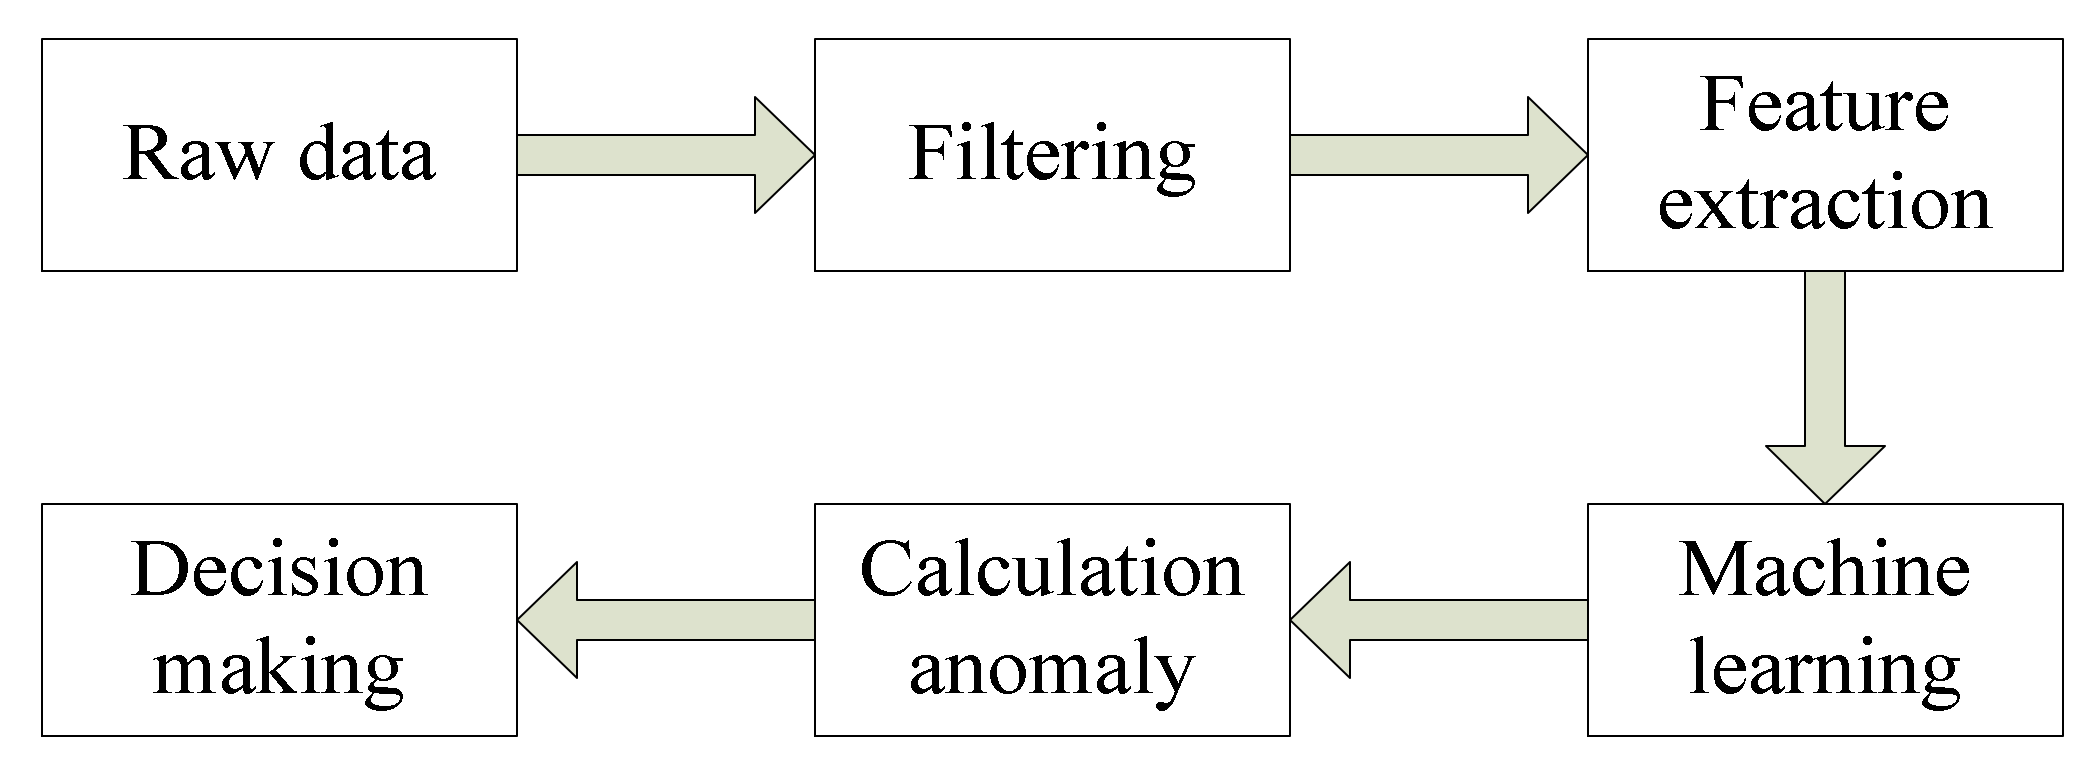
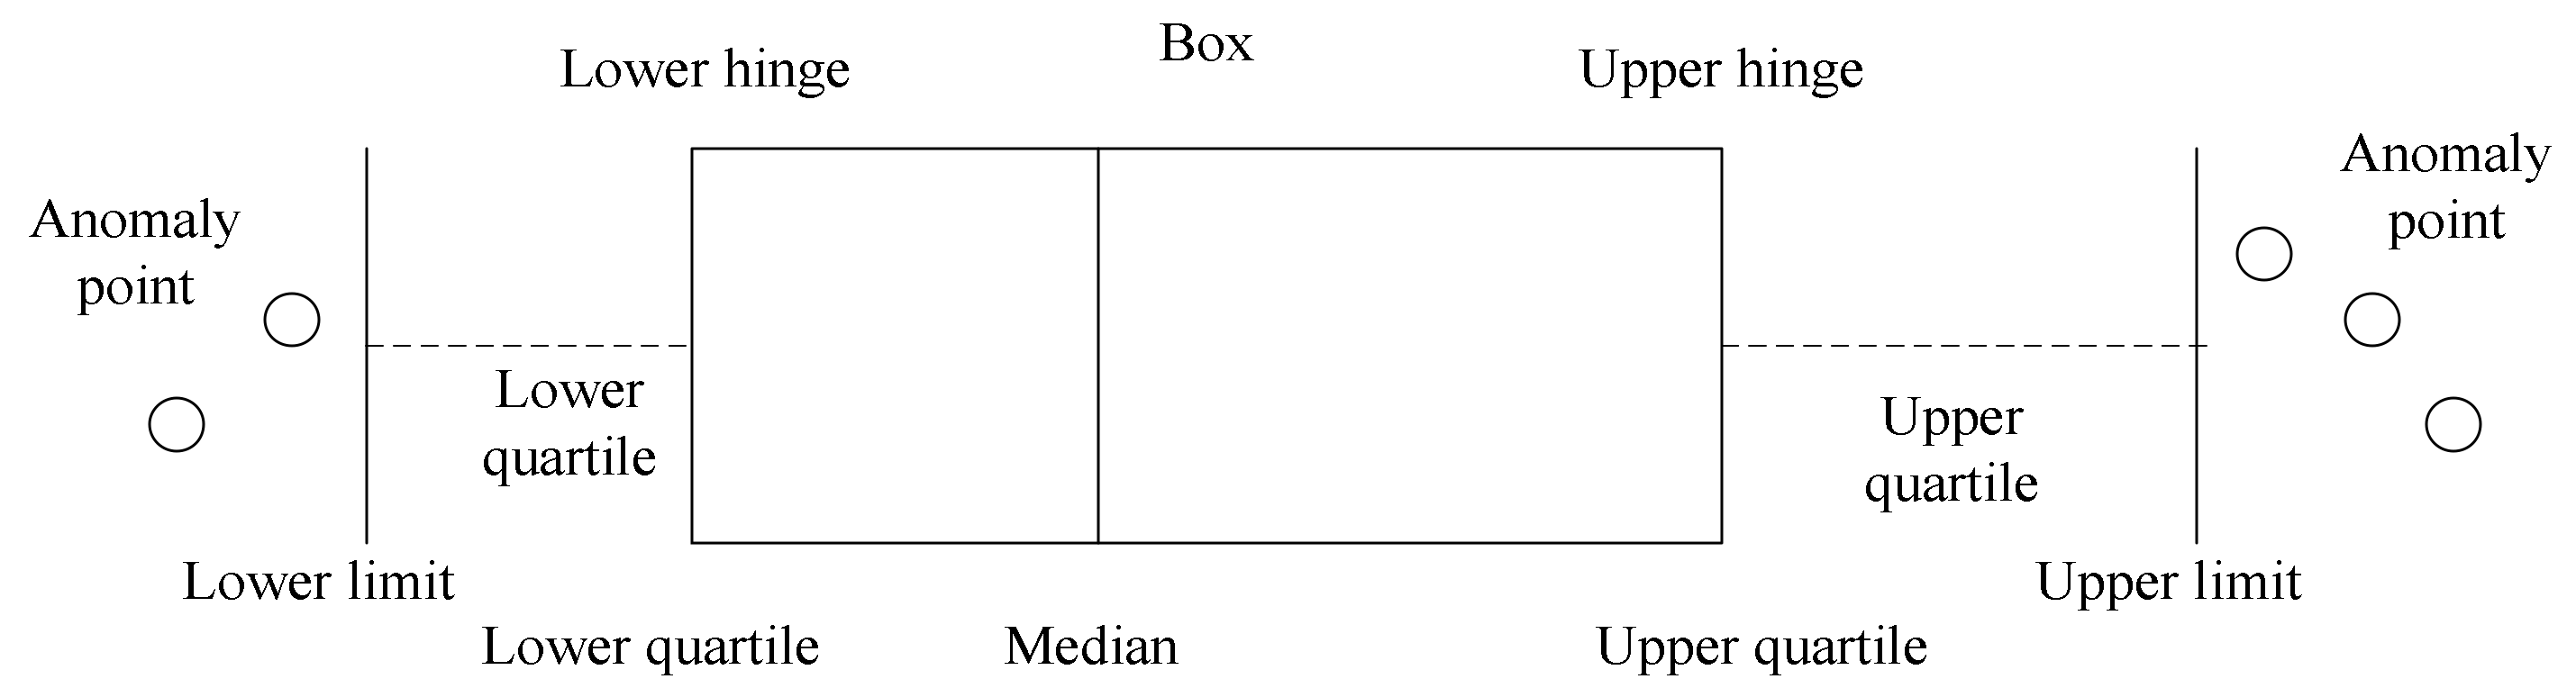
:1. Introduction
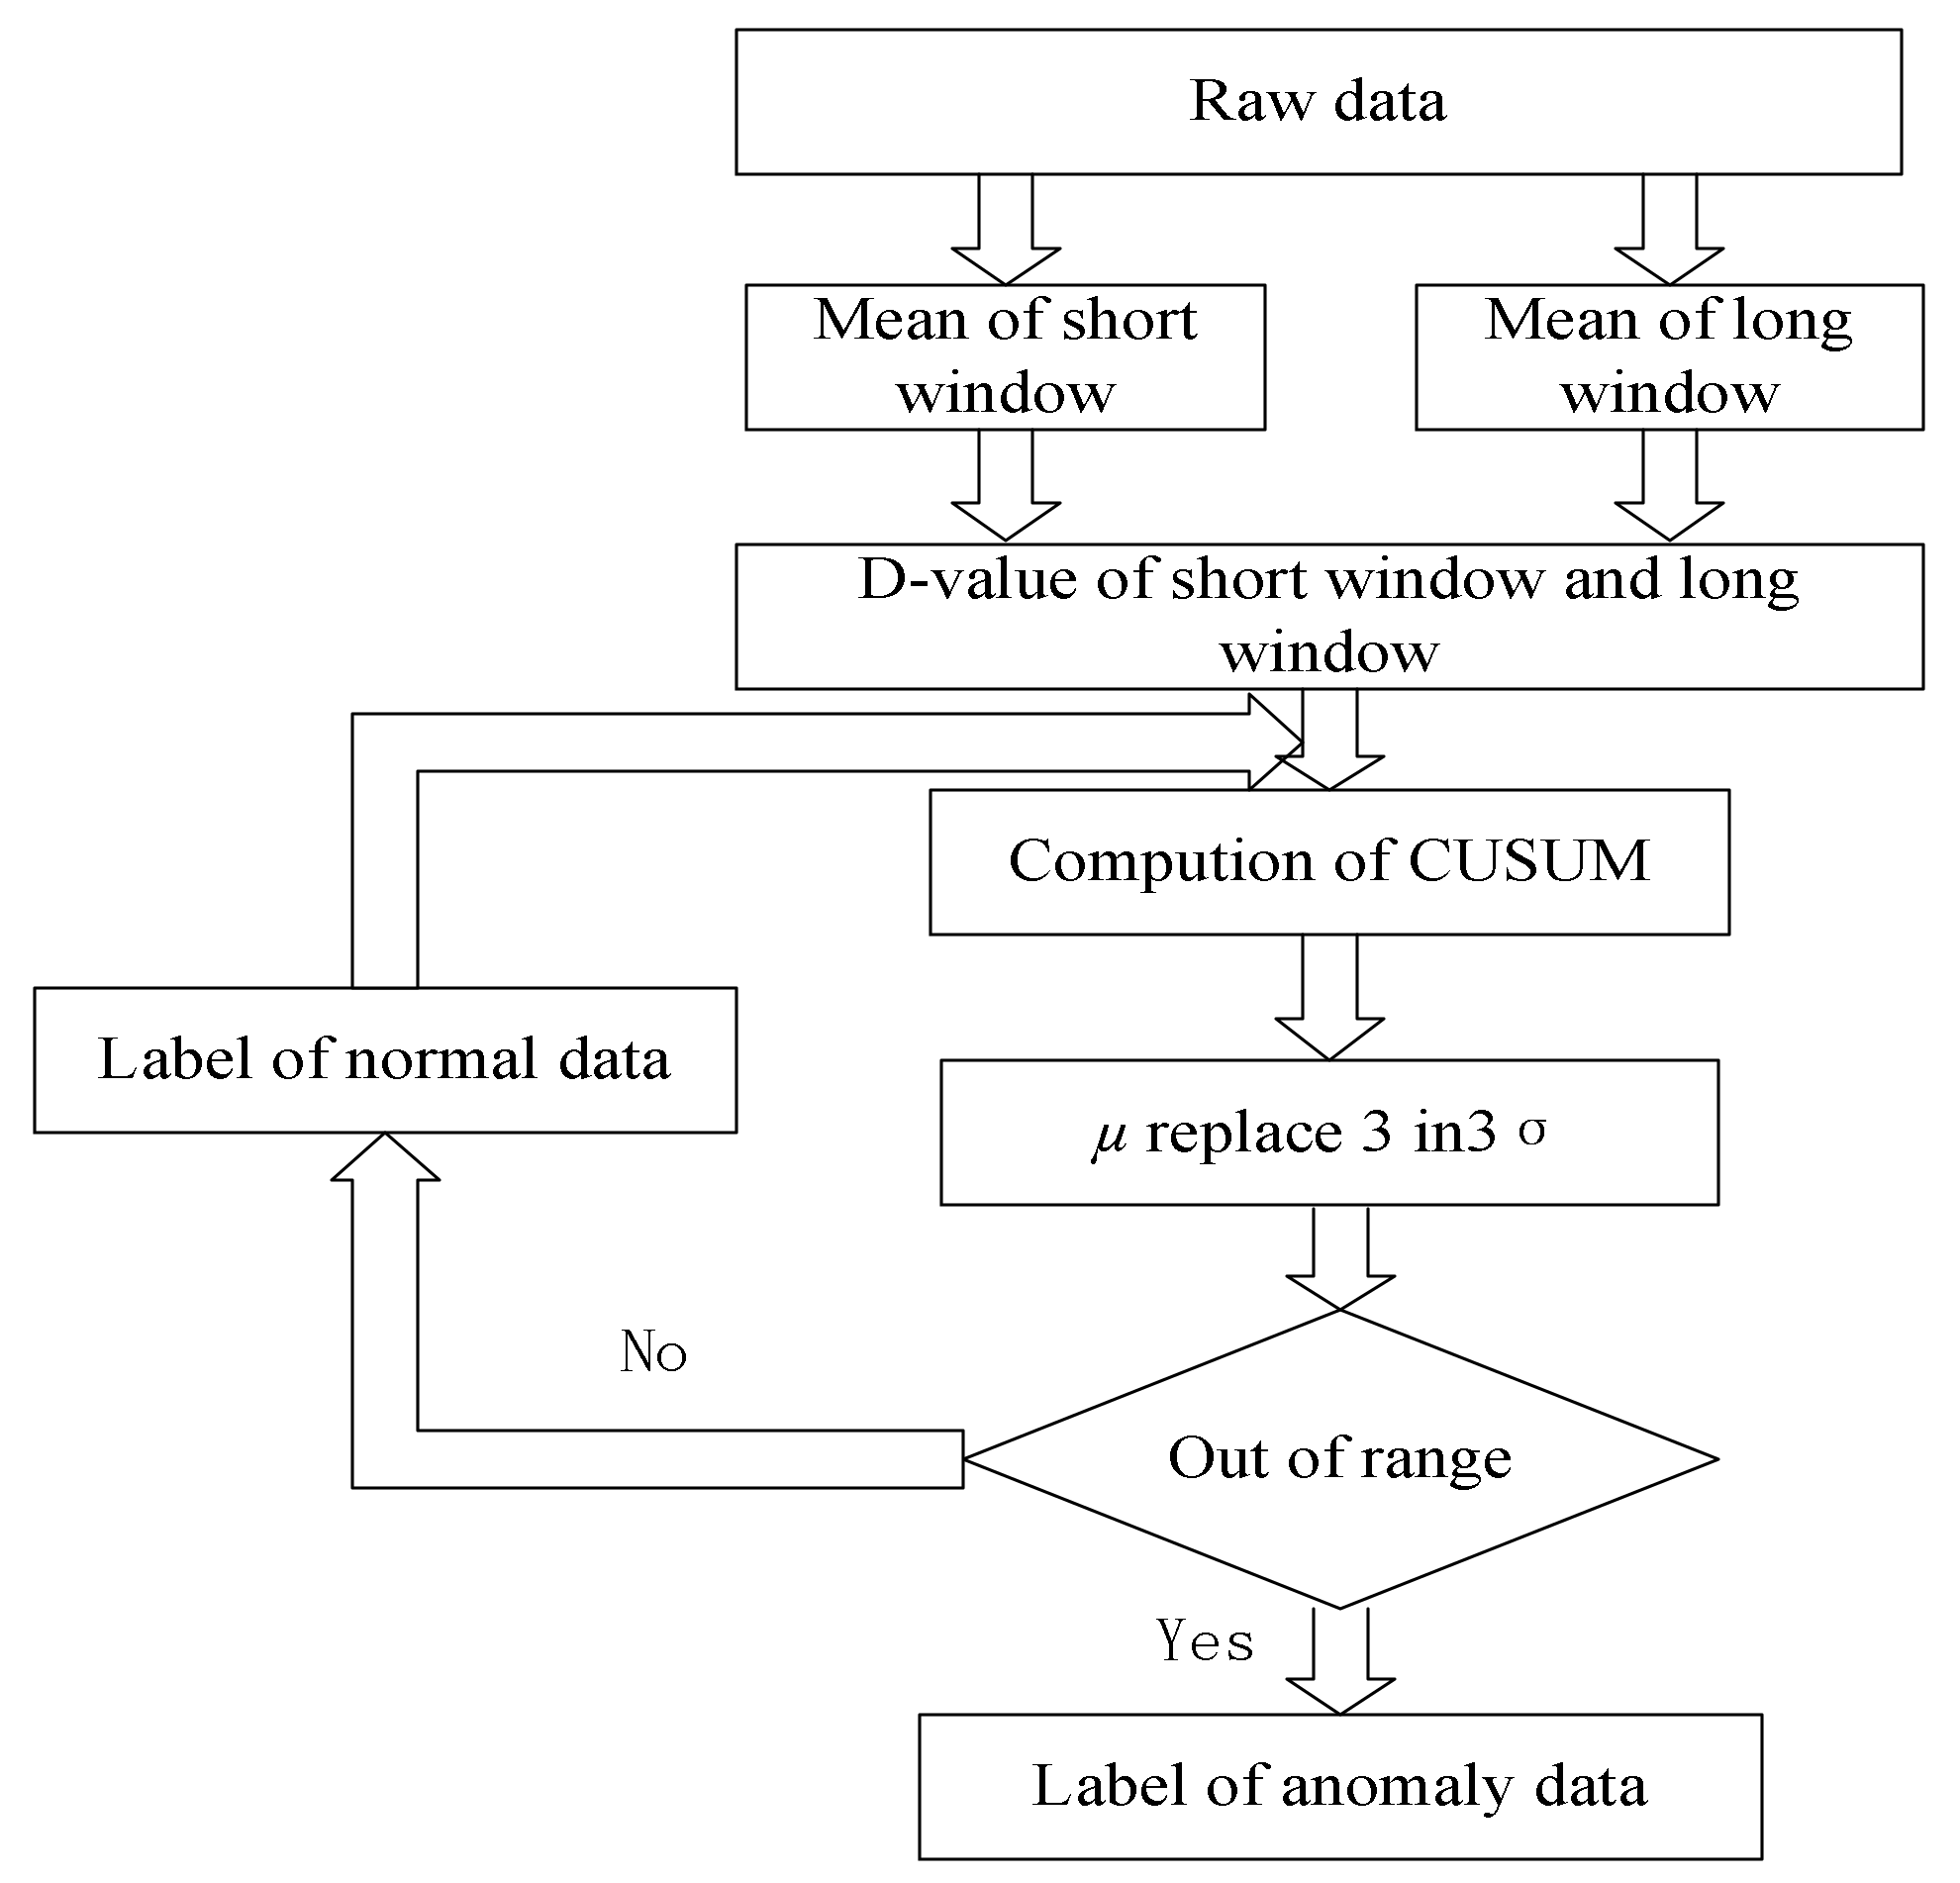
2. A Nested Sliding Window Data Stream Anomaly Detection Algorithm
- (1)
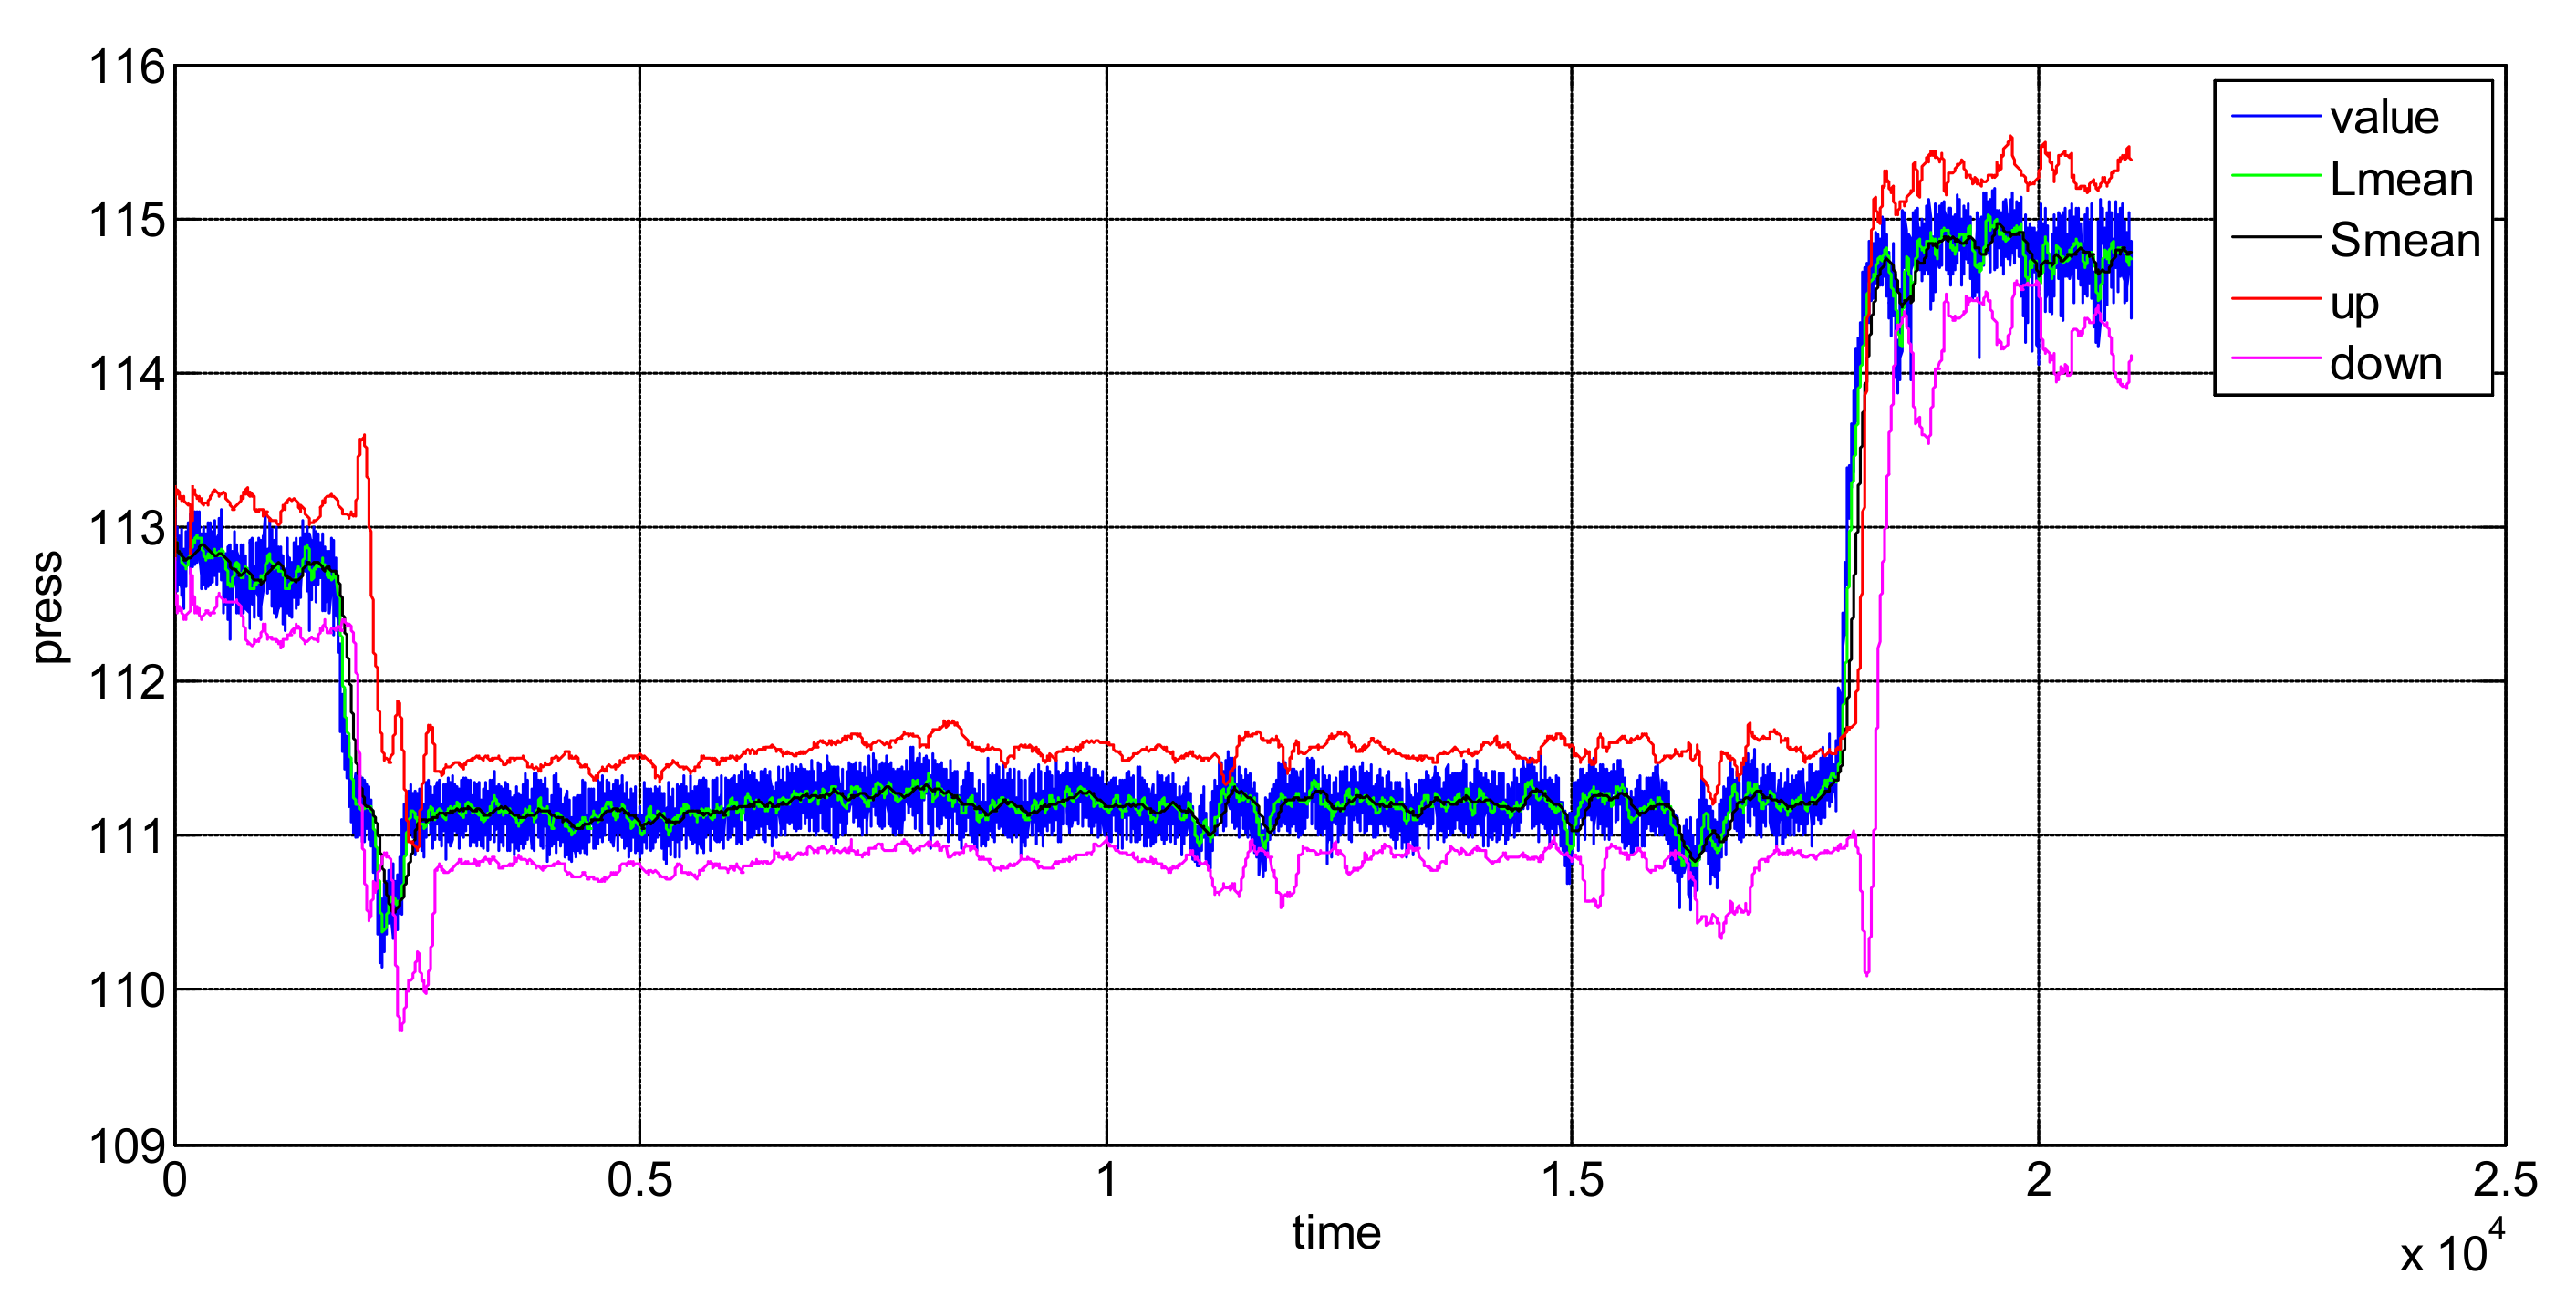
- Calculate the short window mean (SWM).
- (2)
- Calculate long window mean (LWM).
- (3)
- Calculate the mean difference.
- (4)
- Use CUSUM principle to calculate the cumulative sum.
- (5)
- Calculate the cumulative sum.
- (6)
- Calculate the cumulative sum and variance.
- (7)
- Calculate the upper critical line.
- (8)
- Calculate the lower critical line.
- (9)
- Analyze whether the current value is abnormal. If cusum > UCL, the current point is considered abnormally increased and the point flag is marked as 1. The abnormal accumulated number mcusum = 1. If DCL > cusum, the current point is considered to be abnormally decreased and the point flag is marked as 2. The abnormal accumulated number mcusum = 1. If there are no abnormal points detected, the flag is marked as 0 and mcusum = 0.
- (10)
- Calculate the current point flag. If the current point is the same as the previous moment mark, then the abnormal point accumulates as 1. Otherwise, the abnormal point is 1.
- (11)
- Calculate the abnormal cumulative number. If the abnormal cumulative number > h, the current point is the abnormal point.
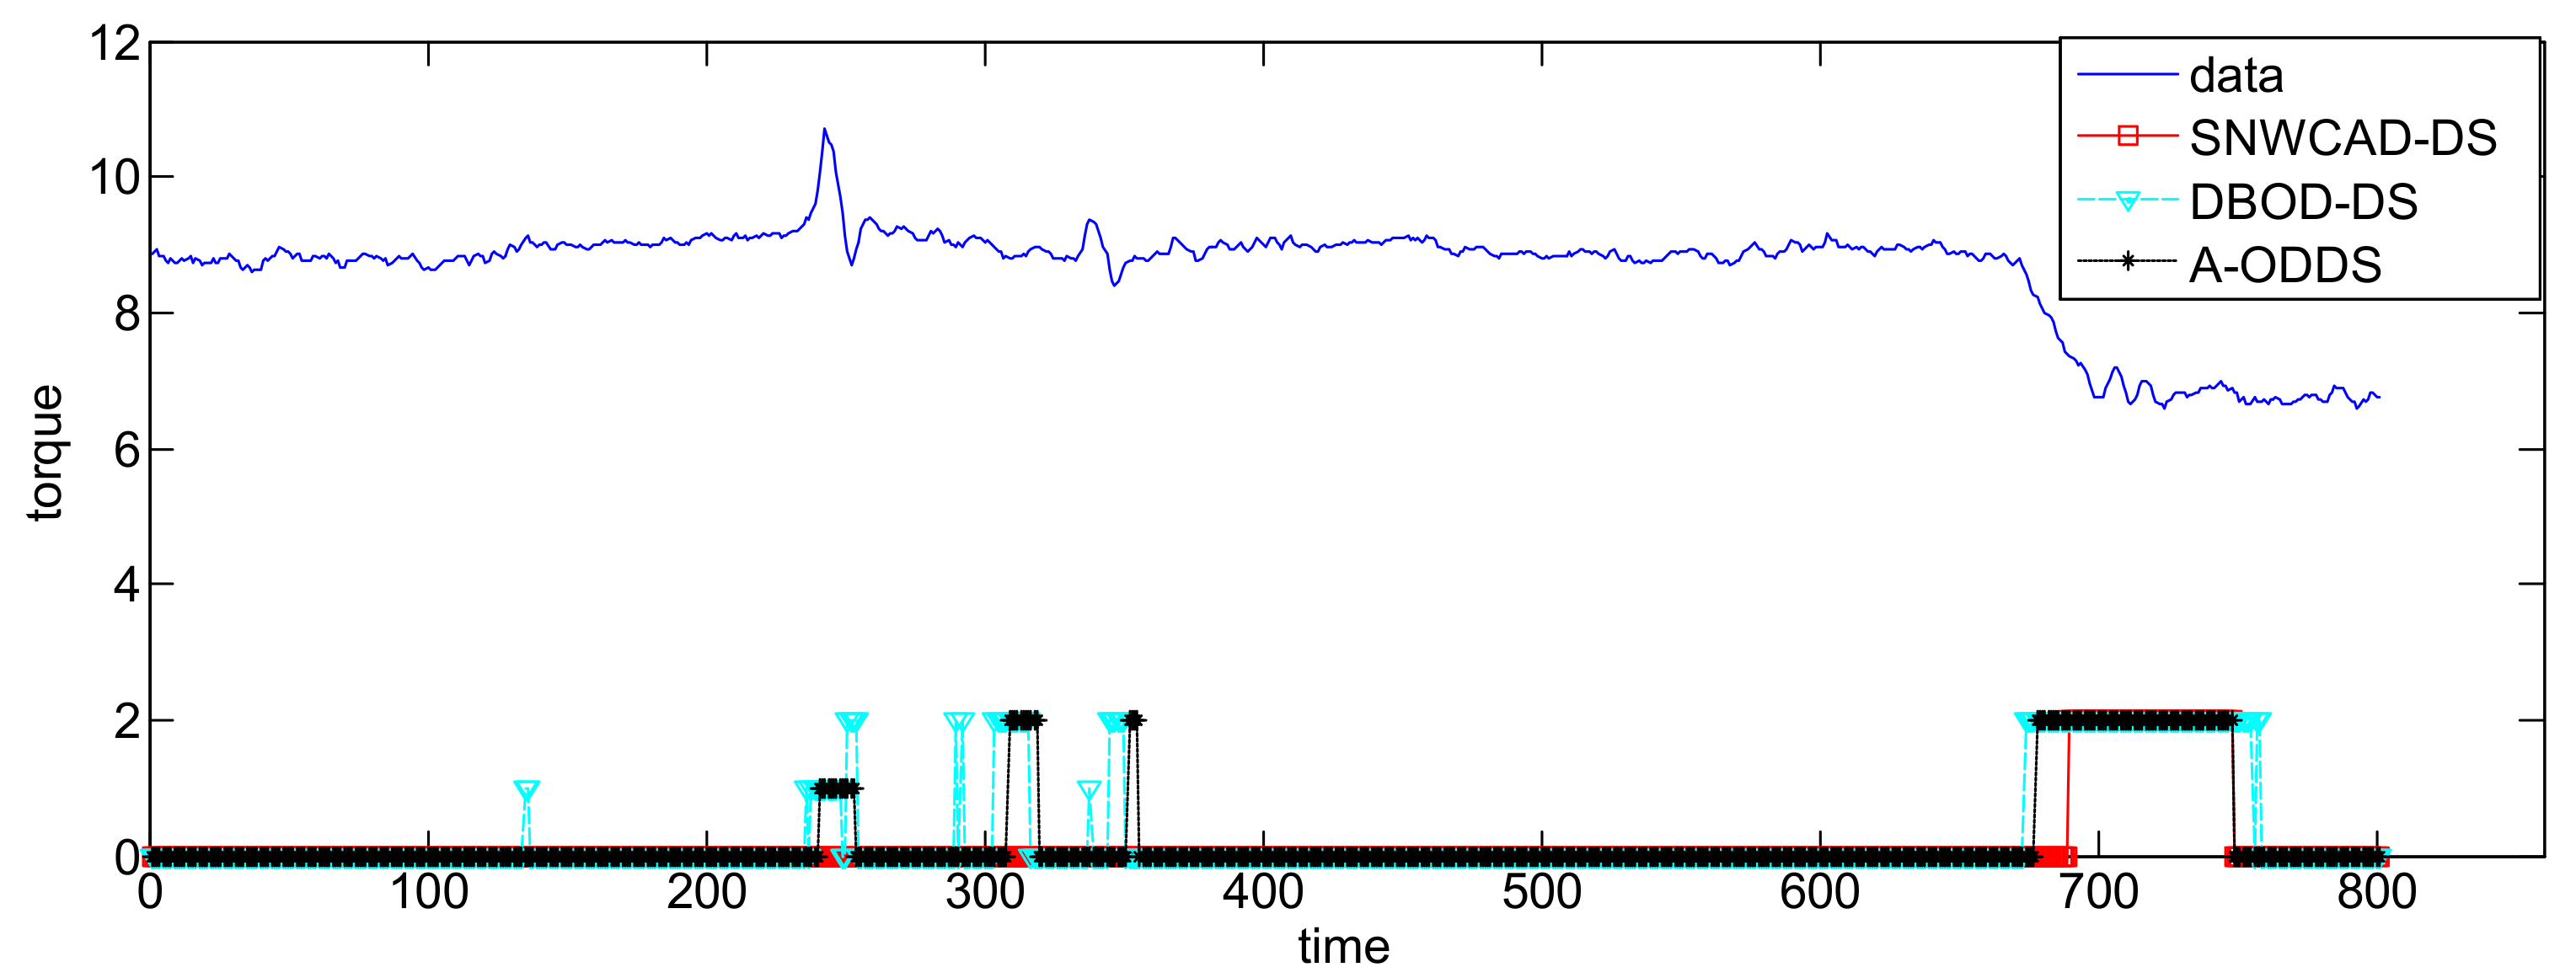
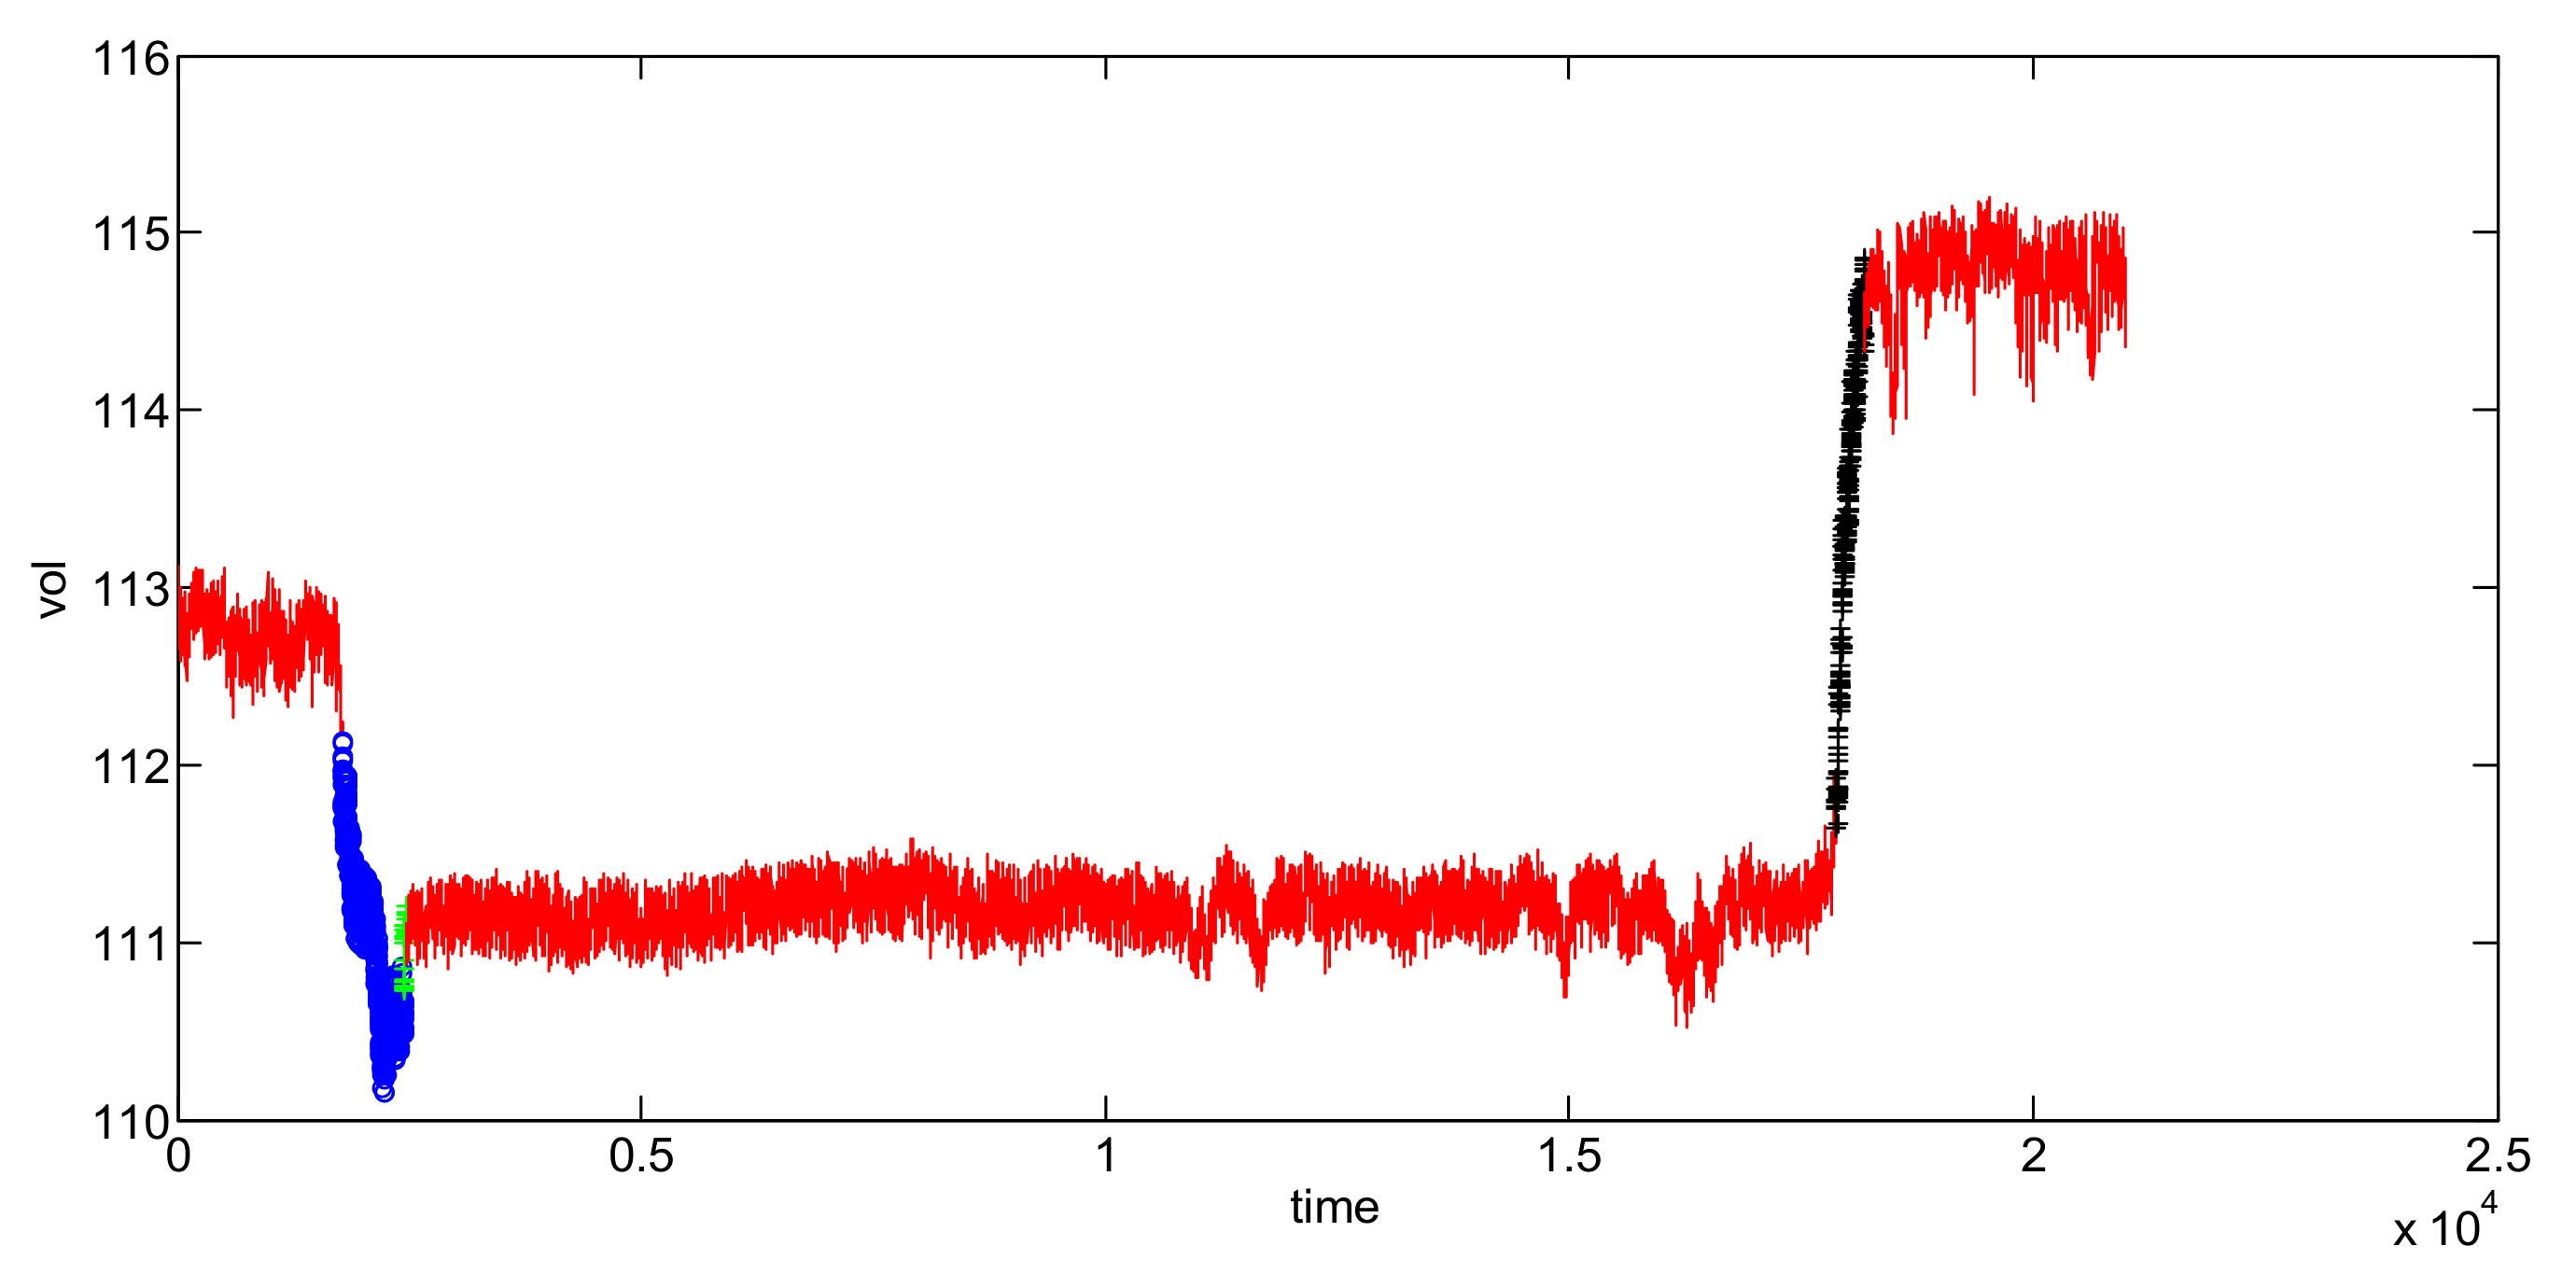
3. Simulation and Comparison
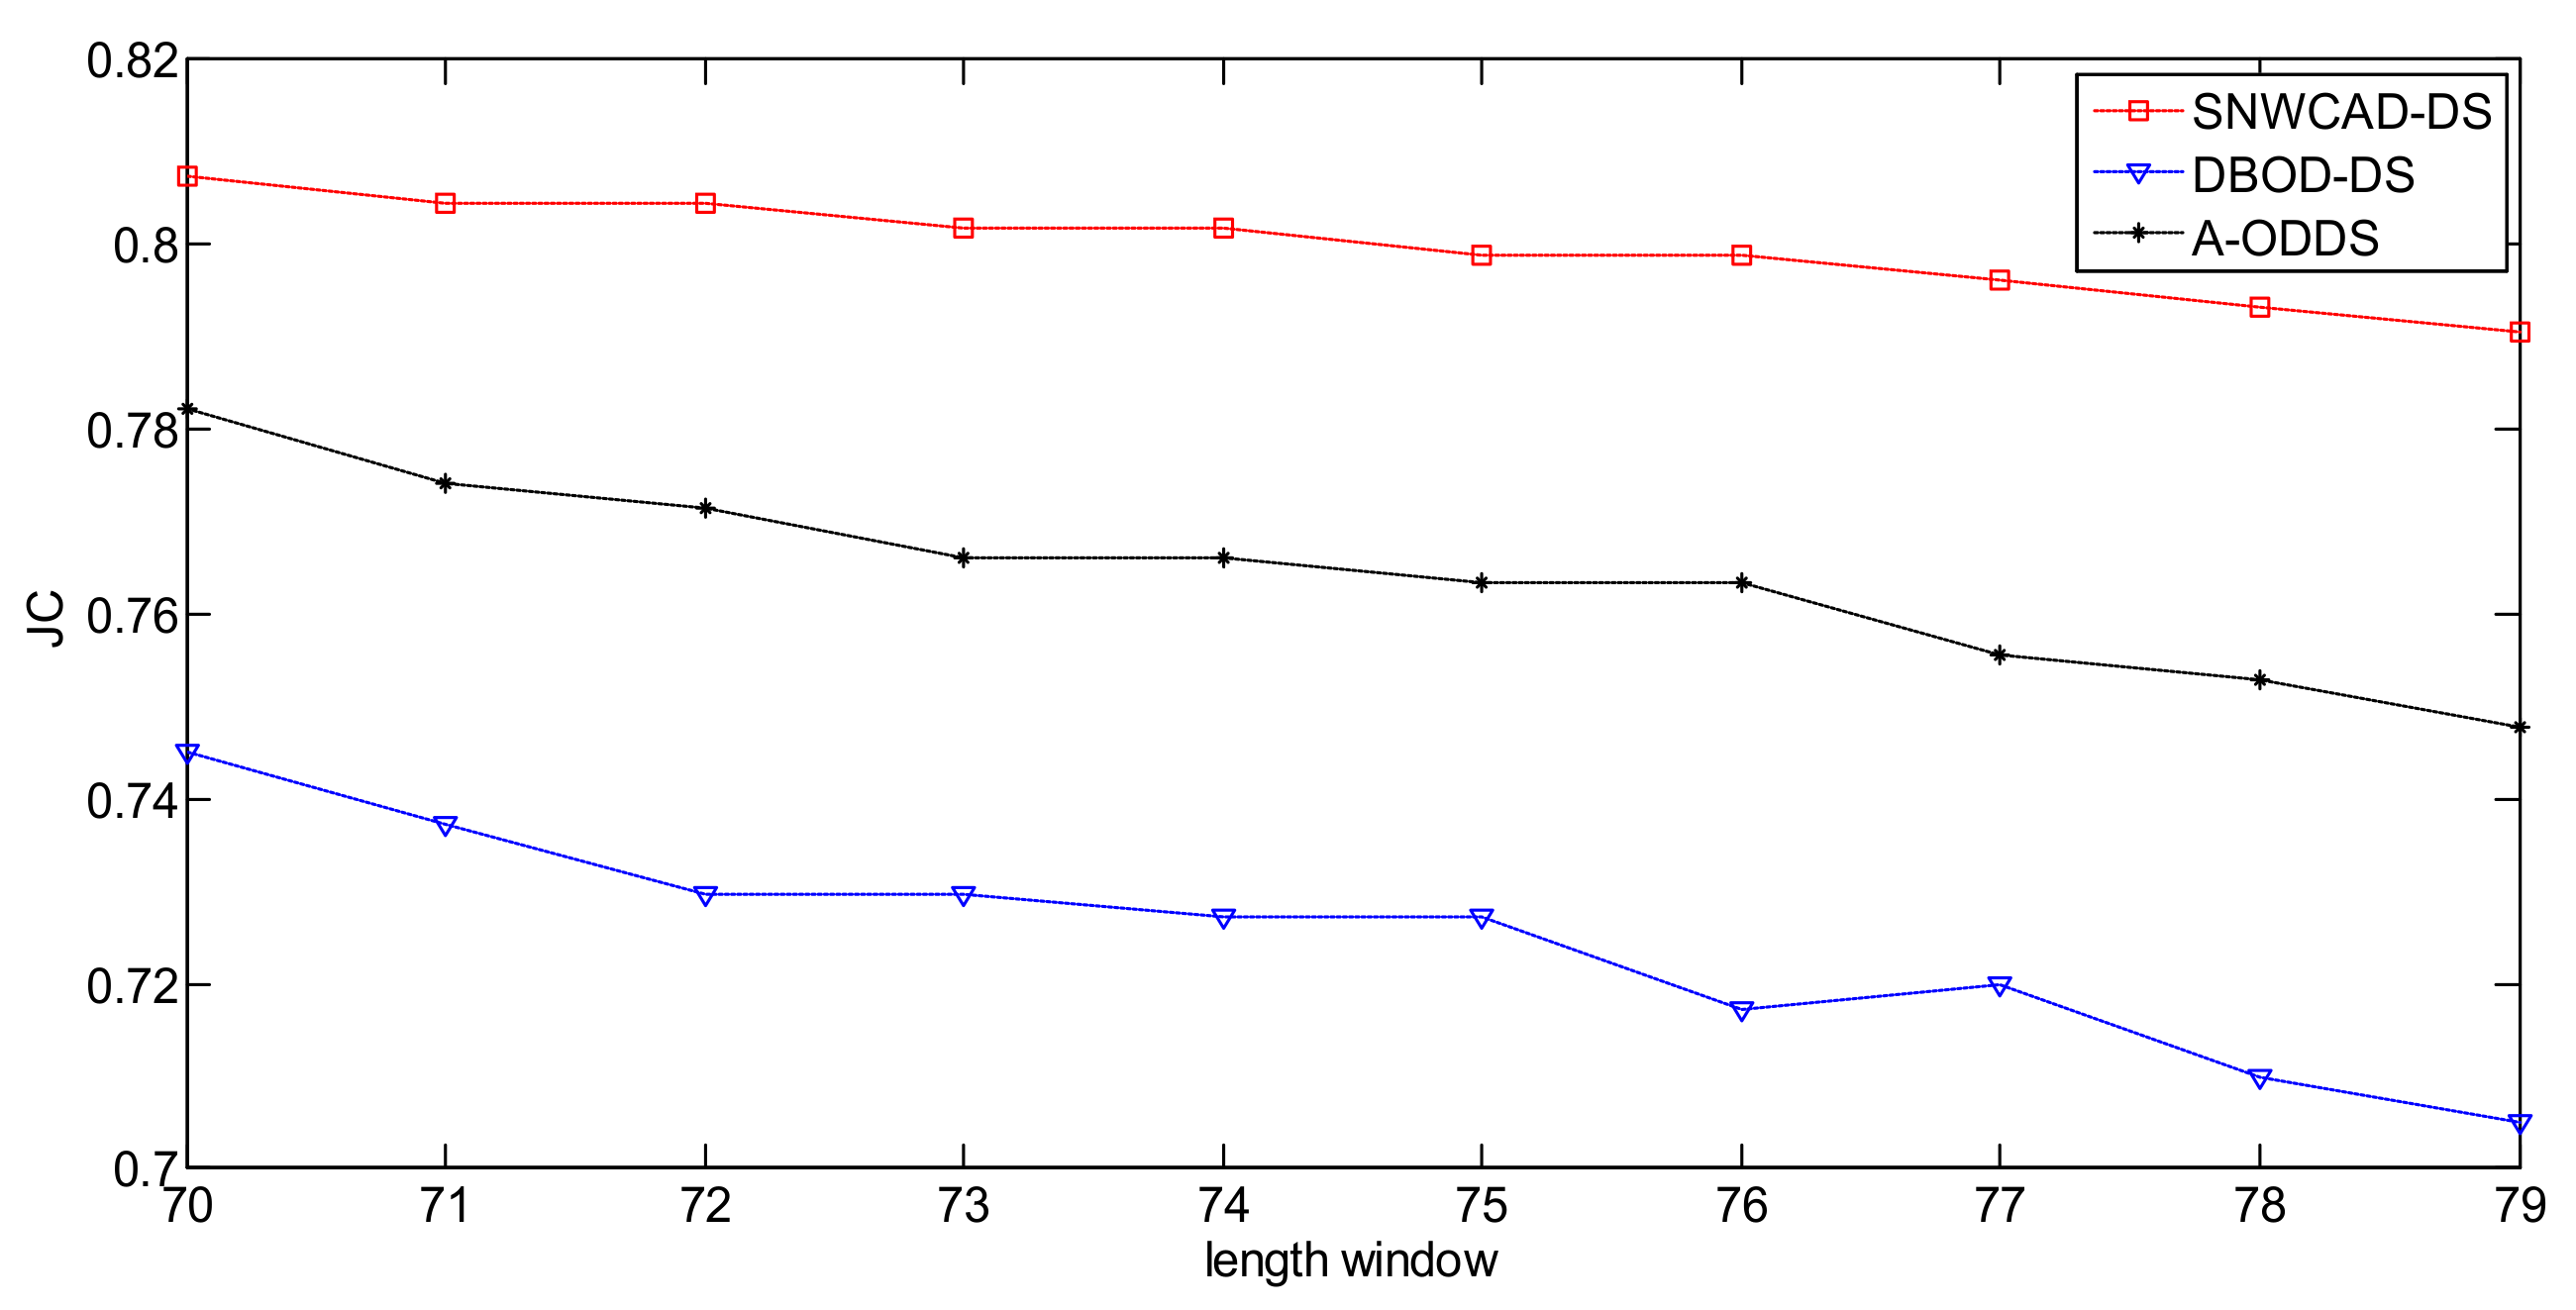
- Conclusion 1: SNWCAD-DS algorithm can effectively improve the detection accuracy.
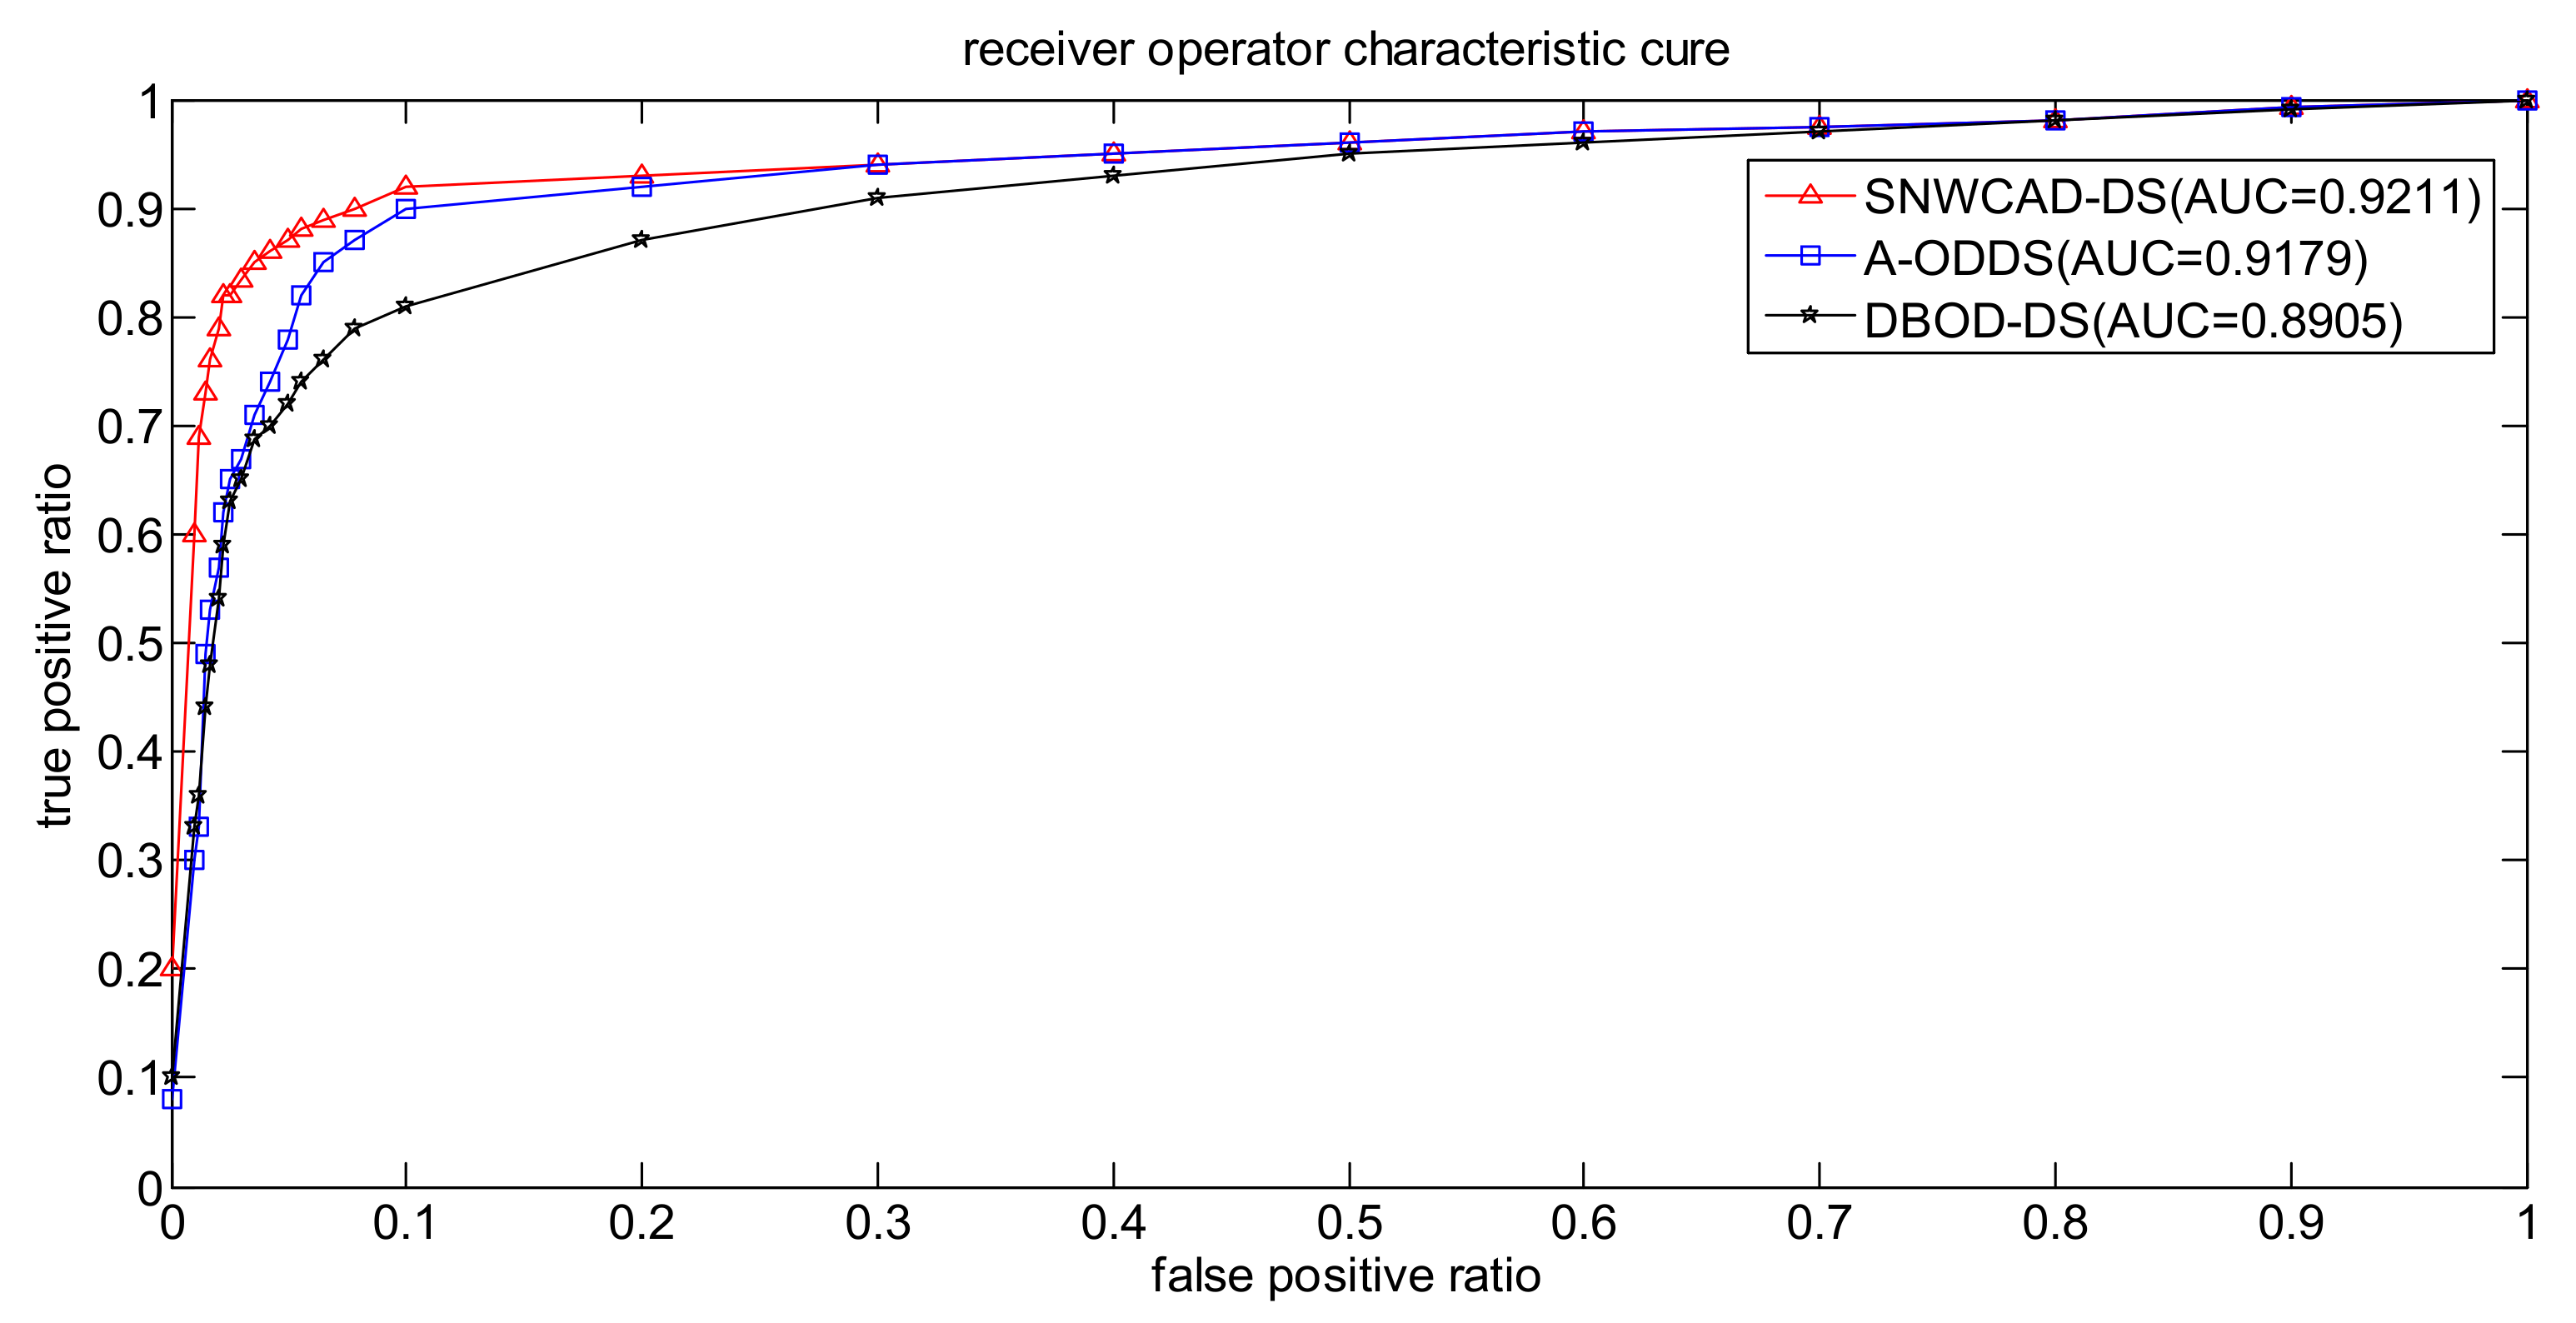
- Conclusion 2: SNWCAD-DS algorithm can effectively reduce the false alarm rate.
- Conclusion 3: SNWCAD-DS algorithm complexity meets the needs of practical application.
4. Summary
Acknowledgments
Author Contributions
Conflicts of Interest
References
- Paul, G.V.; Brauker, J.H.; Kamath, A.U.; Thrower, J.P.; Carr-Brendel, V. Systems and Methods for Replacing Signal Artifacts in a Glucose Sensor Data Stream. U.S. Patent 8,790,260B2, 29 July 2014. [Google Scholar]
- Ge, M.; Wang, J.; Ren, X. Fault Diagnosis of Rolling Bearings Based on EWT and KDEC. Entropy 2017, 19, 633. [Google Scholar] [CrossRef]
- Al-Janabi, S.; Rawat, S.; Patel, A.; Al-Shourbaji, I. Design and evaluation of a hybrid system for detection and prediction of faults in electrical transformers. Int. J. Elect. Power Energy Syst. 2015, 67, 324–335. [Google Scholar] [CrossRef]
- Baccarelli, E.; Cordeschi, N.; Mei, A.; Panella, M.; Shojafar, M.; Stefa, J. Energy-efficient dynamic traffic offloading and reconfiguration of networked data centers for big data stream mobile computing: Review, challenges, and a case study. IEEE Netw. 2016, 30, 54–61. [Google Scholar] [CrossRef]
- Siddique, K.; Akhtar, Z.; Lee, H.G.; Kim, W.; Kim, Y. Toward Bulk Synchronous Parallel-Based Machine Learning Techniques for Anomaly Detection in High-Speed Big Data Networks. Symmetry 2017, 9, 197. [Google Scholar] [CrossRef]
- Javanmardi, S.; Shojafar, M.; Shariatmadari, S.; Ahrabi, S.S. Fr trust: A fuzzy reputation–based model for trust management in semantic p2p grids. Int. J. Grid Util. Comput. 2014, 6, 57–66. [Google Scholar] [CrossRef]
- Shojafar, M.; Pooranian, Z.; Naranjo, P.G.V.; Baccarelli, E. FLAPS: Bandwidth and delay-efficient distributed data searching in Fog-supported P2P content delivery networks. J. Supercomput. 2017, 73, 5239–5260. [Google Scholar] [CrossRef]
- Majeed, M.F.; Ahmed, S.H.; Muhammad, S.; Song, H.; Rawat, D.B. Multimedia streaming in information-centric networking: A survey and future perspectives. Comput. Netw. 2017, 125, 103–121. [Google Scholar] [CrossRef]
- Canali, C.; Chiaraviglio, L.; Lancellotti, R.; Shojafar, M. Joint Minimization of the Energy Costs from Computing, Data Transmission, and Migrations in Cloud Data Centers. IEEE Trans. Green Commun. Netw. 2018, 1–16. [Google Scholar] [CrossRef]
- Lan, K.; Fong, S.; Song, W.; Vasilakos, A.V.; Millham, R.C. Self-Adaptive Pre-Processing Methodology for Big Data Stream Mining in Internet of Things Environmental Sensor Monitoring. Symmetry 2017, 9, 244. [Google Scholar] [CrossRef]
- Thalor, M.A.; Patil, S.T. Learning on High Frequency Stock Market Data Using Misclassified Instances in Ensemble. Learning 2016, 7, 283–288. [Google Scholar]
- Pei, Y.; Li, X.; Yu, L.; Yu, L.; Li, G.; Ng, H.H.; Hoe, J.K.; Ang, C.W.; Ng, W.S.; Takao, K.; et al. A Cloud-Based Stream Processing Platform for Traffic Monitoring Using Large-Scale Probe Vehicle Data. In Proceedings of the 2017 IEEE Wireless Communications and Networking Conference (WCNC), San Francisco, CA, USA, 19–22 March 2017; pp. 1–6. [Google Scholar]
- Lander, C.; Wiehr, F.; Herbig, N.; Krüger, A.; Löchtefeld, M. Inferring landmarks for pedestrian navigation from mobile eye-tracking data and Google Street View. In Proceedings of the 2017 CHI Conference Extended Abstracts on Human Factors in Computing Systems, Denver, CO, USA, 6–11 May 2017; pp. 2721–2729. [Google Scholar]
- Simão, M.A.; Neto, P.; Gibaru, O. Unsupervised Gesture Segmentation by Motion Detection of a Real-Time Data Stream. IEEE Trans. Ind. Inform. 2017, 13, 473–481. [Google Scholar] [CrossRef]
- Wang, H.B.; Hui, X.B.; Lin, J.F. The research of data stream mining and application in fault diagnosis of equipment. In Proceedings of the 2016 International Conference on Mechanical Engineering and Control System (MECS2016), Wuhan, China, 15–17 April 2016; pp. 101–107. [Google Scholar]
- Costa, F.G.D.; Duarte, F.S.L.G.; Vallim, R.M.; de Mello, R.F. Multidimensional surrogate stability to detect data stream concept drift. Expert Syst. Appl. 2017, 87, 15–29. [Google Scholar] [CrossRef]
- Ramírez-Gallego, S.; Krawczyk, B.; García, S.; Woźniak, M.; Herrera, F. A survey on data preprocessing for data stream mining: Current status and future directions. Neurocomputing 2017, 239, 39–57. [Google Scholar] [CrossRef]
- Jankov, D.; Sikdar, S.; Mukherjee, R.; Teymourian, K.; Jermaine, C. Real-time High Performance Anomaly Detection over Data Streams: Grand Challenge. In Proceedings of the 11th ACM International Conference on Distributed and Event-Based Systems, Barcelona, Spain, 19–23 June 2017; pp. 292–297. [Google Scholar]
- Zhang, L.; Lin, J.; Karim, R. Sliding window-based fault detection from high-dimensional data streams. IEEE Trans. Syst. Man Cybern. Syst. 2017, 47, 289–303. [Google Scholar] [CrossRef]
- Forestiero, A. Self-organizing anomaly detection in data streams. Inf. Sci. 2016, 373, 321–336. [Google Scholar] [CrossRef]
- Xie, G.; Sun, Y.; Lin, M.; Tang, K. A Selective Transfer Learning Method for Concept Drift Adaptation. In Proceedings of the International Symposium on Neural Networks, Sapporo, Japan, 21–23 June 2017; Springer: Cham, Switzerland, 2017; pp. 353–361. [Google Scholar]
- Hahsler, M.; Bolanos, M.; Forrest, J. Introduction to stream: An Extensible Framework for Data Stream Clustering Research with R. J. Stat. Softw. 2017, 76, 1–50. [Google Scholar] [CrossRef]
- Guo, Y.; Xu, Q.; Li, P.; Sbert, M.; Yang, Y. Trajectory Shape Analysis and Anomaly Detection Utilizing Information Theory Tools. Entropy 2017, 19, 323. [Google Scholar] [CrossRef]
- Gomes, H.M.; Barddal, J.P.; Enembreck, F.; Bifet, A. A Survey on Ensemble Learning for Data Stream Classification. ACM Comput. Surv. 2017, 50, 1–36. [Google Scholar] [CrossRef]
- Tu, E.; Kasabov, N.; Yang, J. Mapping temporal variables into the neucube for improved pattern recognition, predictive modeling, and understanding of stream data. IEEE Trans. Neural Netw. Learn. Syst. 2017, 28, 1305–1317. [Google Scholar] [CrossRef] [PubMed]
- Ibidunmoye, O.; Rezaie, A.R.; Elmroth, E. Adaptive Anomaly Detection in Performance Metric Streams. IEEE Trans. Netw. Serv. Manag. 2017, 15, 217–231. [Google Scholar] [CrossRef]
- Abbasi, B.; Calder, J.; Oberman, A.M. Anomaly detection and classification for streaming data using partial differential equations. arXiv, 2016; 1–23arXiv:1608.04348. [Google Scholar]
- Roy, G.; Roy, G.; Roy, G.; Schrijvers, O. Robust random cut forest based anomaly detection on streams. In Proceedings of the International Conference on International Conference on Machine Learning, New York, NY, USA, 19–24 June 2016; pp. 2712–2721. [Google Scholar]
- Lang, M. A Low-Complexity Model-Free Approach for Real-Time Cardiac Anomaly Detection Based on Singular Spectrum Analysis and Nonparametric Control Charts. Technologies 2018, 6, 26. [Google Scholar] [CrossRef]
- Riaz, M.; Abbas, N.; Does Ronald, J.M.M. Improving the performance of CUSUM charts. Qual. Reliab. Eng. Int. 2011, 27, 415–424. [Google Scholar] [CrossRef]
- Li, Y.; Yang, T.; Cheng, X.; Yang, R.; Xu, M. An Anomaly Detection Algorithm of Satellite Power System Based on CUSUM Control Chart. In Proceedings of the International Conference on Information Science and Control Engineering, Beijing, China, 8–10 July 2016; pp. 829–833. [Google Scholar]
- Chen, S.H. The gamma CUSUM chart method for online customer churn prediction. Electr. Commer. Res. Appl. 2016, 17, 99–111. [Google Scholar] [CrossRef]
- Chen, Q.; Chen, L.; Lian, X.; Liu, Y.; Yu, J.X. Indexable PLA for Efficient Similarity Search. In Proceedings of the 33rd International Conference on Very Large Data Bases, Vienna, Austria, 23–27 September 2007; pp. 435–446. [Google Scholar]
- Gilbert, A.C.; Kotidis, Y.; Muthukrishnan, S.; Strauss, M.J. One-Pass Wavelet Decompositions of Data Streams. IEEE Trans. Knowl. Data Eng. 2003, 15, 541–554. [Google Scholar] [CrossRef]
- Sadik, M.S.; Gruenwald, L. DBOD-DS: Distance based outlier detection for data streams. In Proceedings of the International Conference on Database and Expert Systems Applications, Bilbao, Spain, 30 August–3 September 2010; Springer: Berlin/Heidelberg, Germany, 2010; pp. 122–136. [Google Scholar]
- Sadik, S.; Gruenwald, L. An adaptive outlier detection technique for data streams. In Proceedings of the Scientific and Statistical Database Management, Heidelberg, Germany, 30 June–2 July 2010; Springer: Berlin/Heidelberg, Germany, 2011; pp. 596–597. [Google Scholar]


| Item | Short Window | Long Window | Threshold | Out Rate |
|---|---|---|---|---|
| SNWCAD-DS | 20 | 50 | 0.3 | 8 |
| DBOD-DS | / | 50 | 0.3 | / |
| A-ODDS | 20 | 50 | 0.3 | / |
| Length of Long Window | SNWCAD-DS | DBOD-DS | A-ODDS |
|---|---|---|---|
| 70 | 0.0312 | 0.0312 | 0.0312 |
| 71 | 0.0312 | 0.0156 | 0.0312 |
| 72 | 0.0312 | 0.0312 | 0.0156 |
| 73 | 0.0312 | 0.0156 | 0.0312 |
| 74 | 0.0468 | 0.0156 | 0.0312 |
| 75 | 0.0312 | 0.0156 | 0.0315 |
| 76 | 0.0312 | 0.0312 | 0.0312 |
| 77 | 0.0312 | 0.0157 | 0.0312 |
| 78 | 0.0313 | 0.0156 | 0.0314 |
| 79 | 0.0313 | 0.0156 | 0.0313 |
| average | 0.0328 | 0.0203 | 0.0297 |
| Algorithm | SNWCAD-DS | DBOD-DS | A-ODDS |
|---|---|---|---|
| Running time | 0.049660 | 0.0456750 | 0.0487450 |
© 2018 by the authors. Licensee MDPI, Basel, Switzerland. This article is an open access article distributed under the terms and conditions of the Creative Commons Attribution (CC BY) license (http://creativecommons.org/licenses/by/4.0/).
Share and Cite
Li, G.; Wang, J.; Liang, J.; Yue, C. Application of Sliding Nest Window Control Chart in Data Stream Anomaly Detection. Symmetry 2018, 10, 113. https://doi.org/10.3390/sym10040113
Li G, Wang J, Liang J, Yue C. Application of Sliding Nest Window Control Chart in Data Stream Anomaly Detection. Symmetry. 2018; 10(4):113. https://doi.org/10.3390/sym10040113
Chicago/Turabian StyleLi, Guang, Jie Wang, Jing Liang, and Caitong Yue. 2018. "Application of Sliding Nest Window Control Chart in Data Stream Anomaly Detection" Symmetry 10, no. 4: 113. https://doi.org/10.3390/sym10040113
APA StyleLi, G., Wang, J., Liang, J., & Yue, C. (2018). Application of Sliding Nest Window Control Chart in Data Stream Anomaly Detection. Symmetry, 10(4), 113. https://doi.org/10.3390/sym10040113