Article

IgG Charge: Practical and Biological Implications

1
Biotherapeutics Discovery Research, Boehringer Ingelheim Pharmaceuticals, Inc., Ridgefield, CT 06877, USA
2
Janssen BioTherapeutics, Janssen Research & Development, LLC, Spring House, PA 19477, USA
3
Department of Molecular, Cellular and Biomedical Sciences, University of New Hampshire, Durham, NH 03861, USA
*
Author to whom correspondence should be addressed.
Antibodies 2019, 8(1), 24; https://doi.org/10.3390/antib8010024
Submission received: 1 February 2019 / Revised: 4 March 2019 / Accepted: 6 March 2019 / Published: 14 March 2019
(This article belongs to the Special Issue Structure and Function of Antibodies)

Abstract

:
Practically, IgG charge can contribute significantly to thermodynamic nonideality, and hence to solubility and viscosity. Biologically, IgG charge isomers exhibit differences in clearance and potency. It has been known since the 1930s that all immunoglobulins carry a weak negative charge in physiological solvents. However, there has been no systematic exploration of this fundamental property. Accurate charge measurements have been made using membrane confined electrophoresis in two solvents (pH 5.0 and pH 7.4) on a panel of twelve mAb IgGs, as well as their F(ab’)2 and Fc fragments. The following observations were made at pH 5.0: (1) the measured charge differs from the calculated charge by ~40 for the intact IgGs, and by ~20 for the Fcs; (2) the intact IgG charge depends on both Fv and Fc sequences, but does not equal the sum of the F(ab)’2 and Fc charge; (3) the Fc charge is consistent within a class. In phosphate buffered saline, pH 7.4: (1) the intact IgG charges ranged from 0 to −13; (2) the F(ab’)2 fragments are nearly neutral for IgG1s and IgG2s, and about −5 for some of the IgG4s; (3) all Fc fragments are weakly anionic, with IgG1 < IgG2 < IgG4; (4) the charge on the intact IgGs does not equal the sum of the F(ab’)2 and Fc charge. In no case is the calculated charge, based solely on H+ binding, remotely close to the measured charge. Some mAbs carried a charge in physiological salt that was outside the range observed for serum-purified human poly IgG. To best match physiological properties, a therapeutic mAb should have a measured charge that falls within the range observed for serum-derived human IgGs. A thermodynamically rigorous, concentration-dependent protein–protein interaction parameter is introduced. Based on readily measured properties, interaction curves may be generated to aid in the selection of proteins and solvent conditions. Example curves are provided.

1. Introduction

It is known that charge and charge distribution are important contributors to protein solubility and solution viscosity [1,2,3,4,5,6,7,8,9,10,11]. In general, increased charge correlates with higher solubility and lower viscosity because charge–charge repulsion weakens protein–protein interactions [12]. Experimentally, nonideality is quantified by the thermodynamic second virial coefficient (B22 or A2), with B22 > 0 corresponding to net repulsion and B22 < 0 corresponding to net attraction between molecules. Molecules possessing the same sign net charge will repel, while those having opposite charge will attract.
However, net charge alone does not fully capture the effects of charge on B22. In particular, dipole moments resulting from asymmetric charge distributions can lead to orientation-dependent protein–protein attraction due to charge–dipole and dipole–dipole interactions, which decrease B22 [5,9]. If B22 is < 0, highly viscous [5,7,8,9] or opalescent [2] solutions may result at high protein concentrations. Recent work suggests that there may be weak, promiscuous attractive interactions between IgGs [13,14]. These attractive interactions may or may not be entirely electrostatic in origin (e.g., weak hydrophobic interactions could contribute), though the salt and temperature dependence suggest electrostatic attractions are involved. Regardless of their origin, it has been suggested that the weak attraction (apparent monomer–dimer Kds of 10−4–10−3 M [13,14,15]) may reflect the cooperative free energy needed for effector functions [14].
In addition to the importance of charge in the development of high concentration therapeutic formulations, mAb charge may influence in vivo processes. For example, neonatal Fc receptor (FcRn)-independent clearance rates are lower for mAbs with lower pI values than those with higher pI values [16,17,18], presumably due to decreased nonspecific cell surface binding [16,17,19,20]. Furthermore, basic charge variants of mAbs display stronger binding to the FcγRIIIa receptor and increased antibody-dependent cellular cytotoxicity response compared to more acidic charge variants [21,22]. Finally, there is an increasing body of evidence suggesting that IgG sialylation may impact therapeutic efficacy [23] and IgG function [24]. Together these in vivo and in vitro data show that mAb charge correlates with physical and biological consequences and highlight the need to understand what governs IgG charge.
The majority of biotherapeutic mAbs exhibit pIs ≥ 8 [25], and carry a positive charge under formulation conditions (typically pH 5–6) [2,3,4]. However, it has been known for over 80 years that all serum proteins, including the immunoglobulins, carry a net negative charge under physiological conditions [26]. Furthermore, IgGs from several species are anionic in the pH 5–6 range [27,28]. More recently, it was shown that freshly prepared human polyclonal IgGs have a Debye–Hückel–Henry charge, ZDHH [26], between −3 and −9 [14]. The narrow range of charge is somewhat surprising since isoelectric focusing analysis of the same sample yielded pIs covering the pH range from less than 4 to greater than 10 [14]. There is no published charge data for mAbs in physiological solvents. Consequently, it is not known whether the charge on therapeutic mAbs falls into the rather narrow range observed for normal human IgGs. It is apparent that a systematic analysis of the charge on mAbs would be useful.
Presented here are charge measurements on twelve anti IL-13 IgGs. Using membrane confined electrophoresis, MCE, data have been acquired for three IgGs, mAb 1, mAb 2, and mAb 3, that bind to different IL-13 epitopes [14]. For each mAb, ZDHH has been measured for four subclasses, IgG1, IgG2, IgG4, and IgG4Pro. Furthermore, the charge on the Fc and F(ab’)2 fragments was measured to determine whether the intact IgG charge is the sum of the Fc and F(ab’)2 fragment charges, and to assess how the charge is distributed over the IgG structure. Finally, the charge on the IgGs and their fragments were measured at both pH 5.0 and pH 7.4 to determine how the charge varies between formulation and physiological conditions. The results illustrate how little is known about protein charge and demonstrates the power of analytical electrophoresis in assessing this fundamental property.

Theoretical Basics of Protein Charge

Protein charge contributes significantly to a variety of biochemical, biophysical, and biological phenomena [29]. Thermodynamically, charge is a system property that depends on temperature, pressure, salt concentration, salt type, and pH [12]. At present there is no way to calculate protein charge accurately. However, charge may be measured with both precision and accuracy [26,30,31]. Of the measurement methods, membrane confined electrophoresis [32,33] is the most accurate and flexible [26,34].
There are a variety of charge descriptions (e.g., ζ potential, Zeffective, ZDHH) [26]. While each description is useful, here we will use ZDHH, which is the unitless valence resulting from the ratio of the protein charge (in coulombs) to the proton unit charge (e.g., Ca2+ has a valence of +2, Cl has a valence of −1). Calculation of ZDHH from the free-boundary electrophoretic mobility removes the effects of electrophoresis and the Debye-Hückel solvent ion cloud [26,32,35]. Thus, ZDHH reflects any changes in protein charge that accompany changes in solvent pH, salt type or salt concentration [26].
Even though proton binding to proteins has been studied extensively [36,37], it has been difficult to reconcile values calculated from amino acid side chain pKas with measurements [5,38,39]. Shifts in the pKas due to net protein charge, proximity of charged residues and protein flexibility are known to occur [36,37,40,41,42,43]. Though H+ binding contributes to protein charge, ZDHH reflects binding by all solvent ions (e.g., Na+, PO42, Cl) and not just H+. It has been known for over 60 years that proteins bind monovalent ions, and bind anions to a greater extent than cations [12,44]. Two non-exclusive models have emerged for the mechanism of anion binding. One model focuses on the tendency for anions to accumulate preferentially at hydrophobic surfaces [38,45]. Based on NMR data, the other model suggests that anion binding may involve amide protons [46].
Because ion binding and dissociation occur rapidly, ZDHH values are time averages. The extent of fluctuation about the mean value is proportional to the change in charge with ion chemical potential (i.e., the slope of the curve of Z versus log[X]) [36]. If the titration curve is flat (i.e., dZ/dlog[X] ~ 0), there will be very little charge variation, and the charge distribution about the average value will be narrow. A steep titration curve, however, indicates large charge variations which, particularly if they swing around neutrality, result in the inter-molecular attractions that reduce solubility and cause higher viscosities. Thus, measurement of ZDHH as a function of solvent ion concentration (including pH) may be helpful in finding solvent conditions that optimize solubility and viscosity.

2. Materials and Methods

2.1. Monoclonal and Human Serum IgGs

Twelve anti-IL13 IgGs comprising three unique variable regions, each constructed as four human IgG subclasses, IgG1, IgG2, wild-type IgG4(Ser222), and a hinge mutant IgG4(Pro222), were made from stable NS0 cell line at Boehringer Ingelheim. Human serum derived from male AB plasma was purchased from Sigma-Aldrich, St. Louis, MO, USA (cat# H4522). The IgGs were purified by ÄKTA affinity chromatography system and MabSelect Sure resin (GE Healthcare, Chicago, IL, USA) following standard methods [47]. The quality of the purified mAb IgGs and their fragments generated by subsequent enzymatic digestion was evaluated by analytical size-exclusion ultra-performance liquid chromatography (SE-UPLC) using a BEH200 column on the Waters Acquity UPLC system (Waters Corporation, Milford, MA, USA). The mobile phase buffer consisted of 50 mM sodium phosphate (pH 6.8), 200 mM arginine, and 0.05% sodium azide. For each sample run, 10 µg of material was injected onto the column with the running flow rate at 0.5 mL/min for 5 min.

2.2. IgG Fragmentation

A FragIT kit with individual spin columns containing the active IdeS, a cycstein protease secreted by Streptococcus pyogenes covalently coupled to agarose beads was used (Genovis, cat# A2-FR2-025). After the IgG sample was buffer exchanged into the cleavage buffer (10 mM sodium phosphate, 150 mM NaCl) and the column was equilibrated with the cleavage buffer, the IgG-enzyme mixture was incubated at 37 °C for an hour on an orbital shaker. The digested fragments were separated from the immobilized enzyme, followed by the purification of F(ab’)2 using a supplied CaptureSelect column containing Fc affinity matrix (Thermo Fisher Scientific, Waltham, MA, USA). Upon the collection of the F(ab’)2 in the flow-through, the Fc was eluted using the 0.1 M glycine (pH 3.0) elution buffer and immediately neutralized by adding 10% v/v of 1 M Tris (pH 8.0).

2.3. Sample Preparation

Each sample was dialyzed into desired buffers at 4–10 °C overnight using Zeba desalting columns (Thermo Fischer), after which the concentration was determined using appropriate extinction coefficients in NanoDrop™ 8000 Spectrophotometer (Thermo Fischer). Two solvents were used: 10 mM sodium acetate, 50 mM NaCl, pH 5.0; and Dulbecco’s PBS (pH 7.4) containing 8 mM sodium phosphate dibasic, 1.5 mM potassium phosphate monobasic, 2.7 mM KCl, and 138 mM NaCl. The acetate buffer was prepared by diluting chemicals purchased from Sigma into distilled deionized water from a Milli-Q Plus filtration system (Millipore, Burlington, MA, USA) and titrating to the desired pH 5.0 with 10 N NaOH solution. For all measurements, the sample solutions were used within a week of preparation and stored at 4 °C between measurements.

2.4. Liquid Chromatography Mass Spectrometry (LC-MS)

The sequences of the purified mAbs and respective F(ab’)2 and Fc fragments were evaluated by LC-MS using a PoroShell 300SB-C8 column (5 µm, 75 × 1.0 mm) on the Agilent HPLC system followed by analysis in the Agilent 6210 time-of-flight mass spectrometer (Agilent Technologies). The composition of the mobile phase A was 99% water, 1% acetonitrile, and 0.1% formic acid, and that of mobile phase B was 95% acetonitrile, 5% water, and 0.1% formic acid. The gradient started with 20% B at 0 min and increased to 85% B at 10 min with the constant flow rate of 50 µL/min. Each sample was subjected to a native run, a reduced run after incubation with TCEP (Sigma), and a deglycosylated run after incubation with TCEP and PNGase F (New England Biolabs). The MassHunter Qualitative Analysis program (version B.06.00, Agilent, Santa Clara, CA, USA) was used to deconvolute the raw data.

2.5. Analytical Ultracentrifugation (AUC)

The solution properties of the purified mAbs and cleaved F(ab’)2 and Fc were evaluated by sedimentation velocity experiments in an Optima XL-I AUC equipped with absorbance optics (Beckman Coulter, Brea, CA, USA). Each sample was prepared in three concentrations with 1:3 serial dilutions starting from 0.5 mg/mL in the corresponding buffer, and 400 μL of the prepared solution was loaded into the sample chamber, whereas buffer was loaded into the reference chamber of an AUC cell assembled with standard double-sector centerpieces and quartz windows. The experiments were conducted at 20 °C using an An60Ti 4-hole rotor spinning at 40,000 rpm. The sedimentation process was monitored by collecting absorbance data at 280 nm wavelength and 30-µm radial increments. The collected data was analyzed using the SEDANAL software by which the apparent sedimentation coefficient distribution g(s*) was derived [48]. The resulting analysis was initially plotted as g(s*) vs. s* in which the areas under the peaks provided the concentration for the boundary corresponding to each peak in the distribution. The weight average sedimentation coefficient (sw) was computed by selecting a range over which to do the average on the plots. The plots were concentration-normalized to enable the inspection for reversible interactions. The Stokes radius, Rs, which is used for ZDHH calculation is derived from the Svedberg equation:
R s = M ( 1 v ¯ ρ ) s N A 6 π η
where M is the molar mass, ῡ is the partial specific volume, ρ is the solvent density, s is the sedimentation coefficient, NA is the Avogadro’s number, and η is the viscosity of the solvent.

2.6. Imaged Capillary Isoelectric Focusing (icIEF)

The pI and charge heterogeneity of the IgG samples were determined on an iCE3 system (Protein Simple) [49,50]. Briefly, the pH gradient was created by an ampholyte mixture consisted of 44% (v/v) of 1% methylcellulose, 1.25% (v/v) of pharmalyte 3–10 solution, 3.75% (v/v) µL of pharmalyte 5–8 solution, 1.25% (v/v) of servalyte 9–11 solution, 0.63% (v/v) of pI marker pH 6.14, 0.63% (v/v) of pI marker pH 8.79, 6.3% (v/v) of 200 mM iminodiacetic acid, and 43% (v/v) of water. After sample preparation at 1 mg/mL in DI water, 40 µL of the diluted sample was mixed with 160 µL of ampholyte mixture and centrifuged for 5 min. The operating protocol used an initial potential of 1500 volts for 1 min, followed by a potential of 3000 volts for 20 min. For samples containing highly basic species, pI markers at pH 7.55 and pH 9.77 (0.63% v/v) and a focus period of 10 min at 3000 volts was used. Separation was monitored at 280 nm, and the data analyzed using the iCE CFR software to calibrate the pI values and to select the markers. Subsequently, the data files were exported to Empower for analysis using the cIEF processing method.

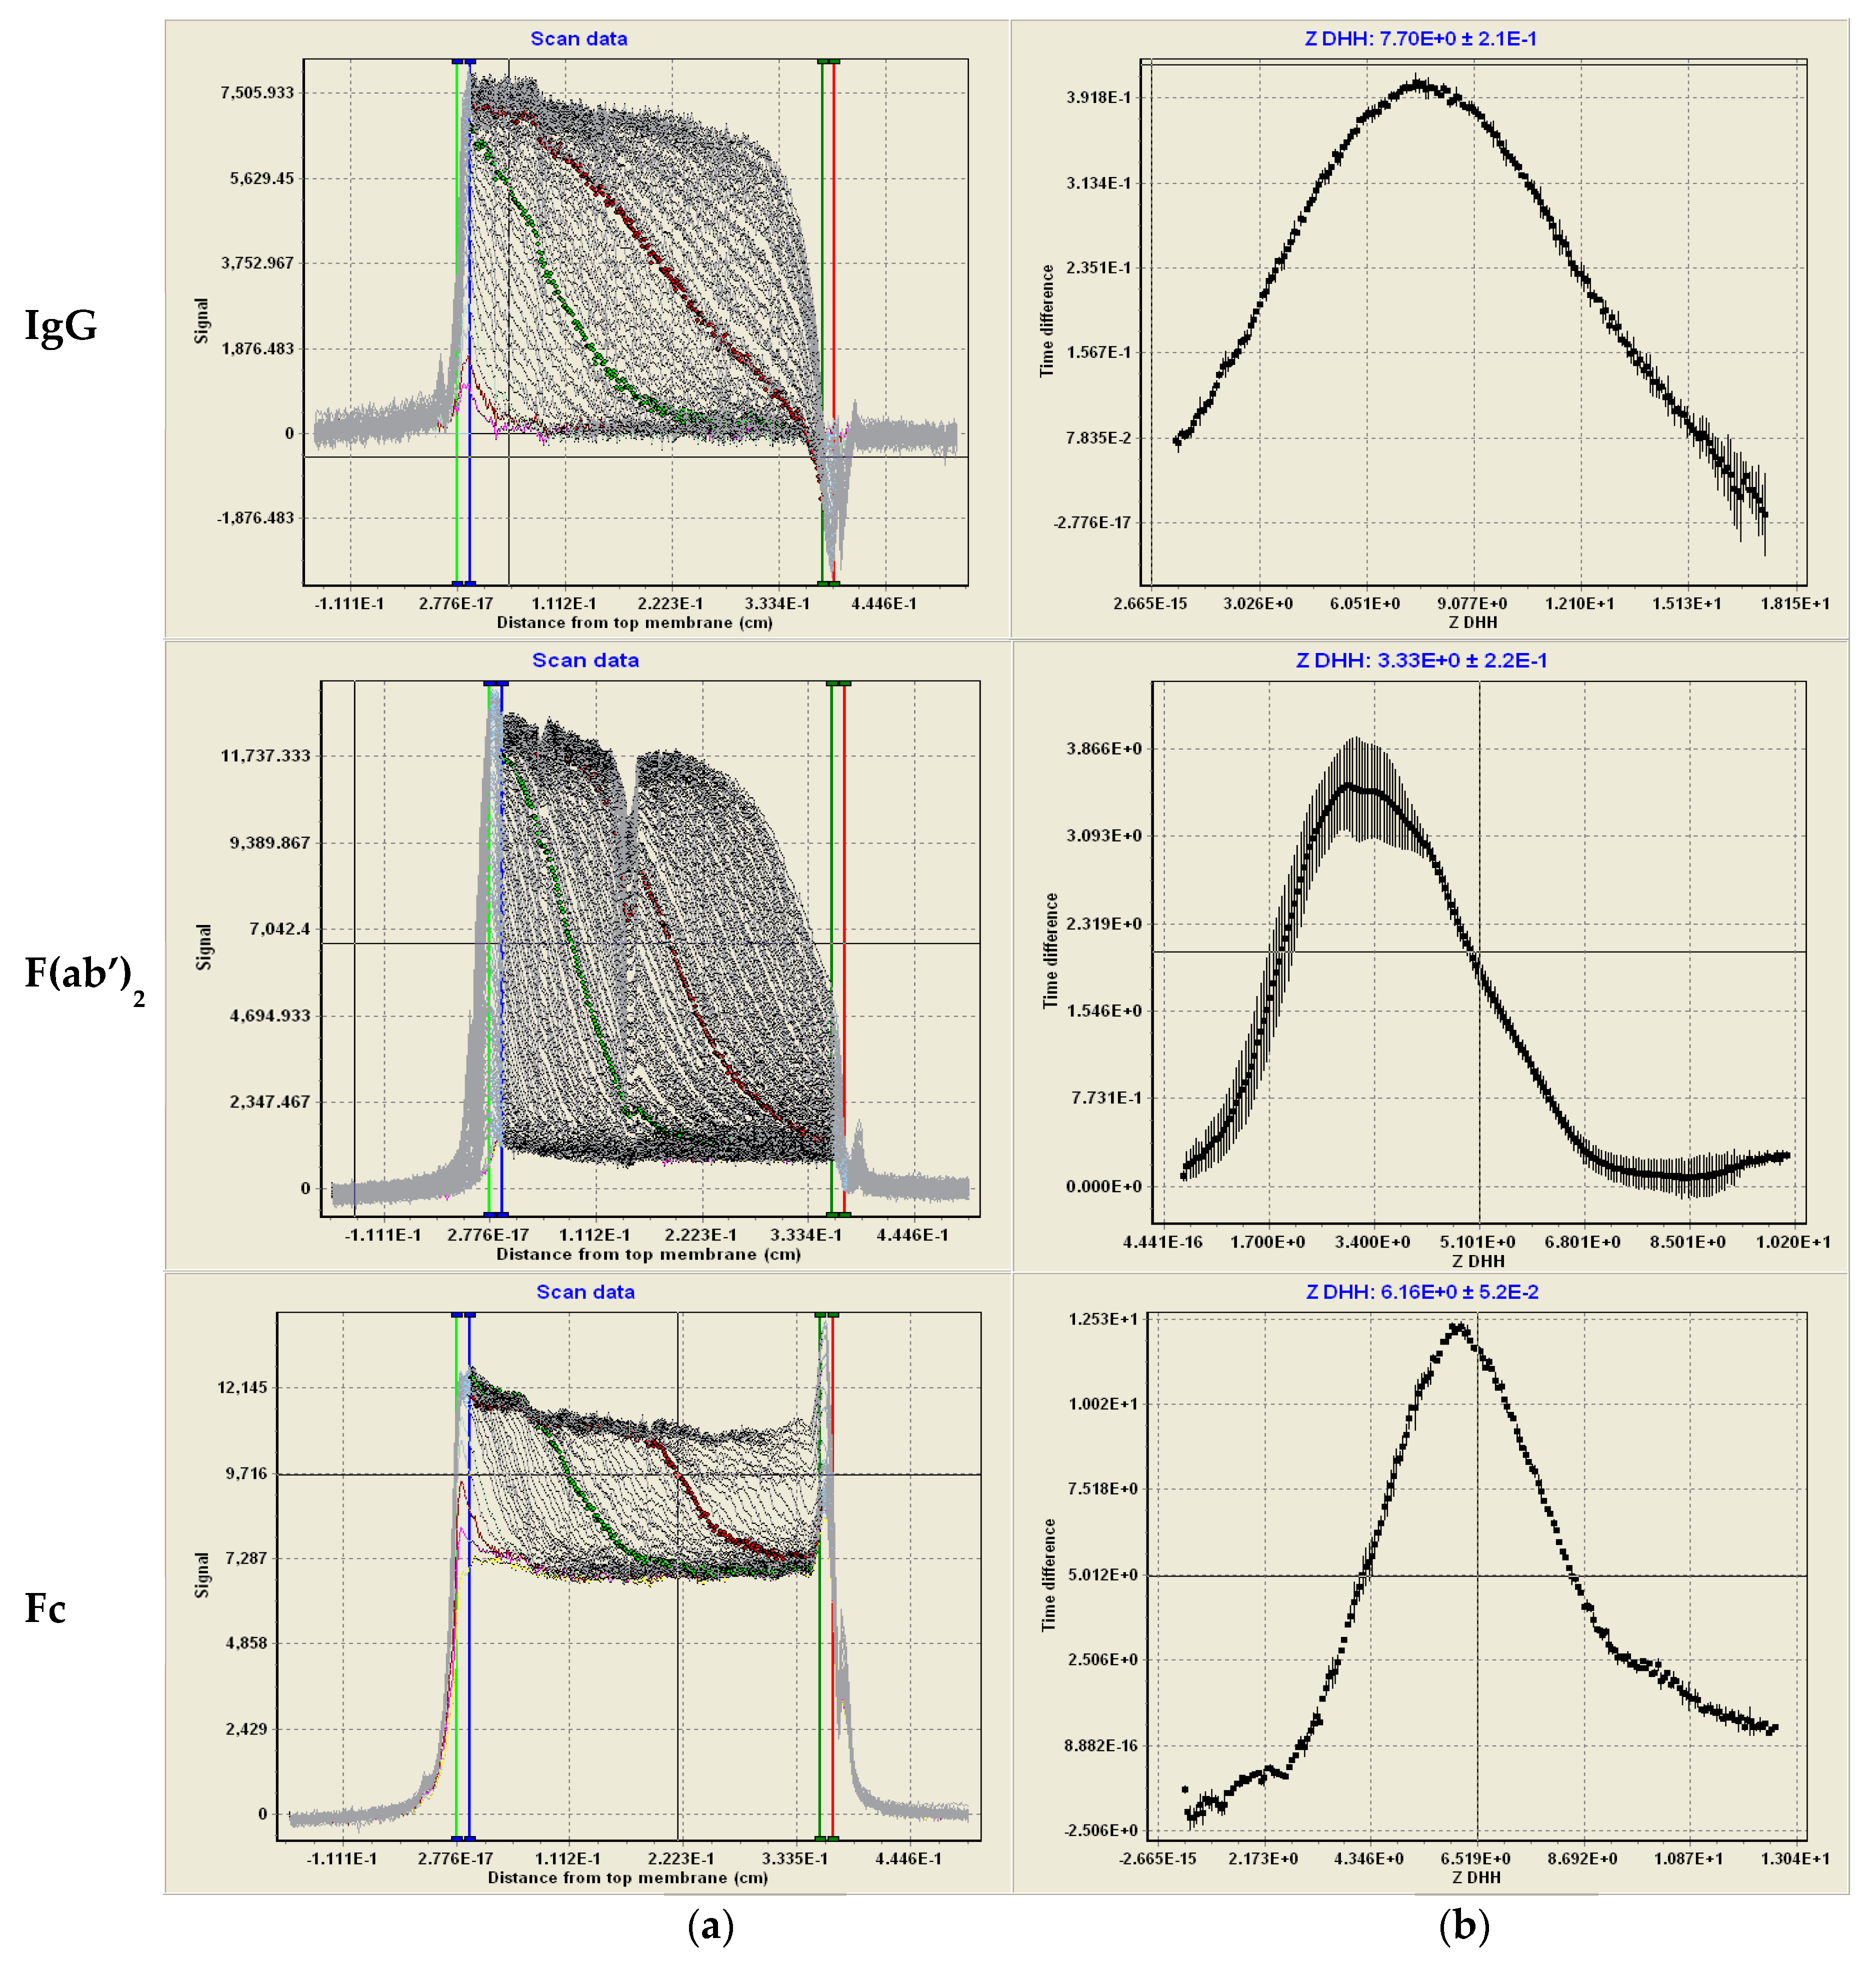
2.7. Membrane-Confined Electrophoresis (MCE) and ZDHH Determinations

Protein valence was measured in the MCE instrument (Spin Analytical, Inc., Berwick, Me, USA), which provides a direct measurement of the electrophoretic mobility (µ) to derive the Zeff and the ZDHH [32,33]. In each experiment, 20 µL of sample at 1 mg/mL was loaded into a 2 × 2 × 4 mm quartz cuvette whose ends were sealed with semipermeable membranes (MWCO 3 kDa, Spectra/Por Biotech grade). An electric field was applied (4.3 V/cm for IgG, 8.5 V/cm for F(ab’)2 and Fc, and 19.8 V/cm for serum IgGs) longitudinally across the cell. The applied electric field, E, is a function of the applied current, i, the buffer conductivity (κ, 5.8 mS for 10 mM acetate, 50 mM NaCl [pH 5.0] and 16.8 mS for PBS [pH 7.4]), and the cross-sectional area of the cuvette, A, as E = i κ A . Image scans of the cuvette were acquired with 25 μm resolution at 280 nm every 10–20 s. Time difference analysis provided an apparent electrophoretic mobility distribution, g(μ) versus μ, uncorrected for diffusion. Values of μ were converted to charge using the Spin Analytical software:
Z e f f = μ f e
Z D H H = Z e f f 1 + κ D a H ( κ D a )
where µ is the electrophoretic mobility, f is the translational frictional coefficient, e is the elementary proton charge, ĸD is the inverse Debye length, a is the sum of the Stokes radius of the macromolecule and its counterion (0.18 nm for Cl1 and 0.122 nm for Na+), and H(κD a) is Henry’s function that accounts for electrophoretic effects. For reference, under the experimental conditions used here, κDa ~ 2 and H(κDa) ~ 1.1, though exact values are calculated for each experiment.

2.8. Calculated Charge, Zcal, and Calculated Isoelectric pH, pICal

Sednterp was used to calculate pI values, pICal, as well as the H+ titration curve from which Zcal was determined [51]. These calculations are based on the amino acid composition and use pKa values from Edsall and Wyman [52]. It was assumed that the N-terminal amino groups were not blocked.

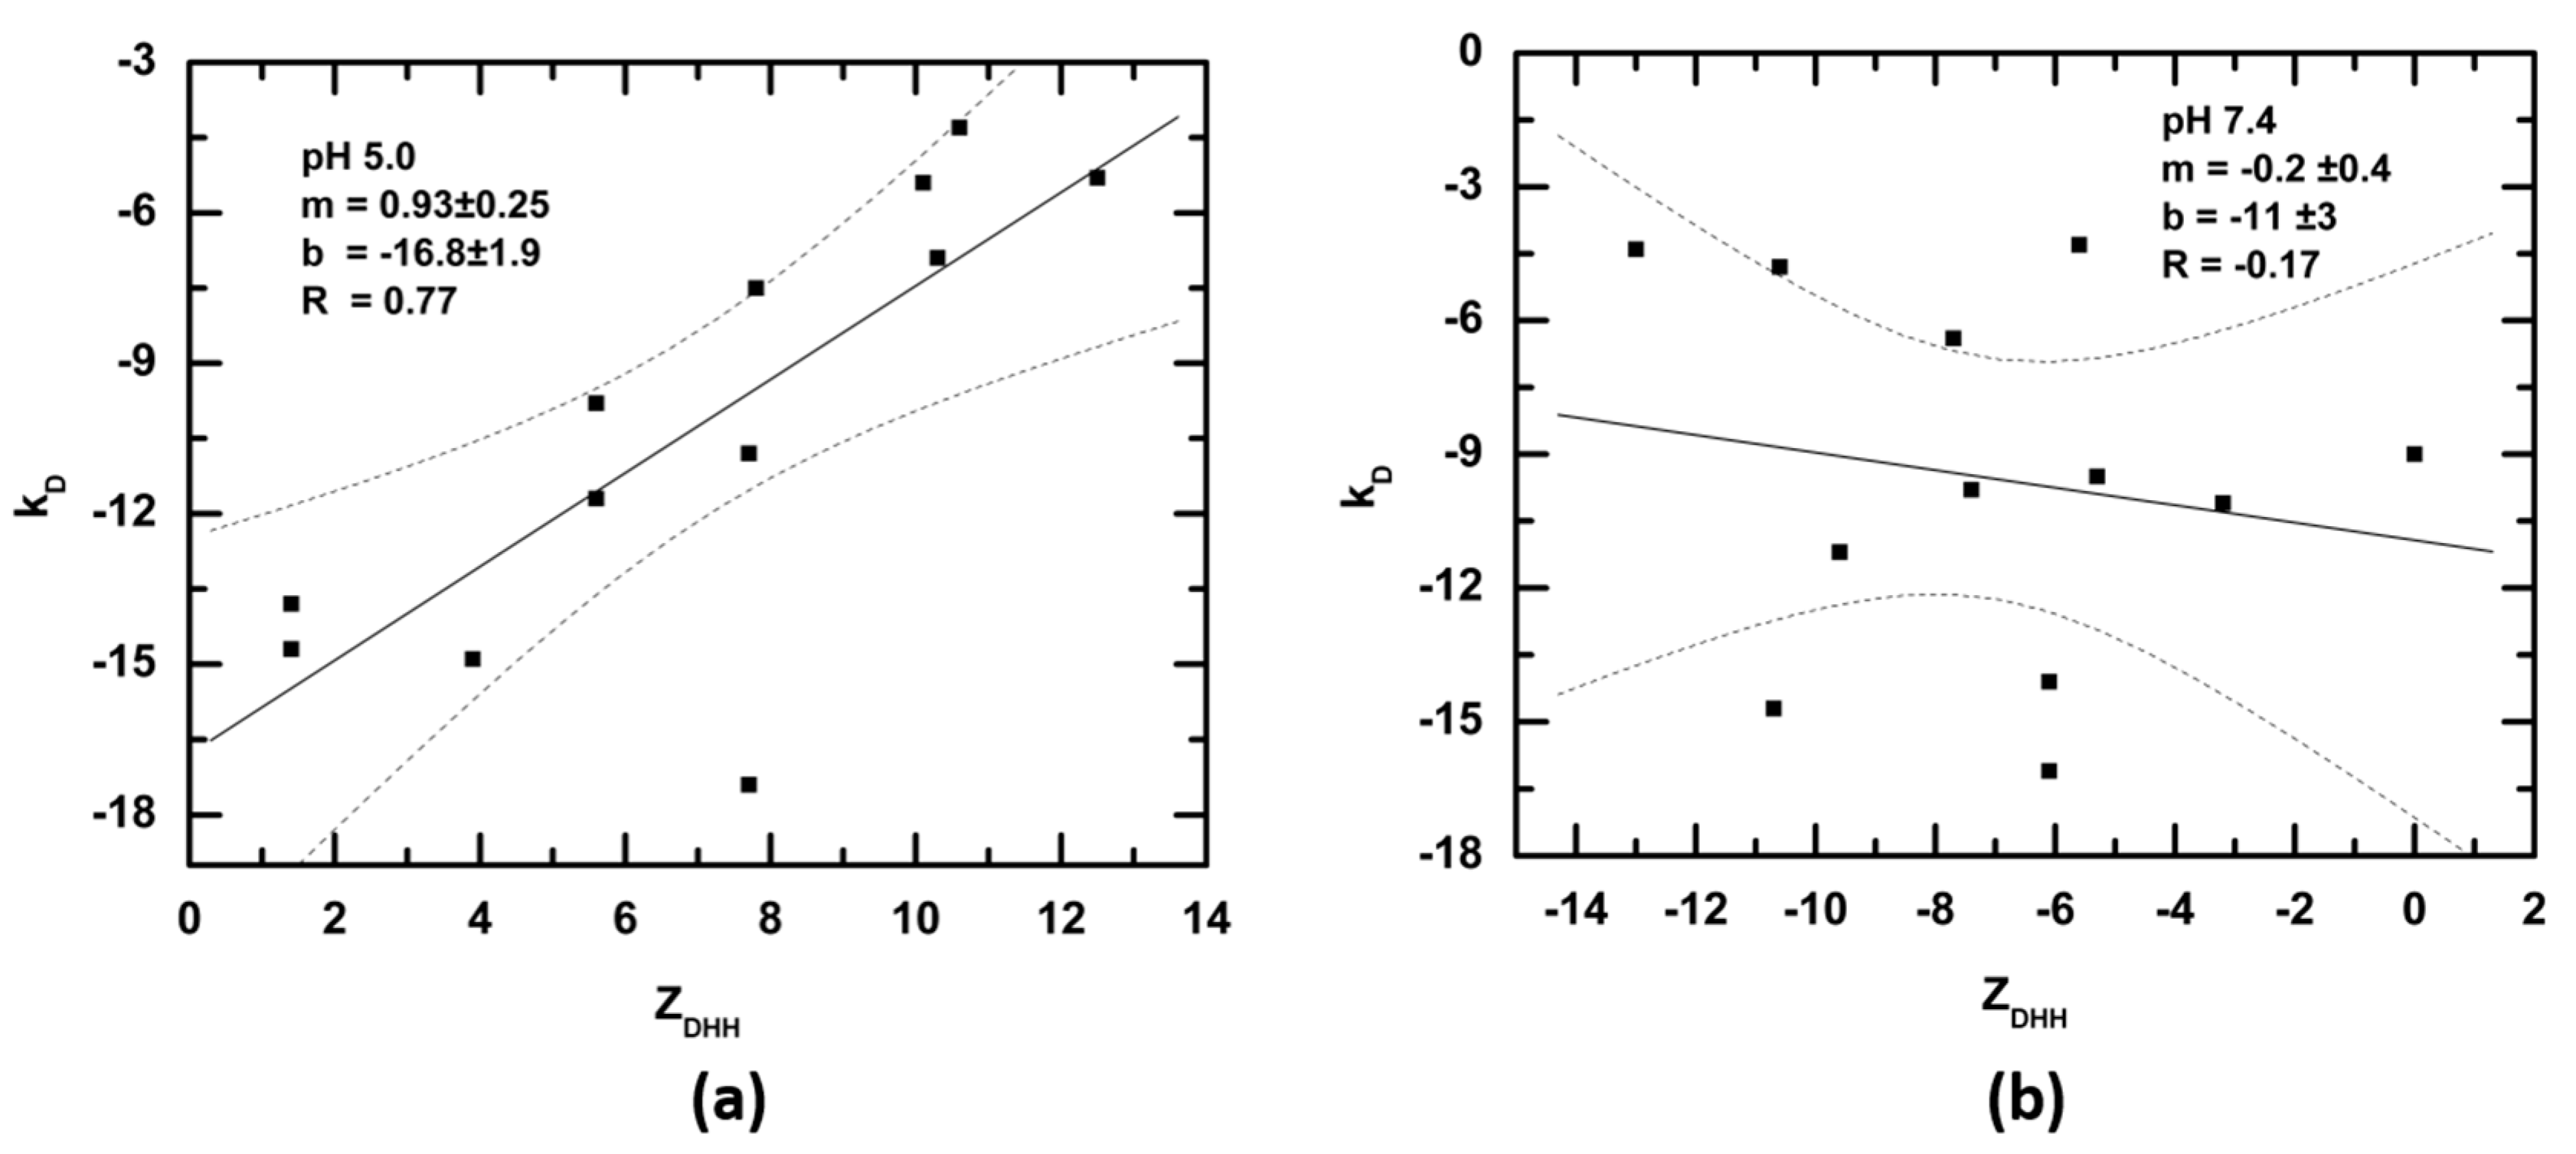
2.9. Dynamic Light Scattering (DLS) and kD Determinations

A DynaPro Plate Reader (Wyatt Technology, Santa Barbara, CA, USA) running Dynamics (version 7.4.0.72) was used to determine the diffusion interaction parameter, kD. Each sample was prepared at 5 concentrations ranging from 10 mg/mL to 0.625 mg/mL in 2-fold serial dilutions. 35 μL of each solution was added to a 384-well UV-Star Clear Microplate (Greiner Bio-One), spun in a centrifuge for 2 min to remove air bubbles and then placed into the plate reader. The experiment was started after the temperature inside the reader reached 20 °C. A total of 10 acquisitions at 20 s per acquisition were obtained for each sample. A well image was acquired after the last acquisition measurement to look for bubbles or deposited aggregates. The mutual diffusion coefficient (Dm) was plotted against the sample concentration Dm = D0(1 + kDC), with D0 and kD determined by linear regression analysis using GraphPad Prism (version 7.03). The error for kD was determined by calculating the propagation of the standard error of the coefficients from the linear regression.

2.10. Calculation of the Protein–Protein Interaction Curve

Thermodynamic nonideality reflects a balance of repulsive (B22 > 0) and attractive interactions (B22 < 0) between molecules. Only two protein characteristics contribute to positive B22 values, charge–charge repulsion (when the molecules have the same sign charge) and excluded volume (always repulsive). The contribution charge–charge repulsion, including the impact of the Debye-Hückel counterion cloud, may be calculated from B Z = 1000 Z 2 2 v ¯ 1 4 m 3 M 2 2 ( 1 + 2 κ r s ( 1 + κ r s ) 2 ) , where Z 2 2 is the square of the protein charge (i.e., ZDHH), v ¯ 1 the solvent partial specific volume (mL/g), M2 the protein molecular weight (g/mol), m3 the salt molality (mol/kg), κ the inverse Debye length (cm−1) and rs the solvated protein radius (cm) [12,44]. The excluded volume includes contributions from the shape of the molecule (in this case, using the axial ratio) and the hydration layer [12,44]. The excluded volume contribution is B E x = 8 V N A 2 M 2 2 , where V is the solvated protein volume (mL/particle) and NA is Avogadro’s number [12,44]. The overall repulsive nonideality, B22, is the sum of these two contributions. The weak attractive interactions observed for IgGs may be expressed in terms of a dimer dissociation, e.g., I g G 2 I g G + I g G , with the strength given by the dissociation constant given by K d = [ I g G ] 2 [ I g G 2 ] . At any concentration, the weight-average molecular weight, Mw, of a monomer–dimer mixture may be calculated knowing Kd. For systems exhibiting only repulsive interactions, the slope of a graph of 1/Mw versus concentration, C (in g/mL), B22 (in ml-mole/g2), will be positive. Often, a graph of M1/Mw, where M1 is the monomer molar mass, is used to ‘normalize’ the data, in which case the slope of the line is M1B22 and is called A2 (in mL/g) in the literature. In either case, for purely repulsive systems over a wide concentration range, B22 or A2 are positive and constant. For a system that exhibits a mass-action association, Mw increases with concentration (1/Mw or M1/Mw decrease, producing a negative curve). However, even in the face of self-association, B22 (or A2) remain constant and positive, and push the curve in the opposite direction of self-association. Thus, for systems exhibiting both repulsive nonideality and weak self-association, unusual curves may result, starting with a negative slope at low C and winding up with a positive slope at higher C. The slope of the 1/Mw or M1/Mw curve at each concentration, then, is an apparent B22, B22-app, or A2, A2-app. It is important to note that both B22-app and A2-app are thermodynamic parameters and represent useful protein–protein interaction parameters. For this work, data are presented as A2-app. A2-app is > 0 for net repulsion, <0 for net attraction and =0 for a thermodynamically ideal system.

3. Results

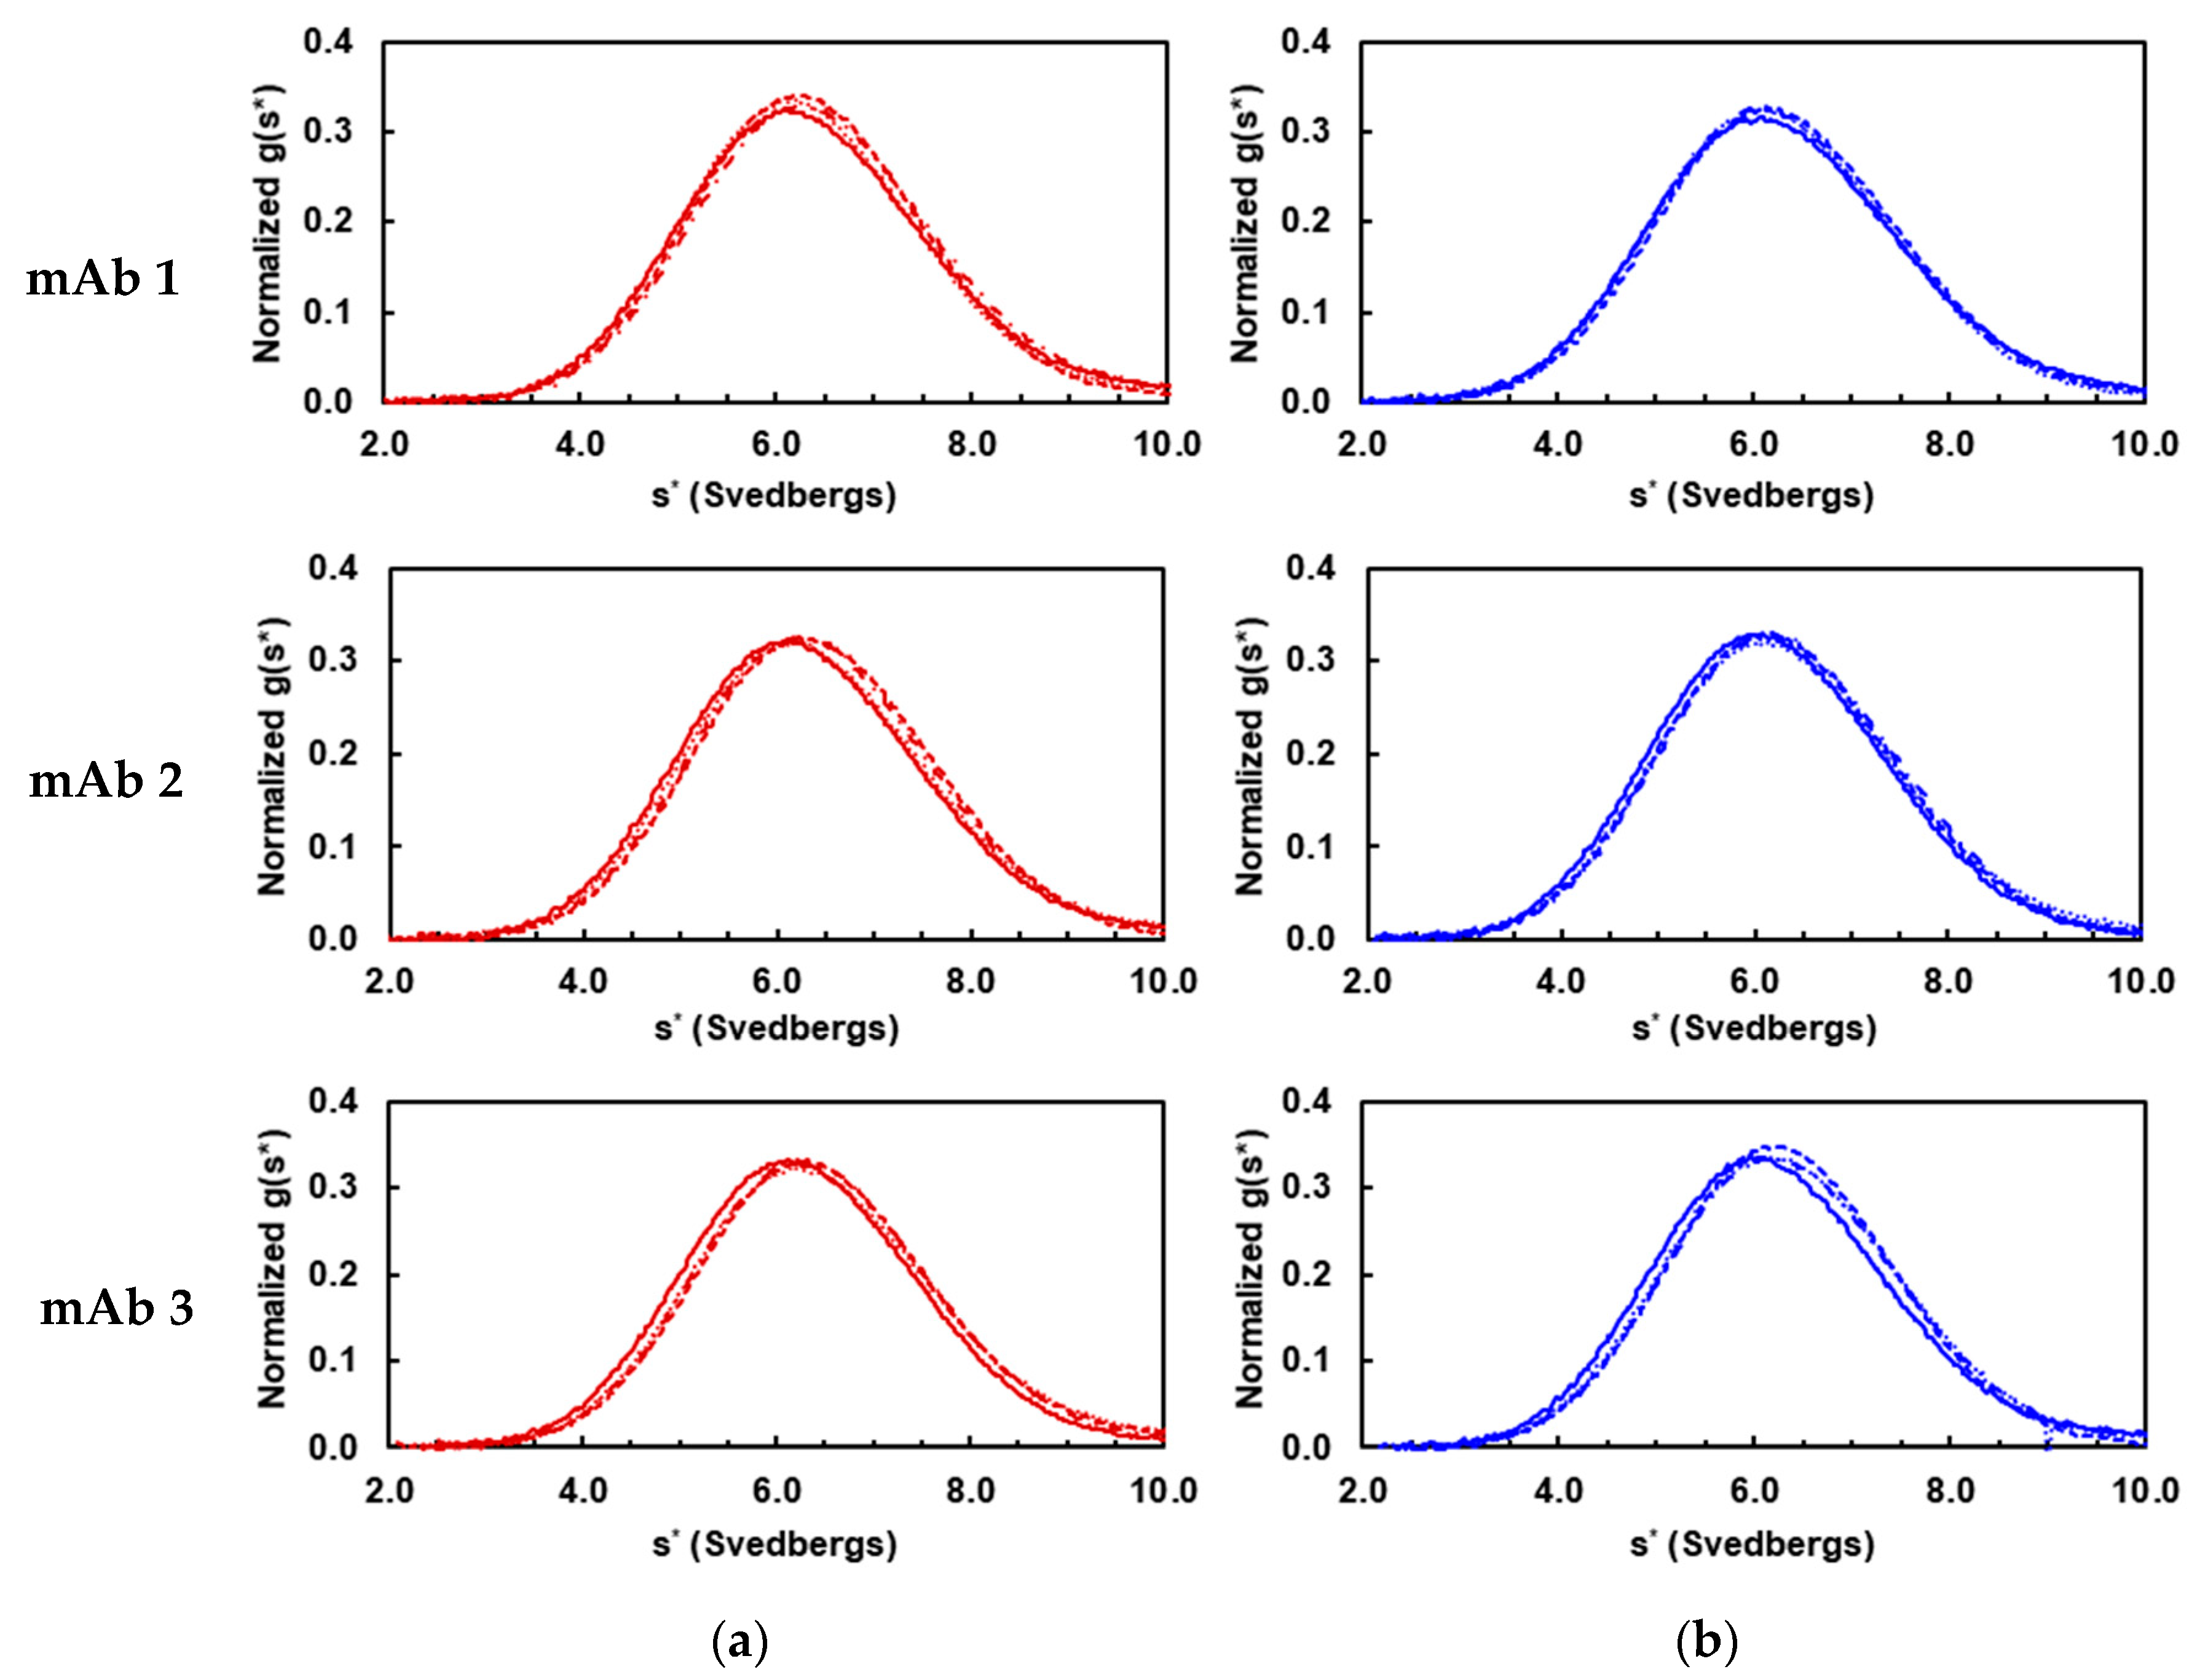
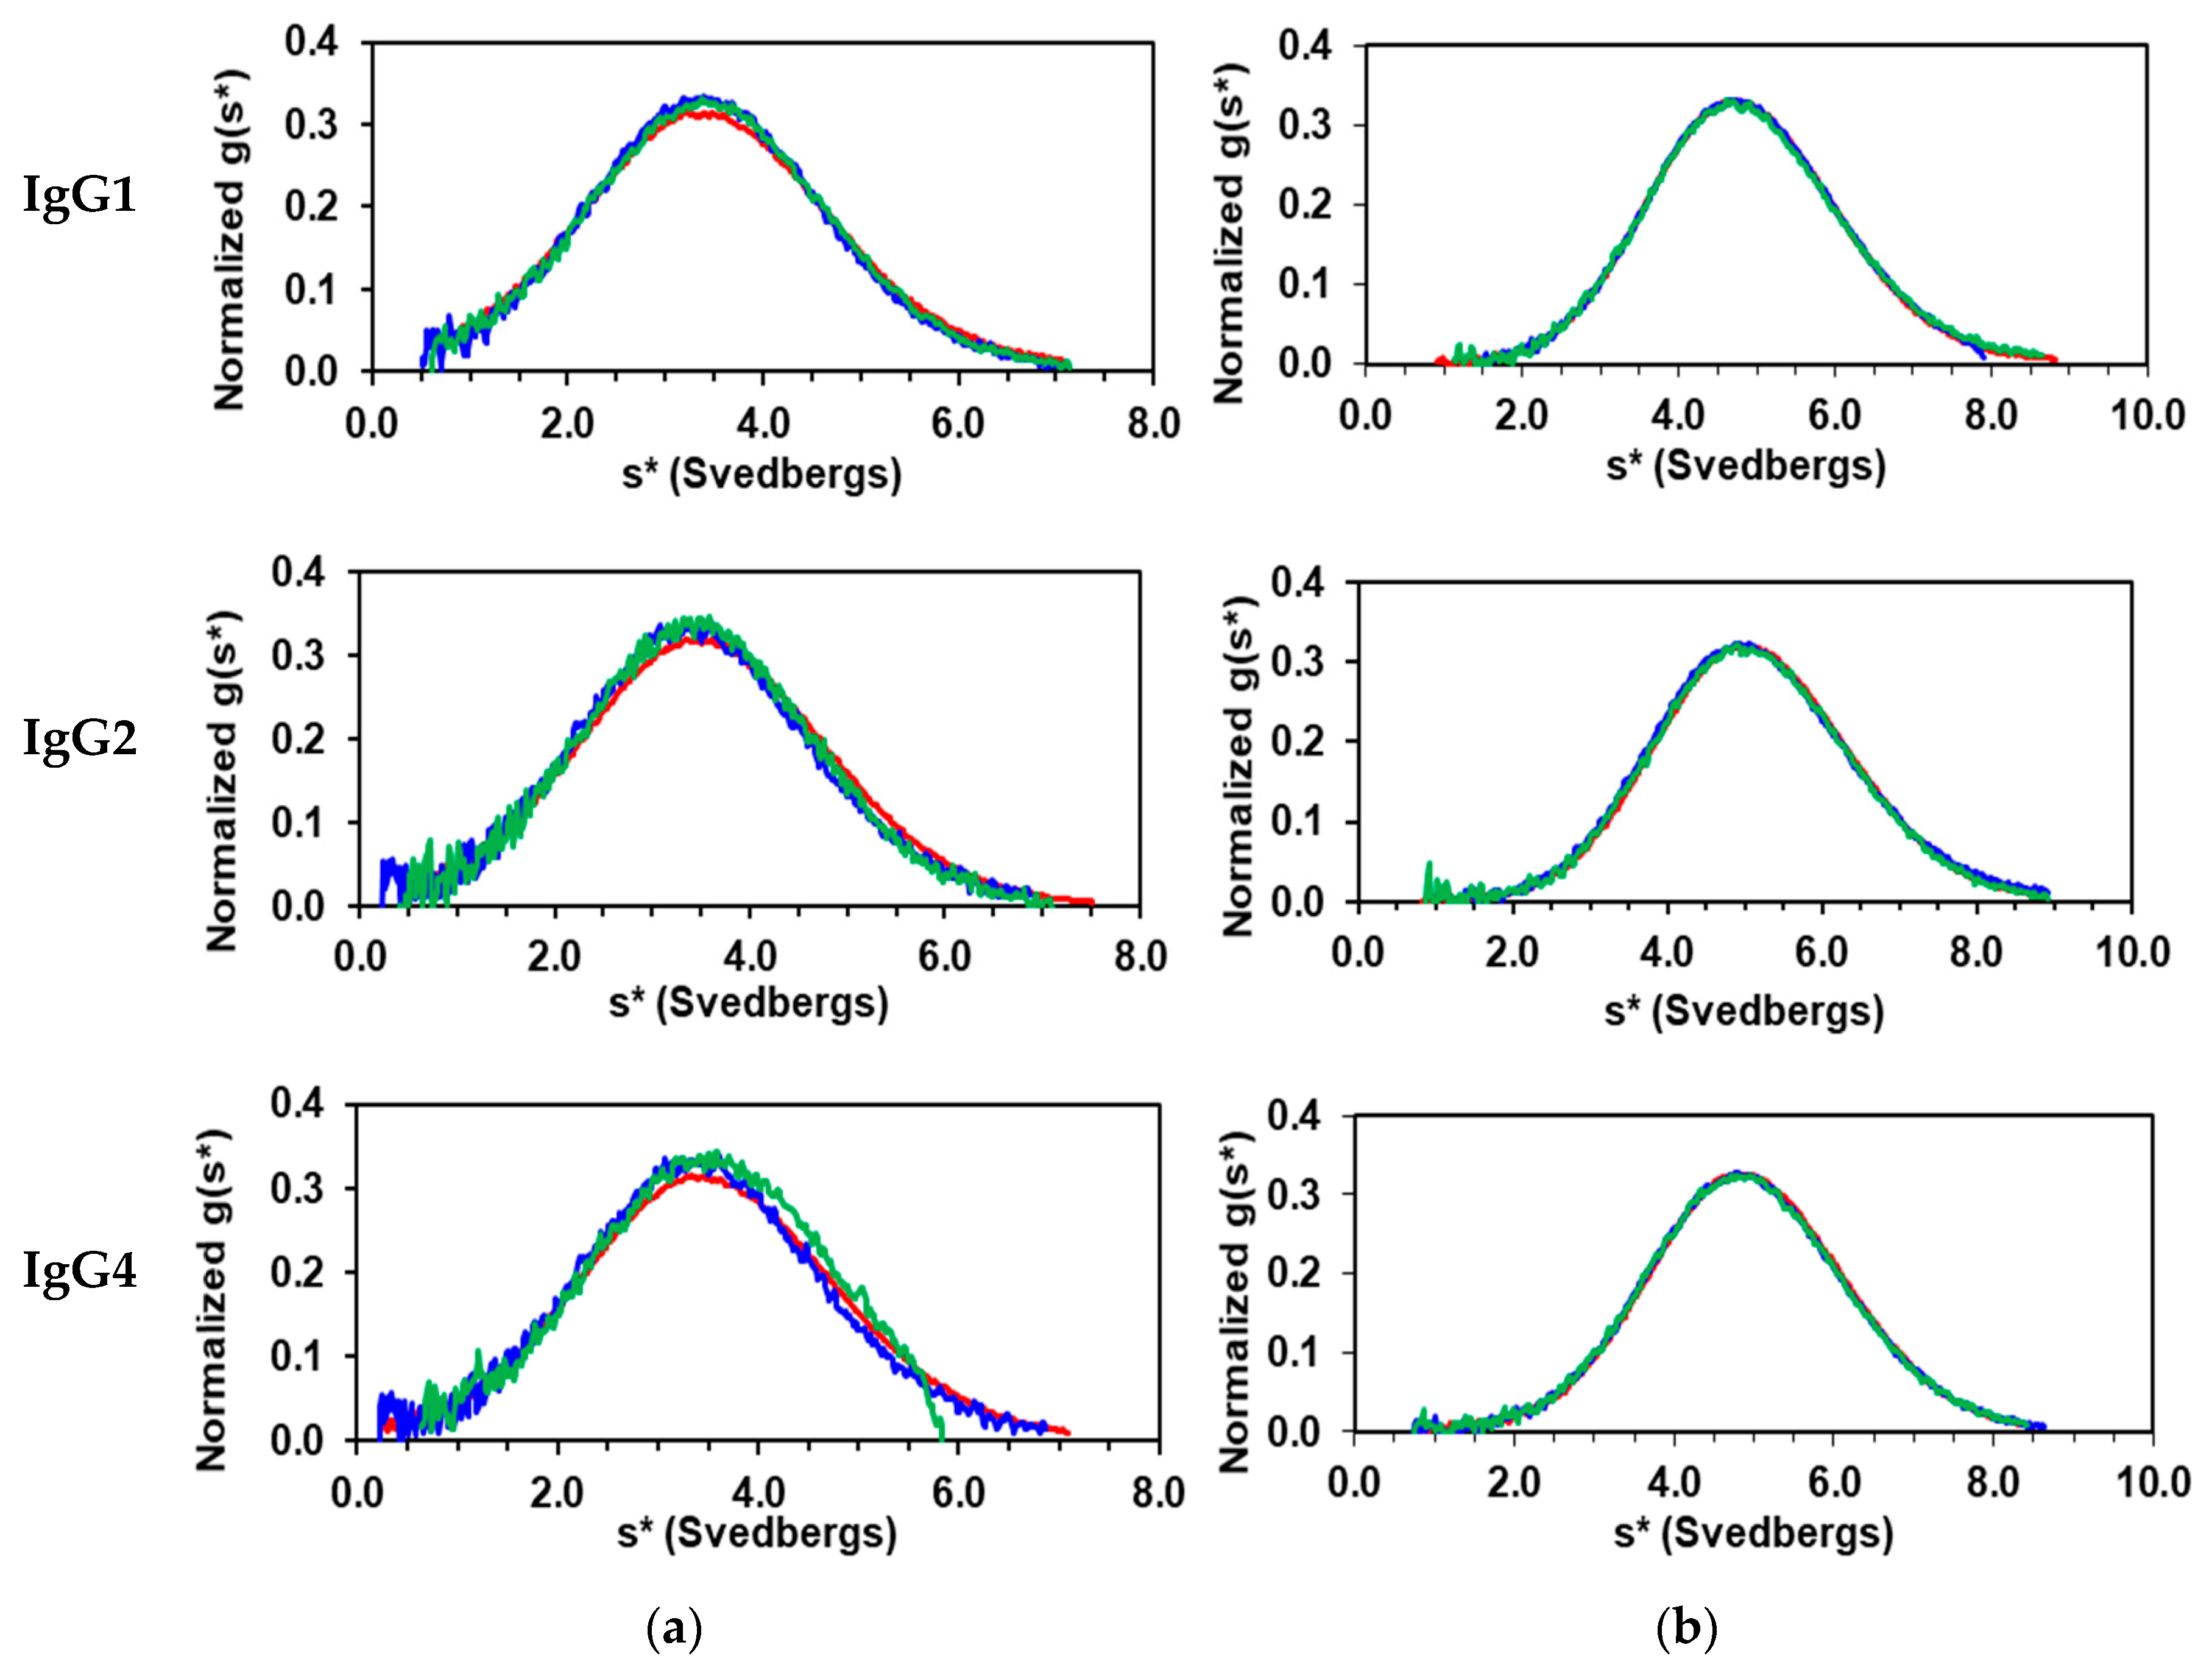
3.1. Solution Properties of IgGs and Their Fragments

All purified IgGs were subjected to purity characterization by SE-UPLC, sequence identify and glycoform distribution analysis by LC-MS. As summarized in Table 1, all purified materials contain >99% monomer content and were confirmed by sequence to be in the expected IgG subclass with typical distribution of G0F, G1F, and G2F asparagine (N)-linked glycoforms.
The IgGs also displayed homogeneous solution properties within each mAb group in either pH 5.0 acetate and pH 7.4 PBS as illustrated in Figure 1 by the overlapping g(s*) curves. The weight-average sedimentation coefficients (sw) are mAb1 6.37 ± 0.06, mAb2 6.37 ± 0.05, and mAb3 6.43 ± 0.09 in pH 5.0 acetate, and mAb1 6.28 ± 0.04, mAb2 6.27 ± 0.07, and mAb3 6.31 ± 0.06 in pH 7.4 PBS. These sw values are consistent with the molecular weight of ~150 kDa IgG antibodies.
IgG cleavage sites and fragment purity are presented in Table 2. The solution homogeneity of each cleaved fragment was assessed by SV-AUC. All IgG fragments showed sedimentation distribution profiles like that in Figure 2 for mAb 1, where the superposition of the three concentrations of F(ab’)2 and Fc samples indicate homogeneity and the absence of self-association. The weight-average sedimentation coefficients (sw) from the Fc evaluations are 3.45 ± 0.02, 3.46 ± 0.02, and 3.38 ± 0.18 for IgG1, IgG2, and IgG4/IgG4Pro, respectively. These values are consistent with the molecular weight of ~50 kDa, which indicates the Fc fragment remains a homodimer in solution despite cleavage below the hinge region. The sw from the F(ab’)2 evaluations are 4.86 ± 0.01, 5.14 ± 0.06, 4.90 ± 0.02, and 4.95 ± 0.01 for IgG1, IgG2, IgG4, and IgG4Pro, respectively. These values are consistent with the molecular weight of ~100 kDa, which is expected for a bivalent Fab.

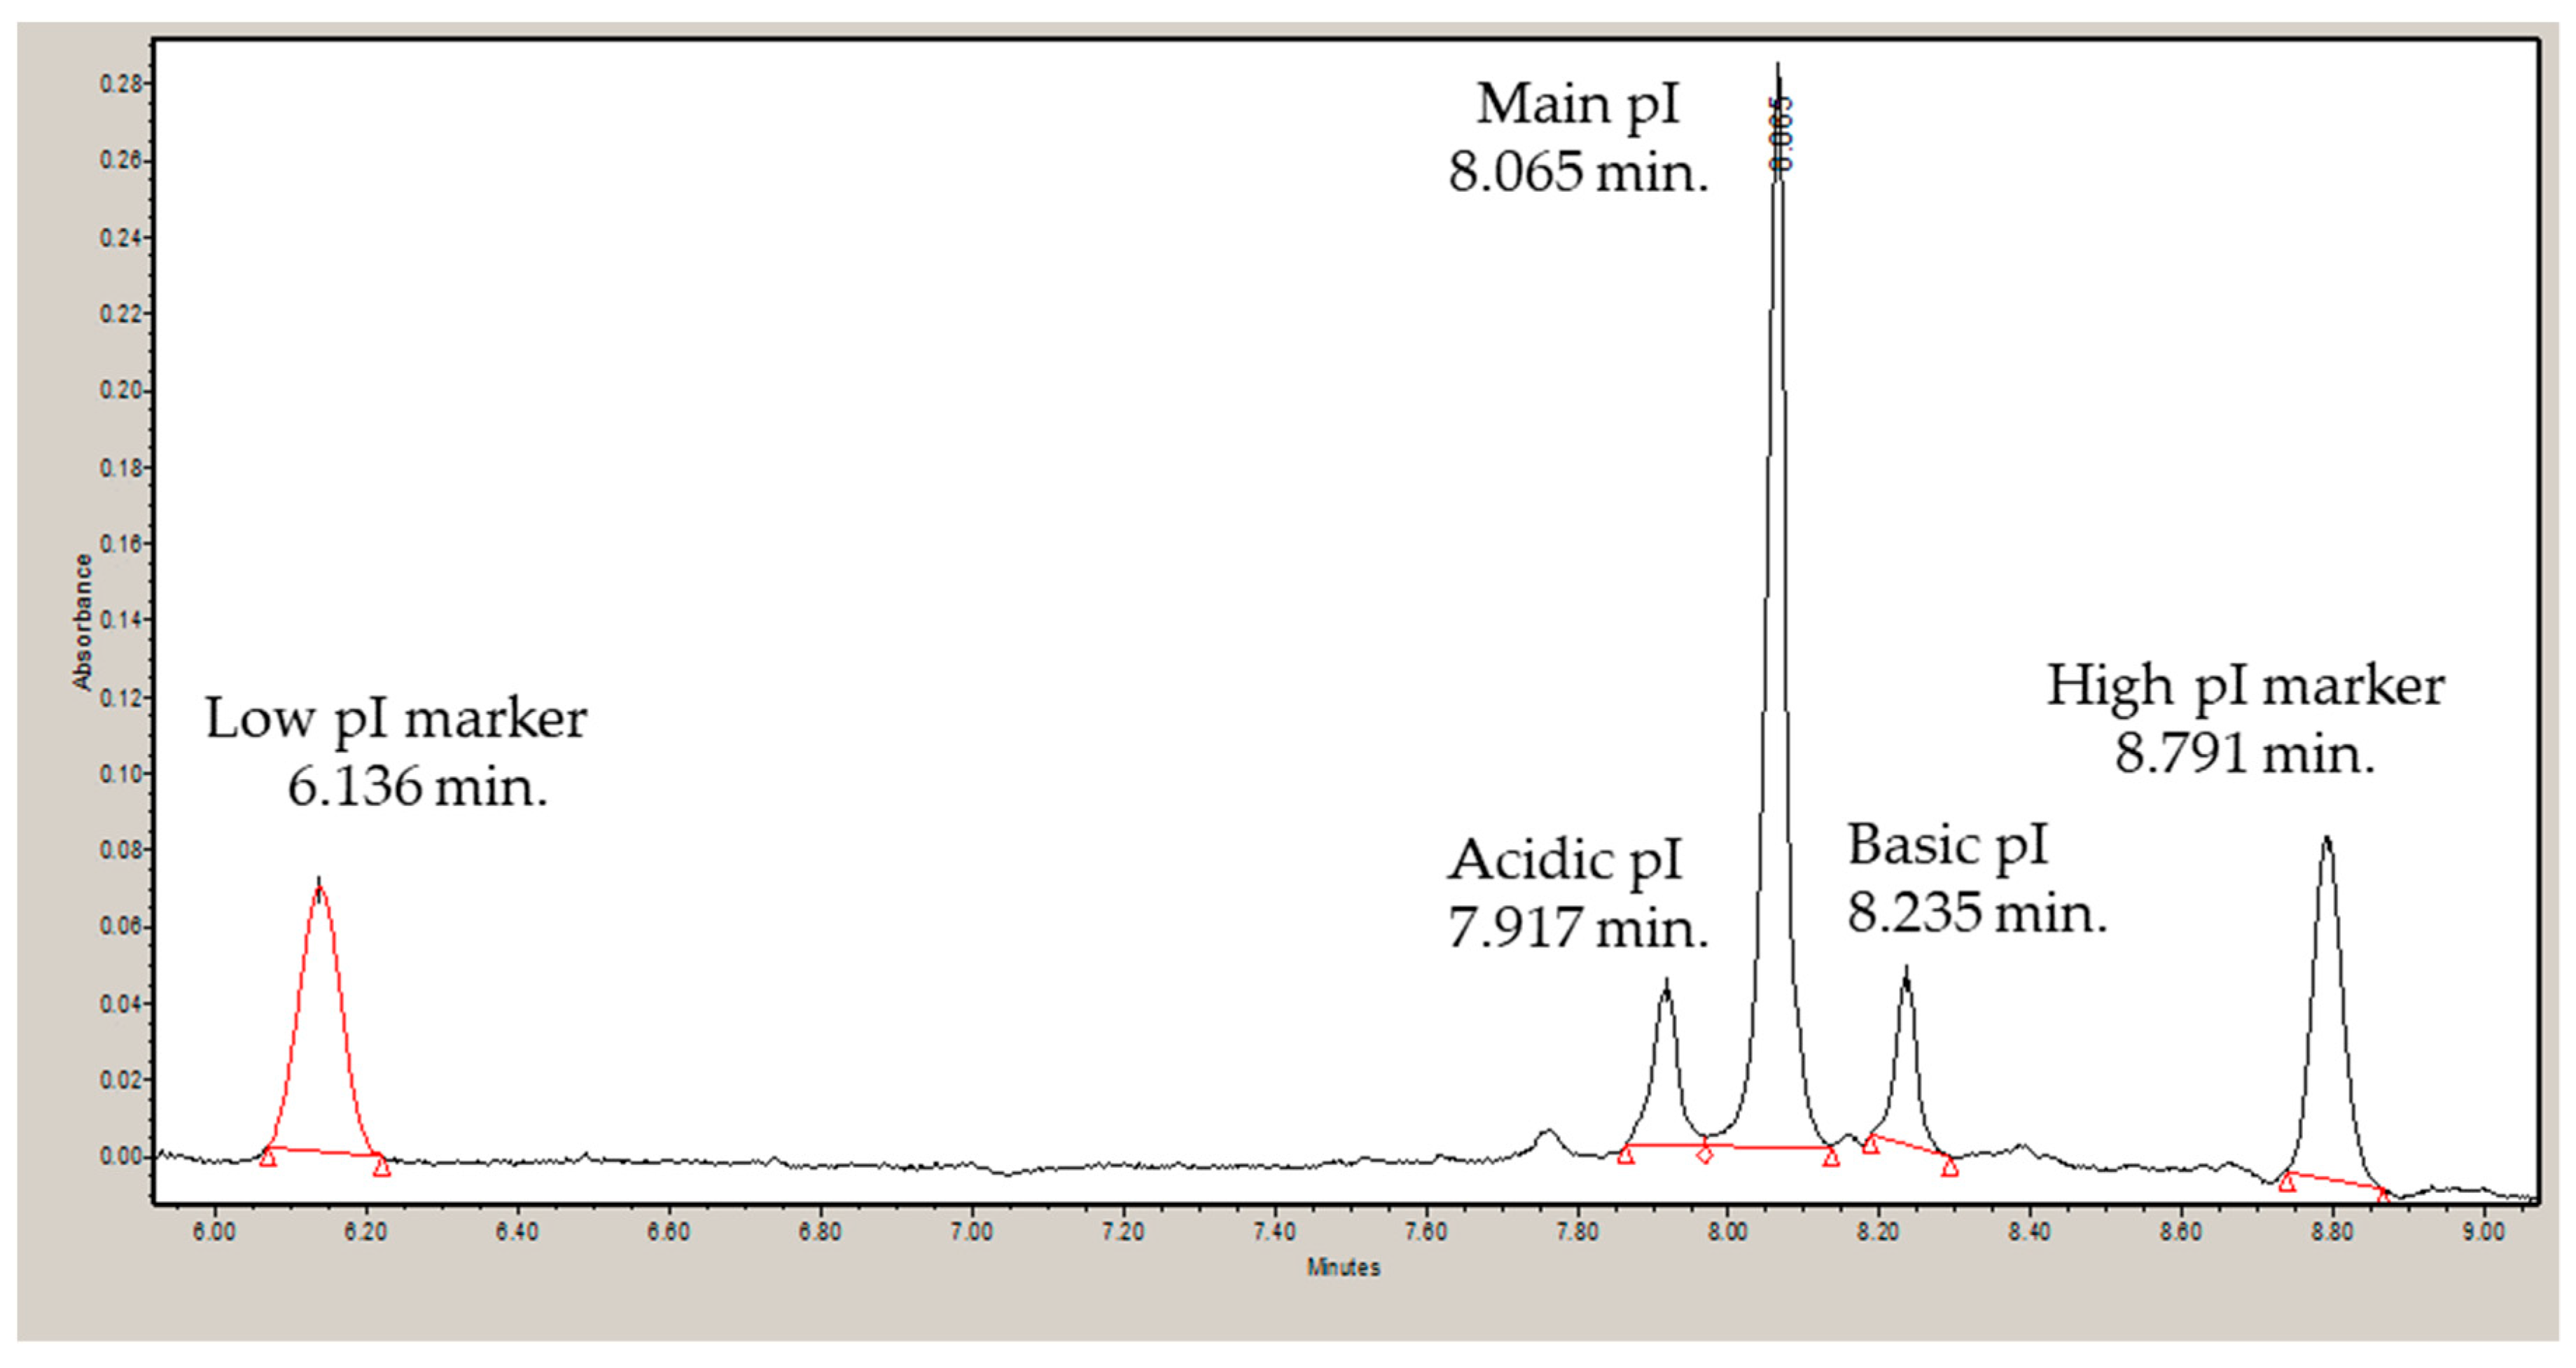
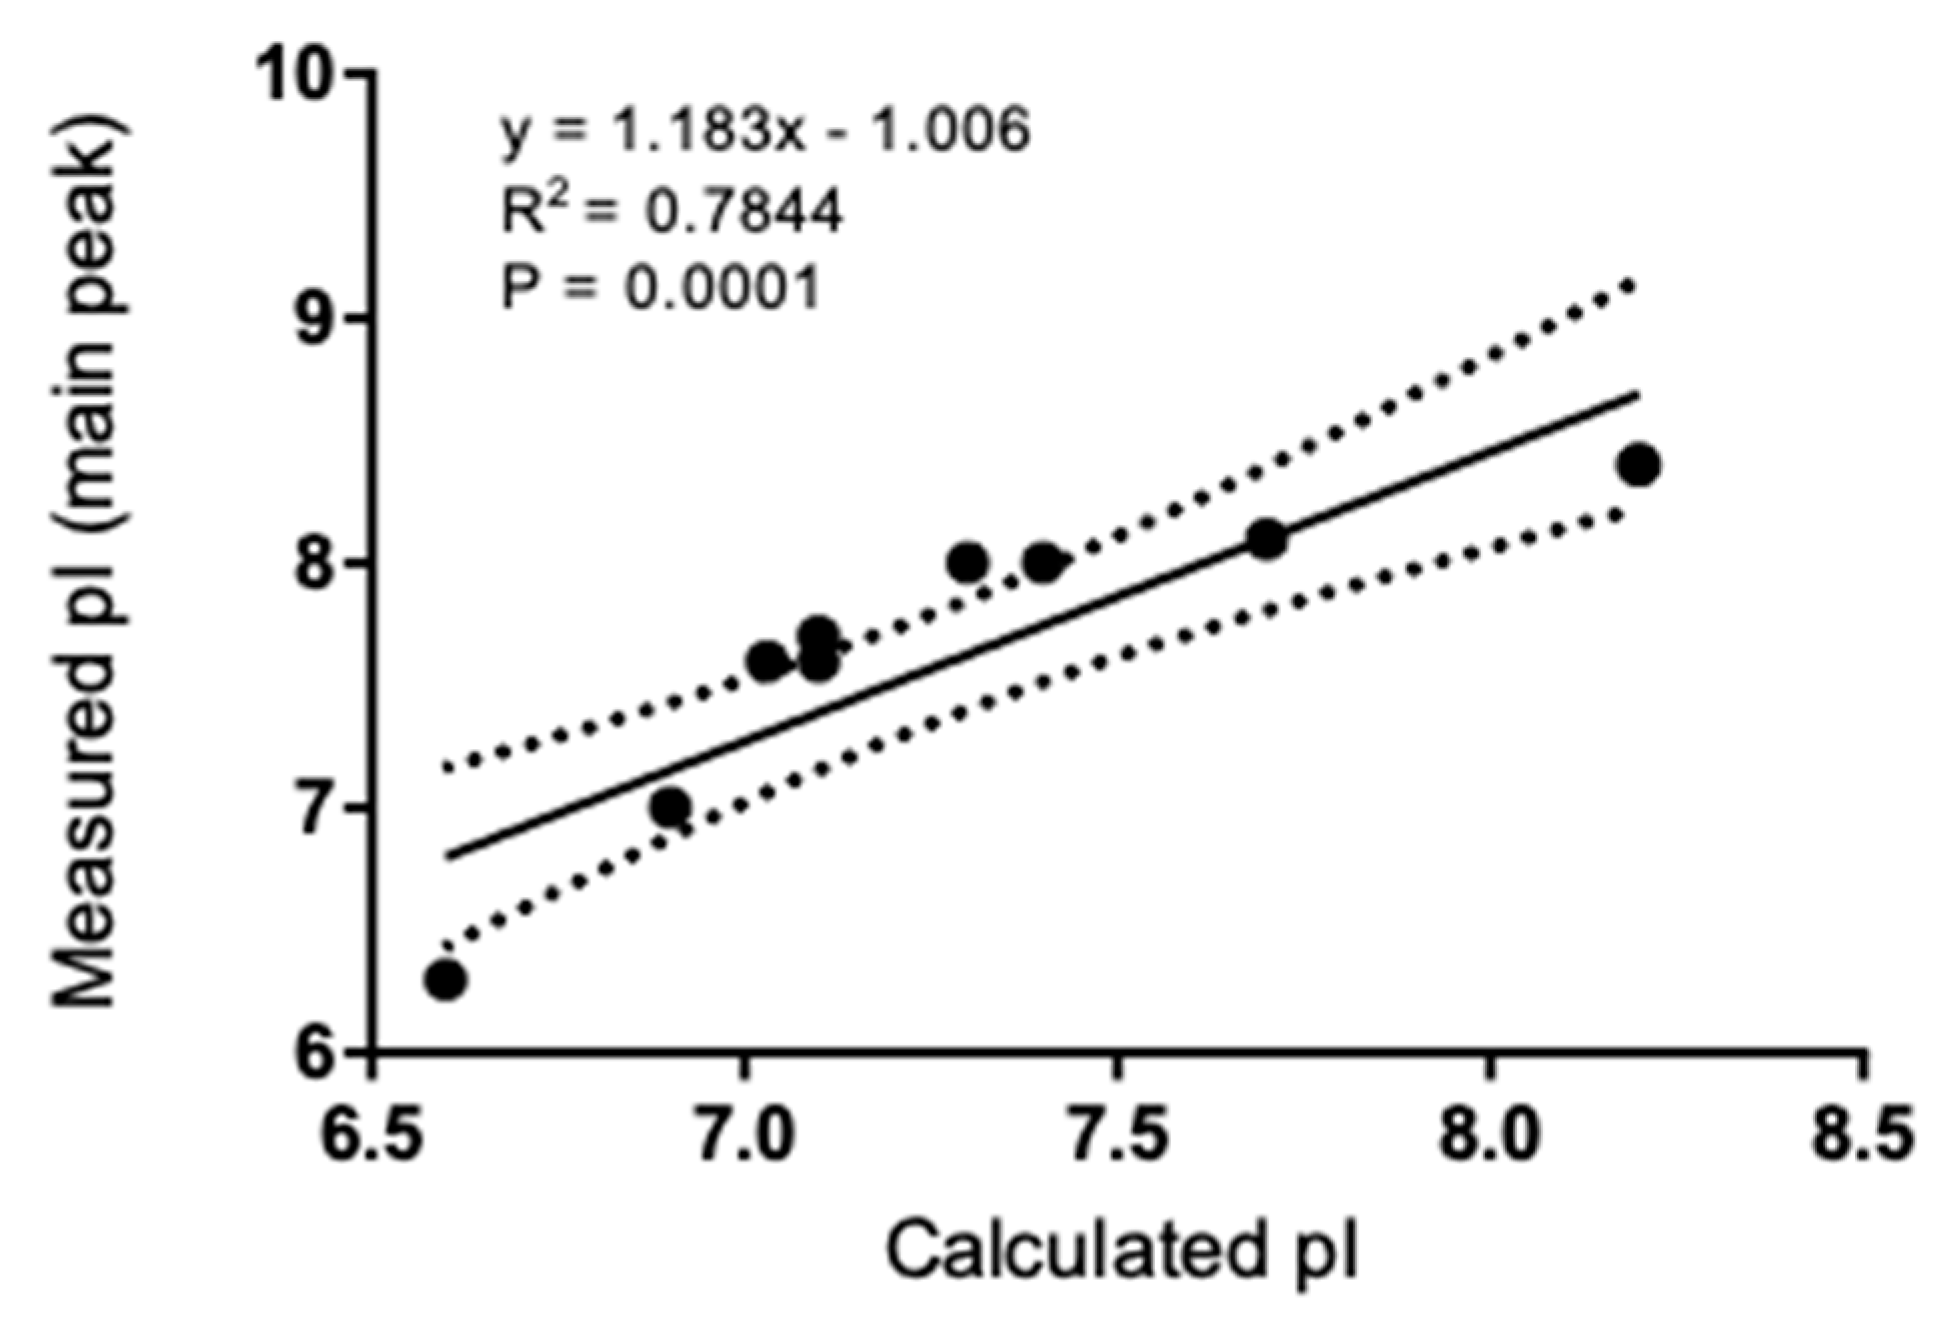
3.2. Isoelectric Point and Correlation to Calculated Values

All IgGs exhibited pI profiles similar to that in Figure 3 for mAb 1 IgG1. Three-peaks are observed, acidic, main and basic. The pI values for each IgG are presented in Table 3, along with the calculated pI. For each mAb, the subclass pIs followed the trend: IgG1 > IgG2 > IgG4, with those of IgG4 and IgG4Pro being identical. The measured main species pI and the calculated pI are correlated (Figure 4), though the intercept (−1) suggests that pICal corresponds to the more acidic species.

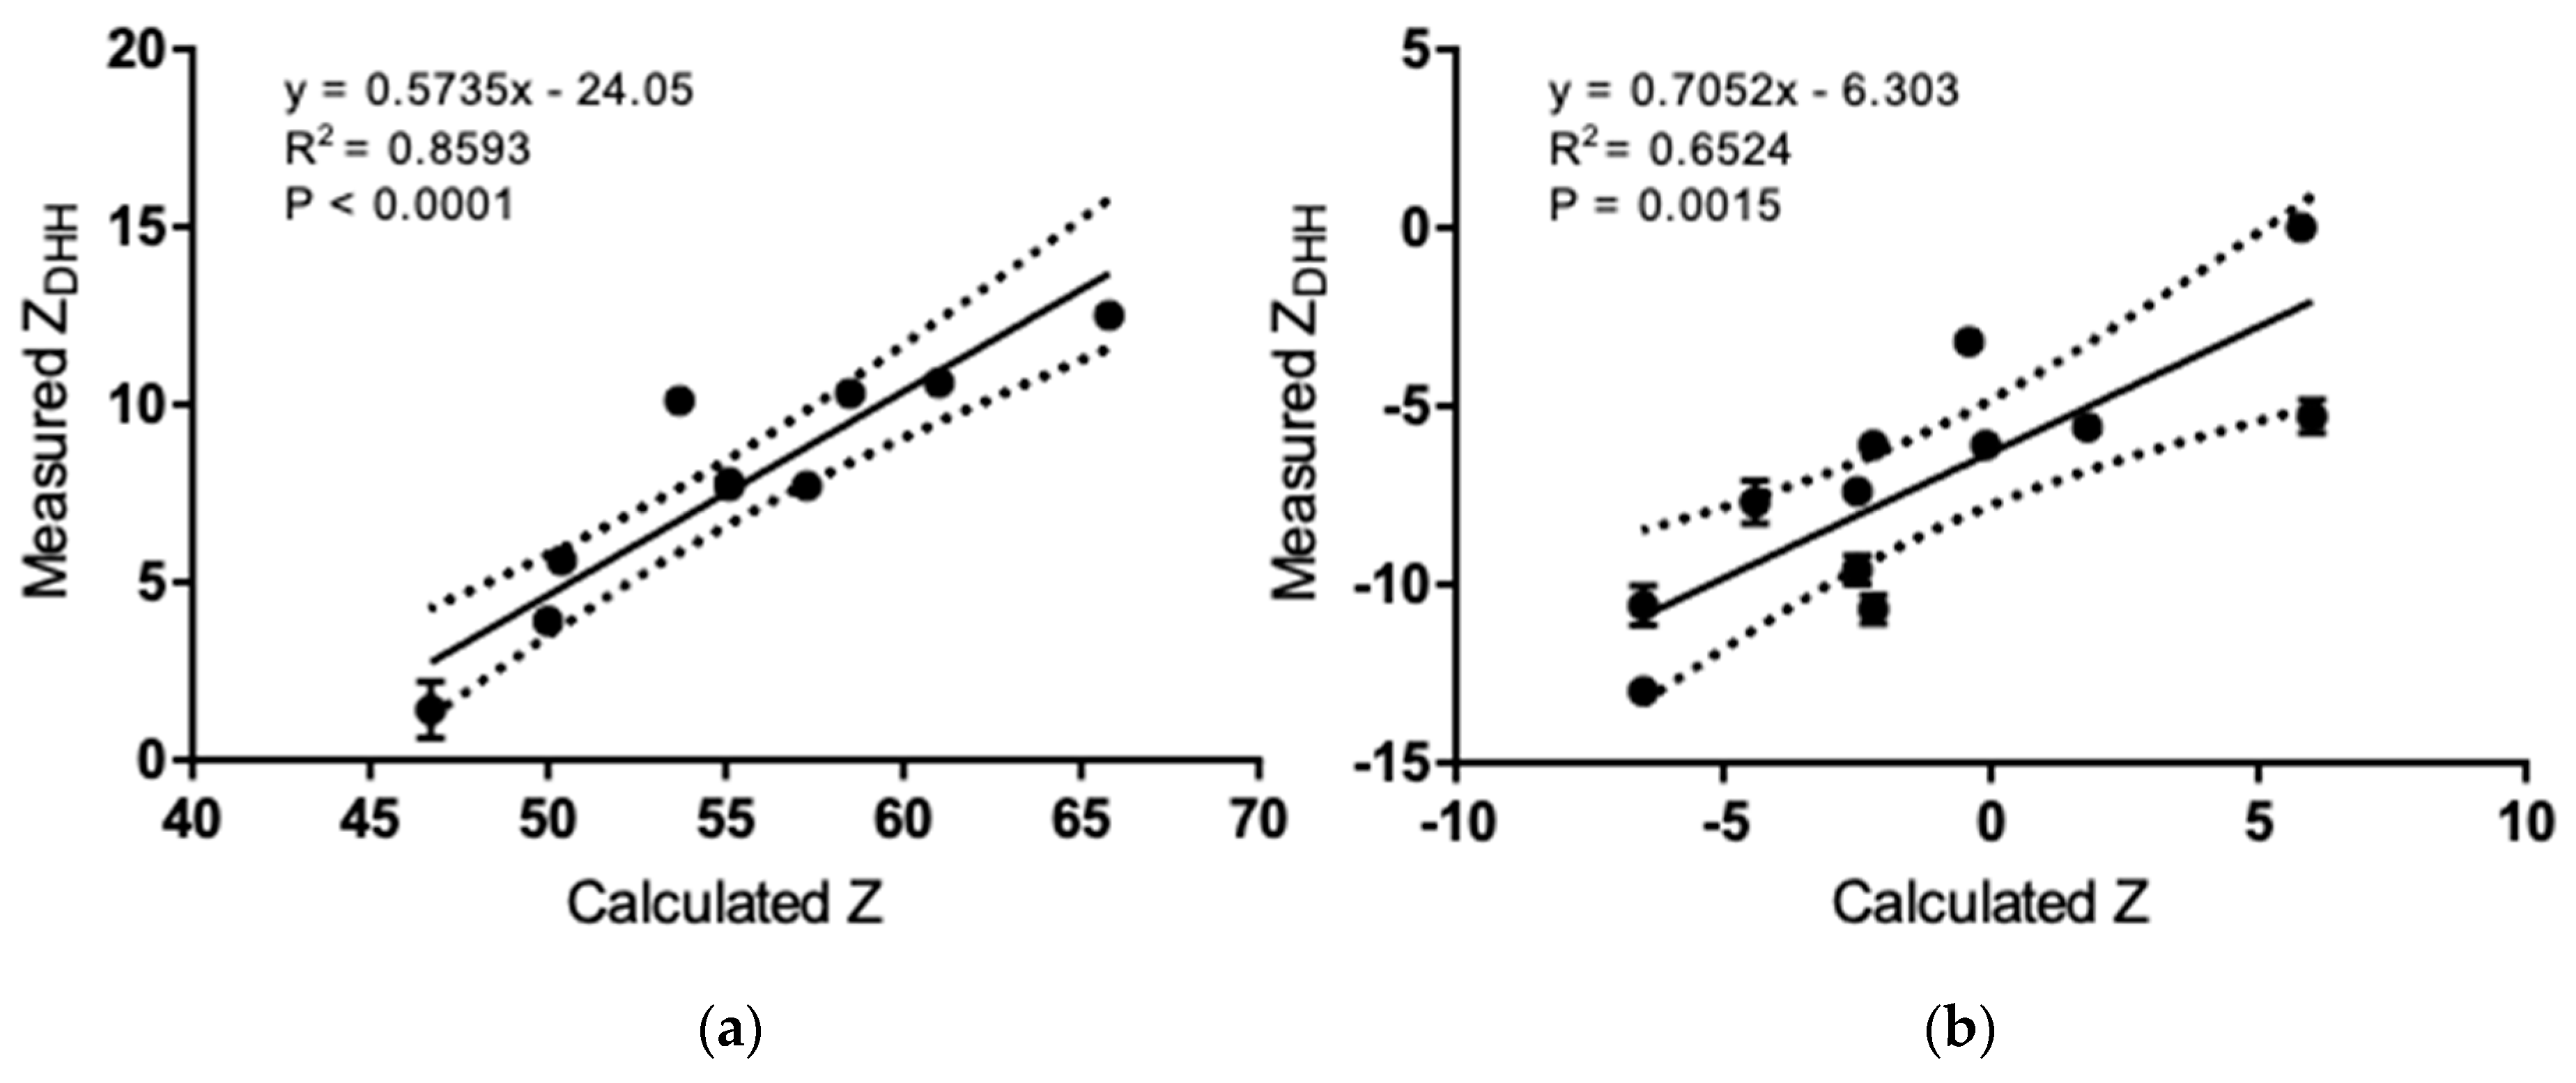
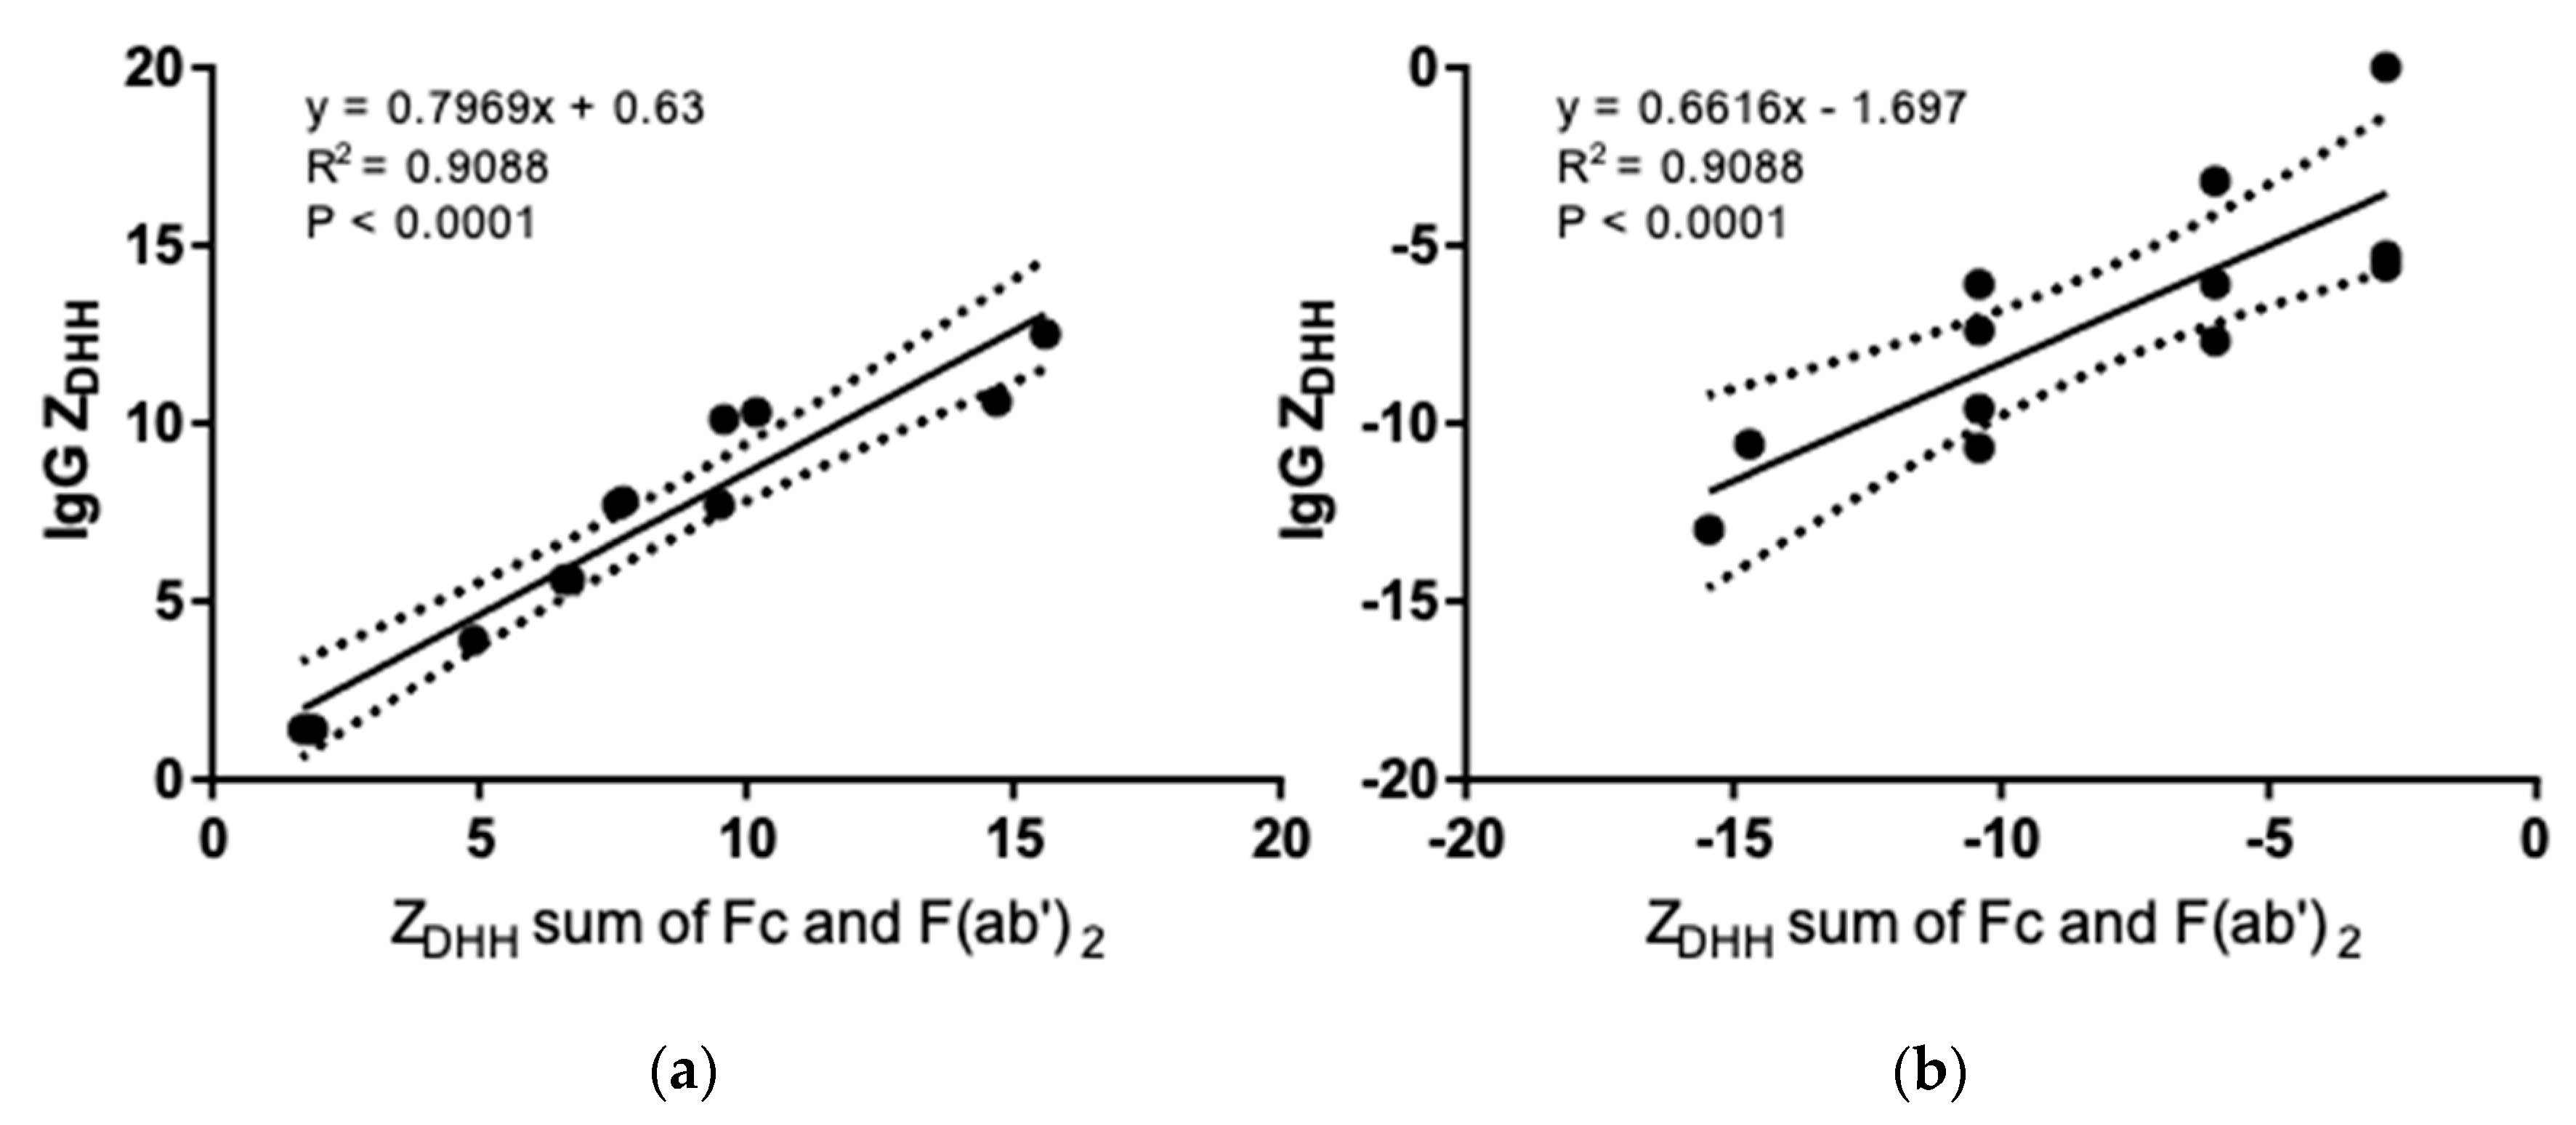
3.3. Net Charge of IgGs and Fragments in Formulation and Physiological Solutions

Using MCE, the electrophoretic mobility was determined for each IgG and its cleaved F(ab’)2 and Fc in pH 5.0 acetate and pH 7.4 PBS as illustrated in Figure 5. By applying the Debye–Hückel approximation to correct for the solvent shielding effects, Henry’s function to correct for electrophoretic effects, and using the sum of the measured protein Stokes radius and its counterion, the ZDHH distribution may be calculated from the electrophoretic mobility (Figure 5, right-hand panels).
Table 4 and Table 5 summarize the ZDHH measurements, as well as the calculated charge, Zcal, in pH 5.0 acetate and pH 7.4 PBS, respectively. A 0 charge was assigned if no boundary formed during electrophoresis regardless of the E field direction or magnitude. In acetate pH 5.0 all IgGs and their fragments are cationic (Table 4). However, in all cases the measured ZDHH is substantially lower than Zcal. In PBS pH 7.4 (Table 5), all intact IgGs are neutral (mAb 2/IgG1) or anionic, despite the fact the Zcal is cationic in some cases. For all mAbs, ZDHH decreases with subclass in the rank order of IgG1 > IgG2 > IgG4.
While ZDHH and Zcal are correlated in either solvent (Figure 6), the slope is about 1/2–3/4 of what would be expected if there were a 1:1 correspondence between the expected H+ uptake/release and ZDHH. These data are consistent with a model in which an anion is bound for every 1.3–2 H+ bound. Similarly, ZDHH for the intact IgGs correlates with the sum of ZDHH from fragments (Figure 7), albeit with a slope that is about ½ of that expected if the charge on the fragments simply summed. We have no mechanism or explanation for the data in Figure 7 and present them here in the hope that they will encourage future work.

4. Discussion

Protein charge is a fundamental property that directly influences its structure, stability, solubility, and ability to interact with other macromolecules [53]. Charge–charge repulsion is important for overcoming the attractive forces that lead to high viscosities in high-concentration protein solutions [54]. Because protein charge can vary with solvent conditions, it is a system property rather than a property of the protein. The systematic analysis of twelve mAbs and their F(ab’)2 and Fc fragments provides several insights into IgG charge and raises several fundamental questions about our understanding of protein charge.
Charge–charge repulsion contributes to thermodynamic nonideality and, consequently, the colloidal stability of protein solutions [12]. It is clear from the data in Table 4 and Table 5 that charge calculations based solely on H+ binding lead to highly inaccurate estimates of IgG charge. Thus, even though there is a correlation between the measured and calculated charge (Figure 6), charge calculations should not be considered reliable. Given its potential importance to colloidal stability, it is important to determine the impact of charge on nonideality.
At low to moderate protein concentrations (<~15 mg/mL), the net sum of all repulsive and attractive interactions is described by the second virial coefficient, B22 or A2. The diffusion interaction parameter, kD, is related to and often used as a stand-in for these quantities [55], with more positive values of kD correlating with more positive values of B22, i.e., greater repulsive interactions. If charge–charge repulsion contributes significantly to nonideality, there should be a positive correlation of charge with kD. Figure 8 shows the correlation of ZDHH with the diffusion interaction parameter, kD. Under formulation conditions (Figure 6, panel a) increasing ZDHH correlates with increased repulsive interaction (i.e., kD becomes more positive). This suggests that charge measurements may be a useful parameter for selecting candidate mAbs for development. It should be noted that it is the effective charge, Zeff, rather than ZDHH, that impacts thermodynamic nonideality [26]. This distinction is important because Zeff includes the contribution of the solvent ions, with Zeff decreasing (i.e., repulsive interactions decreasing) as salt concentration is increased [12]. Because salt diminishes charge–charge interactions, thus reducing colloidal stability, it should be no surprise that most mAbs are manufactured and formulated in low-salt solvents.
While charge does contribute to nonideality under formulation conditions, there is no correlation between ZDHH and kD under physiological conditions (Figure 8b). This result means that it is unfavorable solvent displacement energies that keep mAbs in solution, for all other protein–protein interactions are attractive [56]. Similarly, it is likely that it is the protein solvation shell that dominates the solubility of serum IgG.
One surprising result of our work is that freshly prepared human IgG exhibits a rather narrow ZDHH distribution in physiological solvent (from approximately −10 to −2, Figure 9), even though isoelectric focusing shows that the same sample has species ranging from pI < 4 to pI > 10 [14]. This exact same ZDHH range may be calculated from electrophoretic mobility measurements published 80 years ago [27]. It would seem from these results that IgGs exhibit charge homeostasis. The mechanism for this homeostasis is not clear. None of the mAbs contained anionic carbohydrates (Table 1), so it is not possible to determine whether the addition of, say, sialic acid would result in a more anionic IgG under physiological conditions. Given the narrowness of the human IgG charge distribution under physiological conditions, it seems likely that sialylation contributes specifically to interactions rather than merely impacting the global charge.
Figure 9 shows that most, but not all, of the mAbs in this study exhibit ZDHH that fall in the range for human serum poly IgG. It is not clear whether there are any physiological or medical consequences associated with a mAb ZDHH that falls outside the normal physiological range. Thus, these results are presented in the hopes of stimulating further research.
Since both aggregation and high viscosity are reflections of protein–protein interactions, it would be useful to have a rigorous means of determining whether an IgG (or solvent condition) is good, bad or indifferent. We suggest that the apparent thermodynamic nonideality (dB22-app/dC or dA2-app/dC) might fulfill this need. To calculate A2-app, several quantities are required (see Figure 10 legend), but each of these values are tabulated, easily calculated or readily obtained experimentally. A dimer dissociation constant of 1 mM was used to mimic the attractive interactions in all cases. This value of Kd is at the upper range of what has been found experimentally [13,15]. If stronger attractive interactions are used (e.g., 300 μM rather than 1 mM), the range where interactions are net attractive is more extensive. A more complete report on determining and using this interaction parameter is being developed.

5. Conclusions

Charge is a fundamental property of antibodies and is important in providing colloidally stable mAb solutions during their development, manufacture and formulation. At this time, protein charge cannot be calculated with any accuracy even using the most detailed structural information and the most sophisticated algorithms. Protein charge, however, is readily measured with accuracy and precision. In this first systematic and comprehensive examination of the charge on IgGs it is clear that: (1) IgGs exhibit charge homeostasis in physiological solvent, (2) they appear to bind significant quantities of anions, (3) anion binding will contribute to the desolvation energy, thus preventing IgG aggregation, (4) mAb charge measurements may be useful in selecting candidate molecules for development and (5) mAb charge measurements under physiological conditions may be useful in determining whether a candidate molecule falls within the normal range for human IgGs.

Author Contributions

Conceptualization, D.Y., T.L., S.S., and R.K.-B.; Methodology, T.L. and D.Y.; Analysis, D.Y. T.L.; Investigation, D.Y.; Resources, R.K.-B.; Writing—Original Draft Preparation, D.Y. and T.L.; Writing—Review and Editing, R.K.-B. and S.S.; Supervision, R.K.-B. and T.L.; Project Administration, R.K.-B. and T.L.; Funding Acquisition, R.K.-B.

Funding

This research was funded by Boehringer-Ingelheim.

Acknowledgments

The authors wish to thank Boehringer-Ingelheim for supporting the doctorate research of Danlin Yang, a portion of which is published here. Special thanks to her Ph.D. committee members, David Hayes and Christopher Roberts, who encouraged this work and offered helpful advice. We also are thankful for the encouragement and interest expressed by the members of the Biomolecular Interactions Technology Center (BITC). This paper is dedicated to the memory of Eric and Betty Laue.

Conflicts of Interest

The authors declare no conflict of interest. The funders had no role in the design of the study; in the collection, analyses, or interpretation of data; in the writing of the manuscript, or in the decision to publish the results. D.Y. and S.S. were employed by Boehringer Ingelheim Pharmaceuticals at the time of this research, they are now employed by Janssen Biotherapeutics. R.K-B. is employed by Boehringer Ingelheim Pharmaceuticals. T.L. was employed by the University of New Hampshire at the time of this research and now is retired from that institution.

References

  1. Cohn, E.J. Studies in the physical chemistry of the proteins: I. The solubility of certain proteins at their isoelectric points. J. Gen. Physiol. 1922, 4, 697–722. [Google Scholar] [CrossRef] [PubMed]
  2. Raut, A.S.; Kalonia, D.S. Opalescence in Monoclonal Antibody Solutions and Its Correlation with Intermolecular Interactions in Dilute and Concentrated Solutions. J. Pharm. Sci. 2015, 104, 1263–1274. [Google Scholar] [CrossRef]
  3. Shire, S.J.; Shahrokh, Z.; Liu, J. Challenges in the development of high protein concentration formulations. J. Pharm. Sci. 2004, 93, 1390–1402. [Google Scholar] [CrossRef] [PubMed]
  4. Li, L.; Kumar, S.; Buck, P.M.; Burns, C.; Lavoie, J.; Singh, S.K.; Warne, N.W.; Nichols, P.; Luksha, N.; Boardman, D. Concentration dependent viscosity of monoclonal antibody solutions: Explaining experimental behavior in terms of molecular properties. Pharm. Res. 2014, 31, 3161–3178. [Google Scholar] [CrossRef] [PubMed]
  5. Yadav, S.; Laue, T.M.; Kalonia, D.S.; Singh, S.N.; Shire, S.J. The Influence of Charge Distribution on Self-Association and Viscosity Behavior of Monoclonal Antibody Solutions. Mol. Pharm. 2012, 9, 791–802. [Google Scholar] [CrossRef] [PubMed]
  6. Chi, E.Y.; Krishnan, S.; Randolph, T.W.; Carpenter, J.F. Physical stability of proteins in aqueous solution: Mechanism and driving forces in nonnative protein aggregation. Pharm. Res. 2003, 20, 1325–1336. [Google Scholar] [CrossRef] [PubMed]
  7. Neergaard, M.S.; Kalonia, D.S.; Parshad, H.; Nielsen, A.D.; Møller, E.H.; van de Weert, M. Viscosity of high concentration protein formulations of monoclonal antibodies of the IgG1 and IgG4 subclass—Prediction of viscosity through protein–protein interaction measurements. Eur. J. Pharm. Sci. 2013, 49, 400–410. [Google Scholar] [CrossRef] [PubMed]
  8. Pindrus, M.A.; Shire, S.J.; Yadav, S.; Kalonia, D.S. The Effect of Low Ionic Strength on Diffusion and Viscosity of Monoclonal Antibodies. Mol. Pharm. 2018, 15, 3133–3142. [Google Scholar] [CrossRef]
  9. Singh, S.N.; Yadav, S.; Shire, S.J.; Kalonia, D.S. Dipole-Dipole Interaction in Antibody Solutions: Correlation with Viscosity Behavior at High Concentration. Pharm. Res. 2014, 31, 2549–2558. [Google Scholar] [CrossRef]
  10. Olsen, S.N.; Andersen, K.B.; Randolph, T.W.; Carpenter, J.F.; Westh, P. Role of electrostatic repulsion on colloidal stability of Bacillus halmapalus alpha-amylase. Biochim. Biophys. Acta 2009, 1794, 1058–1065. [Google Scholar] [CrossRef]
  11. Connolly, B.D.; Petry, C.; Yadav, S.; Demeule, B.; Ciaccio, N.; Moore, J.M.R.; Shire, S.J.; Gokarn, Y.R. Weak Interactions Govern the Viscosity of Concentrated Antibody Solutions: High-Throughput Analysis Using the Diffusion Interaction Parameter. Biophys. J. 2012, 103, 69–78. [Google Scholar] [CrossRef] [Green Version]
  12. Tanford, C. Physical Chemistry of Macromolecules, 1st ed.; John Wiley & Sons Inc.: New York, NY, USA, 1961; ISBN 978-0-471-84447-1. [Google Scholar]
  13. Wright, R.T.; Hayes, D.B.; Stafford, W.F.; Sherwood, P.J.; Correia, J.J. Characterization of therapeutic antibodies in the presence of human serum proteins by AU-FDS analytical ultracentrifugation. Anal. Biochem. 2018, 550, 72–83. [Google Scholar] [CrossRef] [PubMed]
  14. Yang, D.; Correia, J.J.; Iii, W.F.S.; Roberts, C.J.; Singh, S.; Hayes, D.; Kroe-Barrett, R.; Nixon, A.; Laue, T.M. Weak IgG self- and hetero-association characterized by fluorescence analytical ultracentrifugation. Protein Sci. 2018, 27, 1334–1348. [Google Scholar] [CrossRef] [PubMed]
  15. Hopkins, M.M.; Lambert, C.L.; Bee, J.S.; Parupudi, A.; Bain, D.L. Determination of Interaction Parameters for Reversibly Self-Associating Antibodies: A Comparative Analysis. J. Pharm. Sci. 2018, 107, 1820–1830. [Google Scholar] [CrossRef] [PubMed]
  16. Kelly, R.L.; Yu, Y.; Sun, T.; Caffry, I.; Lynaugh, H.; Brown, M.; Jain, T.; Xu, Y.; Wittrup, K.D. Target-independent variable region mediated effects on antibody clearance can be FcRn independent. mAbs 2016, 8, 1269–1275. [Google Scholar] [CrossRef] [PubMed] [Green Version]
  17. Leipold, D.; Prabhu, S. Pharmacokinetic and pharmacodynamic considerations in the design of therapeutic antibodies. Clin. Transl. Sci. 2018. [Google Scholar] [CrossRef]
  18. Bas, M.; Terrier, A.; Jacque, E.; Dehenne, A.; Pochet-Béghin, V.; Beghin, C.; Dezetter, A.-S.; Dupont, G.; Engrand, A.; Beaufils, B.; et al. Fc Sialylation Prolongs Serum Half-Life of Therapeutic Antibodies. J. Immunol. 2019, 202, 1582–1594. [Google Scholar] [CrossRef]
  19. Boswell, C.A.; Tesar, D.B.; Mukhyala, K.; Theil, F.-P.; Fielder, P.J.; Khawli, L.A. Effects of charge on antibody tissue distribution and pharmacokinetics. Bioconjug. Chem. 2010, 21, 2153–2163. [Google Scholar] [CrossRef]
  20. Igawa, T.; Tsunoda, H.; Tachibana, T.; Maeda, A.; Mimoto, F.; Moriyama, C.; Nanami, M.; Sekimori, Y.; Nabuchi, Y.; Aso, Y.; et al. Reduced elimination of IgG antibodies by engineering the variable region. Protein Eng. Des. Select. 2010, 23, 385–392. [Google Scholar] [CrossRef] [Green Version]
  21. Hintersteiner, B.; Lingg, N.; Janzek, E.; Mutschlechner, O.; Loibner, H.; Jungbauer, A. Microheterogeneity of therapeutic monoclonal antibodies is governed by changes in the surface charge of the protein. Biotechnol. J. 2016, 11, 1617–1627. [Google Scholar] [CrossRef] [Green Version]
  22. Hintersteiner, B.; Lingg, N.; Zhang, P.; Woen, S.; Hoi, K.M.; Stranner, S.; Wiederkum, S.; Mutschlechner, O.; Schuster, M.; Loibner, H.; et al. Charge heterogeneity: Basic antibody charge variants with increased binding to Fc receptors. mAbs 2016, 8, 1548–1560. [Google Scholar] [CrossRef]
  23. Zhang, G.; Massaad, C.A.; Gao, T.; Pillai, L.; Bogdanova, N.; Ghauri, S.; Sheikh, K.A. Sialylated intravenous immunoglobulin suppress anti-ganglioside antibody mediated nerve injury. Exp. Neurol. 2016, 282, 49–55. [Google Scholar] [CrossRef] [Green Version]
  24. Lardinois, O.M.; Deterding, L.J.; Hess, J.J.; Poulton, C.J.; Henderson, C.D.; Jennette, J.C.; Nachman, P.H.; Falk, R.J. Immunoglobulins G from patients with ANCA-associated vasculitis are atypically glycosylated in both the Fc and Fab regions and the relation to disease activity. PLoS ONE 2019, 14, e0213215. [Google Scholar] [CrossRef] [PubMed]
  25. Goyon, A.; Excoffier, M.; Janin-Bussat, M.-C.; Bobaly, B.; Fekete, S.; Guillarme, D.; Beck, A. Determination of isoelectric points and relative charge variants of 23 therapeutic monoclonal antibodies. J. Chromatogr. B 2017, 1065–1066, 119–128. [Google Scholar] [CrossRef]
  26. Filoti, D.I.; Shire, S.J.; Yadav, S.; Laue, T.M. Comparative study of analytical techniques for determining protein charge. J. Pharm. Sci. 2015, 104, 2123–2131. [Google Scholar] [CrossRef]
  27. Tiselius, A.; Kabat, E.A. An electrophoretic study of immune sera and purified antibody preparations. J. Exp. Med. 1939, 69, 119–131. [Google Scholar] [CrossRef]
  28. Tiselius, A.; Kabat, E.A. Electrophoresis of Immune Serum. Science 1938, 87, 416–417. [Google Scholar] [CrossRef]
  29. Mathews, C.K.; van Holde, K.E.; Appling, D.R.; Anthony-Cahill, S.J. Biochemistry, 4th ed.; Pearson: Toronto, ON, Canada, 2012; ISBN 978-0-13-800464-4. [Google Scholar]
  30. Moody, T.P.; Kingsbury, J.S.; Durant, J.A.; Wilson, T.J.; Chase, S.F.; Laue, T.M. Valence and anion binding of bovine ribonuclease A between pH 6 and 8. Anal. Biochem. 2005, 336, 243–252. [Google Scholar] [CrossRef]
  31. Her, C.; Filoti, D.I.; McLean, M.A.; Sligar, S.G.; Alexander Ross, J.B.; Steele, H.; Laue, T.M. The Charge Properties of Phospholipid Nanodiscs. Biophys. J. 2016, 111, 989–998. [Google Scholar] [CrossRef] [Green Version]
  32. Ridgeway, T.M.; Hayes, D.B.; Moody, T.P.; Wilson, T.J.; Anderson, A.L.; Levasseur, J.H.; Demaine, P.D.; Kenty, B.E.; Laue, T.M. An apparatus for membrane-confined analytical electrophoresis. Electrophoresis 1998, 19, 1611–1619. [Google Scholar] [CrossRef]
  33. Laue, T.M.; Shepard, H.K.; Ridgeway, T.M.; Moody, T.P.; Wilson, T.J. Membrane-confined analytical electrophoresis. Methods Enzymol. 1998, 295, 494–518. [Google Scholar] [PubMed]
  34. Kyne, C.; Jordon, K.; Filoti, D.I.; Laue, T.M.; Crowley, P.B. Protein charge determination and implications for interactions in cell extracts. Protein Sci. Publ. Protein Soc. 2017, 26, 258–267. [Google Scholar] [CrossRef] [PubMed]
  35. Moody, T.P.; Shepard, H.K. Nonequilibrium thermodynamics of membrane-confined electrophoresis. Biophys. Chem. 2004, 108, 51–76. [Google Scholar] [CrossRef]
  36. Edsall, J.T.; Wyman, J. Chapter 9—Polybasic Acids, Bases, and Ampholytes, Including Proteins. In Biophysical Chemistry; Edsall, J.T., Wyman, J., Eds.; Academic Press: Cambridge, MA, USA, 1958; pp. 477–549. ISBN 978-1-4832-2946-1. [Google Scholar]
  37. Pace, C.N.; Grimsley, G.R.; Scholtz, J.M. Protein ionizable groups: pK values and their contribution to protein stability and solubility. J. Biol. Chem. 2009, 284, 13285–13289. [Google Scholar] [CrossRef]
  38. Gokarn, Y.R.; Fesinmeyer, R.M.; Saluja, A.; Razinkov, V.; Chase, S.F.; Laue, T.M.; Brems, D.N. Effective charge measurements reveal selective and preferential accumulation of anions, but not cations, at the protein surface in dilute salt solutions: Effective Charge Measurements Reveal Direct Anion-Protein Interactions. Protein Sci. 2011, 20, 580–587. [Google Scholar] [CrossRef] [PubMed]
  39. Kukić, P.; Nielsen, J.E. Electrostatics in proteins and protein-ligand complexes. Future Med. Chem. 2010, 2, 647–666. [Google Scholar] [CrossRef] [PubMed]
  40. Kumar, S.; Nussinov, R. Close-range electrostatic interactions in proteins. Chembiochem 2002, 3, 604–617. [Google Scholar] [CrossRef]
  41. Shi, C.; Wallace, J.A.; Shen, J.K. Thermodynamic Coupling of Protonation and Conformational Equilibria in Proteins: Theory and Simulation. Biophys. J. 2012, 102, 1590–1597. [Google Scholar] [CrossRef] [Green Version]
  42. Swails, J.M.; York, D.M.; Roitberg, A.E. Constant pH Replica Exchange Molecular Dynamics in Explicit Solvent Using Discrete Protonation States: Implementation, Testing, and Validation. J. Chem. Theory Comput. 2014, 10, 1341–1352. [Google Scholar] [CrossRef]
  43. Oliveira, A.S.F.; Campos, S.R.R.; Baptista, A.M.; Soares, C.M. Coupling between protonation and conformation in cytochrome c oxidase: Insights from constant-pH MD simulations. Biochim. Biophys. Acta BBA Bioenergy 2016, 1857, 759–771. [Google Scholar] [CrossRef]
  44. Harding, S.E.; Horton, J.C.; Jones, S.; Thornton, J.M.; Winzor, D.J. COVOL: An Interactive Program for Evaluating Second Virial Coefficients from the Triaxial Shape or Dimensions of Rigid Macromolecules. Biophys. J. 1999, 76, 2432–2438. [Google Scholar] [CrossRef] [Green Version]
  45. Collins, K.D.; Neilson, G.W.; Enderby, J.E. Ions in water: Characterizing the forces that control chemical processes and biological structure. Biophys. Chem. 2007, 128, 95–104. [Google Scholar] [CrossRef] [PubMed]
  46. Miao, L.; Qin, H.; Koehl, P.; Song, J. Selective and specific ion binding on proteins at physiologically-relevant concentrations. FEBS Lett. 2011, 585, 3126–3132. [Google Scholar] [CrossRef] [PubMed] [Green Version]
  47. Harlow, E.; Lane, D.P. Antibodies: A Laboratory Manual, 1st ed.; Cold Spring Harbor Laboratory Press: Cold Spring Harbor, NY, USA, 1988; ISBN 978-0-87969-314-5. [Google Scholar]
  48. Stafford, W.F.; Braswell, E.H. Sedimentation velocity, multi-speed method for analyzing polydisperse solutions. Biophys. Chem. 2004, 108, 273–279. [Google Scholar] [CrossRef] [PubMed]
  49. Bjellqvist, B.; Ek, K.; Giorgio Righetti, P.; Gianazza, E.; Görg, A.; Westermeier, R.; Postel, W. Isoelectric focusing in immobilized pH gradients: Principle, methodology and some applications. J. Biochem. Biophys. Methods 1982, 6, 317–339. [Google Scholar] [CrossRef]
  50. Mao, Q.; Pawliszyn, J. Capillary isoelectric focusing with whole column imaging detection for analysis of proteins and peptides. J. Biochem. Biophys. Methods 1999, 39, 93–110. [Google Scholar] [CrossRef]
  51. Hayes, D.; Laue, T.; Philo, J. Program Sednterp: Sedimentation Interpretation Program, version 1.09; Alliance Protein Laboratories: Thousand Oaks, CA, USA, 1995. [Google Scholar]
  52. Edsall, J.T.; Wyman, J. Biophysical Chemistry; Academic Press: New York, NY, USA, 1958; ISBN 978-0-12-232201-3. [Google Scholar]
  53. Laue, T. Charge matters. Biophys. Rev. 2016, 8, 287–289. [Google Scholar] [CrossRef] [Green Version]
  54. Tomar, D.S.; Kumar, S.; Singh, S.K.; Goswami, S.; Li, L. Molecular basis of high viscosity in concentrated antibody solutions: Strategies for high concentration drug product development. mAbs 2016, 8, 216–228. [Google Scholar] [CrossRef] [Green Version]
  55. Saluja, A.; Fesinmeyer, R.M.; Hogan, S.; Brems, D.N.; Gokarn, Y.R. Diffusion and sedimentation interaction parameters for measuring the second virial coefficient and their utility as predictors of protein aggregation. Biophys. J. 2010, 99, 2657–2665. [Google Scholar] [CrossRef]
  56. Laue, T. Proximity energies: A framework for understanding concentrated solutions. J. Mol. Recognit. JMR 2012, 25, 165–173. [Google Scholar] [CrossRef]
Figure 1. Sedimentation velocity analysis of IgG subclasses from mAb1, mAb2, and mAb3 in (a) pH 5.0 acetate (red) and (b) pH 7.4 PBS (blue) solutions. Normalized g(s*) sedimentation distributions are obtained from IgG1 (solid line), IgG2 (dotted line), IgG4 (dashed line), and IgG4Pro (dot-dashed line) in both buffers. The curves are superimposed on each other in both panels.
Antibodies 08 00024 g001
Figure 2. Sedimentation velocity analysis of IgG1, IgG2, and IgG4 cleaved (a) Fc and (b) F(ab’)2 from mAb 1 in pH 5.0 acetate. Normalized g(s*) sedimentation distributions obtained with the concentration of 0.5 mg/mL (red), 0.167 mg/mL (blue), and 0.056 mg/mL (green). The graph for IgG4Pro F(ab)’2 is not shown because it is indistinguishable from IgG4. Refer to text for the sw values.
Antibodies 08 00024 g002
Figure 3. Electrophoretogram image of mAb1 IgG1. The peaks to the left and to the right of the main peak indicates acidic and basic charge variant, respectively.
Antibodies 08 00024 g003
Figure 4. Linear regression analysis and correlation between experimental pI as measured by icIEF and theoretical pI calculated from the IgG sequence. Dotted lines indicate the 95% confidence interval.
Antibodies 08 00024 g004
Figure 5. ZDHH determination of IgG, F(ab’)2, and Fc by Membrane-Confined Electrophoresis (MCE) in pH 5.0 acetate. (a) Raw MCE scans over time during electrophoresis. The data (left panel) shows the light intensity (I, vertical axis) as a function of the distance moved from the membrane (cm, horizontal). Time difference curves (ΔI/Δt) are calculated from data between the green and red highlighted scans. The electrophoretic mobility distribution is calculated from distance moved from the membrane, x, divided by the product of the electric field, E, and average elapsed time for the middle scan t, μ = x E · t ¯ . (b) The vertical axis shows the time derivative (ΔI/Δt) of the intensity data in panel (a) as a function of ZDHH (horizontal axis). ZDHH was calculated from the mobility using T = 20 °C; viscosity = 0.98 cp; conductance = 16.8 mS; E = −19.8 V/cm, D = 78; counterion radius, 0.18 nm; Stokes radius, 5.5 nm. The peak ZDHH position is displayed above the curve.
Antibodies 08 00024 g005
Figure 6. Linear regression analysis and correlation between experimental ZDHH measured by MCE and theoretical Z calculated from the IgG sequence. (a) pH 5.0 acetate. (b) pH 7.4 PBS. Dotted lines indicate the 95% confidence interval.
Antibodies 08 00024 g006
Figure 7. Linear regression analysis and correlation between ZDHH measured from intact IgG and the sum of ZDHH from the fragments. (a) pH 5.0 acetate. (b) pH 7.4 PBS. Dotted lines indicate the 95% confidence interval.
Antibodies 08 00024 g007
Figure 8. Linear regression analysis and correlation between ZDHH measured for intact IgG and the concentration-dependence of the diffusion coefficient, kD. (a) pH 5.0, acetate buffer, (b) pH 7.4 PBS. Dotted lines indicate the 95% confidence interval.
Antibodies 08 00024 g008
Figure 9. ZDHH distribution for freshly prepared human IgG in DPBS. ZDHH was calculated for T = 20 °C, viscosity = 0.98 cp, electric field = −14.88 V/cm, ionic strength = 0.167 M, conductivity = 16.6 ms, protein radius = 5.5 nm, counterion radius = 0.18 nm, D = 78. The ZDHH for the twelve intact IgGs in this study are noted (inverted triangles) along with bars indicating the measurement uncertainty.
Antibodies 08 00024 g009
Figure 10. Protein–protein-interaction parameter dA2-app/dC for pH 5 and pH 7.4 data. Note the concentrations are present in g/mL (cgs units) in order to be consistent with the derivation of the equations [12], and correspond to a concentration range of 0–20 mg/mL. The parameters used to generate these curves are: M1 = 150,000 g/mole, hydrated radius 4.39 nm, hydration 0.3 g-H2O/g-protein, axial ratio 5, monomer–dimer Kd 1 × 10³ M, protein partial specific volume = 0.73 mL/g, solvent partial specific volume 0.993 mL/g, temperature 20 °C, and solvent density 1.0 g/mL. The salt concentration for pH 5 was set to 60 mMolal, and for pH 7.4 to 150 mMolal. For either condition, curves for the mAbs having the lowest ZDHH (dashed lines) and highest ZDHH (solid lines) are shown. For pH 7.4, a curve for human poly IgG (dash-dot) is shown. The horizontal dotted line at 0 corresponds to ideal conditions, with values less than zero corresponding to net attraction and greater than 0 to net repulsion.
Antibodies 08 00024 g010
Table 1. Evaluation of IgG quality.
IDSubclassMonomer (%)Mass (Da)Glycoform Level (%) *
G0F
Antibodies 08 00024 i001
G1F
Antibodies 08 00024 i002
G2F
Antibodies 08 00024 i003
mAb 1IgG1>99148,48049438
IgG2>99147,91352399
IgG4>99148,190453916
IgG4Pro>99148,210434017
mAb 2IgG1>99148,301454213
IgG2>99147,73450419
IgG4>99148,012434314
IgG4Pro>99148,032205030
mAb 3IgG1>99149,959305218
IgG2>99149,231454114
IgG4>99149,50749438
IgG4Pro>99149,529255225
* N-acetylglucosamine ; mannose ; galactose ; Antibodies 08 00024 i004 fucose.
Table 2. Quality of IgG fragments from IdeS digestion.
SubclassV RegionCleaved SiteF(ab’)2 Purity (%)Fc Purity (%)
IgG1mAb 1CPPCPAPELLG/GPSVF95100
mAb 2100
mAb 3100
IgG2mAb 1CPPCPAPPVA/GPSVF10098
mAb 2100
mAb 3100
IgG4mAb 1CPSCPAPELLG/GPSVF9597 *
mAb 295
mAb 397
IgG4PromAb 1CPPCPAPELLG/GPSVF97
mAb 210097 *
mAb 3100
* The cleaved Fc is identical between IgG4Pro and IgG4 because the enzymatic digest occurred below the hinge region.
Table 3. Measured and calculated pI values of IgG.
IDSubclasspIcalpIicIEF
Acidic PeakMain PeakBasic Peak
mAb 1IgG17.77.98.18.2
IgG26.96.97.07.3
IgG46.66.26.36.5
IgG4Pro6.66.26.36.5
mAb 2IgG18.28.28.48.6
IgG27.37.98.08.2
IgG47.07.47.67.7
IgG4Pro7.07.47.67.7
mAb 3IgG18.28.28.48.6
IgG27.47.28.08.1
IgG47.17.57.77.8
IgG4Pro7.17.57.77.8
Table 4. Measured and calculated Z values of IgG, F(ab’)2, and Fc in pH 5.0 acetate.
IDSubclassIgGF(ab’)2Fc *
ZDHHZcalZDHHZcalZDHHZcal
mAb 1IgG17.7 ± 0.257.33.3 ± 0.231.26.2 ± 0.126.30
IgG23.9 ± 0.150.0025.94.9 ± 0.124.30
IgG41.4 ± 0.246.71.3 ± 0.127.90.45 ± 0.118.98
IgG4Pro1.4 ± 0.846.71.5 ± 0.227.90.45 ± 0.118.98
mAb 2IgG110.6 ± 0.161.08.6 ± 0.234.96.2 ± 0.126.30
IgG210.1 ± 0.253.74.7 ± 0.129.64.9 ± 0.124.30
IgG45.6 ± 0.250.46.2 ± 0.131.60.45 ± 0.118.98
IgG4Pro5.6 ± 0.250.46.2 ± 0.131.60.45 ± 0.118.98
mAb 3IgG112.5 ± 0.165.89.4 ± 0.139.66.2 ± 0.126.30
IgG210.3 ± 0.258.55.3 ± 0.234.34.9 ± 0.124.30
IgG47.7 ± 0.255.17.1 ± 0.136.30.45 ± 0.118.98
IgG4Pro7.8 ± 0.255.17.3 ± 0.136.30.45 ± 0.118.98
* The value from each subclass is identical across the mAb set because it was measured on pooled Fc samples from the three mAb digestions.
Table 5. Measured and calculated Z values of IgG, F(ab’)2, and Fc in pH 7.4 PBS.
IDSubclassIgGF(ab’)2Fc *
ZDHHZcalZDHHZcalZDHHZcal
mAb 1IgG1−5.6 ± 0.11.80−0.48−2.8 ± 0.11.50
IgG2−7.7 ± 0.6−4.40−4.59−6.0 ± 0.6−0.48
IgG4−10.6 ± 0.5−6.5−4.3 ± 0.8−2.61−10.4 ± 0.3−4.60
IgG4Pro−13 ± 0.3−6.5−5.05 ± 0.5−2.61−10.4 ± 0.3−4.60
mAb 2IgG105.803.5−2.8 ± 0.11.50
IgG2−3.2 ± 0.2−0.40−0.61−6.0 ± 0.6−0.48
IgG4−7.4 ± 0.2−2.501.38−10.4 ± 0.3−4.60
IgG4Pro−9.6 ± 0.4−2.501.38−10.4 ± 0.3−4.60
mAb 3IgG1−5.3 ± 0.56.003.45−2.8 ± 0.11.50
IgG2−6.1 ± 0.3−0.10−0.36−6.0 ± 0.6−0.48
IgG4−6.1 ± 0.2−2.201.63−10.4 ± 0.3−4.60
IgG4Pro−10.7 ± 0.4−2.201.63−10.4 ± 0.3−4.60
* The value from each subclass is identical across the mAb set because it was measured on pooled Fc samples from the three mAb digestions.

