Article

A Decision Support Tool for Evaluating GHG Mitigation Measures in Land Use Sectors

1
Circular Bioeconomy Research Group, Latvia University of Life Sciences and Technologies, Svetes Street 18, LV-3001 Jelgava, Latvia
2
Scientific Laboratory of Forest and Water Resources, Latvia University of Life Sciences and Technologies, J.Cakstes Boulevard 5, LV-3001 Jelgava, Latvia
3
Institute of Forestry, Latvia University of Life Sciences and Technologies, Akademijas Street 11, LV-3001 Jelgava, Latvia
*
Author to whom correspondence should be addressed.
Land 2026, 15(5), 758; https://doi.org/10.3390/land15050758
Submission received: 17 March 2026 / Revised: 21 April 2026 / Accepted: 23 April 2026 / Published: 29 April 2026
(This article belongs to the Section Land Socio-Economic and Political Issues)

Abstract

Sustainable land use policy planning requires integrated approaches that account for environmental and socio-economic trade-offs of greenhouse gas (GHG) mitigation measures. This study presents a spatial decision-support tool developed to support the evaluation of policy scenarios in non-urban land-use sectors, with application to the land use, land-use change, and forestry (LULUCF) sector in Latvia. The tool enables users to select predefined mitigation measures, apply spatial selection criteria, and generate quantitative and spatially explicit outputs. In addition to estimating GHG mitigation potential, it evaluates impacts on profitability, employment, and habitat quality, allowing the assessment of trade-offs and synergies across multiple dimensions. Scenario results are reported as both absolute and relative impacts, improving transparency and comparability. Developed in Python 3.10 and supported by a PostgreSQL 17/PostGIS 3.5 database, the tool operates through a web-based interface and supports efficient scenario construction and evaluation. While results depend on underlying data and assumptions, the tool provides a transparent framework for exploring policy options and supports evidence-based decision-making in land-use and climate policy planning.

1. Introduction

Land use has a significant impact on net CO2 emissions [1,2]. Depending on how land is managed, it can either release CO2 into the atmosphere (as a source) or remove and store it (as a sink). Studies show that sustainable land management, such as reforestation, agroforestry, improved soil management, and reduced deforestation, can reduce emissions and contribute to turning land into a net carbon sink [3,4].
Accurate monitoring of progress towards climate goals requires the integration of land use emissions into comprehensive greenhouse gas (GHG) accounting systems, which improves transparency and supports better decision-making [5]. This is especially relevant in the context of international and regional commitments, such as the Paris Agreement, which sets the goal of limiting global warming to well below 2 °C [6], and the European Green Deal, which aims to achieve climate neutrality in Europe by 2050 and includes binding GHG reduction targets [7]. At the national level, National Energy and Climate Plans (NECPs) define how each EU Member State contributes to these shared goals. Land use, land-use change, and forestry (LULUCF) are increasingly recognised as key sectors in these plans, both for emissions reduction and for carbon sequestration [8,9].
Given the growing risks posed by climate change to ecosystems, public health, and socio-economic stability [10], the alignment of land-use policies with relevant policy frameworks has gained increasing importance [11,12]. Decision-support systems play a key role in facilitating their implementation by addressing sector-specific needs across multiple governance levels [13,14].
This is especially important in agriculture and forestry, where multiple stakeholders must collaborate and balance environmental and economic objectives [15,16,17,18,19]. User-centered decision-support systems are increasingly considered best practice because they improve accessibility for decision-makers who may lack technical expertise, while modular architectures allow adaptation to different ecological and policy contexts [20,21,22,23].
A number of decision-support systems have been developed in recent years to assist sustainable land use planning and environmental policy implementation. Notable examples include MapX, LANDSUPPORT, SmartScape, and the New Zealand Agricultural DSS, which integrate geospatial data, scenario modelling, and interactive visualisation within modular, often open-source, architectures [17,24,25,26]. Comparable GIS-based, multi-criteria frameworks for land-use decision-making have also been demonstrated in regional and municipal applications, including the Spanish case study by Hernández and Camerin (2023) and geomatics-based land suitability modelling for large-scale development, highlighting the value of transferable methodologies that integrate high-resolution environmental data into land-use decision-making [27,28]. Despite their diverse objectives and technical designs, these systems share common features such as the separation of data management, processing, and visualisation layers, as well as the adoption of open geospatial standards like Web Map Service (WMS) to enhance interoperability. Widely used spatial databases, particularly PostgreSQL with the PostGIS extension, provide the backbone for vector data management, while advanced platforms such as LANDSUPPORT incorporate additional technologies (e.g., rasdaman) for handling large raster datasets. Frameworks such as R Shiny have further enabled dynamic dashboards and statistical outputs, although scalability challenges remain for large-scale or multi-user applications. Recent efforts to address these limitations have included the application of distributed computing and high-performance architectures to improve the efficiency of scenario evaluation.
Although these systems represent significant progress, important limitations persist. Many decision-support systems require labour-intensive data preparation, rely on context-sensitive models, or face computational challenges when applied at large scales. The increasing reliance on geospatial data adds further challenges, including privacy concerns and the need for efficient indexing and retrieval of large, heterogeneous datasets [29]. Inconsistencies in carbon sequestration metrics and the lack of standardised criteria also hinder meaningful evaluation and comparison [5,24]. A further limitation lies in the mismatch between policy evaluation scales (often national or EU-level) and decision-making scales (farm or municipal), which reduces the practical usability of outputs [30]. Even systems that address performance and scalability, such as LANDSUPPORT and SmartScape, continue to face difficulties in managing uncertainty and ensuring accessibility for non-expert users.
Taken together, these issues demonstrate that existing decision-support systems have not fully achieved the necessary alignment between scientific modelling frameworks and operational policy application. Policymakers often lack the means to independently combine and evaluate land use scenarios without relying on technical experts to manage complex data and models. This dependency makes scenario development time-consuming, reduces flexibility, and delays the delivery of insights into the decision-making process. In particular, existing systems often rely on context-specific modelling approaches or static scenario outputs, limiting their applicability for rapid, user-driven evaluation across multiple criteria and spatial scales. These challenges underscore the need for a decision-support system that (i) integrates climate, economic, and ecological dimensions into a single transparent framework; (ii) enables scenario building and evaluation across multiple governance scales; and (iii) provides an intuitive interface that empowers policymakers to test and compare strategies directly, without technical mediation.
The aim of this study is to develop and demonstrate a decision-support tool with spatially explicit functionality for evaluating land-use policy scenarios in the LULUCF sector by assessing their impacts on GHG mitigation and key climate, economic, social, and ecological indicators. The proposed approach integrates predefined parcel-level impact indicators with user-defined spatial selection criteria, enabling dynamic scenario construction without additional model calibration. The tool applies predefined parcel-level impact indicators for GHG mitigation potential, profitability, employment, and habitat quality, enabling the evaluation of trade-offs and synergies across alternative land-use scenarios. By supporting spatially explicit scenario construction and multi-criteria evaluation within a single platform, the tool contributes to more transparent and efficient evidence-based land-use policy planning within agricultural and forestry land and provides a complementary analytical framework that does not explicitly represent broader land-use change processes.

2. Materials and Methods

2.1. Concept of the Decision Support Tool

The decision-support tool was designed to enable the evaluation of potential effects of land-use policy measures prior to their implementation. Such evaluations consider not only the direct outcomes of measures, such as reductions in net GHG emissions, but also their interactions with other policy objectives.
In this study, the impacts of policy measures are assessed across four dimensions: climate (net GHG emissions), economic (profitability), social (employment), and ecological (habitat quality). These dimensions reflect key policy objectives relevant to sustainable land-use management and allow the analysis of trade-offs and synergies between environmental, economic, and social outcomes [31,32]. Evaluating these impacts ex-ante provides a structured basis for comparing alternative policy measures and their combinations.
Consultations with policymakers informed the design of the tool, emphasising the importance of a clear and accessible interface that prioritises usability and computational efficiency. The tool, therefore, focuses on providing transparent information on the impacts of alternative measures across multiple evaluation criteria.
In practice, users can select one or several measures within a scenario, define the land areas where they are applied, and generate results for net GHG reduction, profitability, employment, and habitat quality. The tool was implemented and tested using Latvian spatial datasets, providing a case study to assess its applicability for supporting land-use and climate policy planning.

2.2. Baseline Data and Pre-Calculation Framework

The computational workflow of the tool relies on a baseline dataset that describes current land use, management practices, and associated baseline values across all four dimensions. Prior to user interaction, all relevant indicators, including baseline net GHG emissions, employment, profitability, and habitat quality, are pre-calculated for each land parcel (at the agricultural and forest field level). These baseline values represent the reference state against which the effects of policy measures are evaluated.
These pre-calculations follow established and peer-reviewed methodological frameworks. Labour input estimates are based on the parcel-level labour demand approach developed by Veipane et al. (2025), which quantifies management-specific labour requirements across agricultural and forestry systems [33]. Habitat quality assessments draw on the biodiversity evaluation framework presented by Bilande et al. (2025), which integrates land-use intensity, landscape structure, and habitat characteristics into a spatially explicit habitat quality indicator [34]. The methodology for profitability calculations follows the approach presented in Bilande et al. (2026), which parcel-level spatial data, land quality indicators, sectoral statistics, and expert assumptions uses to produce comparable annual profitability for agriculture and forestry [35]. In this approach, forestry is conceptualised as an economic deposit, where annual increments in standing timber volume are treated as additions to a latent profit balance that is realised upon harvest or sale. This allows forestry profitability to be expressed as an implicit annual income stream, ensuring comparability with annual gross margin estimates used for agricultural land. Baseline net GHG emission estimates are derived using IPCC guideline methodologies [36], adapted to the parcel-level land-use structure to enable transparent and spatially consistent accounting (see Supplementary Material for formulas and emission factors [37,38,39,40,41,42,43,44,45,46]).
In parallel, the impacts of each policy measures are pre-calculated on a per-hectare basis using results from two earlier research initiatives: (i) the 2023 project “Development of Decision Support Systems to Support Decision-Making for Achieving LULUCF Objectives, Selection of the Optimal Set of Measures, and Projecting of the Required Funding” and (ii) the 2019–2023 LIFE OrgBalt project “Demonstration of Climate Change Mitigation Potential of Nutrient-Rich Organic Soils in Baltic States and Finland”.
Together, the parcel-level baseline indicators and the measure-specific per-hectare impact coefficients constitute the core inputs to the decision-support tool. During scenario modelling, these coefficients are applied to eligible parcels by scaling them to parcel area, and the resulting values are aggregated to generate scenario-level outputs. Each parcel can be assigned to only one measure within a scenario; areas already selected for a given measure are excluded from subsequent selections, ensuring that overlapping or competing measures are not applied to the same spatial unit. The impacts of user-selected measures are then evaluated by comparing the aggregated scenario results with the corresponding baseline values.

2.3. Policy Measures

Policy measures for analysis were defined through the policy-making process for the elaboration of Latvia’s Energy and Climate Plan (NECP) 2021–2030. During this process, a broader set of technically and economically feasible measures was assessed than those ultimately included in the final NECP [47]; the measures retained in this study, therefore, represent policy-relevant options considered during plan preparation and remain suitable for scenario analysis and future policy development. The measures assessed in this study are targeted at agricultural and forest land; natural peatlands and settlements are excluded from the scope, while former peat extraction sites converted to perennial crop systems (e.g., cranberries and blueberries) are considered within the agricultural land category for the purpose of this study (Table 1). Designed to support climate mitigation goals, the measures promote sustainable land use and GHG reduction in the LULUCF sector. They reflect priorities defined in the NECP and aim to increase carbon sequestration while reducing emissions from soils and land management. Each measure is designed with both climate and economic objectives, such as increasing carbon uptake, reducing emissions, and improving timber production, while ensuring land suitability and cost-efficiency. Prior to implementation, spatial and economic assessments are conducted to ensure long-term effectiveness.
While the current set of measures reflects priorities established in the NECP, the list can be expanded and additional options incorporated into the decision-support tool as new evidence becomes available. The existing measures primarily focus on enhancing forest productivity, expanding forest cover, and promoting sustainable practices on agricultural and forest land. Examples include the afforestation of agricultural land, improvement of drainage conditions on wet soils, conversion of croplands on organic soils into permanent grasslands, fertilisation techniques (including the application of wood ash), and the establishment of perennial crops such as cranberries and blueberries on former peat extraction sites. Collectively, these measures contribute to Latvia’s transition toward climate neutrality by improving the carbon balance and advancing sustainable land management practices.

2.4. Impact Assessment of Policy Measures

To evaluate alternative policy scenarios, defined by different combinations of measures and criteria for their spatial application, the impact of each policy measure is assessed individually on a per-hectare basis. In this study, measure-level impacts are evaluated across four policy dimensions: climate (change in net GHG emissions per hectare), economic (change in profit per hectare), social (change in labour input per hectare), and ecological (change in habitat quality points per hectare). These per-hectare impact values are subsequently combined with parcel-level baseline data to generate scenario-specific outcomes.
The present study does not undertake new calculations of the impacts of the previously mentioned measures. Instead, it relies on quantified impact indicators generated in 2023 by the project “Development of Decision Support Systems to Support Decision-Making for Achieving LULUCF Objectives, Selection of the Optimal Set of Measures, and Projecting of the Required Funding” and between 2019 and 2023 by the project “Demonstration of Climate Change Mitigation Potential of Nutrients Rich Organic Soils in Baltic States and Finland” (LIFE OrgBalt). These projects evaluated a set of policy measures targeting sustainable land use and GHG reduction in the LULUCF sector, as defined in Latvia’s NECP. The two projects produced estimates of their effects on profitability, employment, net GHG reduction potential, and habitat quality. These indicators are directly incorporated into the decision-support tool developed here, serving as the basis for scenario construction and evaluation. A summary of the impact estimates used in this study is provided in Table 2.
Measures intended to increase carbon stocks have long-term effects on net GHG reduction. Since data collection and calculation methods for estimating emissions and carbon stocks are continuously improving, the impacts of these measures should be reassessed regularly and the model updated with the latest information.

2.4.1. Net GHG Reduction

The calculation of the impact on net GHG emissions is based on the difference in GHG emissions and carbon stocks before and after implementation of the measure. Calculations of GHG emissions and carbon sequestration are carried out in accordance with the IPCC guidelines, using data collected through the national forest inventory conducted by the Latvian State Forest Research Institute “Silava”. This inventory provides information on the country’s forest resources, changes in forest area, living and dead wood resources, and the condition of forest ecosystems. The same institute also produces estimates of GHG emissions in the LULUCF sector and projection results based on stand growth modelling, which are incorporated into the calculations.

2.4.2. Impact on Profitability

The impact on the profitability of forest land is evaluated over a full rotation cycle by calculating the change in average timber volume by species before and after the implementation of a given measure, then multiplying this change by the average profit margin per cubic meter. To minimise uncertainty related to future changes in timber prices and inflation, fixed average prices for 2023–2024 are applied.
The impact on agricultural land profitability is evaluated by calculating the difference in gross margin per hectare before and after the implementation of a given measure. In most cases, measures involve the conversion of agricultural land to forest land, in which case profitability is determined by the expected timber volume at the end of the rotation cycle. Exceptions are measures where agricultural activity continues after implementation, such as managed grassland, cranberry (Vaccinium macrocarpon), or blueberry (Vaccinium corymbosum) production, where profitability is calculated using crop-specific gross margins. Gross margins are estimated as the average yield multiplied by the fixed average product price, minus variable production costs. As with forest measures, fixed average prices for 2023–2024 are applied to minimise uncertainty related to future price fluctuations.

2.4.3. Impact on Employment

Employment impacts are measured as the average labour input per hectare, expressed in hours, for each land use or management type specified in policy measures. To ensure realistic estimates, the calculations draw on locally available agricultural data and cost-accounting reports that reflect actual labour requirements under typical management practices. In this study, the employment dimension, therefore, represents the number of labour hours required per hectare under each policy measure, enabling comparison of how changes in management and land uses included in policy measures may increase or reduce overall labour demand.

2.4.4. Impact on Provision of Habitat Quality

Biodiversity impacts for each policy measure are assessed using a habitat quality indicator. In agricultural areas, the indicator is based on the assumption that habitat quality depends on both land use type and land use intensity [48]. In forests, habitat quality is strongly influenced by stand age and dominant species composition; older stands and those dominated by species with high structural complexity generally support higher biodiversity and provide more specialised habitats [49,50]. Further, using habitat quality indicators, the impact of each policy measure on habitat quality is determined.

2.5. Spatial Data and Land Use Information

Detailed current land use information is the basis for a spatial model, as it allows for changing land use type based on a different set of criteria. In our case, there are 2 separate datasets with detailed spatial land use information at a field level—one for agricultural land and one for forest land, which also includes peatland.
The agricultural land use dataset is based on parcel boundaries from the Land Parcel Identification System, administered by the Rural Support Service, which is the primary institution responsible for implementing the Common Agricultural Policy in Latvia [51]. This database includes publicly available information on field size and the cultivated crop, which we categorised into nine crop groups: grains, oilseeds, pulses, perennial grasslands, grasslands, vegetables, potatoes, energy crops, fallow and other. Additionally, it contains records on the type of agricultural support scheme received for each parcel from which we derived data on the agricultural system, with the purpose to identify conventional and organic farming practices. To determine the size of the farm associated with each field, additional non-public data were requested and provided with anonymised farm identifiers. This ensured confidentiality while still enabling the linkage of each field to the corresponding farm size category. The database also incorporates data on land use restrictions, indicating whether the field lies within a protected area, based on information from the “Ozols” database maintained by the Nature Conservation Agency [52]. Soil data is obtained from historical soil maps and from the project “Improving Sustainable Soil Resources Management in Agriculture (E2SOILAGRI)” [53], allowing the identification of organic soils, an important factor in GHG emission calculations.
The forest land database is derived from the National Forest Register managed by the State Forest Service and includes detailed biophysical and management-related information for each forest compartment [54]. Attributes recorded in this database include parcel area, the dominant tree species, its biophysical characteristics such as age, height, and diameter, forest type, site index, and standing volume. As with agricultural parcels, information on legal or ecological constraints is included, identifying any restrictions on economic activities, such as those arising from protected status or forest management regulations.

2.6. Tool Architecture and Technical Implementation

The decision-support tool is developed using the Shiny for Python framework (shiny 1.5 package), integrated with specialised Python packages to support interactive geospatial analysis for the evaluation of policy measures. Its architecture combines Geopandas 1.1 and Rasterio 1.4.4 packages for spatial data processing, SQLAlchemy 2.0.45 for database access, and ipyleaflet 0.20.0 for interactive map visualization. Analytical computations are handled by Pandas 2.3.3 and NumPy 2.4.0 packages, while Matplotlib 3.10.8 and Pillow 11.2.1 packages support graphical output. Asynchronous processing via Python’s built-in asyncio module ensures responsiveness during complex spatial operations. A PostgreSQL 17 database with the PostGIS 3.5 extension stores and manages all spatial datasets. Extensive preprocessing is conducted using Python and SQL scripts to integrate and standardise diverse geospatial layers, such as soils, peatlands, land restrictions, administrative regions, and land quality, into a unified 100-hectare grid framework, covering both agricultural and forest lands. Extensive preprocessing is conducted using Python and SQL scripts to integrate and standardize diverse geospatial layers, such as soils, peatlands, land restrictions, administrative regions, and land quality, into a unified 100-hectare grid framework for both agricultural and forest lands [55].
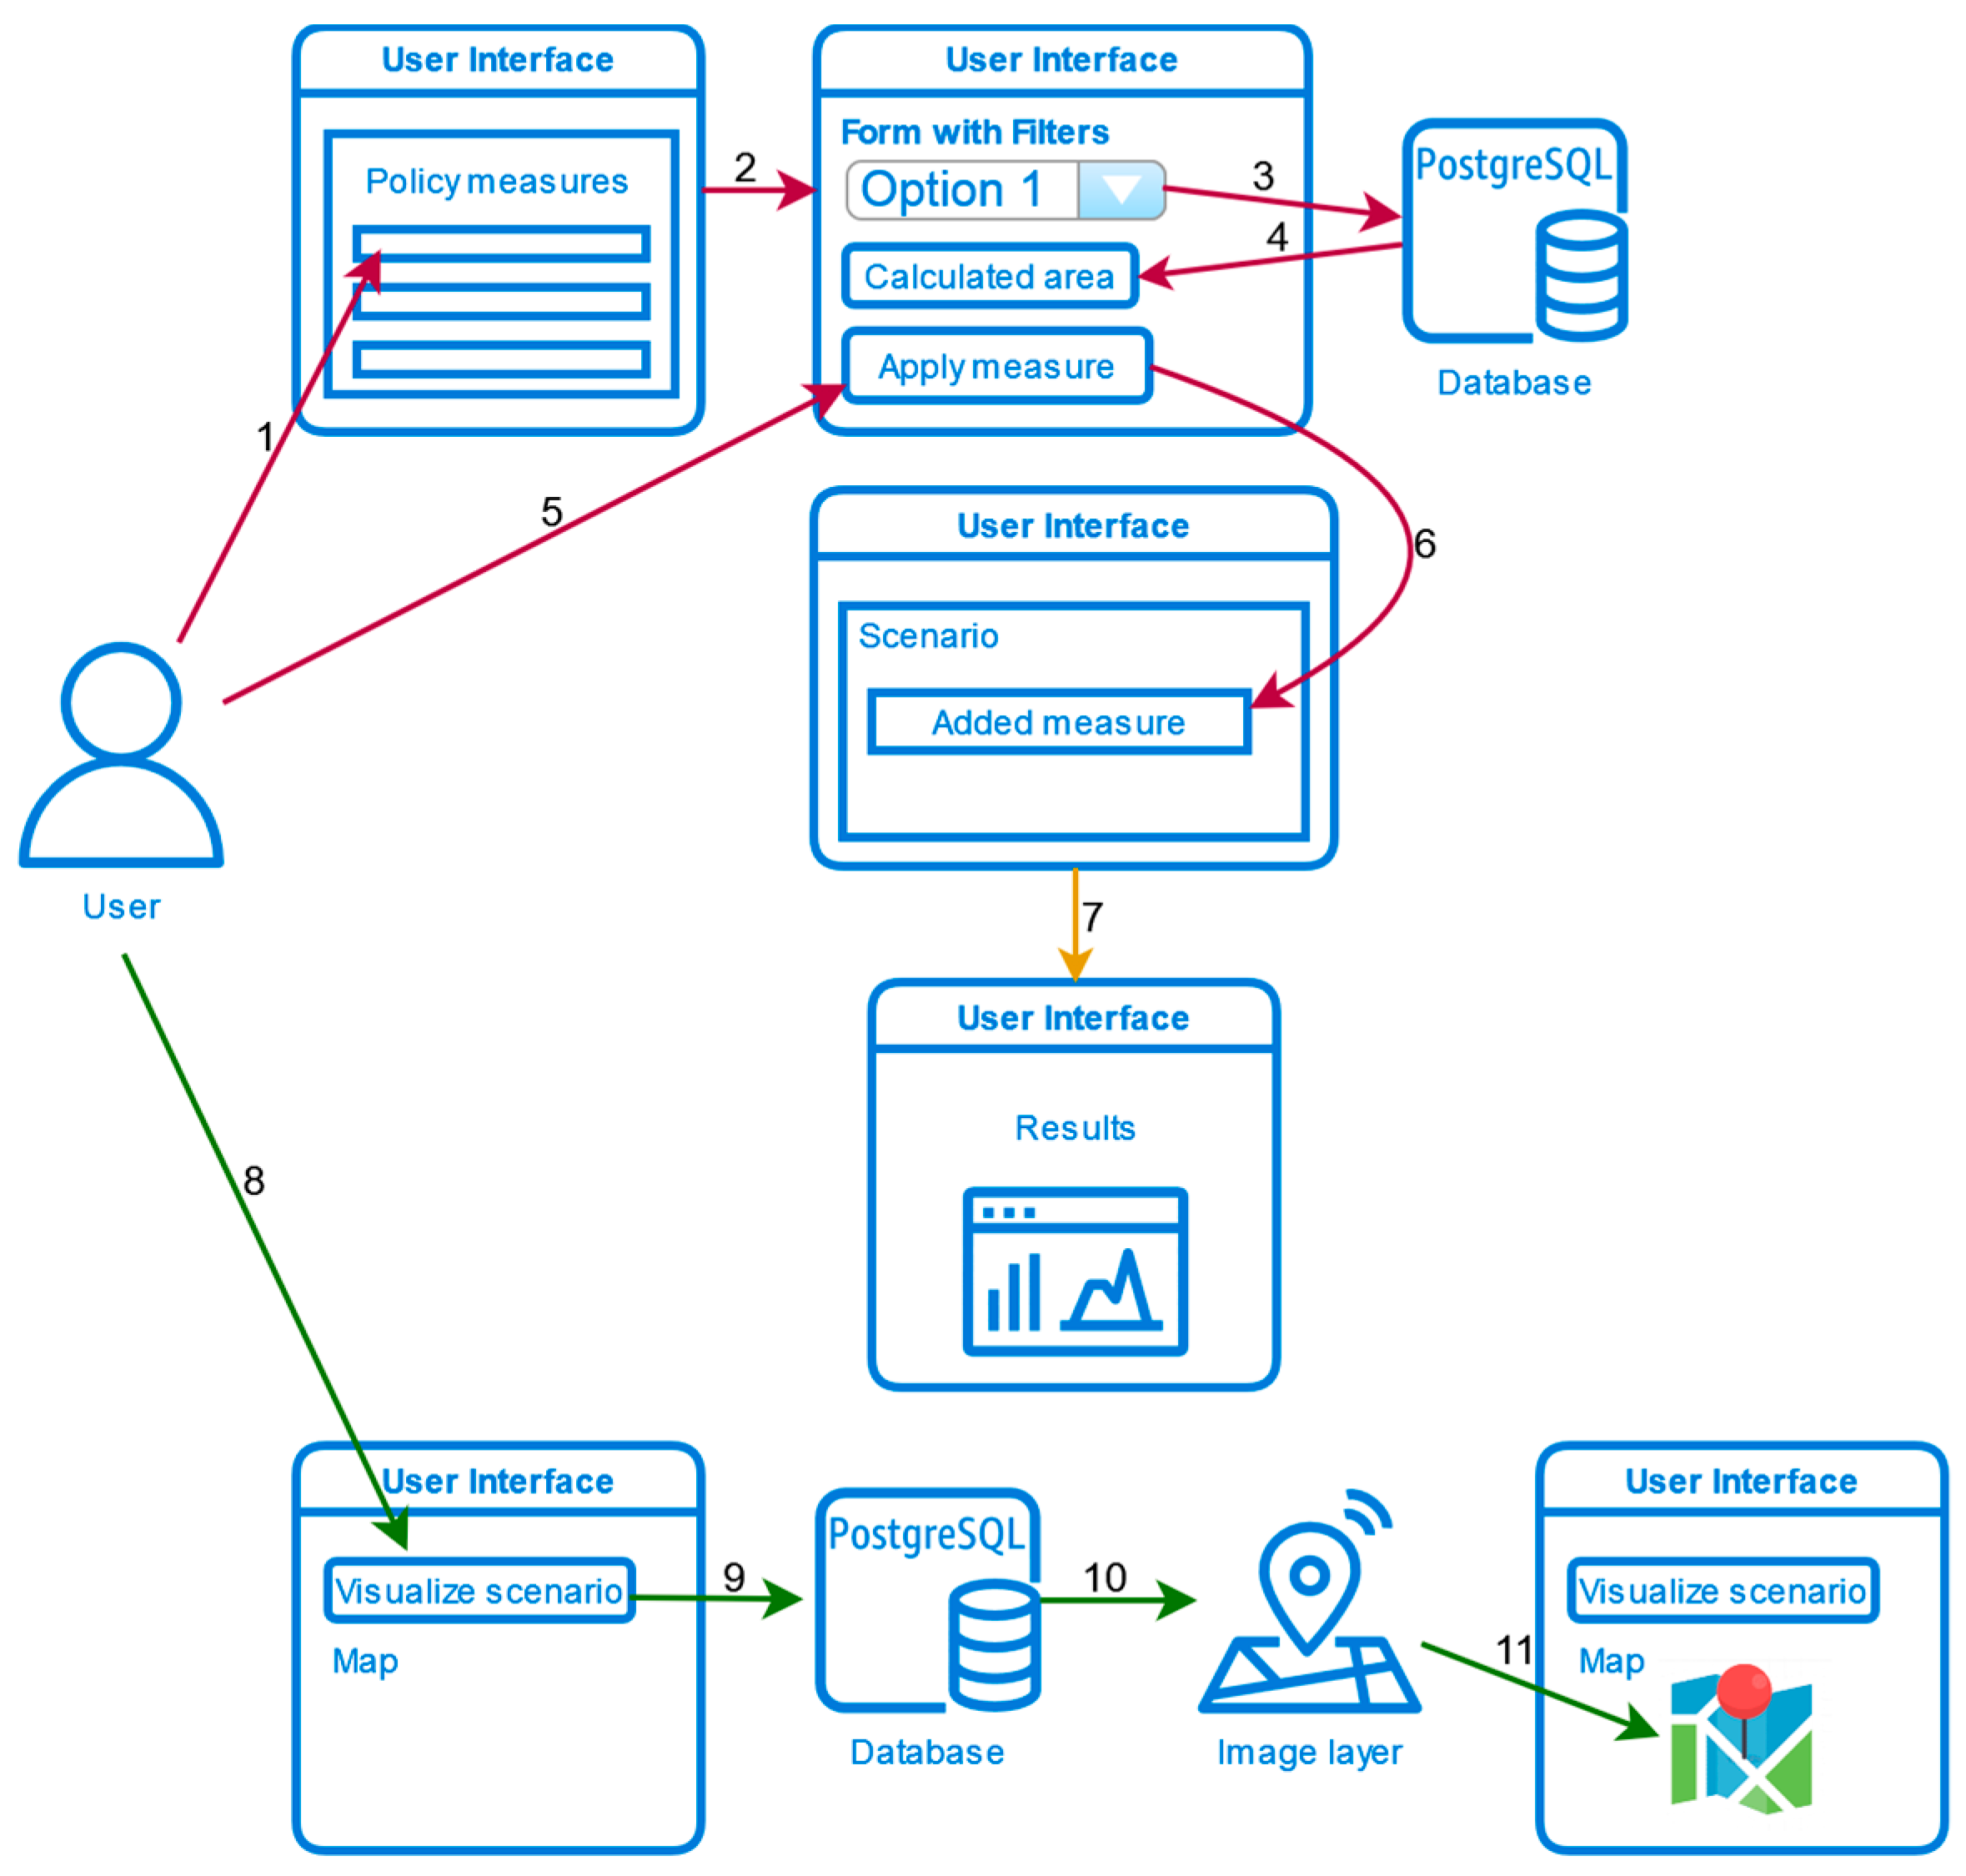
The decision support tool structure consists of three components: (1) a scenario configuration section where users first select a policy measure from a list, then apply multiple filtering criteria to identify eligible territories (Figure 1, red arrows); (2) a results section presenting quantified policy impacts in tabular format, including: net GHG reduction potential (t CO2 eq. ha−1), economic impacts (EURO ha−1), employment effects (hours ha−1) (Figure 1, yellow arrow), and ecological outcomes (habitat quality points ha−1); and (3) a map section that provides spatial analysis of the filtered results (Figure 1, green arrows).
The workflow shown in Figure 1 is described in detail in the following subsections.

2.7. Scenario Workflow and User Interaction

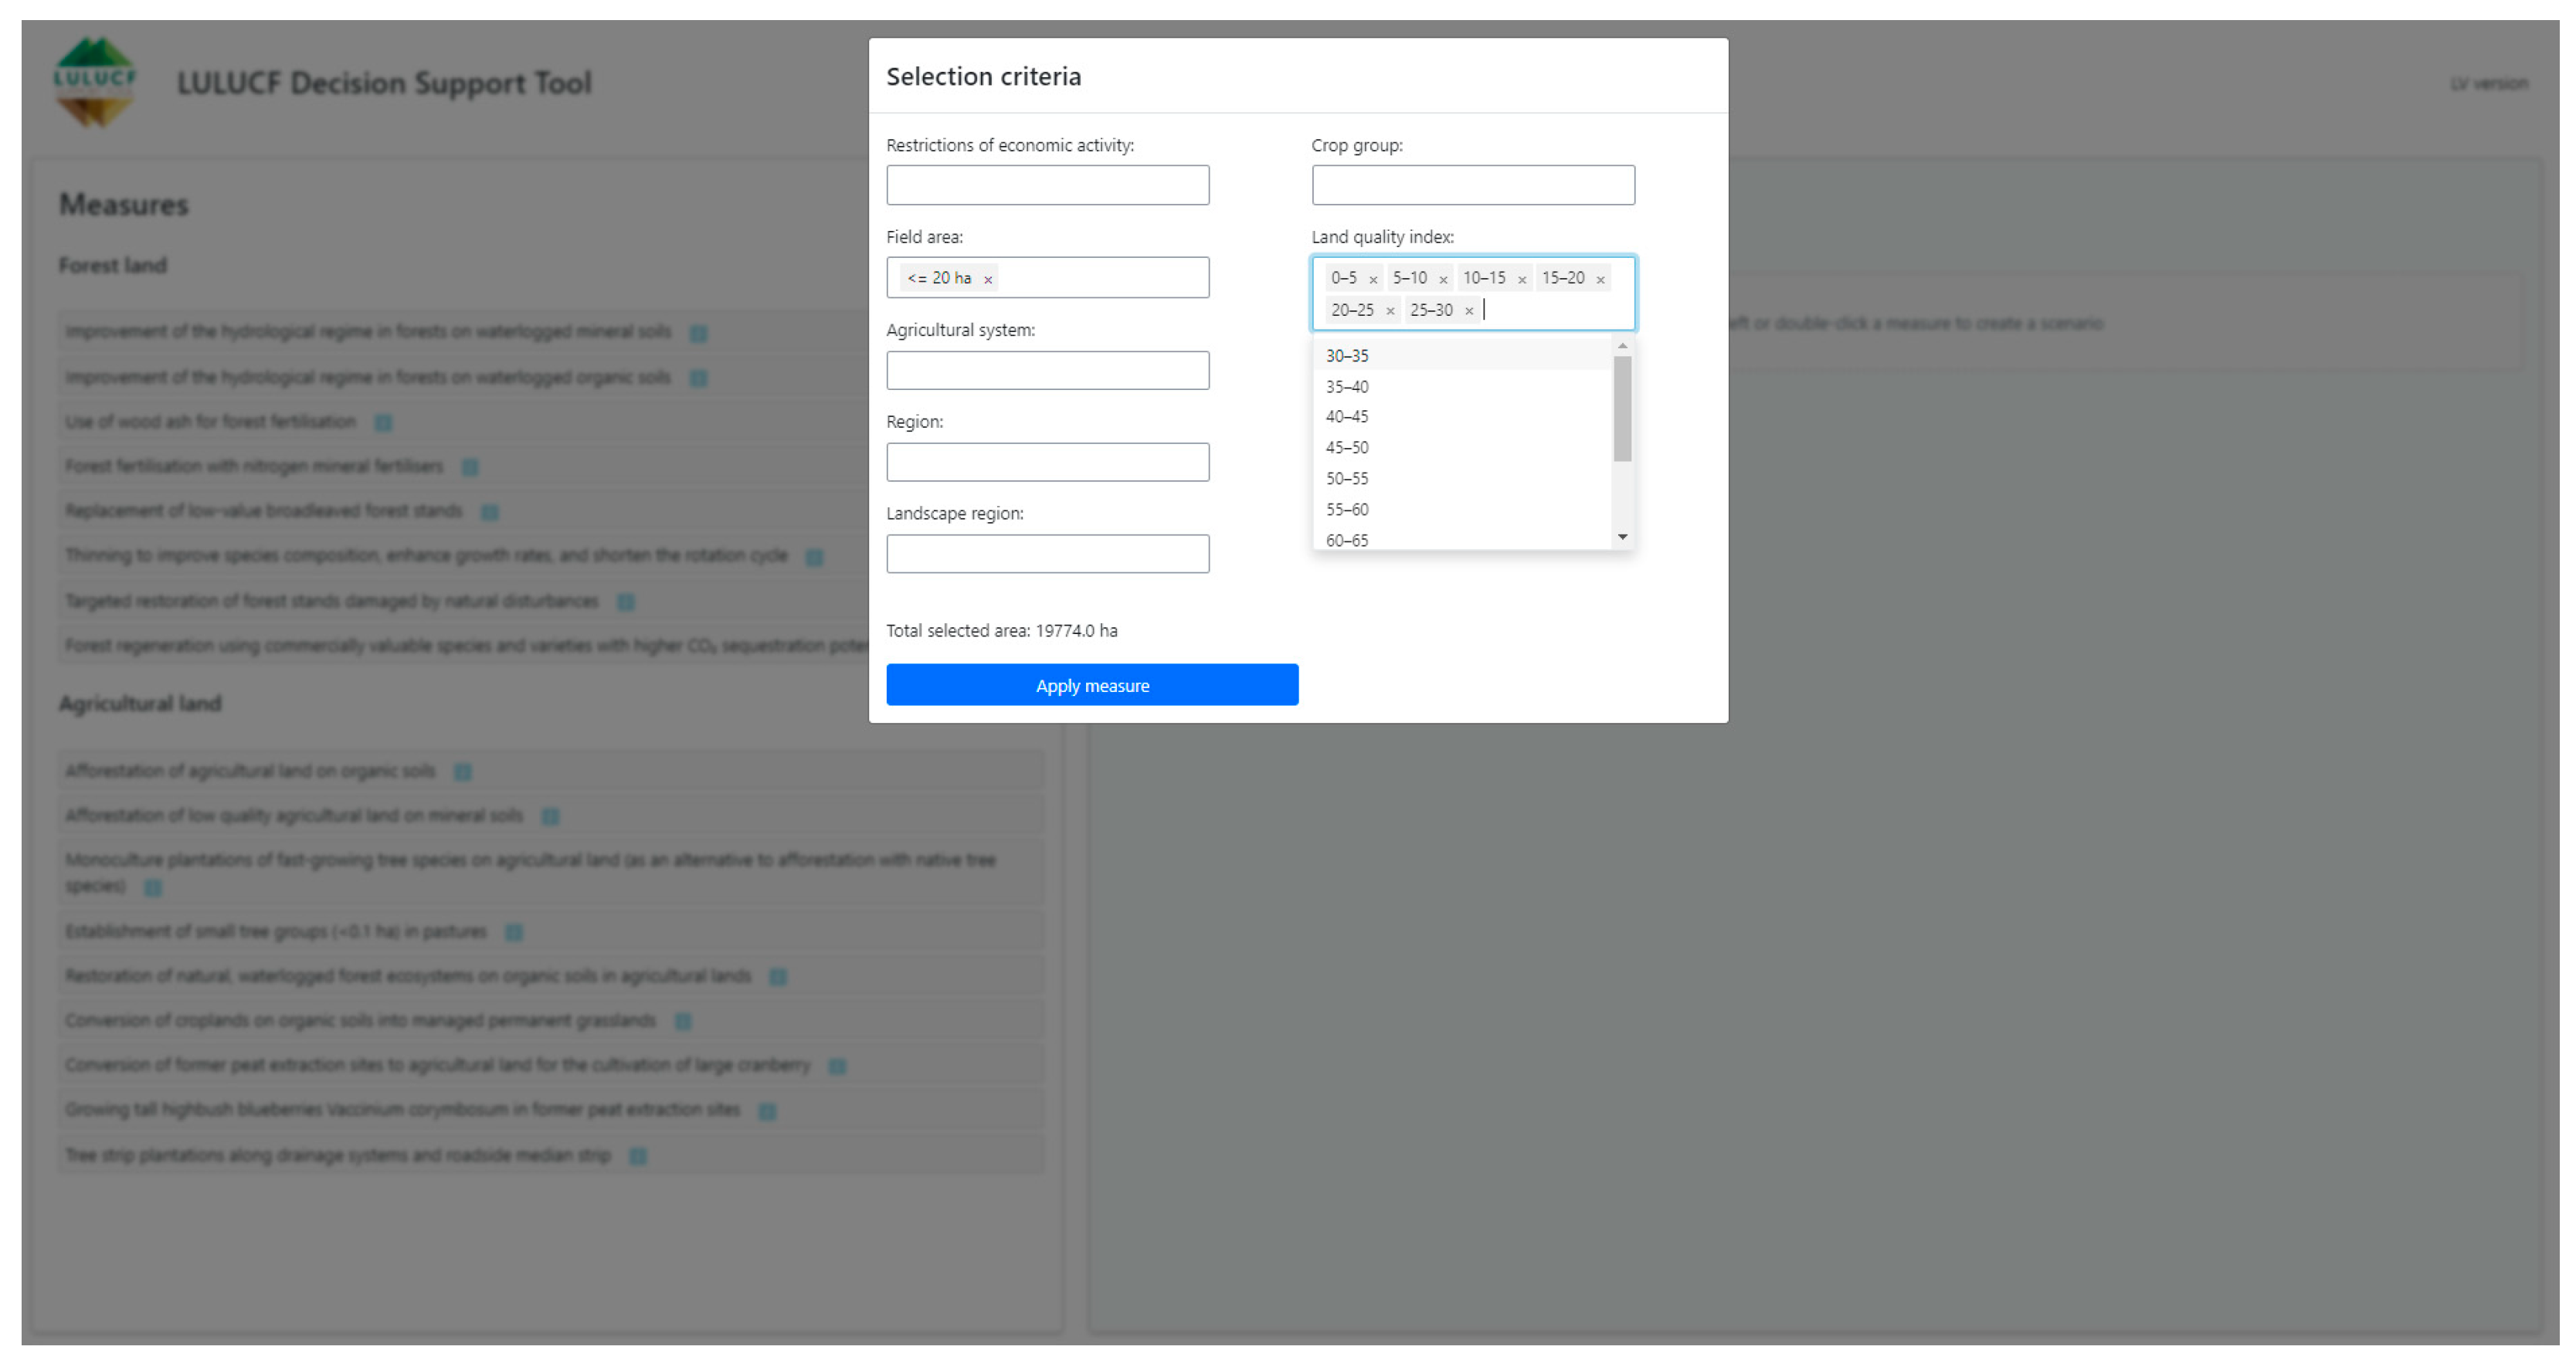
The scenario configuration process allows users to define and apply policy measures to agriculture or forest land based on a set of spatial and contextual criteria (Figure 1, Step 1). Users begin by selecting a measure type (agricultural or forestry), which initiates a modal interface containing relevant filtering options (Figure 1, Step 2). For agricultural measures, filters include variables such as soil type, land quality index, drainage infrastructure, and land use system. Forest measures involve a more complex set of parameters, including forest type, dominant tree species, site index, age class, and management restrictions (Table 3).
As users adjust their selections, the tool automatically updates the estimated area where the selected measure can be applied (Figure 1, Steps 3 and 4). Only areas that meet all specified conditions are included, and areas already allocated to other measures are excluded to avoid overlap. If no suitable area is identified, the system notifies the user and prevents the measure from being added.
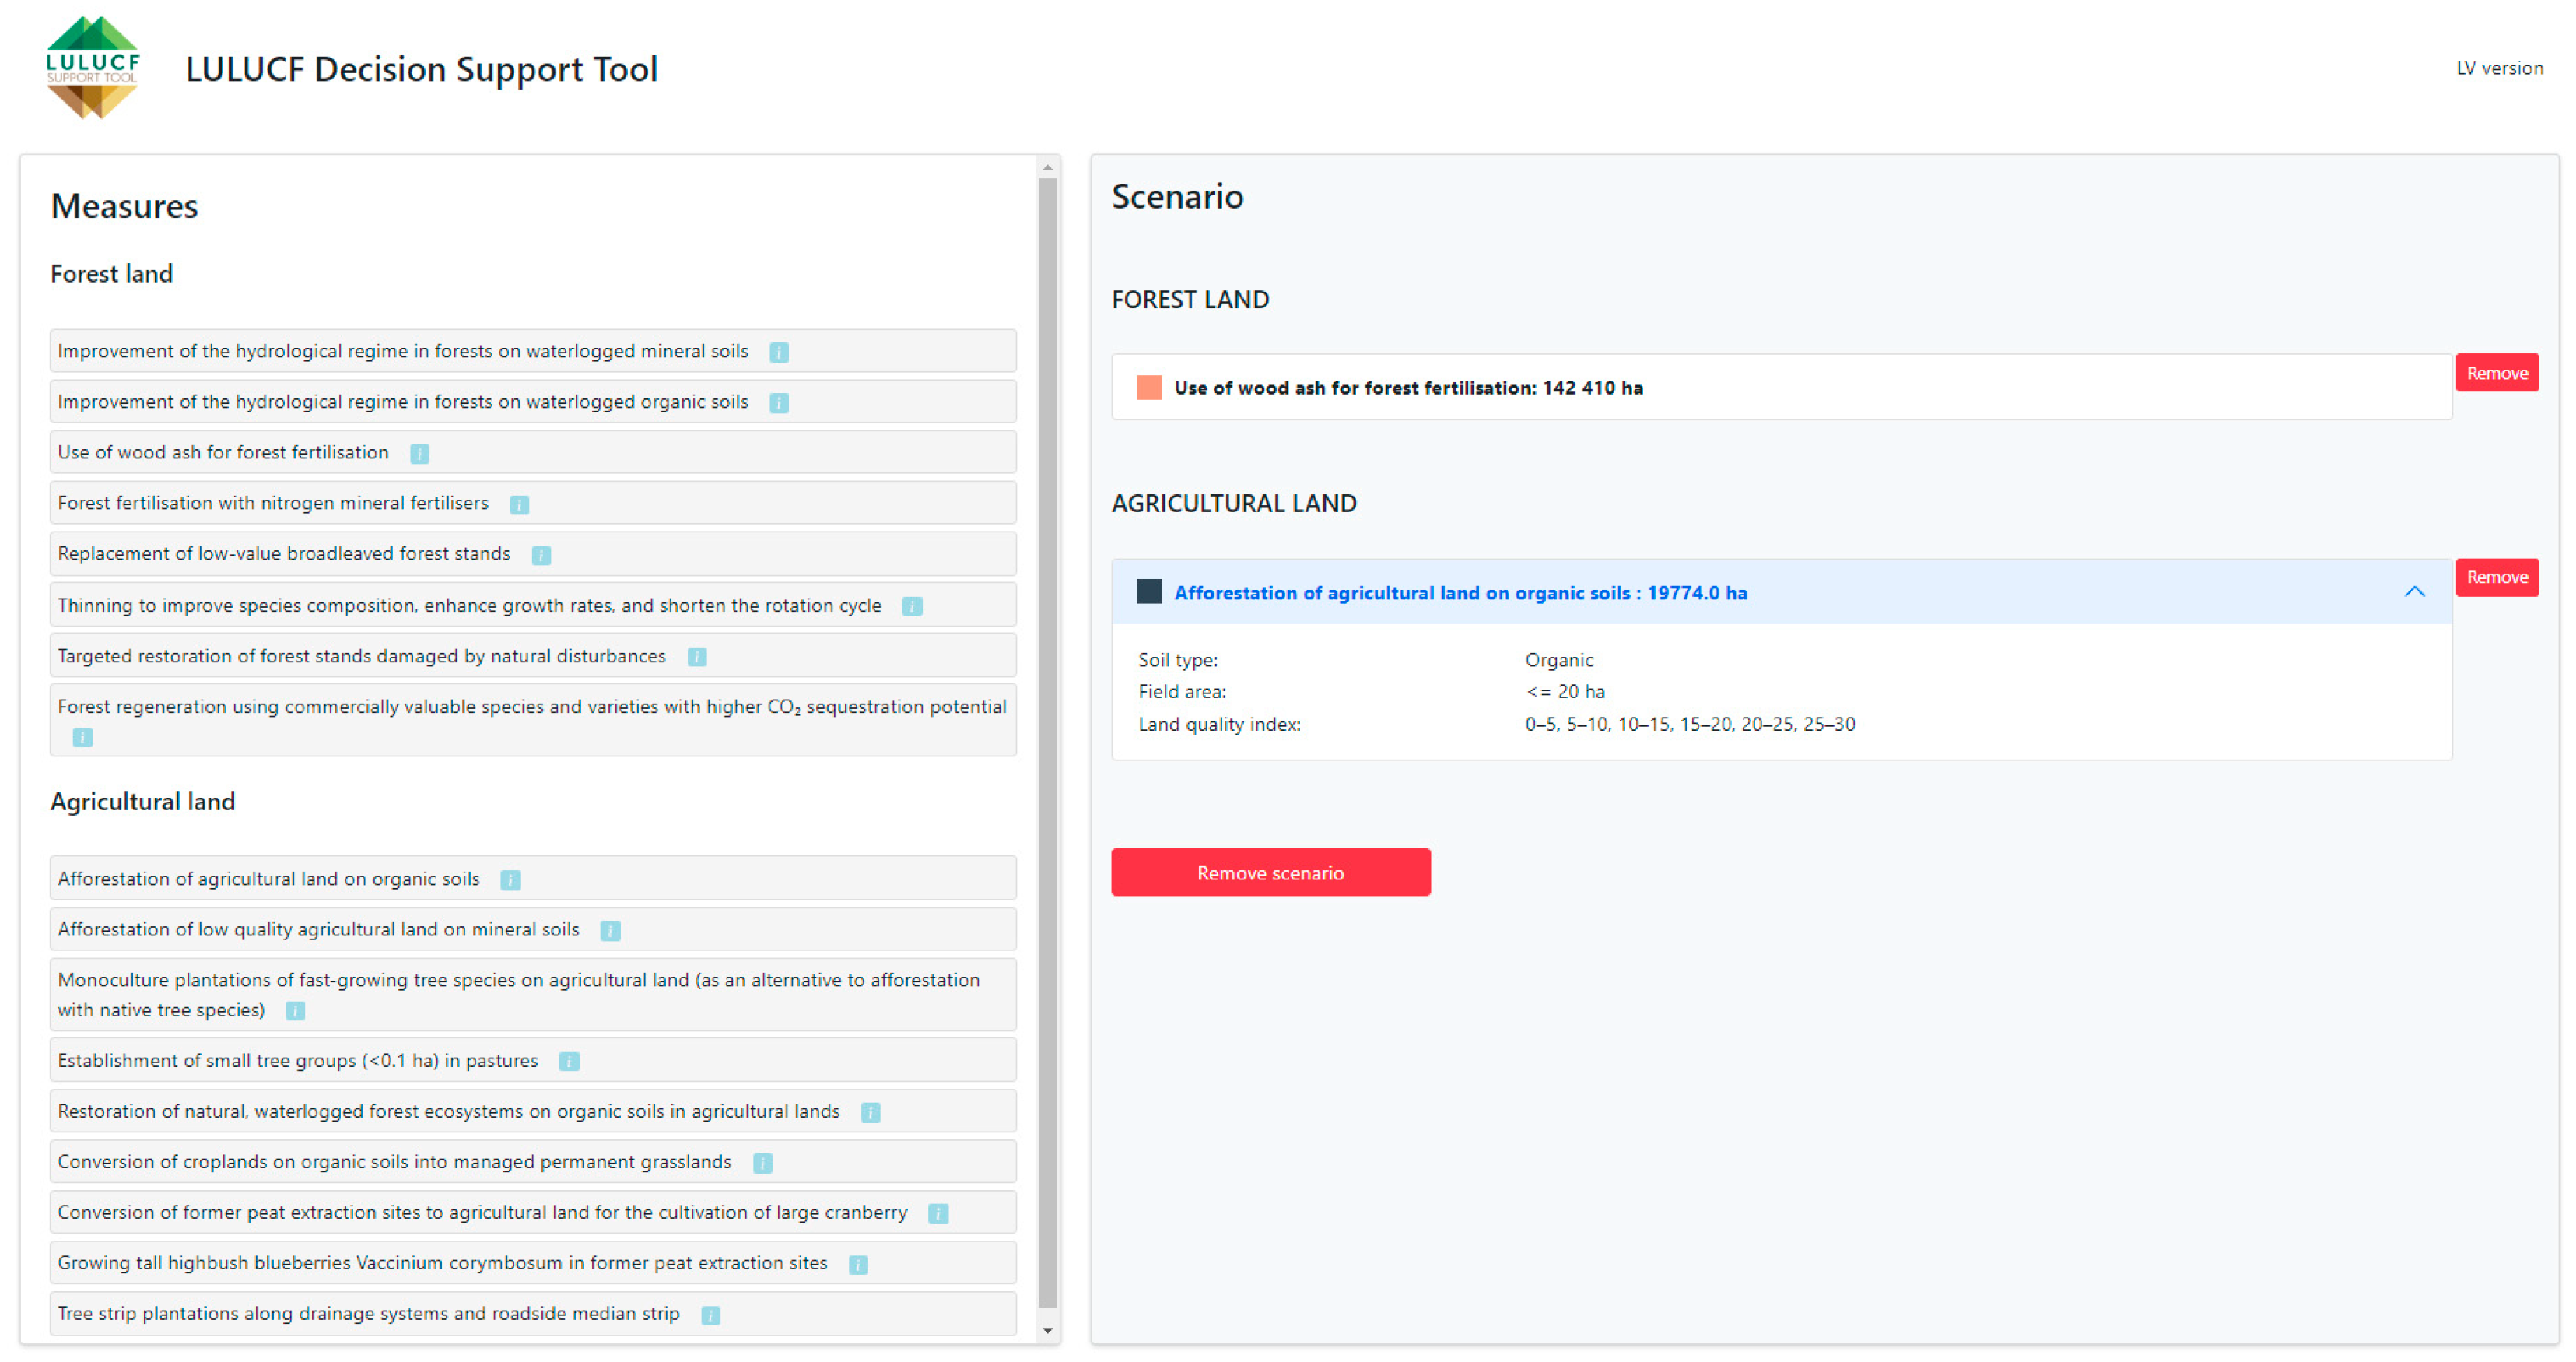
Once confirmed, the selected measure is stored with its details and visually represented in the scenario overview (Figure 1, Step 6). Each measure is clearly labelled and colour-coded to support easy interpretation. The scenario overview allows users to review and compare all applied measures. If necessary, users can reset the scenario and begin again.

2.7.1. Results Section

When a measure is added, the results section is automatically updated in response to changes in the internal data structure that stores all applied measures. For each accepted measure, the tool calculates its impact by multiplying the relevant impact assessment metrics, such as changes in net GHG reduction potential (t CO2 eq. ha−1), profit (EUR ha−1), employment (hours ha−1), and habitat quality (points ha−1), by the total area where the measure is implemented (Figure 1, Step 7).

2.7.2. Map Section

After applying at least one policy measure and generating initial results, users can initiate the visualisation of their scenario through the user interface (Figure 1, Step 8). This request is sent to a PostgreSQL database (Figure 1, Step 9), which stores the relevant spatial data. To ensure smooth performance, the system retrieves geospatial vector data asynchronously and in chunks. The data is then processed by a rasterisation module, where vector geometries are converted into raster format and subsequently into PNG image layers (Figure 1, Step 10). These image layers are added to the interactive map component of the interface, allowing users to explore a visual representation of the created scenario (Figure 1, Step 11). The map includes additional tools such as a colour-coded legend and layer controls to support interpretation and user interaction.

2.8. Technical Implementation

The design of the tool is informed by a review of four existing decision support systems, two of which are implemented in R using the Shiny framework [25,56]. For this study, Python was selected as the primary programming language due to its flexibility and extensive ecosystem for geospatial modelling and data visualisation. While R Shiny and Shiny for Python both offer comparable functionality for building interactive web-based decision support systems, they share similar limitations in scalability, particularly when working with large datasets or serving multiple users simultaneously. However, the Python language offers greater extensibility and benefits from a wider ecosystem of open-source libraries for geospatial modelling and visualisation. In addition, Python enjoys greater global popularity and a more active developer community, which provides strong support through documentation, forums, and open-access resources. This tool specifically employs Shiny for Python, with implementation based on the Shiny Express syntax, introduced in 2024. Shiny Express simplifies application development by allowing both the appearance and behaviour of user interface elements to be defined in a single location. This streamlined structure facilitates rapid prototyping and improves code clarity. Notably, Shiny Express is available exclusively in the Python version of Shiny, offering a user-friendly approach without compromising the flexibility or functionality required for scientific decision support systems.
The tool allows users to construct and compare various policy scenarios using predefined land-use measures, modelling their impacts on economic outcomes (profit and employment), climate indicators (GHG emissions and carbon sequestration), and ecological metrics (provision of habitat quality). Results can be assessed across multiple spatial scales from the municipality to the national. The underlying data infrastructure is built on PostgreSQL with the PostGIS extension, which significantly increases data processing speed compared to working directly with Pandas dataframes. The database is implemented following best practices from leading decision-support systems implementations [17,25,55] to ensure efficient and scalable geospatial data management.
Testing showed that tool responsiveness is best achieved by performing pre-calculations wherever possible, particularly for repetitive tasks, and storing the results in the database rather than requiring the application to recalculate them repeatedly.

2.9. Scenario Analysis

Scenario design is guided by Latvia’s NECP, which indicates that under the baseline trajectory, Latvia is not expected to achieve the 2030 LULUCF sector target of −644 kt CO2 eq., with projected net emissions of 3294.6 kt CO2 eq. [36]. This shortfall is primarily attributed to high emissions from agricultural organic soils and declining CO2 sequestration in forest lands. Accordingly, two policy-oriented scenarios are constructed in this study. Scenario S1 addresses the decline in forest carbon sinks by applying productivity-oriented forest management measures, including improvements of hydrological regimes in forests on waterlogged mineral, wood ash, and mineral fertilisation, and regeneration using commercially valuable species, with the objective of maximising CO2 removals in forest lands. Scenario S2 targets the main emission source in the LULUCF sector by focusing on the afforestation of organic soils and the restoration of natural, waterlogged forest ecosystems, with the aim of reducing emissions from organic soils.
For each policy measure, the technically suitable area identified through spatial analysis substantially exceeds the indicative implementation targets defined in the NECP. This reflects the fact that, due to financial, institutional, and technical constraints, it is not feasible to implement all potentially eligible measures within a single planning period. For example, while approximately 114 thousand hectares of agricultural organic soils are technically suitable for afforestation, afforesting this entire area by 2030 is not realistic. Therefore, for each measure, spatial selection criteria are applied to prioritise eligible areas and to constrain the total selected area so that it aligns as closely as possible with the NECP indicative targets for the LULUCF sector. This approach ensures that scenario implementation remains consistent with policy feasibility while retaining a transparent and reproducible spatial selection process (Table 4).

3. Results and Discussion

3.1. Overview of the LULUCF Decision Support Tool

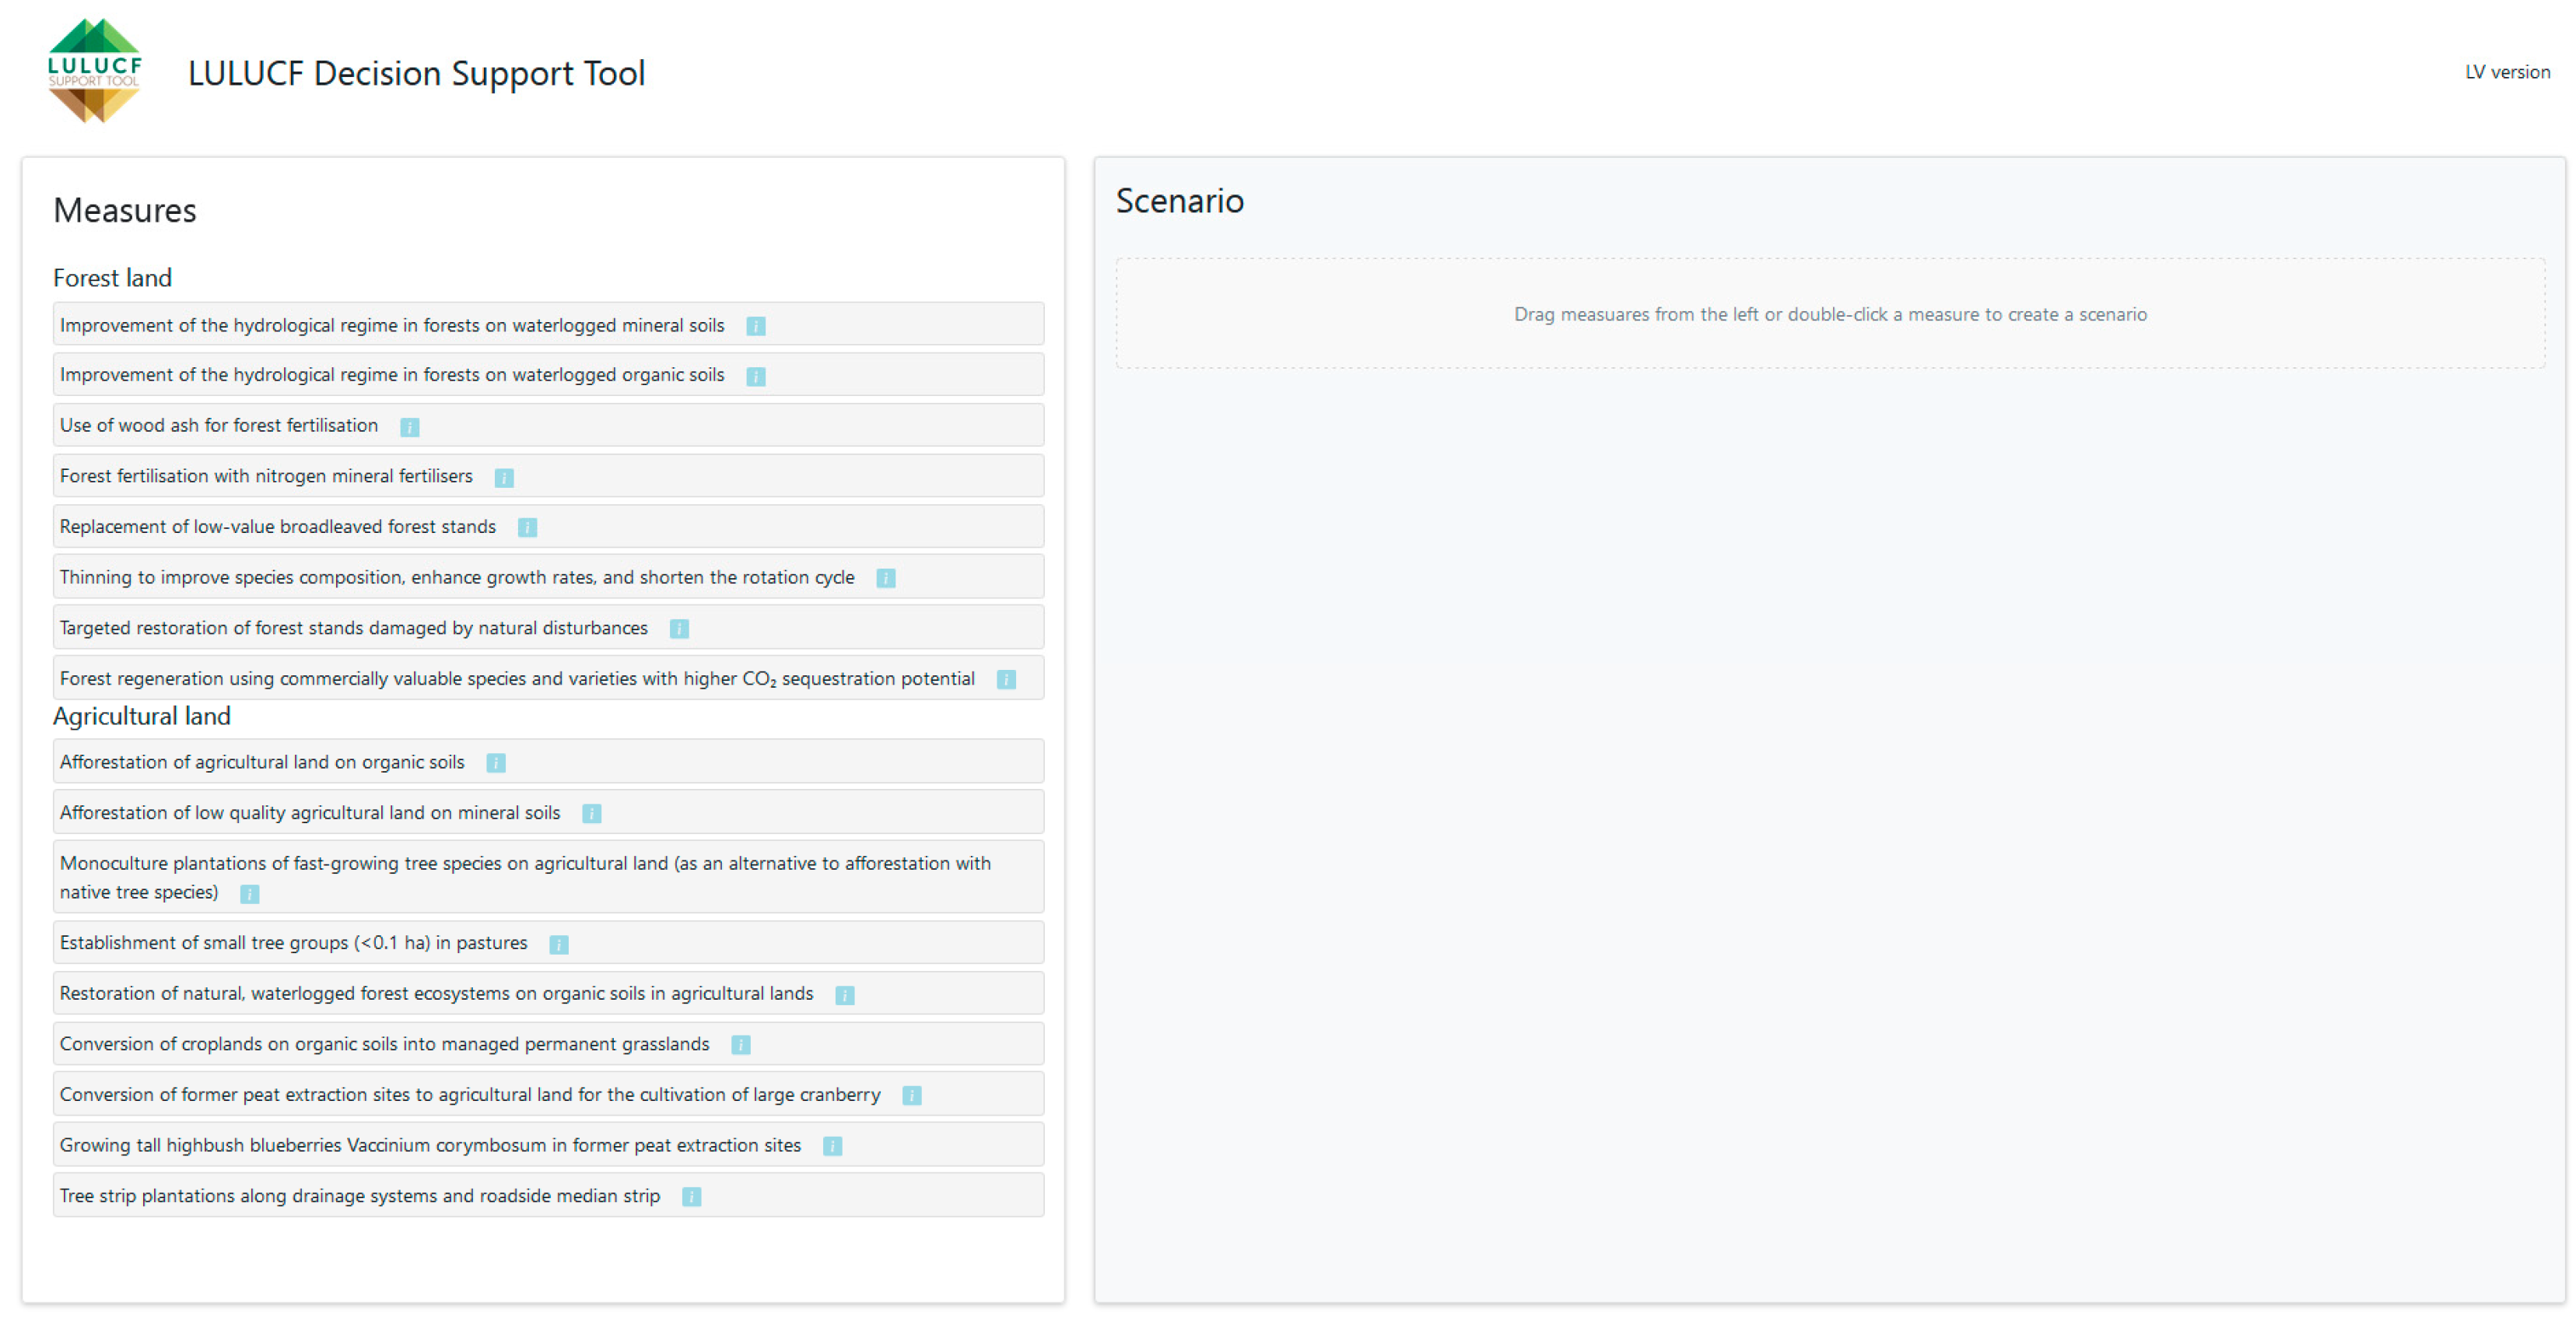
The LULUCF Decision Support Tool is a web-based platform developed to support the evaluation of predefined LULUCF mitigation measures through spatially explicit scenario analysis. It is intended for users involved in land-use and climate policy evaluation, including policymakers, land-use planners, and researchers. The tool enables the construction of scenarios by combining selected policy measures with spatial eligibility criteria and quantifying their impacts across climate, economic, social, and ecological dimensions (see Appendix A).
The tool operates through a structured workflow consisting of three main steps: measure selection, application of spatial criteria, and impact assessment. Measures are selected from a predefined set aligned with policy objectives. For each selected measure, users may define spatial constraints based on attributes such as field size, land quality, soil type, forest growth conditions, or dominant tree species, depending on the characteristics of the measure.
Once the measures and associated criteria are defined, the tool compiles the scenario configuration and identifies all land parcels that satisfy the specified conditions. These spatial selections form the basis for subsequent impact assessment.
The analytical component of the tool is based on parcel-level baseline data combined with predefined per-hectare impact indicators. Scenario outputs are generated by aggregating these parcel-level effects and include cumulative estimates of changes in net GHG emissions, profitability, employment, and habitat quality. This approach enables the evaluation of trade-offs and synergies across alternative land-use scenarios within agricultural and forestry land.

3.2. Policy-Relevant Scenario Outcomes and Trade-Offs

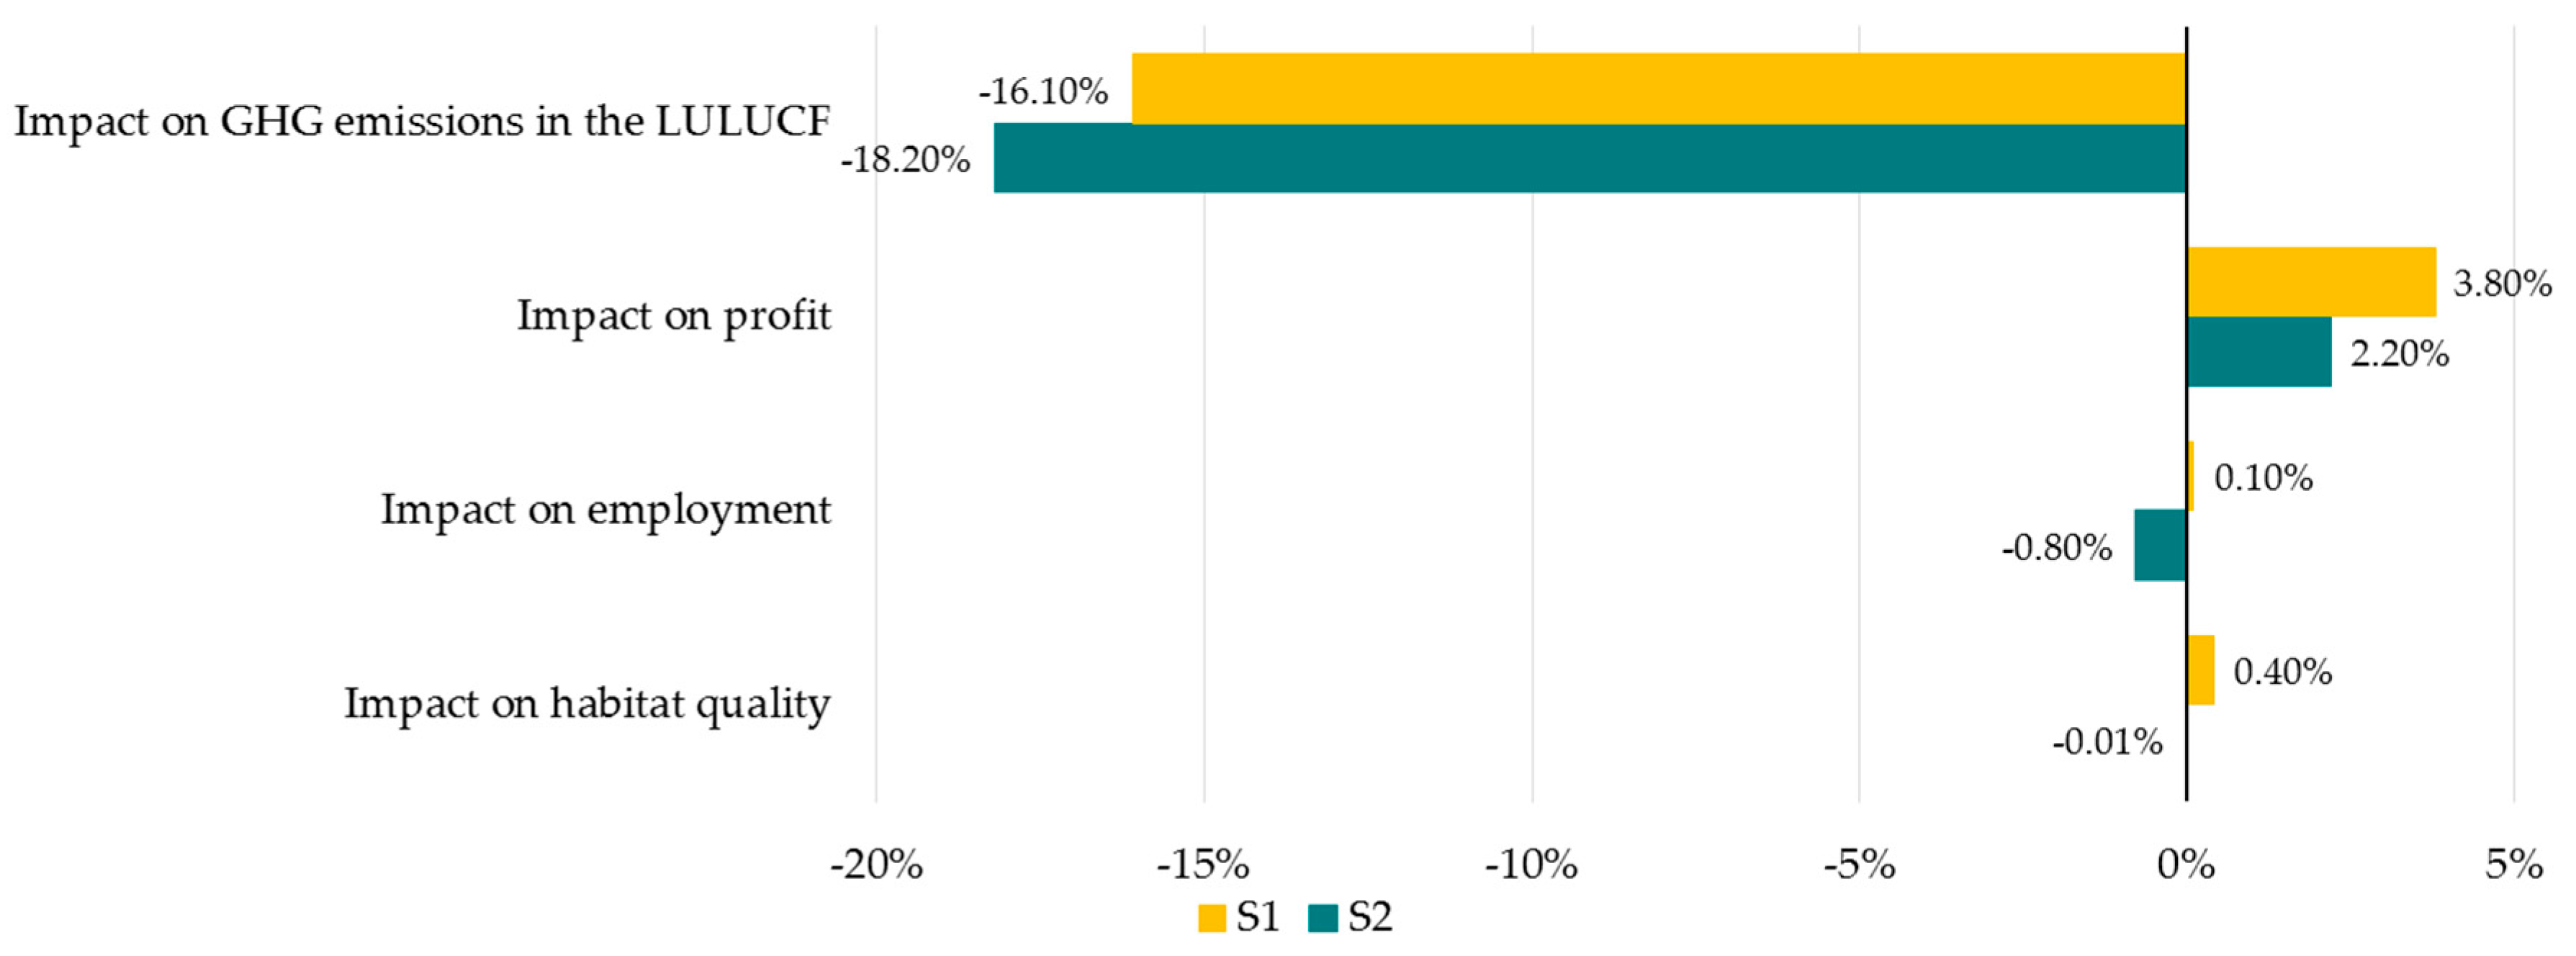
The results indicate that both scenarios deliver their strongest effects in the climate dimension, albeit through different mitigation pathways (Figure 2).
Absolute values (Table 5) show that Scenario S2 achieves the highest total net GHG reduction (867.14 kt CO2 eq.), primarily due to measures targeting emissions from organic soils, identified as a key source of sectoral emissions. This is accompanied by a substantial increase in profitability (17,991.45 thousand EUR), but also a pronounced negative effect on employment (−549.83 FTE) and a decline in habitat quality (−48.44 points), highlighting trade-offs that are not captured by climate indicators alone.
Scenario S1 delivers comparatively lower emission reductions but demonstrates a more balanced performance across multiple dimensions. As shown in Table 5, the scenario combines positive contributions to profitability (30,574.41 thousand EUR), employment (37.39 FTE), and habitat quality (1588.30 points), while maintaining substantial emission reductions. The relative results (Figure 2) further illustrate that S1 achieves more even improvements across climate, economic, social, and biodiversity indicators.
Together, the scenarios demonstrate how the decision-support tool enables transparent comparison of alternative policy pathways by linking spatially explicit measure selection with both absolute and relative multi-criteria outcomes. The comparison highlights the trade-off between maximising emission reductions (S2) and achieving more balanced socio-economic and ecological outcomes (S1), supporting more informed decision-making in the context of NECP implementation.

3.3. Adaptation for Other Regions

The decision-support tool presented here, although demonstrated in the Latvian context, is designed with a modular, transferable architecture that enables adaptation to other geographical and policy settings. The core system components, including the PostgreSQL/PostGIS database structure, Python-based analytical modules, and the Shiny for Python interface, are generic and can be implemented without structural modification. In addition, the workflow for scenario construction, application of spatial eligibility criteria, and aggregation of parcel-level impacts into scenario-level indicators is independent of a specific regional context and can be directly transferred.
In contrast, the analytical inputs to the tool are region-specific and require adaptation. These include spatial datasets (e.g., land-use layers, soil characteristics, and forest inventory data), parcel-level baseline indicators, and predefined per-hectare impact coefficients used to estimate GHG emissions, profitability, employment, and habitat quality. These elements must be recalibrated using locally relevant data sources, sectoral statistics, and methodological assumptions to reflect regional biophysical conditions, management practices, and policy objectives.
The transferability of the tool, therefore, depends on the availability, quality, and compatibility of spatial and statistical datasets, as well as alignment with national GHG accounting methodologies and policy frameworks. Differences in spatial resolution, classification systems, and reporting standards may require harmonisation, for example, through the application of internationally recognised frameworks such as the IPCC guidelines for GHG inventories.
Under these conditions, the tool provides a transferable analytical framework that enables spatially explicit, scenario-based evaluation of land-use policy measures across different regional contexts. A summary of transferable and region-specific components of the LULUCF Decision Support Tool is provided in Appendix B (Table A1).

3.4. Limitations and Future Research

The development of the LULUCF Decision Support Tool has highlighted several important limitations affecting its performance, usability, and broader applicability. A major challenge lies in the extensive preprocessing required to prepare and integrate datasets from multiple sources. Differences in spatial resolution, structure, format, and temporal coverage increase the effort needed for data harmonisation and updates. While these challenges are common in spatial decision-support systems [57], they underline the need for more automated and standardised data integration workflows. In addition, the current implementation is based on Latvian datasets, and its application in other regions would require adaptation to local data sources and policy contexts.
Another limitation concerns scalability. As with many applications developed using R Shiny and Shiny for Python, performance constraints arise when processing large spatial datasets or supporting multiple simultaneous users. Future improvements may include the integration of client-side rendering solutions, such as Mapbox GL JS, to enhance performance and responsiveness when handling large geospatial datasets [25].
Institutional factors may further influence the transferability and practical implementation of the tool. Differences in data governance frameworks, reporting standards, and data accessibility may limit the availability of compatible datasets required for scenario evaluation [58,59]. In addition, land ownership, which can significantly affect the feasibility and uptake of policy measures, is not explicitly represented in the current framework.
Uncertainty in the predefined impact coefficients and input datasets may affect the precision of scenario outputs through aggregation. As a result, the absolute values reported for scenario outcomes should be interpreted as indicative estimates rather than exact predictions. This is particularly relevant when comparing alternative scenarios, as differences between scenarios may fall within the range of underlying uncertainties. While the tool relies on harmonised indicators derived from validated modelling frameworks, further refinement of input data and assumptions would improve the robustness of results and strengthen their use in policy evaluation.
Future development of the LULUCF Decision Support Tool should focus on improving both usability and data processing capabilities. One priority is the development of automated workflows for integrating and updating geospatial datasets, including preprocessing and enrichment with relevant variables from multiple sources. Improvements to the user interface are also needed to enhance usability and support more flexible scenario configuration. In addition, a formal usability evaluation involving intended end users would provide valuable insights into the tool’s practical applicability.
Further development is required to expand scenario management functionality. In the current version, users can add or remove measures but cannot modify selection criteria once a measure is included. Enabling dynamic editing of criteria would increase flexibility and analytical capability.
Finally, future extensions could include aggregation of scenario results by administrative regions or farm-size classes, enabling a more detailed assessment of distributional effects and supporting the identification of potential trade-offs across stakeholder groups.

4. Conclusions

This study presented a spatial decision-support tool developed to evaluate the GHG mitigation potential of predefined land-use measures in the Latvian LULUCF sector. Implemented using Python 3.10, PostgreSQL 17/PostGIS 3.5, and the Shiny for Python framework (shiny 1.5 package), the tool integrates spatial, environmental, and socio-economic datasets within an interactive interface that enables users to construct, visualise, and evaluate policy scenarios.
The main contribution of the tool lies in enabling rapid and transparent evaluation of land-use policy measures. By combining spatial filtering, scenario construction, and multi-criteria impact assessment within a single platform, the system allows policymakers to analyse alternative land-use strategies and their impacts on GHG emissions, profitability, employment, and habitat quality without extensive manual data processing. This significantly reduces the time and technical expertise typically required for scenario evaluation and supports more efficient evidence-based policy planning.
Several limitations remain, including the need for extensive data preprocessing, scalability challenges, and reliance on predefined impact coefficients. As a result, scenario outputs should be interpreted as indicative estimates rather than precise predictions. Future development will focus on improving computational performance, expanding scenario management functionality, enabling automated integration of updated geospatial datasets, and incorporating distributional analysis capabilities.
Although demonstrated in Latvia, the framework is transferable to other countries where suitable spatial data and GHG accounting systems are available. The proposed approach provides a practical pathway for integrating spatial decision-support tools into climate policy planning and NECP implementation.

Supplementary Materials

The following supporting information can be downloaded at: https://www.mdpi.com/article/10.3390/land15050758/s1, Methodology for calculating GHG emissions and removals.

Author Contributions

Conceptualization, A.N., K.B. and K.Z.; software, K.Z.; validation, A.N., K.B. and U.D.V.; formal analysis, K.Z.; investigation, K.Z. and K.B.; resources, A.N.; data curation, K.Z. and K.B.; writing—original draft preparation, K.Z. and K.B.; writing—review & editing, U.D.V., A.N. and I.P.; visualization, K.Z.; supervision, A.N.; project administration, A.N.; funding acquisition, A.N. All authors have read and agreed to the published version of the manuscript.

Funding

The research was promoted with the support of the project Development of Decision Support Systems to Support Decision-Making for Achieving LULUCF Objectives, Selection of the Optimal Set of Measures, and Projecting of the Required Funding (S514, LAD Nr. 10.9.1-11/25/1551-e).

Data Availability Statement

The original data presented in the study are openly available in DataverseLV at https://doi.org/10.71782/DATA/KINURI and https://doi.org/10.71782/DATA/PFT36O. All spatial datasets used in this study are publicly available through the Latvian Open Data Portal (https://data.gov.lv/eng (accessed on 1 August 2025)).

Conflicts of Interest

The authors declare no conflicts of interest.

Appendix A

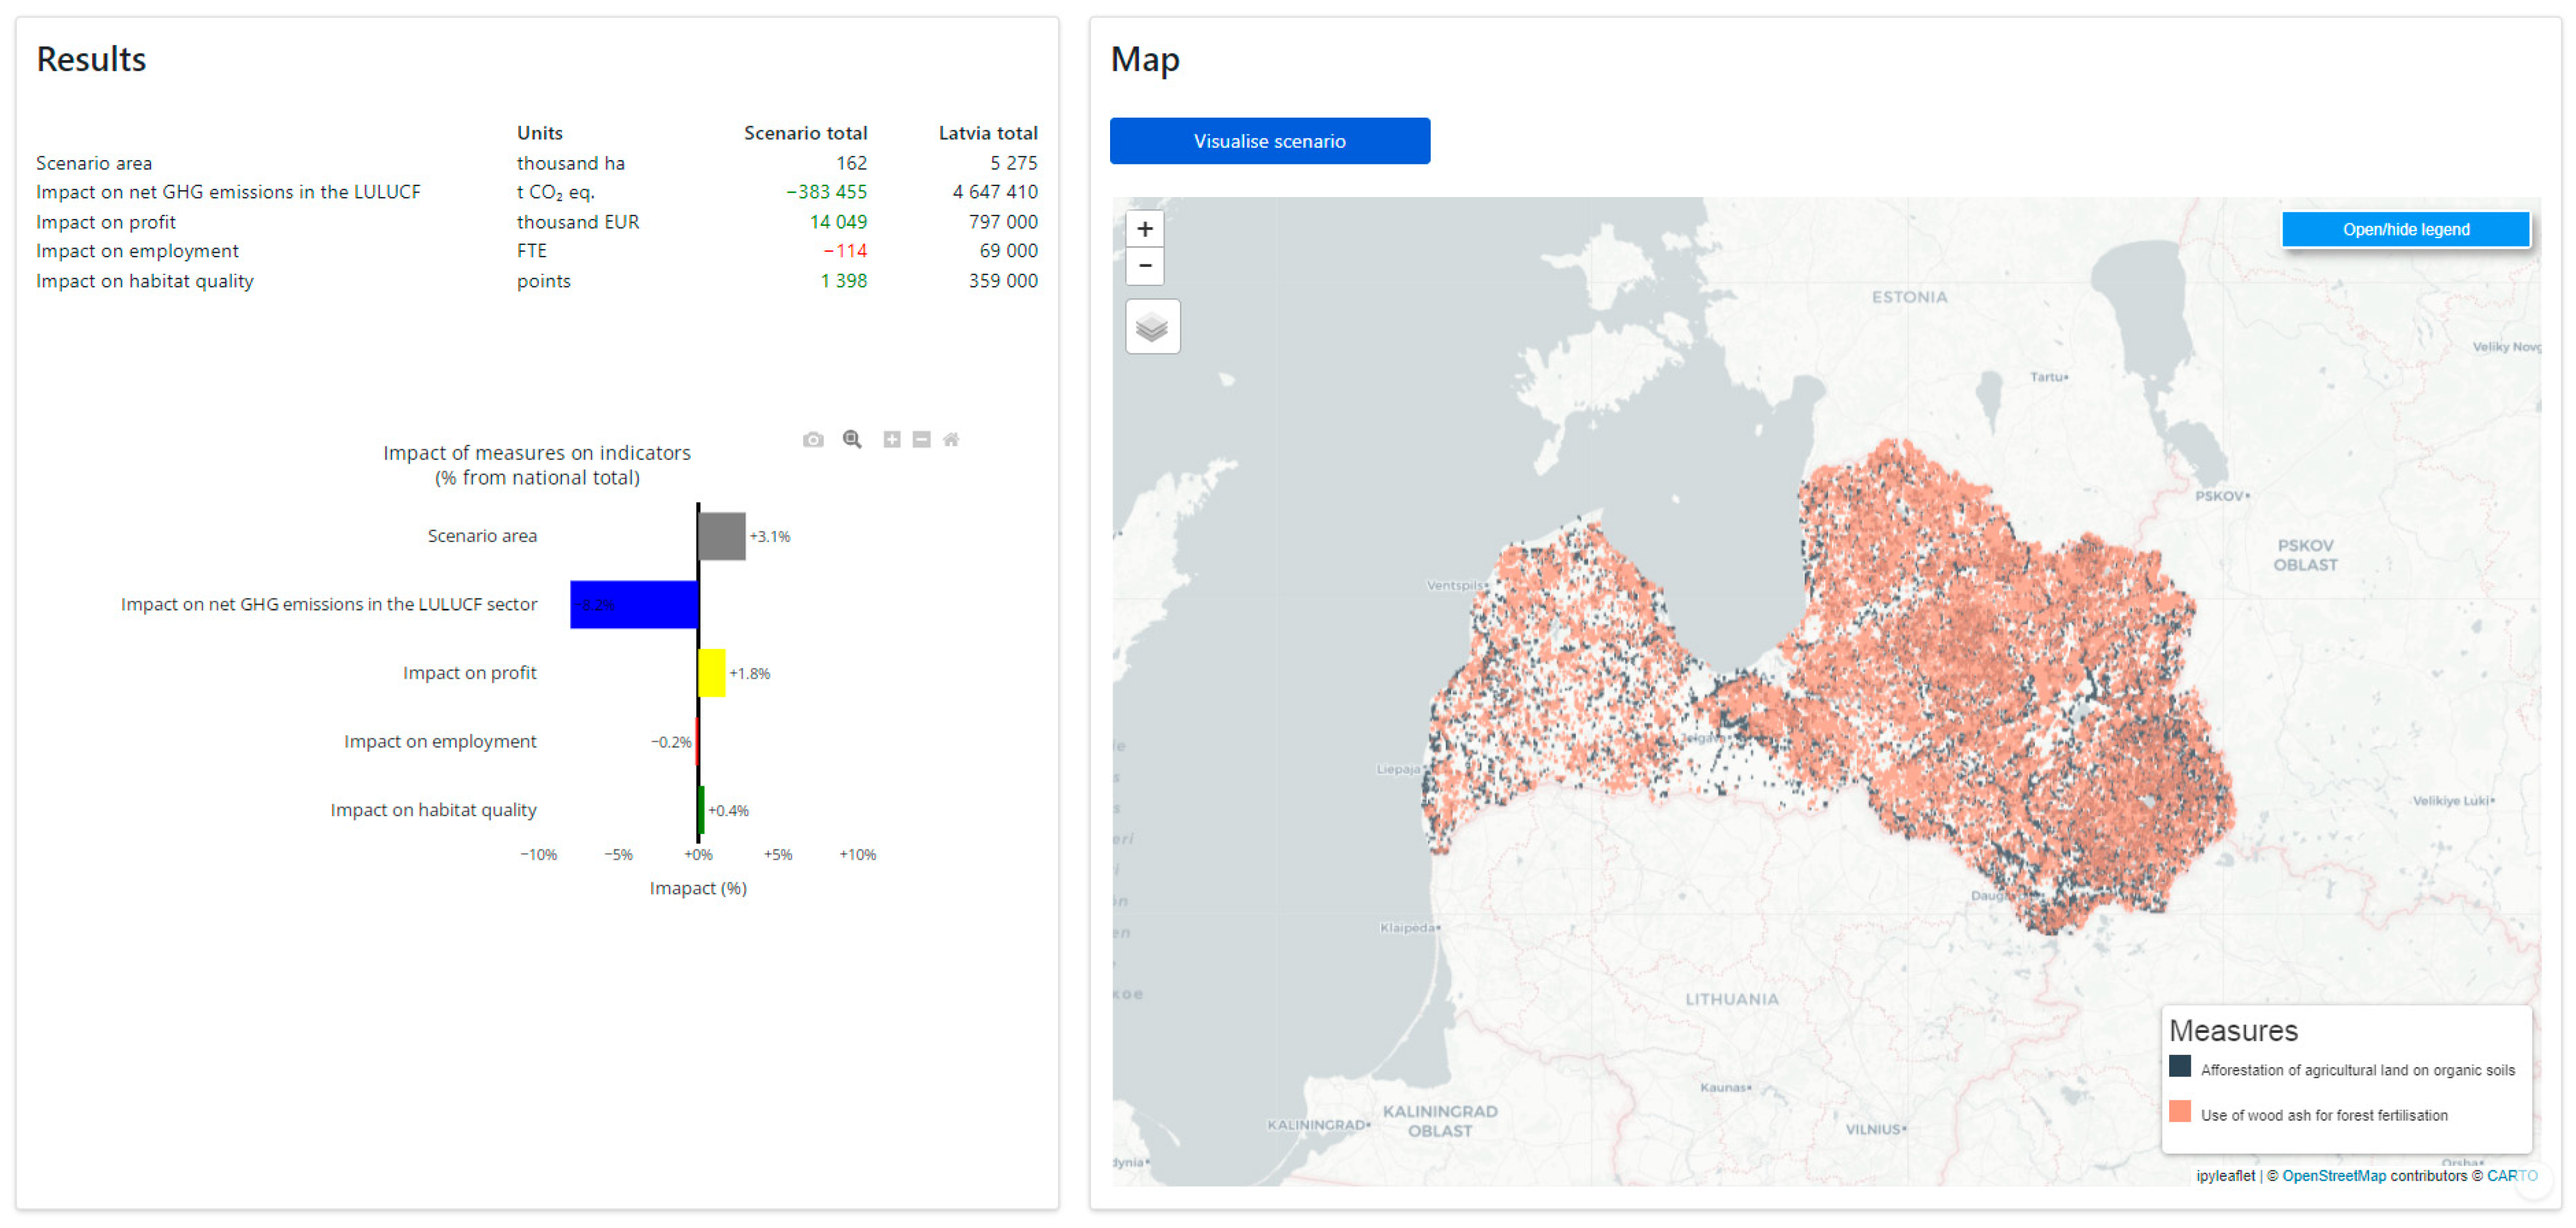
This appendix provides an overview of the LULUCF Decision Support Tool interface and illustrative examples of measure configuration, scenario setup, and outputs.
Figure A1. Main interface of the LULUCF Decision Support Tool.
Land 15 00758 g0a1
Figure A2. Example of configuration of an agricultural mitigation measure.
Land 15 00758 g0a2
Figure A3. Overview of selected policy measures and applied spatial criteria.
Land 15 00758 g0a3
Figure A4. Example of scenario outputs generated by the LULUCF Decision Support Tool.
Land 15 00758 g0a4

Appendix B

Table A1. Transferability of components of the LULUCF Decision Support Tool.
ComponentTransferabilityRole in FrameworkNotes on Adaptation
System architecture (PostgreSQL/PostGIS, Python, Shiny interface)Directly transferableCore system infrastructureNo modification required; can be deployed in different environments
Scenario construction workflowDirectly transferableScenario analysisGeneric logic for measure selection, spatial filtering, and aggregation
Spatial filtering and parcel selection logicDirectly transferableScenario analysisIndependent of region; depends only on input data structure
Aggregation of parcel-level resultsDirectly transferableScenario analysisSummation and aggregation logic remains unchanged
Land-use spatial datasetsRequires adaptationBaseline calculationMust be replaced with region-specific land-use maps
Soil, agriculture, and forest inventory data (soil type, crop type, land management system, farm size, land quality index, drainage structure, forest type, dominant tree species, site index, age class, management restrictions, etc.)Requires adaptationBaseline calculationRequires local datasets reflecting regional conditions
Parcel-level baseline indicators (GHG, profitability, employment, habitat quality)Requires adaptationBaseline calculationMust be recalculated using local data and methodologies
Per-hectare impact coefficientsRequires adaptationScenario analysisNeed recalibration based on regional conditions and policies
GHG accounting methodologyPartially transferableBaseline and scenario analysisBased on IPCC guidelines but adapted to national systems
Policy measures and assumptionsRequires adaptationScenario analysisMust reflect national policy frameworks and priorities

References

  1. Hurtt, G.C.; Chini, L.; Sahajpal, R.; Frolking, S.; Bodirsky, B.L.; Calvin, K.; Doelman, J.C.; Fisk, J.; Fujimori, S.; Klein Goldewijk, K.; et al. Harmonization of global land-use change and management for the period 850–2100 (LUH2) for CMIP6. Geosci. Model Dev. Discuss. 2020, 13, 5425–5464. [Google Scholar] [CrossRef] [Scilit]
  2. Amelung, W.; Bossio, D.; de Vries, W.; Kögel-Knabner, I.; Lehmann, J.; Amundson, R.; Bol, R.; Collins, C.; Lal, R.; Leifeld, J.; et al. Towards a global-scale soil climate mitigation strategy. Nat. Commun. 2020, 11, 5427. [Google Scholar] [CrossRef] [Scilit]
  3. Bossio, D.A.; Cook-Patton, S.C.; Ellis, P.W.; Fargione, J.; Sanderman, J.; Smith, P.; Wood, S.; Zomer, R.J.; von Unger, M.; Emmer, I.M.; et al. The role of soil carbon in natural climate solutions. Nat. Sustain. 2020, 3, 391–398. [Google Scholar] [CrossRef] [Scilit]
  4. Roe, S.; Streck, C.; Beach, R.; Busch, J.; Chapman, M.; Daioglou, V.; Deppermann, A.; Doelman, J.; Emmet-Booth, J.; Engelmann, J.; et al. Land-based measures to mitigate climate change: Potential and feasibility by country. Glob. Change Biol. 2021, 27, 6025–6058. [Google Scholar] [CrossRef] [Scilit]
  5. Pongratz, J.; Schwingshackl, C.; Bultan, S.; Obermeier, W.; Havermann, F.; Guo, S. Land use effects on climate: Current state, recent progress, and emerging topics. Curr. Clim. Change Rep. 2021, 7, 99–120. [Google Scholar] [CrossRef] [Scilit]
  6. UN. Paris Agreement. United Nations Framework Convention on Climate Change (UNFCCC). United Nations. 2015. Available online: https://unfccc.int/sites/default/files/english_paris_agreement.pdf (accessed on 12 July 2025).
  7. EC. The European Green Deal; COM(2019) 640 Final; European Commission: Brussels, Belgium, 2019. Available online: https://eur-lex.europa.eu/legal-content/EN/TXT/?uri=CELEX%3A52019DC0640 (accessed on 26 July 2025).
  8. Nabuurs, G.J.; Arets, E.J.M.M.; Schelhaas, M.J. Understanding the implications of the EU-LULUCF regulation for the wood supply from EU forests to the EU. Carbon Balance Manag. 2018, 13, 18. [Google Scholar] [CrossRef] [Scilit]
  9. Ellison, D.; Lundblad, M.; Petersson, H. Reforming the EU approach to LULUCF and the climate policy framework. Environ. Sci. Policy 2014, 40, 1–15. [Google Scholar] [CrossRef] [Scilit]
  10. Sellers, S.; Ebi, K.L.; Hess, J. Climate Change, Human Health, and Social Stability: Addressing Interlinkages. Environ. Health Perspect. 2019, 127, 45002. [Google Scholar] [CrossRef] [Scilit]
  11. Griscom, B.W.; Adams, J.; Ellis, P.W.; Houghton, R.A.; Lomax, G.; Miteva, D.A.; Schlesinger, W.H.; Shoch, D.; Siikamäki, J.V.; Smith, P.; et al. Natural climate solutions. Sustain. Sci. 2017, 114, 11645–11650. [Google Scholar] [CrossRef] [Scilit]
  12. Dagiliūtė, R.; Kazanavičiūtė, V. Impact of Land-Use Changes on Climate Change Mitigation Goals: The Case of Lithuania. Land 2024, 13, 131. [Google Scholar] [CrossRef] [Scilit]
  13. Doukas, H.; Nikas, A. Decision support models in climate policy. Eur. J. Oper. Res. 2020, 280, 1–24. [Google Scholar] [CrossRef] [Scilit]
  14. Stankovics, P.; Schillaci, C.; Pump, J.; Birli, B.; Ferraro, G.; Munafò, M.; Di Leginio, M.; Hermann, T.; Montanarella, L.; Tóth, G. A framework for co-designing decision-support systems for policy implementation: The LANDSUPPORT experience. Land Degrad. Dev. 2024, 35, 1902–1912. [Google Scholar] [CrossRef] [Scilit]
  15. Terribile, F.; Agrillo, A.; Bonfante, A.; Buscemi, G.; Colandrea, M.; D’ANtonio, A.; De Mascellis, R.; De Michele, C.; Langella, G.; Manna, P.; et al. A Web-based spatial decision supporting system for land management and soil conservation. Solid Earth 2015, 6, 903–928. [Google Scholar] [CrossRef] [Scilit]
  16. Terribile, F.; Bonfante, A.; D’Antonio, A.; De Mascellis, R.; De Michele, C.; Langella, G.; Manna, P.; Mileti, F.; Vingiani, S.; Basile, A. A geospatial decision support system for supporting quality viticulture at the landscape scale. Comput. Electron. Agric. 2017, 140, 88–102. [Google Scholar] [CrossRef] [Scilit]
  17. Terribile, F.; Acutis, M.; Agrillo, A.; Anzalone, E.; Azam-Ali, S.; Bancheri, M.; Baumann, P.; Birli, B.; Bonfante, A.; Botta, M.; et al. The LANDSUPPORT geospatial decision support system (S-DSS) vision: Operational tools to implement sustainability policies in land planning and management. Land Degrad. Dev. 2024, 35, 813–834. [Google Scholar] [CrossRef] [Scilit]
  18. Wenkel, K.O.; Berg, M.; Mirschel, W.; Wieland, R.; Nendel, C.; Köstner, B. LandCaRe DSS—An interactive decision support system for climate change impact assessment and the analysis of potential agricultural land use adaptation strategies. J. Environ. Manag. 2013, 127, S168–S183. [Google Scholar] [CrossRef] [Scilit]
  19. Hammond, E.B.; Coulon, F.; Hallett, S.H.; Thomas, R.; Hardy, D.; Kingdon, A.; Beriro, D.J. A critical review of decision support systems for brownfield redevelopment. Sci. Total Environ. 2021, 785, 147132. [Google Scholar] [CrossRef] [Scilit]
  20. Blower, J.D.; Gemmell, A.L.; Griffiths, G.H.; Haines, K.; Santokhee, A.; Yang, X. A Web Map Service implementation for the visualization of multidimensional gridded environmental data. Environ. Model. Softw. 2013, 47, 218–224. [Google Scholar] [CrossRef] [Scilit]
  21. Manna, P.; Bonfante, A.; Colandrea, M.; Di Vaio, C.; Langella, G.; Marotta, L.; Mileti, F.A.; Minieri, L.; Terribile, F.; Vingiani, S.; et al. A geospatial decision support system to assist olive growing at the landscape scale. Comput. Electron. Agric. 2020, 168, 105143. [Google Scholar] [CrossRef] [Scilit]
  22. Marano, G.; Langella, G.; Basile, A.; Cona, F.; De Michele, C.; Manna, P.; Teobaldelli, M.; Saracino, A.; Terribile, F. A geospatial decision support system tool for supporting integrated forest knowledge at the landscape scale. Forests 2019, 10, 690. [Google Scholar] [CrossRef] [Scilit]
  23. Li, X.; Chen, Y.; Li, D. A spatial decision support system for land-use structure optimization. WSEAS Trans. Comput. 2008, 8, 439–448. [Google Scholar]
  24. Tarasova, E.; Valentini, R.; Di Lallo, G.; Cotrina-Sanchez, A.; Chiriacò, M.V. Enhancing Carbon Sequestration: A Systematic Literature Review of Spatial Decision Support Tools. Sustainability 2024, 16, 5045. [Google Scholar] [CrossRef] [Scilit]
  25. Lacroix, P.; Moser, F.; Benvenuti, A.; Piller, T.; Jensen, D.; Petersen, I.; Planque, M.; Ray, N. MapX: An open geospatial platform to manage, analyze and visualize data on natural resources and the environment. SoftwareX 2019, 9, 77–84. [Google Scholar] [CrossRef] [Scilit]
  26. Tayyebi, A.; Meehan, T.D.; Dischler, J.; Radloff, G.; Ferris, M.; Gratton, C. SmartScape: A web-based decision support system for assessing the tradeoffs among multiple ecosystem services under crop-change scenarios. Comput. Electron. Agric. 2016, 121, 108–121. [Google Scholar] [CrossRef] [Scilit]
  27. Hernández, R.C.; Camerin, F. Assessment of Ecological Capacity for Urban Planning and Improving Resilience in the European Framework: An Approach Based on the Spanish Case. Cuad. Investig. Geogr. 2023, 49, 119–142. [Google Scholar] [CrossRef] [Scilit]
  28. Alogayell, H.M.; Alqahtani, A.M.; Alharbi, R.K. Spatial modeling of land resources and constraints to guide urban development in Saudi Arabia’s NEOM region using geomatics techniques. Front. Sustain. Cities 2024, 6, 1370881. [Google Scholar] [CrossRef] [Scilit]
  29. Wu, J.; Gan, W.; Chao, H.; Yu, P.S. Geospatial Big Data: Survey and Challenges. IEEE J. Sel. Top. Appl. Earth Obs. Remote Sens. 2024, 17, 17007–17020. [Google Scholar] [CrossRef] [Scilit]
  30. van Delden, H.; van Vliet, J.; Rutledge, D.T.; Kirkby, M.J. Comparison of scale and scaling issues in integrated land-use models for policy support. Agric. Ecosyst. Environ. 2011, 142, 18–28. [Google Scholar] [CrossRef] [Scilit]
  31. UN. Transforming Our World: The 2030 Agenda for Sustainable Development (A/RES/70/1). United Nations. 2015. Available online: https://sdgs.un.org/2030agenda (accessed on 2 August 2025).
  32. OECD. Better Policies for Sustainable Development 2016: A New Framework for Policy Coherence; OECD Publishing: Paris, France, 2016. [Google Scholar] [CrossRef] [Scilit]
  33. Veipane, U.D.; Pilvere, I.; Lilmets, J.; Bilande, K.; Nipers, A. Land Use and Production Practices Shape Unequal Labour Demand in Agriculture and Forestry. Land 2025, 14, 2097. [Google Scholar] [CrossRef] [Scilit]
  34. Bilande, K.; Zeglova, K.; Donis, J.; Nipers, A. Assessing Landscape-Level Biodiversity Under Policy Scenarios: Integrating Spatial and Land Use Data. Earth 2025, 6, 136. [Google Scholar] [CrossRef] [Scilit]
  35. Bilande, K.; Veipane, U.D.; Nipers, A.; Pilvere, I. A Framework for Profitability-Focused Land Use Transitions Between Agriculture and Forestry: A Case Study of Latvia. Land 2026, 15, 204. [Google Scholar] [CrossRef] [Scilit]
  36. IPCC. 2013 Supplement to the 2006 IPCC Guidelines for National Greenhouse Gas Inventories: Wetlands; Hiraishi, T., Krug, T., Tanabe, K., Srivastava, N., Baasansuren, J., Fukuda, M., Troxler, T.G., Eds.; IPCC: Geneva, Switzerland, 2014. [Google Scholar]
  37. IPCC. 2019 Refinement to the 2006 IPCC Guidelines for National Greenhouse Gas Inventories. Available online: https://www.ipcc.ch/report/2019-refinement-to-the-2006-ipcc-guidelines-for-national-greenhouse-gas-inventories/ (accessed on 25 July 2025).
  38. Latvia’s National Inventory Report. Greenhouse Gas Emissions in Latvia from 1990 to 2020 in Common Reporting Formats (CRF), Riga, 2022. Available online: https://www.google.com/url?sa=t&source=web&rct=j&opi=89978449&url=https://videscentrs.lvgmc.lv/files/Klimats/SEG_emisiju_un_ETS_monitorings/Zinojums_par_klimatu/SEG_zinojums/2022/LV_NIR_15042022.pdf&ved=2ahUKEwjB_Ivlr5KUAxXtJrkGHRwMKSQQFnoECBkQAQ&usg=AOvVaw0eKet-q2xLBDV5eCAsq9oX (accessed on 23 July 2025).
  39. Research “Development of a Methodology for Calculating GHG Emissions in the Agricultural Sector and Data Analysis with a Modeling Tool, Integrating Climate Change”, 2016, 141p. Available online: https://ppdb.mk.gov.lv/wp-content/uploads/2023/06/petijums_VARAM_2017_Lauksaimn_SEG_emisij_aprek_metodolog_un_datu_analiz_ar_model_riku_izstrad_integrej_klim_mainas.pdf (accessed on 23 July 2025). (In Latvian)
  40. 2006 IPCC Guidelines for National Greenhouse Gas Inventories. Available online: https://www.ipcc-nggip.iges.or.jp/public/2006gl/ (accessed on 12 July 2025).
  41. Latvia’s National Inventory Report. Greenhouse Gas Emissions in Latvia from 1990 to 2022 in Common Reporting Formats (CRF), Riga, 2024. Available online: https://www.google.com/url?sa=t&source=web&rct=j&opi=89978449&url=https://unfccc.int/sites/default/files/resource/LV_NID_31122024.pdf&ved=2ahUKEwj_3ZSXspKUAxV7e_UHHSKMK5kQFnoECBcQAQ&usg=AOvVaw2rHAd2FMu7Vx45Yi-qkatY (accessed on 23 July 2025).
  42. Donis, J.; Šņepsts, G.; Zdors, L.; Šēnhofs, R. Determination of Forest Stand Growth and Increment Using the Overestimated Forest Statistical Inventory Data. LVMI Silava, 2013. Available online: https://www.silava.lv/images/Petijumi/2011-LVM-Mezaudzu-augsanas-gaita/2013-LVM-Mezaudzu-augsanas-gaita-Parskats.pdf (accessed on 12 July 2025). (In Latvian)
  43. Neumann, M.; Godbold, D.L.; Hirano, Y.; Finer, L. Improving models of fine root carbon stocks and fluxes in European forests. J. Ecol. 2019, 10, 13328. [Google Scholar] [CrossRef] [Scilit] [PubMed]
  44. Yuan, Z.Y.; Chen, H.Y.H. Indirect Methods Produce Higher Estimates of Fine Root Production and Turonver rates than Direct Methods. PLoS ONE 2013, 7, e48989. [Google Scholar] [CrossRef] [Scilit]
  45. Lamlom, S.H.; Savidge, R.A. A reassessment of carbon content in wood: Variation within and between 41 Notrh American species. Biomass Bioenergy 2003, 25, 381–388. [Google Scholar] [CrossRef] [Scilit]
  46. Muukkonen, P.; Mäkipää, R. Empirical biomass models of understorey vegetation in boreal forests according to stand and site attributes. Boreal Environ. Res. 2006, 11, 355–369. [Google Scholar]
  47. Latvia’s National Energy and Climate Plan 2021–2030. Available online: https://commission.europa.eu/energy-climate-change-environment/implementation-eu-countries/energy-and-climate-governance-and-reporting/national-energy-and-climate-plans_en (accessed on 28 July 2025).
  48. Reidsma, P.; Tekelenburg, T.; van den Berg, M.; Alkemade, R. Impacts of Land-use Change on Biodiversity: An Assessment of Agricultural Biodiversity in the European Union. Agric. Ecosyst. Environ. 2006, 114, 86–102. [Google Scholar] [CrossRef] [Scilit]
  49. Handegard, E.; Gjerde, I.; Halvorsen, R.; Lewis, R.; Storaunet, K.O.; Sætersdal, M.; Skarpaas, O. How important is forest age in explaining the species composition of near-natural spruce forests? For. Ecol. Manag. 2024, 569, 122170. [Google Scholar] [CrossRef] [Scilit]
  50. Chorshanbiyev, F.; Abdullayev, O.; Khalilova, K.; Kodirova, K.; Xalimjanov, A.; Rakhimov, U.; Rakhimov, J. Study on species and age structure of forests: Optimization of forest stand completeness. In E3S Web of Conferences; EDP Sciences: Les Ulis, France, 2024; Volume 497, p. 03015. [Google Scholar] [CrossRef] [Scilit]
  51. RSS. Declared Areas by Farmers in 2024. Rural Support Service. 2024. Available online: https://data.gov.lv/dati/lv/dataset/lauksaimnieku-deklaretas-platibas-2024-gada (accessed on 16 July 2025). (In Latvian)
  52. NCA. Specially Protected Natural Areas. Nature Conservation Agency. 2024. Available online: https://data.gov.lv/dati/dataset/ipasi-aizsargajamas-dabas-teritorijas (accessed on 23 July 2025). (In Latvian)
  53. SPPS. Peat Soil Distribution Map. Map Developed Within the Framework of the Project “Improving Sustainable Soil Resource Management in Agriculture” (E2SOILAGRI). State Plant Protection Service. 2024. Available online: https://geolatvija.lv/main?geoproduct=open&geoProductId=285 (accessed on 30 July 2025). (In Latvian)
  54. SFS. State Forest Register Data. State Forest Services. 2024. Available online: https://data.gov.lv/dati/dataset/meza-valsts-registra-meza-dati (accessed on 5 August 2025). (In Latvian)
  55. Gago-Silva, A.; Ray, N.; Lehmann, A. Spatial Dynamic Modelling of Future Scenarios of Land Use Change in Vaud and Valais, Western Switzerland. ISPRS Int. J. Geo-Inf. 2017, 6, 115. [Google Scholar] [CrossRef] [Scilit]
  56. Teixeira, E.; Ausseil, A.G.; Burgueño, E.; Brown, H.; Cichota, R.; Davy, M.; Ewert, F.; Guo, J.; Holmes, A.; Holzworth, D.; et al. A spatial analysis framework to assess responses of agricultural landscapes to climates and soils at regional scale. In Landscape Modelling and Decision Support; Mirschel, W., Terleev, V., Wenkel, K.O., Eds.; Springer: Berlin/Heidelberg, Germany, 2020; Chapter 25. [Google Scholar] [CrossRef] [Scilit]
  57. Putrama, I.M.; Martinek, P. Heterogeneous data integration: Challenges and opportunities. Data Brief 2024, 56, 110853. [Google Scholar] [CrossRef] [Scilit]
  58. McIntosh, B.; Ascough, J.; Twery, M.; Chew, J.; Elmahdi, A.; Haase, D.; Harou, J.; Hepting, D.; Cuddy, S.; Jakeman, A.; et al. Environmental decision support systems (EDSS) development—Challenges and best practices. Environ. Model. Softw. 2011, 26, 1389–1402. [Google Scholar] [CrossRef] [Scilit]
  59. Pearman, O.; Cravens, A.E. Institutional barriers to actionable science: Perspectives from decision support tool creators. Environ. Sci. Policy 2022, 128, 317–325. [Google Scholar] [CrossRef] [Scilit]
Figure 1. Workflow and data flow architecture of the decision support tool.
Land 15 00758 g001
Figure 2. Relative impacts of two policy-oriented scenarios (S1 and S2) across net GHG emissions, profitability, employment, and habitat quality. Negative values indicate reductions relative to baseline, while positive values indicate increases.
Land 15 00758 g002
Table 1. Measures to reduce GHG emissions and improve carbon sequestration.
Policy MeasureObjectiveImplementation Requirements
Forest Land
Improvement of the hydrological regime in forests on waterlogged mineral soilsTo reduce soil moisture in waterlogged mineral soils to improve tree growth conditions, enhance CO2 sequestration, and increase timber yield.Suitable sites include mature forest stands in wet areas where excessive moisture periodically or continuously limits tree growth.
Improvement of the hydrological regime in forests on waterlogged organic soilsTo reduce soil moisture in waterlogged organic soils to improve tree growth conditions, enhance CO2 sequestration, and increase timber yield.Suitable sites include mature forest stands in peatland areas where excessive moisture periodically or continuously limits tree growth.
Use of wood ash for forest fertilisationTo promote additional wood growth and CO2 sequestration by improving soil fertility through the application of wood ash.Wood ash application is recommended in forests on drained organic soils with a site index from II to V, where the dominant tree species are pine, spruce, and birch.
Forest fertilisation with nitrogen mineral fertilisersTo promote additional wood growth and CO2 sequestration by improving soil fertility through the application of nitrogen mineral fertilisers.The use of mineral fertilisers is recommended in forests on dry and drained mineral soils, where the dominant tree species are pine, spruce, and birch.
Replacement of low-value broadleaved forest standsTo restore forest stands using high-quality, site-adapted planting material and to enhance CO2 sequestration through the implementation of sustainable forest management practices.Suitable stands include those dominated by lower-value broadleaved species such as birch, black alder, aspen, grey alder, elm, poplar, willow, goat willow, and bird cherry.
Thinning to improve species composition, enhance growth rates, and shorten the rotation cycleTo improve stand structure to reduce the risk of natural disturbances and enhance CO2 sequestration.Suitable sites include young stands on dry, wet, and drained mineral soils and on drained organic soils, where no pre-commercial thinning has been carried out.
Targeted restoration of forest stands damaged by natural disturbancesTo restore stands affected by natural disturbances to enhance CO2 sequestration.Suitable sites include disturbed stands on dry, wet, and drained mineral soils and on drained organic soils, where sanitary logging has been carried out.
Forest regeneration using commercially valuable species and varieties with higher CO2 sequestration potentialTo reduce the risk of natural disturbances to increase forest value and enhance CO2 sequestration.Suitable sites include forest stands on dry, wet, and drained mineral soils and on drained organic soils, where clear-cutting has been carried out as the final harvest.
Agricultural Land
Afforestation of agricultural land on organic soilsTo increase timber and biofuel production, reduce GHG emissions from the soil, and enhance CO2 sequestration.Suitable sites include agricultural lands with an organic matter content of at least 12%.
Afforestation of low-quality agricultural land on mineral soilsTo increase timber and biofuel production, reduce GHG emissions from the soil, and enhance CO2 sequestration.Suitable sites include agricultural lands with an organic matter content below 12% and a land quality index of not more than 35 points.
Monoculture plantations of fast-growing tree species on agricultural land (as an alternative to afforestation with native tree species)To produce timber and biofuel on lower-value agricultural land to promote CO2 sequestration.Suitable sites include agricultural lands on mineral soils with a land quality index of 30 points or less.
Establishment of small tree groups (<0.1 ha) in pasturesTo improve pasture conditions and produce timber and biofuel to enhance CO2 sequestration. Suitable sites include depressions in pasture landscapes with mineral or organic soils, where livestock regularly gather and require shelter and shade.
Restoration of natural, waterlogged forest ecosystems on organic soils in agricultural landsTo increase the production of timber and biofuel and to enhance CO2 sequestration.Suitable sites include agricultural lands with organic soils containing at least 12% organic matter, where drainage systems cannot be restored or maintained.
Conversion of croplands on organic soils into managed permanent grasslandsTo produce hay on agricultural land with organic soils to reduce GHG emissions from the soil and enhance CO2 sequestration in the plant biomass.Suitable sites include agricultural lands with organic soils where afforestation is not feasible.
Conversion of former peat extraction sites to agricultural land for the cultivation of large cranberry Vaccinium macrocarponConversion of former peat extraction sites to agricultural land for the cultivation of large cranberry (Vaccinium macrocarpon) to decrease GHG emissions from the soil.Sites featuring at least 0.5 m layer of raised bog peat, functional drainage, and road access are considered suitable.
Growing tall highbush blueberries Vaccinium corymbosum, in former peat extraction sitesConversion of former peat extraction sites to agricultural land for the cultivation of tall highbush blueberries (Vaccinium corymbosum) to decrease GHG emissions from the soil and promote CO2 assimilation in plant biomass.Sites featuring at least 0.5 m layer of raised bog peat, functional drainage, and road access are considered suitable.
Tree strip plantations along drainage systems and the roadside median stripTo diversify farm income and enhance CO2 sequestration, while reducing the risk of natural disturbances, and producing timber and biofuelSuitable sites include agricultural lands next to drainage ditches with sufficient area available to establish tree strips.
Table 2. Estimated per-hectare impacts of selected LULUCF mitigation measures on net GHG emissions, profitability, employment, and habitat quality.
MeasureNet GHG
Reduction,
t CO2 eq. ha−1
Impact on Profit, EUR ha−1Impact on Employment, hours ha−1Impact on Provision of Habitat Quality, Points ha−1
Forest Land
Improvement of the hydrological regime in forests on waterlogged mineral soils−7.703270.490.0100
Improvement of the hydrological regime in forests on waterlogged organic soils−7.902830.650.0100
Use of wood ash for forest fertilisation−1.00620.050.0100
Forest fertilisation with nitrogen mineral fertilisers−1.33370.060.0100
Replacement of low-value broadleaved forest stands−6.903221.74−0.0200
Thinning to improve species composition, enhance growth rates, and shorten the rotation cycle−1.00−80.490.0100
Targeted restoration of forest stands damaged by natural disturbances−3.90271.730.0300
Forest regeneration using commercially valuable species and varieties with higher CO2 sequestration potential−5.901831.750.0200
Agricultural Land
Afforestation of agricultural land on organic soils−12.19264−11.10−0.0013
Afforestation of low quality agricultural land on mineral soils−11.00391−23.890.0024
Monoculture plantations of fast-growing tree species on agricultural land (as an alternative to afforestation with native tree species)−12.00581−23.89−0.0076
Establishment of small tree groups (<0.1 ha) in pastures−4.98−28−14.16−0.0051
Restoration of natural, waterlogged forest ecosystems on organic soils in agricultural lands−5.0088−10.270.0006
Conversion of croplands on organic soils into managed permanent grasslands−1.21−72−13.520.0260
Conversion of former peat extraction sites to agricultural land for the cultivation of large cranberry Vaccinium macrocarpon−0.8027753.720.0100
Growing tall highbush blueberries Vaccinium corymbosum, in former peat extraction sites−0.90175.580.0100
Tree strip plantings along drainage systems and roads−14.605652.570.0300
Table 3. User filter options for agricultural and forest land.
Filter NameOptions
FOREST LAND
Forest growth conditions“Drained mineral soils”, “Drained organic soils”, “ Wet organic soils”, “ Dry mineral soils”, “Wet mineral soils”, “Unknown”
Forest typeHylocomiosa (Dm)”, “Dryopterioso–caricosa (Db)”, “Aegopodiosa (Gr)”, “Cladinoso–sphagnosa (Gs)”, “Myrtillosa (Ln)”, “Filipendulosa (Lk)”, “Vacciniosa (Mr)”, “Vacciniosa mel. (Am)”, “Vacciniosa turf. mel. (Km)”, “Caricoso–phragmitosa (Nd)”, “Mercurialiosa mel. (Ap)”, “Oxalidosa turf. mel. (Kp)”, “Sphagnosa (Pv)”, “Vaccinioso–sphagnosa (Mrs)”, “Myrtilloso–sphagnosa (Dms)”, “Myrtilloso–polytrichosa (Vrs)”, “Dryopteriosa (Grs)”, “Cladinoso–callunosa (Sl)”, “Myrtillosa mel. (As)”, “Myrtillosa turf.mel. (Ks)”, “Callunosa mel. (Av)”, “Callunosa turf. mel. (Kv)”, “Oxalidosa (Vr)”, “Unknown”
Dominant species“Aspen”, “Grey Alder”, “Birch”, “Spruce”, “Black Alder”, “Pine”, “Other”, “Unknown”
Site productivity index (“Ia” is the highest)“Ia”, “I”, “II”, “III”, “IV”, “V”, “Va”
Age group“Maturing stand”, “Young stand”, “Over-mature stand”, “Mature stand”, “Middle-aged stand”, “Unknown”
Region42 Latvian regions (“Aizkraukles novads”, “Aluksnes novads”, etc.)
Landscape region16 Latvian landscape regions (“Aiviekstes zeme”, “Augszeme”, etc.)
AGRICULTURAL LAND
Restrictions on economic activity“Any economic activity is prohibited”, “Site-specific conditions must be considered”, “No restrictions”
Field area“<=20 ha”, “200–100 ha”, “100–300 ha”, “>300 ha”
Agricultural system“Conventional system”, “Organic system”
Region42 Latvian regions (“Aizkraukles novads”, “Aluksnes novads”, etc.)
Landscape region16 Latvian landscape regions (“Aiviekstes zeme”, “Augszeme”, etc.)
Hydromorphic soil“Yes”, “No”
Soil type“Mineral”, “Organic”
Land quality index“0–5”, “5–10”, …, “80–85”
Crop group“Vegetables”, “Energy plants”, “Grains, oilseeds, pulses”, “Plantings perennial”, “Grasses perennial”, “Grasses arable”, “Potatoes”, “Fallow”, “Other”
Table 4. Policy-oriented scenarios, area selection criteria, and comparison of NECP indicative areas with areas selected in the LULUCF Decision Support Tool.
Policy MeasureArea selection CriteriaNECP Indicative Area
(thousand ha)
Selected Area in LULUCF Decisions Support Tool
(thousand ha)
Scenario S1
PM1: Improvement of the hydrological regime in forests on waterlogged mineral soilsAge group: young stand; middle-aged stand8078
PM2: Use of wood ash for forest fertilisationSite index: IV, V21.818
PM3: Forest fertilisation with nitrogen mineral fertilisersSite index: III, IV, V;
Age group: middle-aged stand
2134
PM4: Forest regeneration using commercially valuable species and varieties with higher CO2 sequestration potentialForest growth conditions: drained organic soils1514
Scenario S2
PM5: Afforestation of agricultural land on organic soilsLand quality index: 0–5; 5–10; 10–15; 15–20; 20–25; 25–30; 30–354055
PM6: Restoration of natural, waterlogged forest ecosystems on organic soils in agricultural landsField area: <=20 ha;
Land quality index: 0–5; 5–10; 10–15; 15–20; 20–25; 25–30; 30–35
4038
Table 5. Absolute effects of selected measures across scenarios S1 and S2, including total affected area, net GHG reduction, profitability, employment, and habitat quality.
CriteriaS1S2
PM1PM2PM3PM4PM5PM6
Total area, thousand ha78.3018.3134.1114.0555.2038.86
Net GHG reduction, kt CO2 eq.602.9418.3145.3782.91672.84194.30
Profitability effects, thousand EUR25,605.571134.981262.232571.6314,571.773419.68
Employment effects, FTE21.690.571.1613.97−332.83−216.99
Habitat quality effects, points783.05183.06341.14281.05−71.7523.32
Disclaimer/Publisher’s Note: The statements, opinions and data contained in all publications are solely those of the individual author(s) and contributor(s) and not of MDPI and/or the editor(s). MDPI and/or the editor(s) disclaim responsibility for any injury to people or property resulting from any ideas, methods, instructions or products referred to in the content.