Digital Soil Mapping of Soil Macronutrients (N, P, K) in Emilia-Romagna (NE Italy): A Regional Baseline for the EU Soil Monitoring Law
Abstract
1. Introduction
- Produce and validate maps of N, P, and K concentrations and their associated uncertainty using Quantile Random Forests.
- Identify the environmental covariates that most strongly influence the spatial patterns of each nutrient.
- Critically compare our regional maps with the existing LUCAS-based continental maps to quantify discrepancies and evaluate the implications for regional soil health assessment within the framework of the proposed EU Soil Monitoring Law.
2. Materials and Methods
2.1. Study Area: Climate, Soils, and Land Uses
2.2. Soil Macronutrient Data
2.3. Digital Soil Mapping
2.4. Postprocessing of Results and Comparison of DSM Outputs at the Regional and the EU Scale
3. Results
3.1. Nitrogen Content
3.2. Potassium Content
3.3. Phosphorus Content
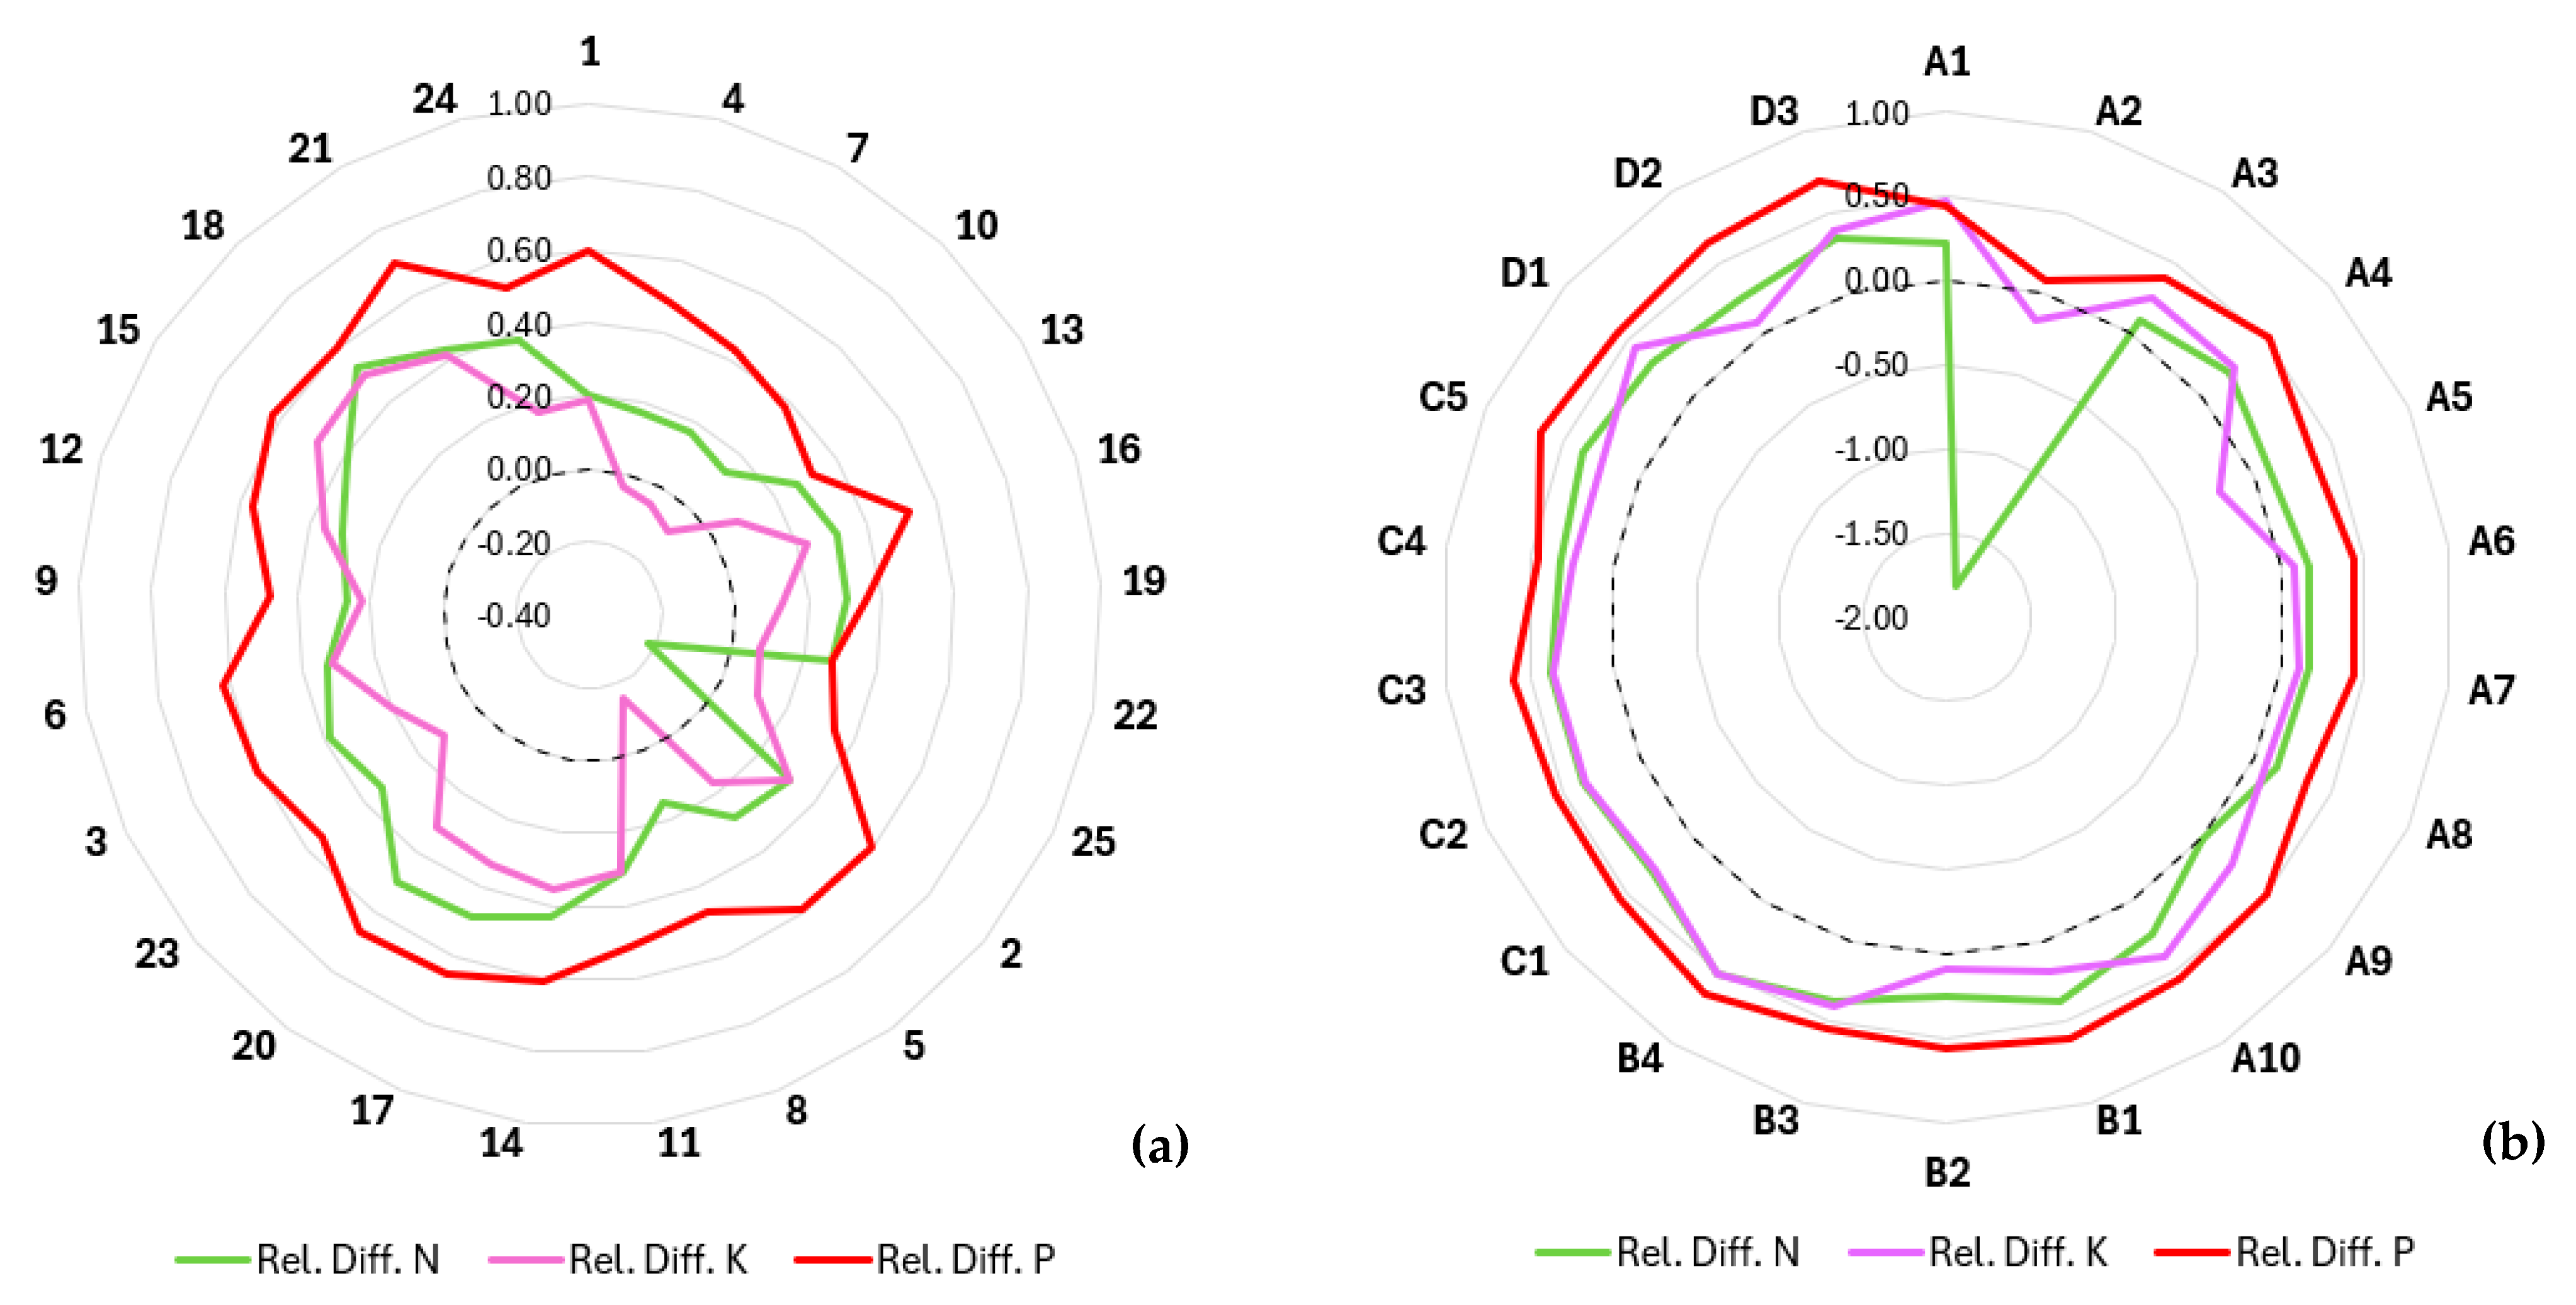
3.4. Comparing LUCAS and Regional Macronutrients Maps
4. Discussion
4.1. Model Performance and Covariate Interpretation
4.2. Root Causes of the LUCAS–RER Discrepancy and Its DSM Implications
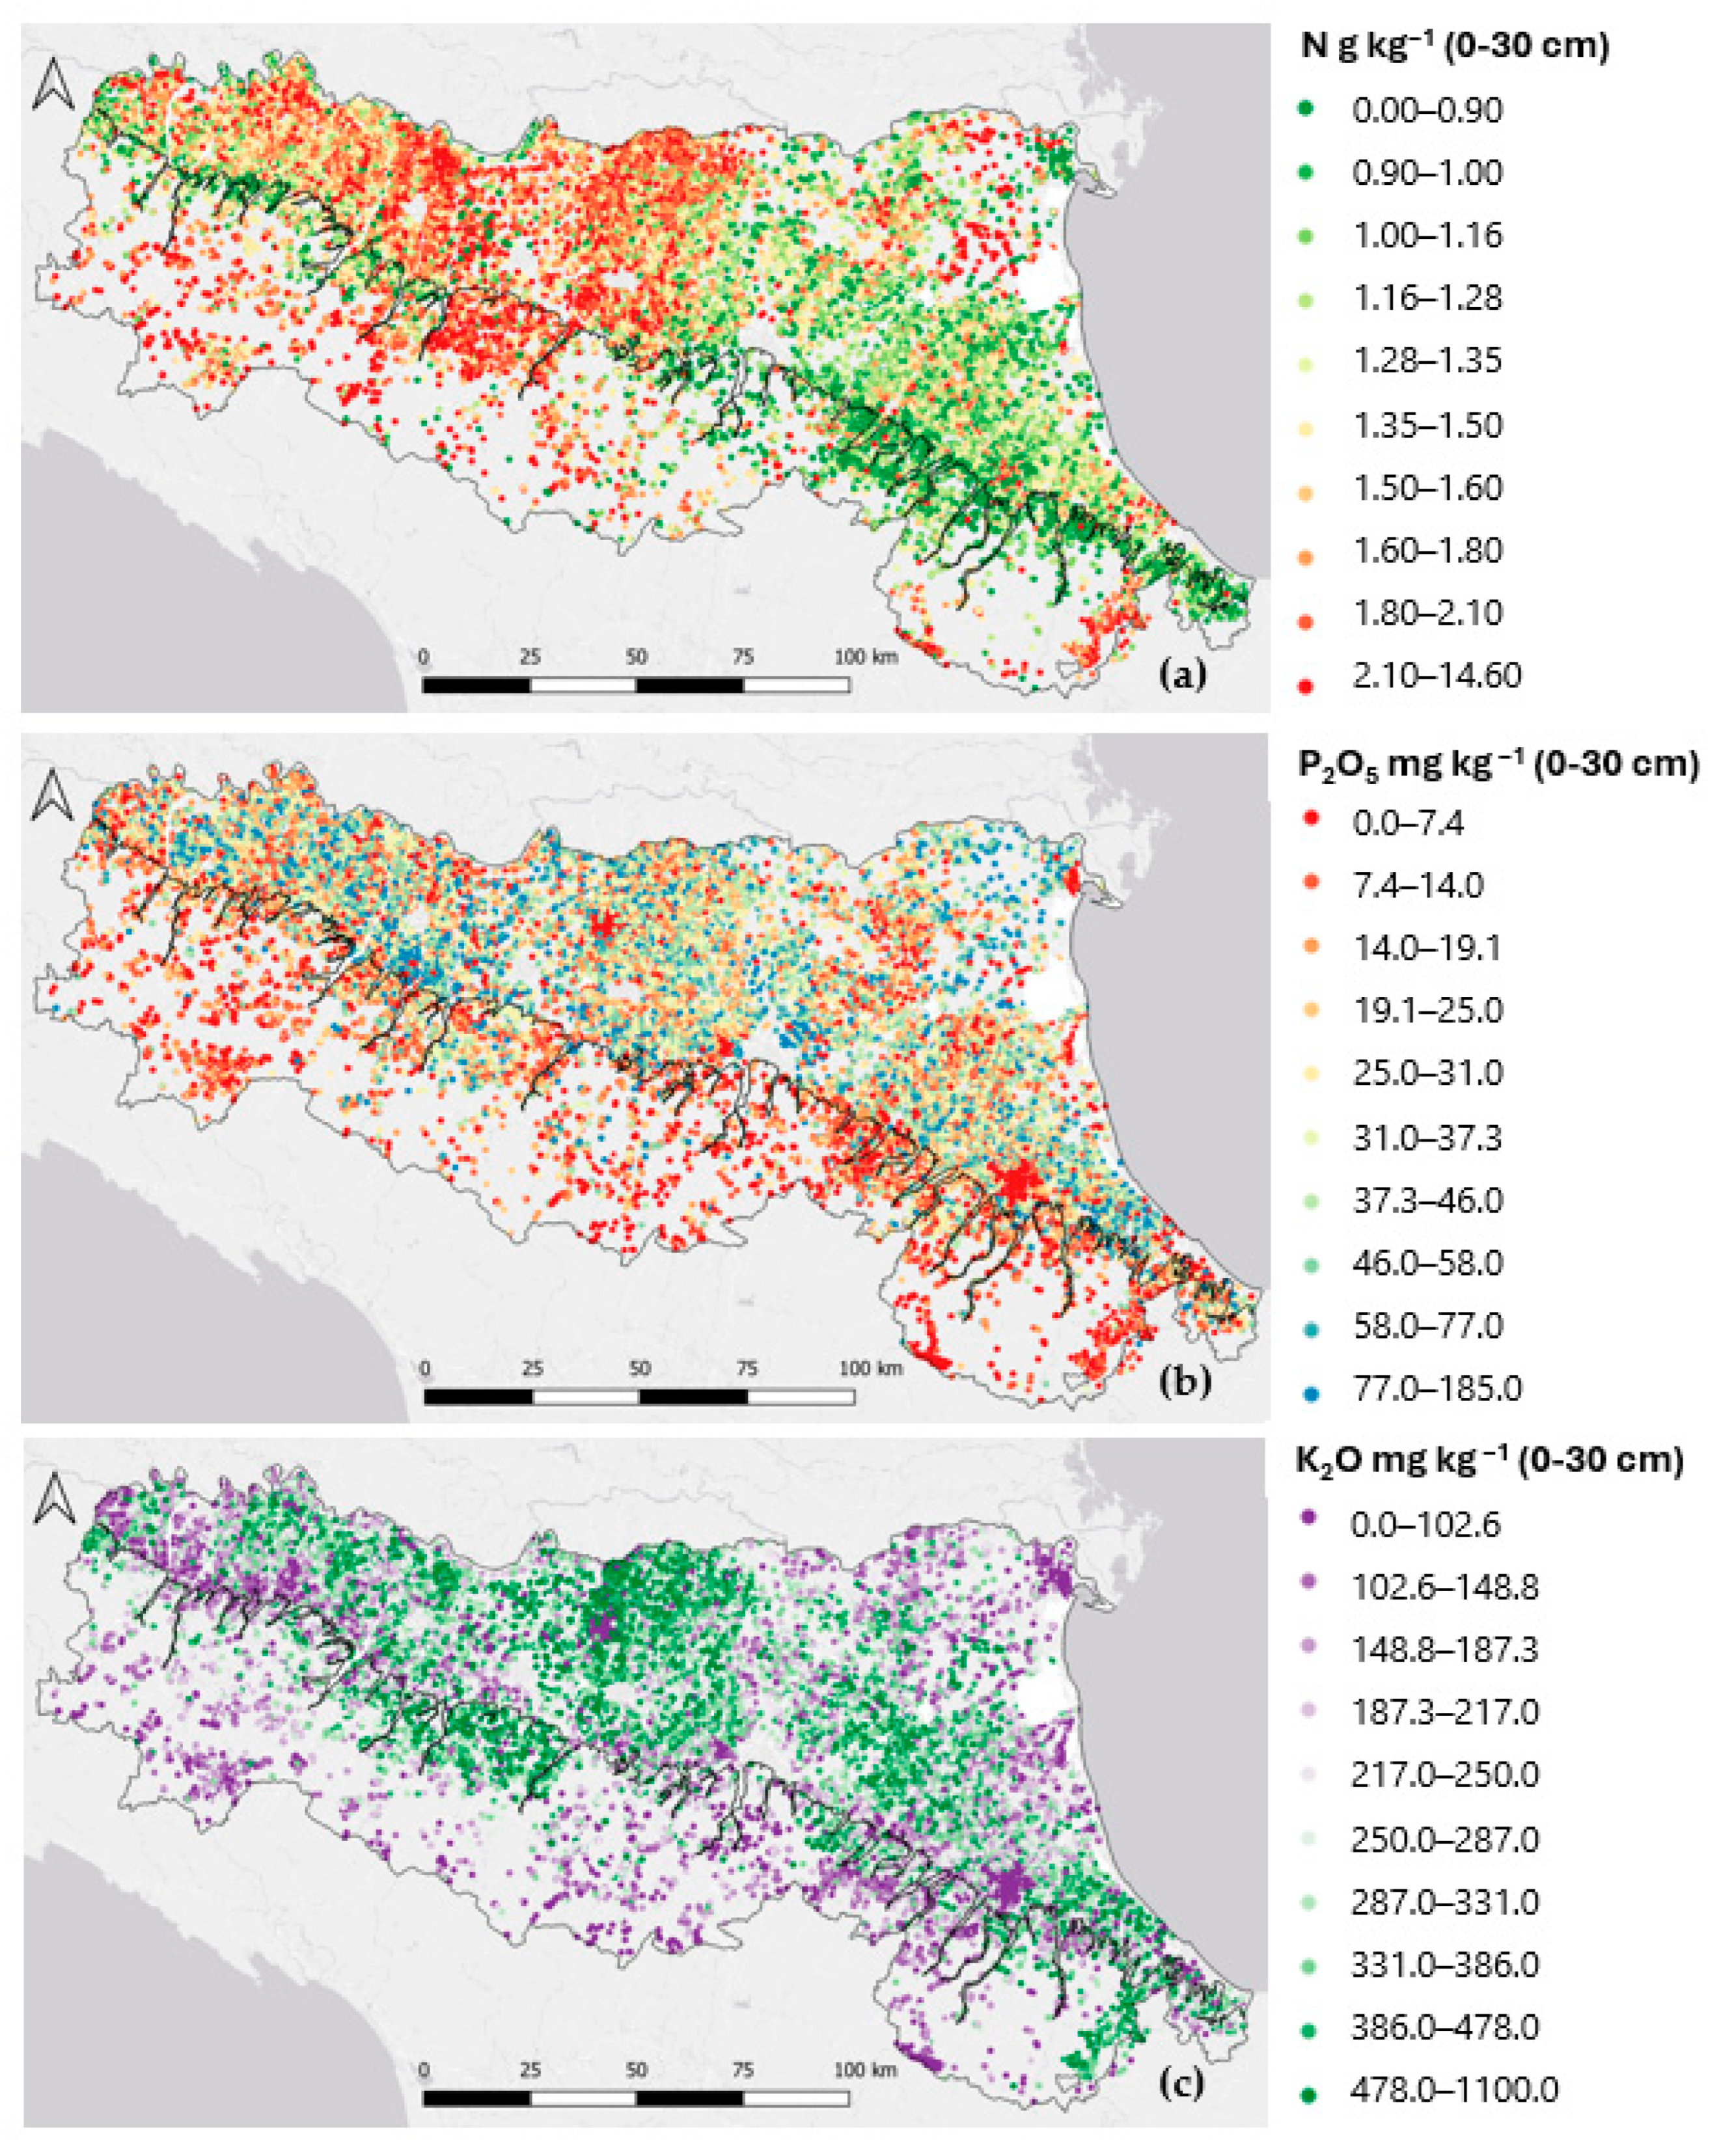
- Sampling density: the fundamental difference in observation density, LUCAS (~1.5 sample/200 km2) versus RER (~1.6 samples/km2), is the most critical factor. The RER dataset’s high density allows it to capture local variability and nutrient cold spots and hotspots that are statistically invisible at the LUCAS sampling density. It is noteworthy that recent research highlighted that for most soil properties, macronutrients included, the differences in survey design and sampling protocols between LUCAS and Italian methods did not lead to significant differences, showing consistency among the different sampling procedures [57].
- Scale of covariates and model generalization: continental-scale models like LUCAS necessarily rely on covariates at a coarser resolution and must generalize across vastly different pedo-climatic regions. This process inherently smooths out extremes. Our regional model, using higher-resolution predictors tailored to the local context, preserves this critical fine-scale variation.
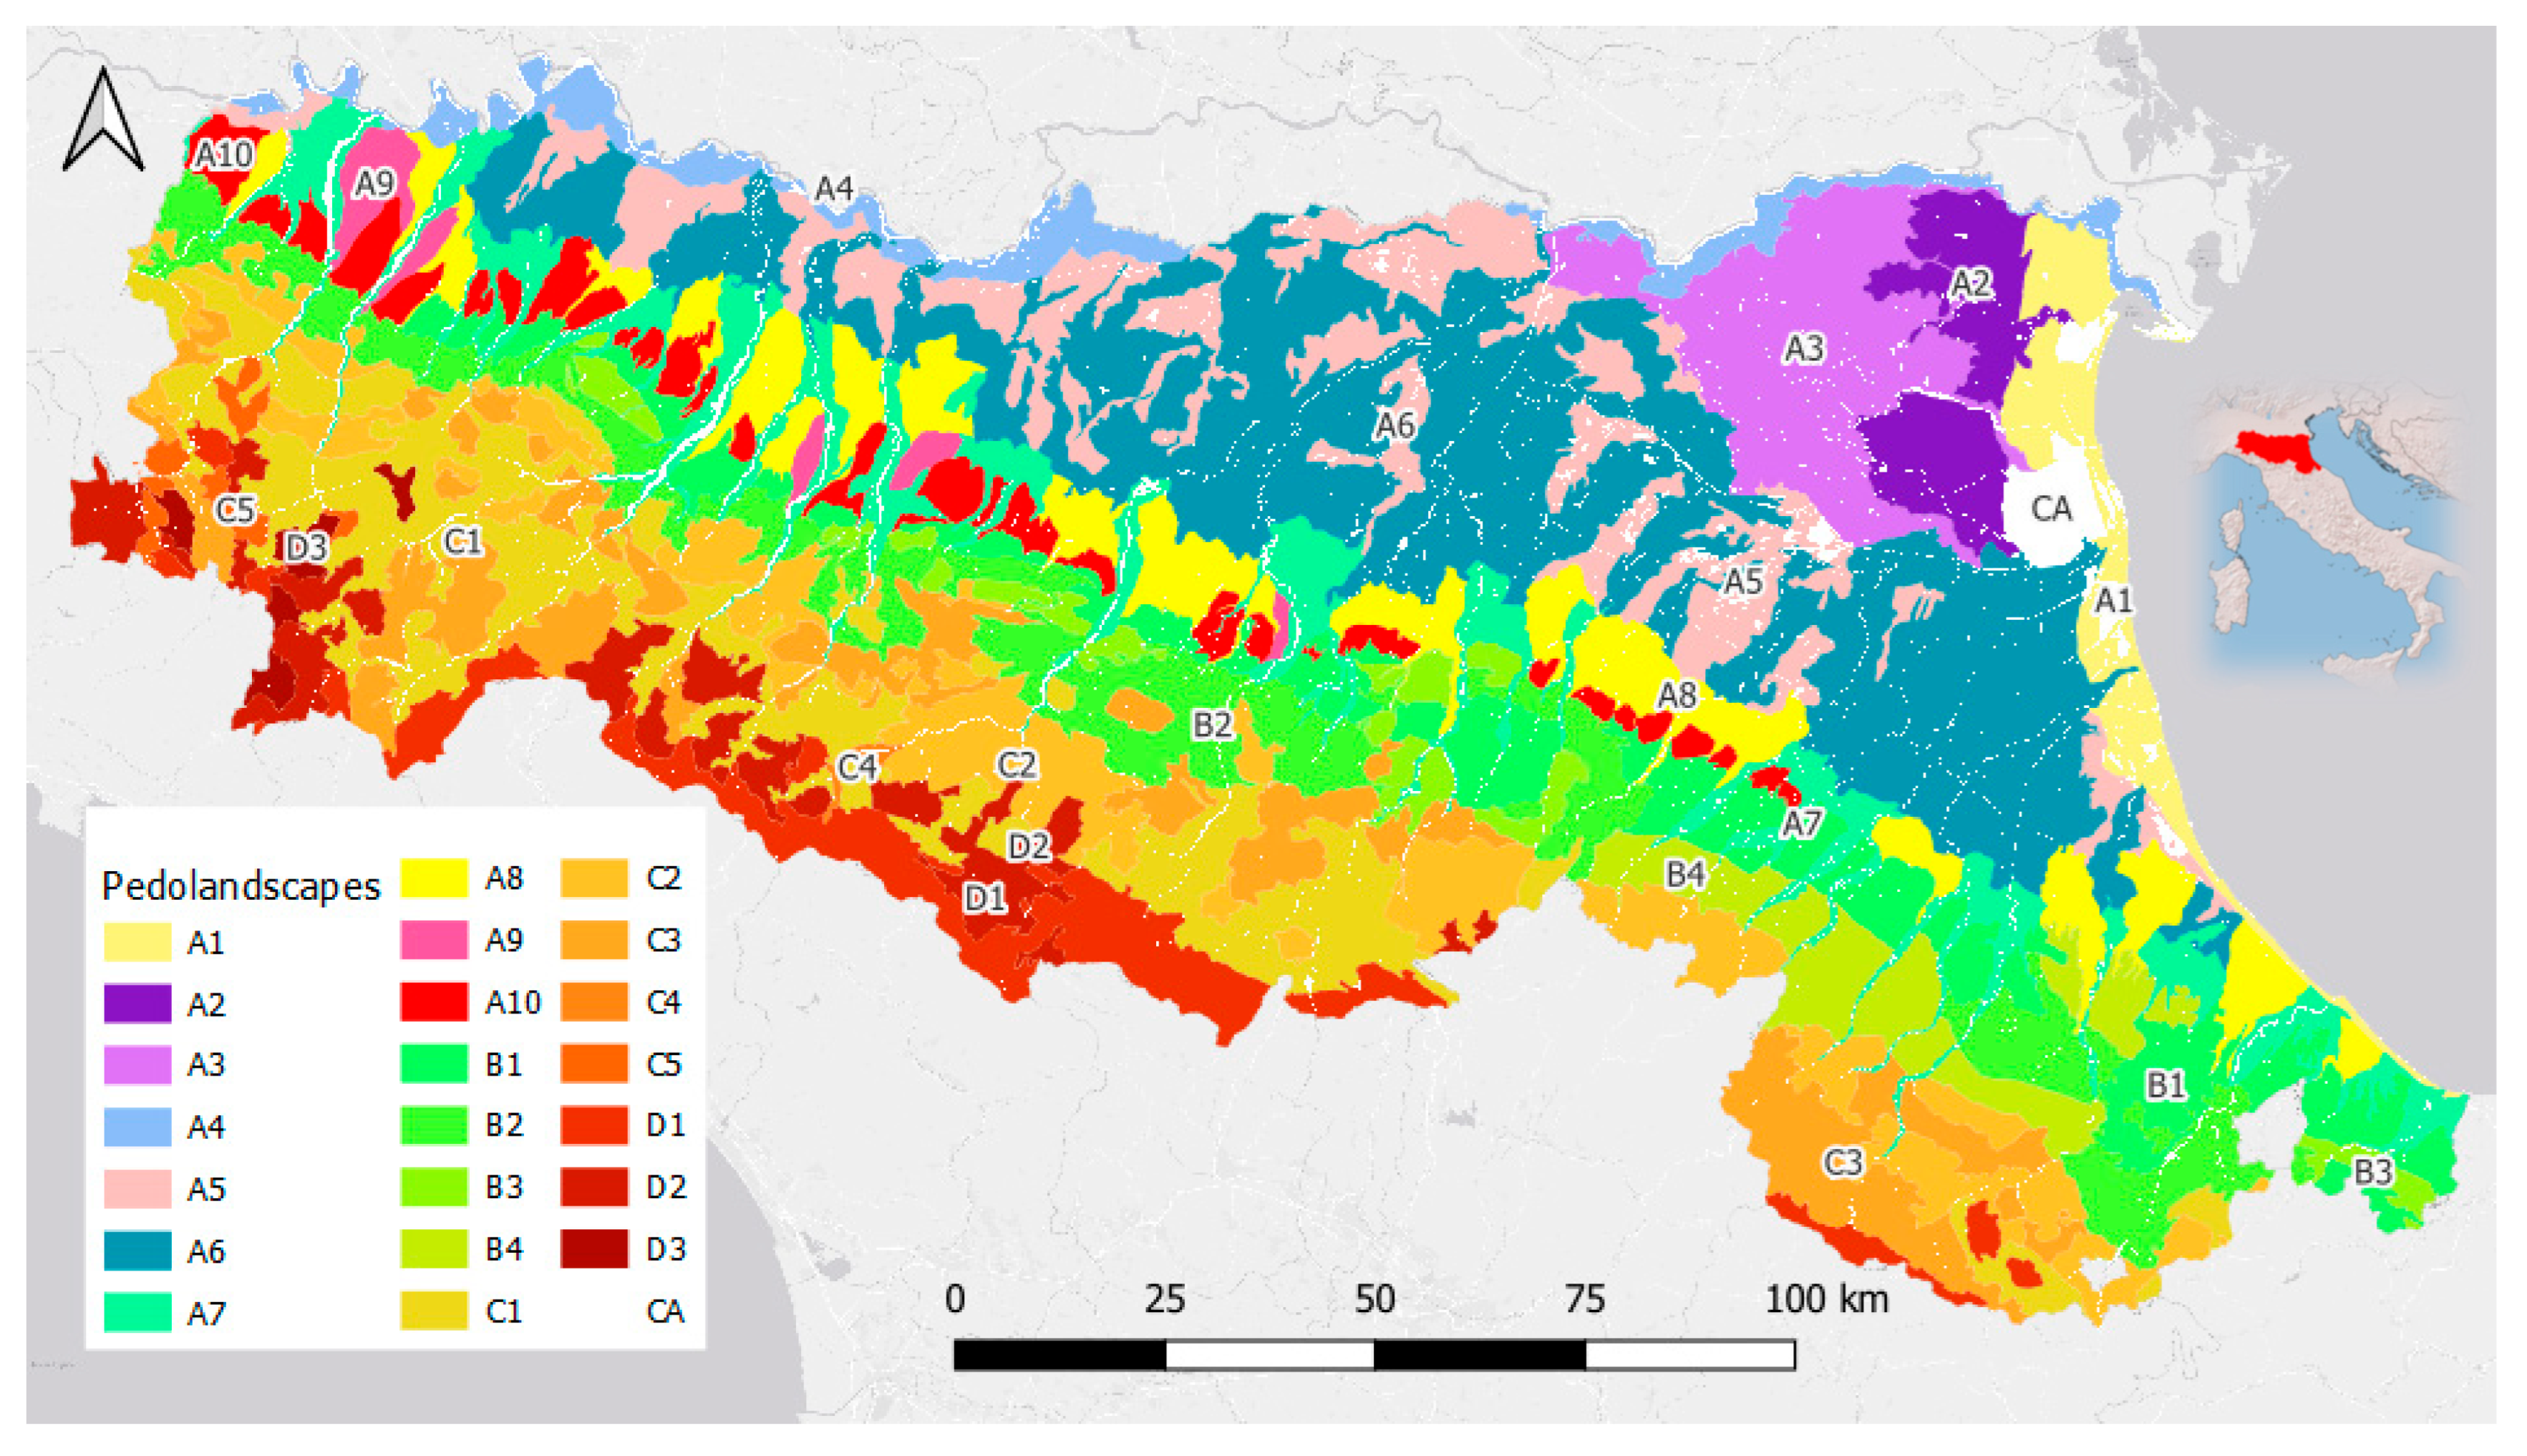
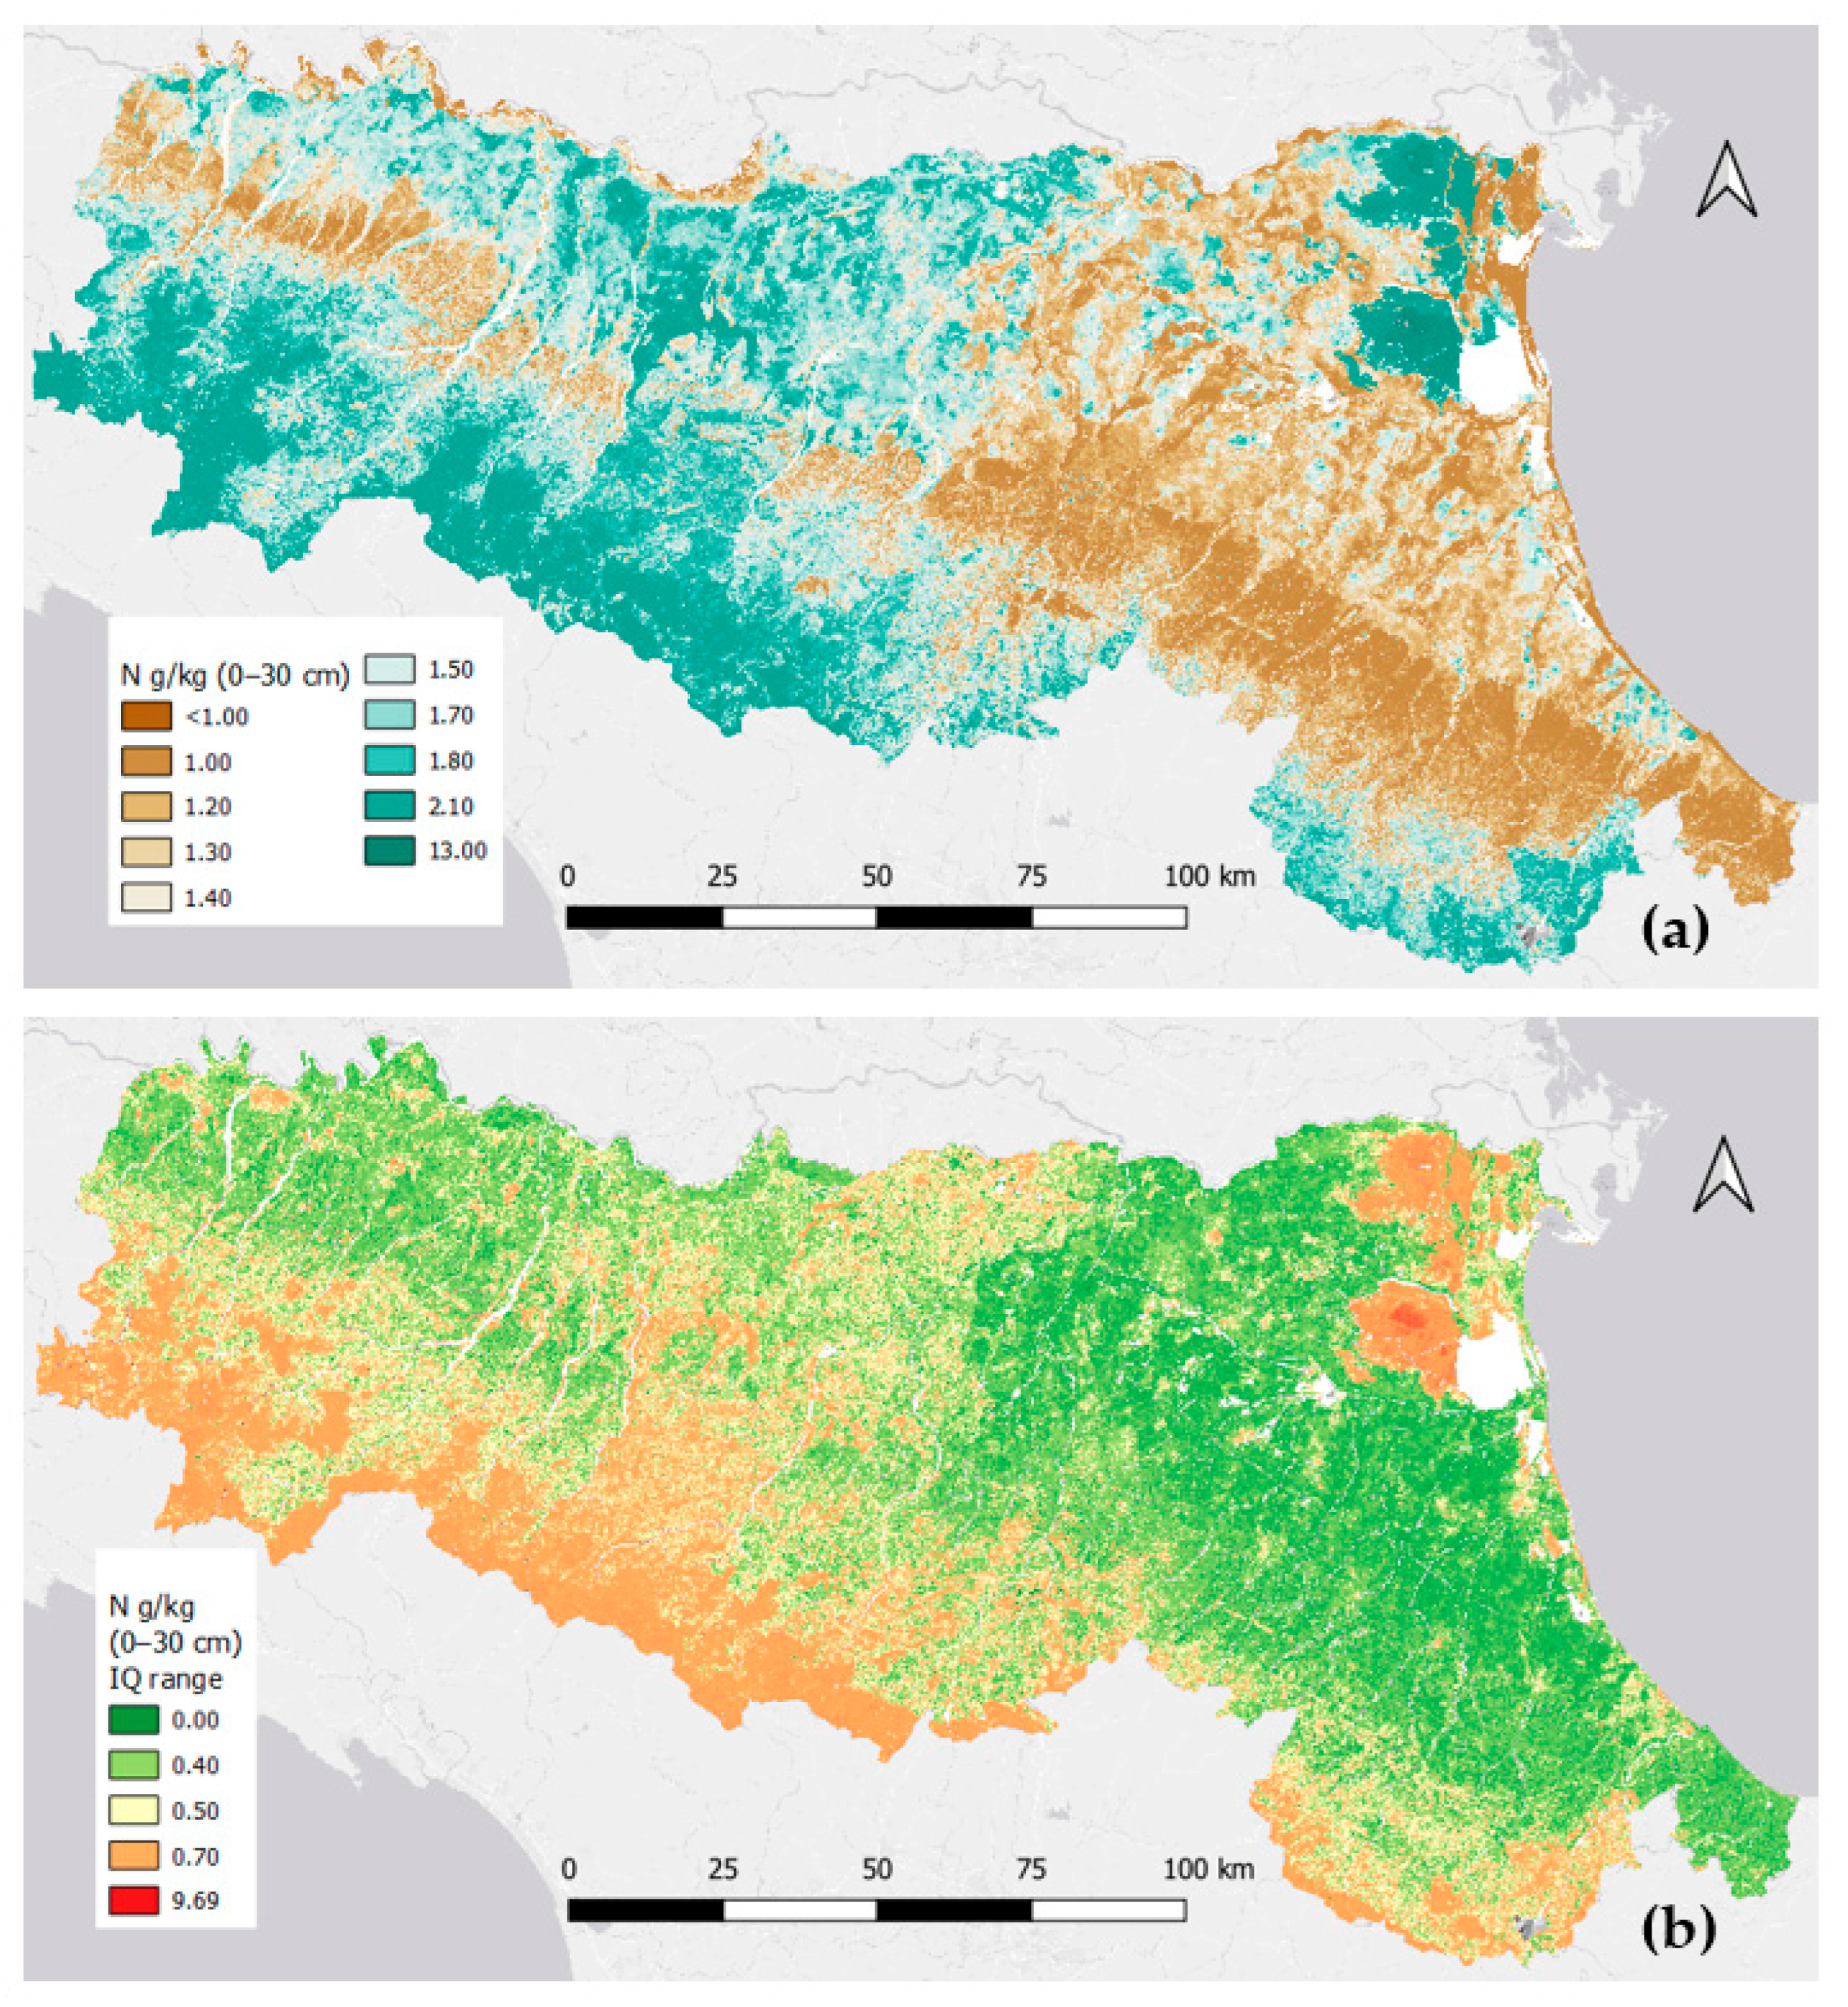
- Inability to capture specific pedolandscape units: a telling example is the failure of the LUCAS-based map to identify the high N concentrations in the organic soils of the lower Po delta plain (pedolandscape A2). This unit, covering over 500 km2, contains distinct soil types characterized by organic horizons (e.g., Histic Humaquepts and Typic Sulfisaprists) that greatly affect nutrient levels. Continental models lack the contextual knowledge and data density to represent such specific, yet extensive, features.
4.3. Direct Implications for the EU Soil Monitoring Law and Regional Soil Management
- LUCAS baseline: would classify 92.8% of the plain and 25.0% of the Apennines as exceeding the admissible concentration.
- RER baseline: suggests only 16.05% of the plain and 0.11% of the Apennines are above this threshold.
4.4. Communication of Uncertainty and Study Limitations
5. Conclusions
- The DSM approach using Quantile Random Forests proved highly effective, with models demonstrating excellent performance (R2 ≥ 0.9) and identifying soil organic carbon and texture as the dominant controls on macronutrient spatial patterns.
- A critical comparison with the continental-scale LUCAS-based maps revealed significant systematic overestimations by LUCAS, particularly for phosphorus (48% at regional level), and a failure to detect important local features, such as nutrient hotspots in organic soils.
- The root of this discrepancy lies in the extremely different sampling densities, the scale of environmental covariates, and the inability of continental models to capture specific soil–landscape relationships.
- The practical implications are substantial: the choice of baseline data dramatically alters the assessment of soil quality against regulatory thresholds, as demonstrated for the EU Soil Monitoring Law. Relying solely on continental-scale data for regional policy implementation carries a high risk of misinformed decisions.
Supplementary Materials
Author Contributions
Funding
Data Availability Statement
Acknowledgments
Conflicts of Interest
Abbreviations
| AE | Absolute Error |
| EC | European Commission |
| EPSG | European Petroleum Survey Group |
| EU | European Union |
| DEM | Digital Elevation Model |
| DSM | Digital Soil Mapping |
| IoA | Index of Agreement |
| IQ range | Interquartile range |
| ISO | International Organization for Standardization |
| LUCAS | Land Use/Cover Area frame statistical Survey |
| LULC | Land Use Land Cover class(es) |
| ME | Mean Error |
| ML | Machine Learning |
| MS | Member States |
| NDVI | Normalized Difference Vegetation Index |
| NDSI | Normalized Difference Soil Index |
| NDWI | Normalized Difference Water Index |
| NUTS | Nomenclature of Territorial Units for Statistics |
| QRF | Quantile Random Forest |
| RER | Regione Emilia-Romagna |
| RFE | Recursive Feature Elimination |
| RMSE | Rooted Mean Square Error |
| RUSLE | Revised Universal Soil Loss Equation |
| SML | Soil Monitoring Law |
| SOSI | Soil Salinity Index |
References
- Arias-Navarro, C.; Baritz, R.; Jones, A. (Eds.) The State of Soils in Europe—Fully Evidenced, Spatially Organized Assessment of the Pressures Driving Soil Degradation; Publications Office of the European Union: Luxembourg, 2024. [Google Scholar] [CrossRef]
- Soil Monitoring in Europe-Indicators and Thresholds for Soil Health Assessments; EEA Report 08/2022; European Environment Agency: Copenhagen, Denmark, 2023. [CrossRef]
- White, A.; Faulkner, J.W.; Conner, D.; Barbieri, L.; Adair, E.C.; Niles, M.T.; Mendez, V.E.; Twombly, C.R. Measuring the Supply of Ecosystem Services from Alternative Soil and Nutrient Management Practices: A Transdisciplinary, Field-Scale Approach. Sustainability 2021, 13, 10303. [Google Scholar] [CrossRef]
- Hou, D. Soil health and ecosystem services. Soil Use Manag. 2023, 39, 1259–1266. [Google Scholar] [CrossRef]
- Van Groenigen, J.W.; Van Kessel, C.; Hungate, B.A.; Oenema, O.; Powlson, D.S.; Van Groenigen, K.J. Sequestering Soil Organic Carbon: A Nitrogen Dilemma. Environ. Sci. Technol. 2017, 51, 4738–4739. [Google Scholar] [CrossRef]
- Oenema, O.; van Liere, L.; Schoumans, O. Effects of lowering nitrogen and phosphorus surpluses in agriculture on the quality of groundwater and surface water in the Netherlands. J. Hydrol. 2005, 304, 289–301. [Google Scholar] [CrossRef]
- Vigiak, O.; Udías, A.; Grizzetti, B.; Zanni, M.; Aloe, A.; Weiss, F.; Hristov, J.; Bisselink, B.; de Roo, A.; Pistocchi, A. Recent regional changes in nutrient fluxes of European surface waters. Sci. Total Environ. 2023, 858, 160063. [Google Scholar] [CrossRef]
- Pandao, M.R.; Akshay, A.T.; Rupeshkumar, J.C.; Nagesh, R.N.; Dhananjay, D.S.; Sindhu, R.R. Soil Health and Nutrient Management. Int. J. Plant Soil Sci. 2024, 36, 873–883. [Google Scholar] [CrossRef]
- Țopa, D.-C.; Căpșună, S.; Calistru, A.-E.; Ailincăi, C. Sustainable Practices for Enhancing Soil Health and Crop Quality in Modern Agriculture: A Review. Agriculture 2025, 15, 998. [Google Scholar] [CrossRef]
- Virto, I.; Imaz, M.J.; Fernández-Ugalde, O.; Gartzia-Bengoetxea, N.; Enrique, A.; Bescansa, P. Soil Degradation and Soil Quality in Western Europe: Current Situation and Future Perspectives. Sustainability 2015, 7, 313–365. [Google Scholar] [CrossRef]
- Zhang, S. Heterogeneity of Soil Nutrients: A Review of Methodology, Variability and Impact Factors. J. Environ. Earth Sci. 2019, 1, 6–28. [Google Scholar] [CrossRef]
- European Commission. Proposal for a Directive on Soil Monitoring and Resilience. 416 (Final). 2023. Available online: https://environment.ec.europa.eu/publications/proposal-directive-soil-monitoring-and-resilience_en (accessed on 5 July 2025).
- Panagos, P.; Jones, A.; Lugato, E.; Ballabio, C. A Soil Monitoring Law for Europe. Glob. Chall. 2025, 9, 2400336. [Google Scholar] [CrossRef]
- McBratney, A.B.; Mendonça Santos, M.L.; Minasny, B. On digital soil mapping. Geoderma 2003, 117, 3–52. [Google Scholar] [CrossRef]
- Wadoux, A.M.C.; Minasny, B.; McBratney, A.B. Machine learning for digital soil mapping: Applications, challenges and suggested solutions. Earth-Sci. Rev. 2020, 210, 103359. [Google Scholar] [CrossRef]
- Arrouays, D.; McBratney, A.; Bouma, J.; Libohova, Z.; Richer-de-Forges, A.C.; Morgan, C.L.S.; Roudier, P.; Poggio, L.; Mulder, V.L. Impressions of digital soil maps: The good, the not so good, and making them ever better. Geoderma Reg. 2020, 20, e00255. [Google Scholar] [CrossRef]
- Ballabio, C.; Lugato, E.; Fernández-Ugalde, O.; Orgiazzi, A.; Jones, A.; Borrelli, P.; Montanarella, L.; Panagos, P. Mapping LUCAS topsoil chemical properties at European scale using Gaussian process regression. Geoderma 2019, 355, 113912. [Google Scholar] [CrossRef]
- Implementation of Council Directive 91/676/EEC Concerning the Protection of Waters Against Pollution Caused by Nitrates from Agricultural Sources; Synthesis from year 2000 Member States Reports; EC, Office for Official Publications of the European Communities: Luxembourg, 2002; ISBN 92-894-4103-8.
- Common Implementation Strategy for the Water Framework Directive (2000/60/EC); Guidance Document No 7. Monitoring under the Water Framework Directive. Produced by Working Group 2.7-Monitoring; EC, Office for Official Publications of the European Communities: Luxembourg, 2003; ISBN 92-894-5127-0.
- Directive 2006/118/EC of the European Parliament and of the Council of 12 December 2006 on the Protection of Groundwater Against Pollution and Deterioration. EC, 2006. Official Journal of the European Union. 27 December 2006. L372. pp. 19–31. Available online: https://eur-lex.europa.eu/eli/dir/2006/118/oj/eng (accessed on 9 October 2025).
- Report from the Commission to the Council and the European Parliament on the Implementation of Council Directive 91/676/EEC Concerning the Protection of Waters Against Pollution Caused by Nitrates from Agricultural Sources Based on Member State Reports for the Period 2016–2019. EC, 2021, Brussels, 11.10.2021, COM(2021) 1000 Final. Available online: https://eur-lex.europa.eu/legal-content/EN/TXT/?uri=celex:52021DC1000 (accessed on 9 October 2025).
- de Vries, W.; Schulte-Uebbing, L.; Kros, H.; Voogd, J.C.; Louwagie, G. Spatially explicit boundaries for agricultural nitrogen inputs in the European Union to meet air and water quality targets. Sci. Total Environ. 2021, 786, 147283. [Google Scholar] [CrossRef] [PubMed]
- Regulation (EC) No 1059/2003 of the European Parliament and of the Council of 26 May 2003 on the Establishment of a Common Classification of Territorial Units for Statistics (NUTS). Available online: https://eur-lex.europa.eu/legal-content/EN/TXT/?qid=1405939838475&uri=CELEX:32003R1059 (accessed on 4 July 2025).
- Antolini, G.; Pavan, V.; Tomozeiu, R.; Marletto, V. Atlante Idroclimatico Dell’emilia-Romagna 1961–2015, 2017. ISBN 978-88-87854-44-2. Available online: https://www.arpae.it/it/temi-ambientali/clima/rapporti-e-documenti/atlante-climatico (accessed on 3 October 2025).
- Regione Emilia-Romagna. Carta dei Suoli Della Regione Emilia-Romagna in Scala 1: 50.000. Edizione 2021. Available online: https://geo.regione.emilia-romagna.it/gstatico/documenti/dati_pedol/carta_suoli_50k.pdf (accessed on 10 July 2025).
- Garberi, M.L.; Lenzi, D.; Mariani, M.C.; Masi, S.; Orlandi, F.; Vigilante, E. Database Uso del Suolo di Dettaglio 2017–Documentazione Regione Emilia-Romagna, Servizio Statistica e Sistemi Informativi Geografici, 2020. Available online: https://geoportale.regione.emilia-romagna.it/approfondimenti/contenuti-allegati/documentazione-uso-del-suolo/capitolato-tecnico-uso-suolo-dettaglio-2017-ed-2021.pdf (accessed on 10 July 2025).
- Schipani, T.; Censi, D.; Laruccia, N.; Rossi, R.; Solferini, A.; D’Aloia, M.; Michetti, M. Analisi del Sistema Agricolo, Agroindustriale e del Territorio Rurale Dell’emilia-Romagna. Regione Emilia-Romagna Servizio Programmazione e Sviluppo Locale Integrato e ART_ER S. cons. p.a. 2022. Available online: https://agricoltura.regione.emilia-romagna.it/pac-2023-2027/documenti/analisi-del-sistema/analisi-contesto.pdf/@@download/file/Analisi%20contesto.pdf (accessed on 10 July 2025).
- Minister for Agricultural Policies. Approval of the Official Methods for Soil Chemical Analysis. Ministerial Decree of September 13, 1999, GU n. 248 del 2110.1999-S.O. n.185. Available online: https://www.certifico.com/component/attachments/download/32182 (accessed on 11 July 2025).
- ISO 1871:2009; Food and Feed Products—General Guidelines for the Determination of Nitrogen by the Kjeldahl Method. International Organization for Standardization: Geneva, Switzerland, 2009.
- ISO 11263:1994; Soil Quality—Determination of Phosphorus—Spectrometric Determination of Phosphorus Soluble in Sodium Hydrogen Carbonate Solution. International Organization for Standardization: Geneva, Switzerland, 1994.
- ISO 22171:2023; Soil Quality—Determination of Potential Cation Exchange Capacity (CEC) and Exchangeable Cations Buffered at pH 7, Using a Molar Ammonium Acetate Solution. International Organization for Standardization: Geneva, Switzerland, 2023.
- Bishop, T.F.A.; McBratney, A.B.; Laslett, G.M. Modelling soil attribute depth functions with equal-area quadratic smoothing splines. Geoderma 1999, 91, 27–45. [Google Scholar] [CrossRef]
- Malone, B.P.; McBratney, A.B.; Minasny, B.; Laslett, G.M. Mapping continuous depth functions of soil carbon storage and available water capacity. Geoderma 2009, 154, 138–152. [Google Scholar] [CrossRef]
- R Core Team. R: A Language and Environment for Statistical Computing; R Foundation for Statistical Computing. Vienna, Austria, 2021. Available online: https://www.R-project.org/ (accessed on 9 October 2025).
- Wang, W.; Yan, J. Shape-Restricted Regression Splines with R Package splines2. J. Data Sci. 2021, 19, 498–517. [Google Scholar] [CrossRef]
- Rosner, B. Percentage Points for a Generalized ESD Many-Outlier Procedure. Technometrics 1983, 25, 165–172. [Google Scholar] [CrossRef]
- EPSG:7791; RDN2008/UTM Zone 32N. EPSG Geodetic Parameter Dataset. Geodesy Subcommittee of the IOGP Geomatics Committee: London, UK, 2016.
- Genova, G.; Poggio, L.; Kempen, B.; Colman, B. DSM Workflow Seedling v.0.3.6. 2024, ISRIC—World Soil Information. Available online: https://git.wur.nl/isric/dsm-general/dsm.workflows/seedling/-/tree/0.3.6 (accessed on 21 August 2025).
- Breiman, L. Random Forests. Mach. Learn. 2001, 45, 5–32. [Google Scholar] [CrossRef]
- Meinshausen, N. Quantile regression forests. J. Mach. Learn. Res. 2006, 7, 983–999. Available online: https://www.jmlr.org/papers/volume7/meinshausen06a/meinshausen06a.pdf (accessed on 21 August 2025).
- Wright, M.N.; Ziegler, A. Ranger: A fast implementation of random forests for high dimensional data in c++ and r. J. Stat. Softw. 2017, 77, 1–17. [Google Scholar] [CrossRef]
- Willmott, C.J. On the validation of models. Phys. Geogr. 1981, 2, 184–194. [Google Scholar] [CrossRef]
- Gorelick, N.; Hancher, M.; Dixon, M.; Ilyushchenko, S.; Thau, D.; Moore, R. Google Earth Engine: Planetary-scale geospatial analysis for everyone. Remote Sens. Environ. 2017, 202, 18–27. [Google Scholar] [CrossRef]
- Ungaro, F.; Tarocco, P.; Calzolari, C. Leveraging Soil Geography for Land Use Planning: Assessing and Mapping Soil Ecosystem Services Indicators in Emilia-Romagna, NE Italy. Geographies 2025, 5, 39. [Google Scholar] [CrossRef]
- Staffilani, F. Carta Dell’erosione Idrica Attuale Della Regione Emilia-Romagna. Note Illustrative, Edizione 2019. Available online: https://mappegis.regione.emilia-romagna.it/gstatico/documenti/dati_pedol/NOTE_ILLUSTRATIVE_EROSIONE.pdf (accessed on 25 August 2025).
- Kuhn, M. Building Predictive Models in R Using the caret Package. J. Stat. Softw. 2008, 28, 1–26. [Google Scholar] [CrossRef]
- Prisca, D.J.; Osumanu, H.A.; Latifah, O.; Aainaa, H. Phosphorus Transformation in Soils Following Co-Application of Charcoal and Wood Ash. Agronomy 2021, 11, 2010. [Google Scholar] [CrossRef]
- Alewell, C.; Ringeval, B.; Ballabio, C.A.; Robinson, D.A.; Panagos, P.; Borrelli, P. Global phosphorus shortage will be aggravated by soil erosion. Nat. Commun. 2020, 11, 4546. [Google Scholar] [CrossRef]
- Chen, S.; Arrouays, D.; Mulder, V.L.; Poggio, L.; Minasny, B.; Roudier, P.; Libohova, Z.; Lagacherie, P.; Shi, Z.; Hannam, J.; et al. Digital mapping of GlobalSoilMap soil properties at a broad scale: A review. Geoderma 2022, 409, 115567. [Google Scholar] [CrossRef]
- Mashala, M.J.; Dube, T.; Mudereri, B.T.; Ayisi, K.K.; Ramudzuli, M.R. A Systematic Review on Advancements in Remote Sensing for Assessing and Monitoring Land Use and Land Cover Changes Impacts on Surface Water Resources in Semi-Arid Tropical Environments. Remote Sens. 2023, 15, 3926. [Google Scholar] [CrossRef]
- Alawode, G.L.; Oluwajuwon, T.V.; Hammed, R.A.; Olasuyi, K.E.; Krasovskiy, A.; Ogundipe, O.C.; Kraxner, F. Spatiotemporal assessment of land use land cover dynamics in Mödling district, Austria, using remote sensing techniques. Heliyon 2025, 11, e43454. [Google Scholar] [CrossRef]
- Abdulraheem, M.I.; Zhang, W.; Li, S.; Moshayedi, A.J.; Farooque, A.A.; Hu, J. Advancement of Remote Sensing for Soil Measurements and Applications: A Comprehensive Review. Sustainability 2023, 15, 15444. [Google Scholar] [CrossRef]
- Chen, Q.; Vaudour, E.; Richer-de-Forges, A.C.; Arrouays, D. Spectral indices in remote sensing of soil: Definition, popularity, and issues. A critical overview. Remote Sens. Environ. 2025, 329, 114918. [Google Scholar] [CrossRef]
- Nussbaum, M.; Spiess, K.; Baltensweiler, A.; Grob, U.; Keller, A.; Greiner, L.; Schaepman, M.E.; Papritz, A. Evaluation of digital soil mapping approaches with large sets of environmental covariates. SOIL 2018, 4, 1–22. [Google Scholar] [CrossRef]
- Dash, P.K.; Ferhatoglu, C.; Miller, B.A.; Panigrahi, N.; Mishra, A. Influence of sample size and machine learning algorithms on digital soil nutrient mapping accuracy. Environ. Monit. Assess. 2025, 197, 996. [Google Scholar] [CrossRef]
- Kasraei, B.; Schmidt, M.G.; Zhang, J.; Bulmer, C.E.; Filatow, D.S.; Arbor, A.; Pennell, T.; Heung, B. A framework for optimizing environmental covariates to support model interpretability in digital soil mapping. Geoderma 2024, 445, 116873. [Google Scholar] [CrossRef]
- Del Duca, S.; Tondini, E.; Vitali, F.; Lumini, E.; Garlato, A.; Vinci, I.; Tagliaferri, E.; Brenna, S.; Motta, S.; Maillet, E.; et al. Comparison of LUCAS and Italian Sampling Procedures for Harmonising Physicochemical and Biological Soil Health Indicators. Eur. J. Soil Sci. 2025, 76, e70108. [Google Scholar] [CrossRef]
- Lagacherie, P. Operational Digital Soil Mapping: Achievements, Challenges and Future Strategies to Go Beyond. Eur. J. Soil Sci. 2025, 76, e70139. [Google Scholar] [CrossRef]
- Poggio, L.; de Sousa, L.M.; Batjes, N.H.; Heuvelink, G.B.M.; Kempen, B.; Ribeiro, E.; Rossiter, D. SoilGrids 2.0: Producing soil information for the globe with quantified spatial uncertainty. SOIL 2021, 7, 217–240. [Google Scholar] [CrossRef]
- FAO and ITPS. 2018. Global Soil Organic Carbon Map (GSOCmap) Technical Report; FAO and ITPS: Rome, Italy, 2018; p. 162. ISBN 978-92-5-130439-6. Available online: https://openknowledge.fao.org/handle/20.500.14283/i8891en (accessed on 2 October 2025).
- Froger, C.; Tondini, E.; Arrouays, D.; Oorts, K.; Poeplau, C.; Wetterlind, J.; Putku, E.; Saby, N.P.A.; Fantappiè, M.; Styc, Q.; et al. Comparing LUCAS Soil and national systems: Towards a harmonized European Soil monitoring network. Geoderma 2024, 449, 117027. [Google Scholar] [CrossRef]
- Wadoux, A.M.J.-C.; Courteille, L.; Arrouays, D.; De Carvalho Gomes, L.; Cortet, J.; Creamer, R.E.; Eberhardt, E.; Greve, M.H.; Grüneberg, E.; Harhoff, R.; et al. On soil districts. Geoderma 2024, 452, 117065. [Google Scholar] [CrossRef]
- Kasraei, B.; Heung, B.; Saurette, D.D.; Schmidt, M.G.; Bulmer, C.E.; Bethel, W. Quantile regression as a generic approach for estimating uncertainty of digital soil maps produced from machine-learning. Environ. Model. Softw. 2021, 144, 105139. [Google Scholar] [CrossRef]
- Vaysse, K.; Heuvelink, G.B.M.; Lagacherie, P.; Goss, M. Spatial aggregation of soil property predictions in support of local land management. Soil Use Manag. 2017, 33, 299–310. [Google Scholar] [CrossRef]
- Courteille, L.; Tardieu, L.; Boukhelifa, N.; Lutton, E.; Lagacherie, P. What is the best way to communicate the uncertainty of a digital soil mapping product? Some lessons from an end-users survey. Geoderma 2025, 459, 117302. [Google Scholar] [CrossRef]
- Stumpf, F.; Schmidt, K.; Goebes, P.; Behrens, T.; Schönbrodt-Stitt, S.; Wadoux, A.; Xiang, W.; Scholten, T. Uncertainty-guided sampling to improve digital soil maps. CATENA 2017, 153, 30–38. [Google Scholar] [CrossRef]
- Hengl, T.; Leenaars, J.G.; Shepherd, K.D.; Walsh, M.G.; Heuvelink, G.B.; Mamo, T.; Tilahun, H.; Berkhout, E.; Cooper, M.; Fegraus, E.; et al. Soil nutrient maps of Sub-Saharan Africa: Assessment of soil nutrient content at 250 m spatial resolution using machine learning. Nutr. Cycl. Agroecosyst. 2017, 109, 77–102. [Google Scholar] [CrossRef] [PubMed]






| Area | Variable | Num | Mean | Std. Dev. | Min. | P10 | Q25 | Median | Q75 | P90 | Max |
|---|---|---|---|---|---|---|---|---|---|---|---|
| Plain | N tot | 27,512 | 1.46 | 0.58 | 0.05 | 0.98 | 1.10 | 1.40 | 1.70 | 2.07 | 14.60 |
| P2O5 | 26,680 | 44.11 | 30.30 | 0.50 | 14.00 | 23.00 | 37.00 | 57.00 | 83.00 | 185.00 | |
| K2O | 26,711 | 292.19 | 151.47 | 3.63 | 127.00 | 184.00 | 264.60 | 368.00 | 485.00 | 1010.00 | |
| Hills and mountains | N tot | 8626 | 1.42 | 0.66 | 0.10 | 0.79 | 1.00 | 1.30 | 1.70 | 2.20 | 13.00 |
| P2O5 | 8241 | 25.14 | 24.02 | 0.10 | 5.00 | 9.00 | 18.00 | 32.50 | 53.90 | 183.00 | |
| K2O | 8097 | 264.08 | 152.71 | 3.63 | 106.00 | 155.90 | 230.00 | 337.00 | 465.00 | 1100.00 | |
| Whole region | N tot | 36,138 | 1.45 | 0.60 | 0.05 | 0.90 | 1.10 | 1.36 | 1.70 | 2.10 | 14.60 |
| P2O5 | 34,921 | 39.63 | 30.04 | 0.10 | 10.00 | 18.00 | 32.00 | 53.00 | 78.00 | 185.00 | |
| K2O | 34,808 | 285.65 | 152.22 | 1.00 | 122.00 | 177.15 | 257.00 | 361.00 | 480.00 | 1100.00 |
| Covariates | Description | SCORPAN Factor | Ref. Year | Layer Type | Variable Type | Spatial Resolution | Units |
|---|---|---|---|---|---|---|---|
| aspect | Aspect from DEM | R | 2016 | Raster | Num. | 10 m | ° |
| dem | Elevation | R | 2016 | Raster | Num. | 10 m | m |
| geomorfo | geomorphological forms | R + P | 2016 | Raster | Cat. | 25 m | class |
| mrivbf | Multi Resolution Index of Valley Bottom Flatness | R | 2016 | Raster | Num. | 10 m | - |
| nort | Northness (orientation and slope) | R | 2016 | Raster | Num. | 10 m | index |
| slope | Slope, from DEM | R | 2016 | Raster | Num. | 10 m | % |
| twi | Topographic Wetness Index from, DEM | R | 2016 | Raster | Num. | 10 m | m2 rad−1 |
| vdnc | Vertical dist. channel network, from DEM | R | 2016 | Raster | Num. | 10 m | m |
| vdepth | Valley depth, from DEM | R | 2016 | Raster | Num. | 10 m | m |
| mwmtemp | July mean temperature | C | 1970–2000 | raster | Num. | 100 m | °C |
| landuse | Land use map | O | 2020 | Vector | Cat. | 10 k | class |
| evi | Enhanced Vegetation Index (Modis) | O | 2015–2023 | Raster | Num. | 250 m | - |
| gfc_tcov | Global forest tree canopy cover [36] | O | 2019 | Raster | Num. | 30 m | % |
| ndvis5 | NDVI, mean of medians sum June-September | S + O | 2015–2023 | Raster | Num. | 30 m | - |
| ndvi | NDVI, mean of annual median values | S + O | 2015–2023 | Raster | Num. | 30 m | - |
| ndsi | NDSI, mean of annual median values | S + O | 2015–2023 | Raster | Num. | 30 m | - |
| ndwi | NDWI, mean of annual median values | S + O | 2015–2023 | Raster | Num. | 30 m | - |
| nir | Sentinel2 Band 8 (Near Infrared) | S + O | 2015–2023 | Raster | Num. | 30 m | DN 8 bit |
| red | Sentinel2 Band 4 (Red) | S + O | 2015–2023 | Raster | Num. | 30 m | DN 8 bit |
| sosi2 | SOSI, mean of annual median values | S + O | 2015–2023 | Raster | Num. | 30 m | - |
| swir | Sentinel2 Band 11 (Short wave infrared) | S + O | 2015–2023 | Raster | Num. | 30 m | DN 8 bit |
| erosion | RUSLE map (actual soil erosion) | S + R + C + O | 2019 | Raster | Num. | 20 m | Mg/ha/yr |
| soilrer_L2 | Pedolandscapes (L2, Soil provinces) | C + O + R + P | 2021 | Vector | Cat. | 1 M | class |
| soilrer_250k | Soil subsystems (L4) | S | 2021 | Vector | Cat. | 250 k | class |
| soilrer_50k | Soil units (L6, only for the plain) | S | 2021 | Vector | Cat. | 50 k | class |
| clay | Clay content (0–30 cm) | S | 2023 | Raster | Num. | 100 m | % |
| sand | Sand content (0–30 cm) | S | 2023 | Raster | Num. | 100 m | % |
| C org. | Soil organic C content (0–30 cm) | S | 2023 | Raster | Num. | 100 m | % |
| pH | Soil pH (0–30 cm) | S | 2023 | Raster | Num. | 100 m | - |
| avg_lulcprov | NPK mean contents per LULC class per district | S | 2022 | Vector | Num. | 50 k–250 k | g kg−1, mg kg−1 |
| avg_L2prov | NPK mean contents per pedolandscape per district | S | 2022 | Vector | Num. | 50 k–250 k | g kg−1, mg kg−1 |
| Variable | Data Set | Num. Obs. | ME | AE | RMSE | IoA | R2 |
|---|---|---|---|---|---|---|---|
| N g kg−1 Plain | Train | 20,536 | −0.004 | 0.206 | 0.317 | 0.882 | 0.910 |
| Test | 6846 | 0.016 | 0.032 | 0.560 | 0.948 | 0.898 | |
| N g kg−1 Apennines | Train | 6406 | 0.003 | 0.022 | 0.130 | 0.965 | 0.928 |
| Test | 2136 | 0.033 | 0.067 | 0.241 | 0.945 | 0.897 | |
| K2O mg kg−1 Plain | Train | 19,941 | 6.455 | 10.331 | 41.840 | 0.959 | 0.908 |
| Test | 6648 | 6.719 | 10.451 | 42.574 | 0.945 | 0.893 | |
| K2O mg kg−1 Apennines | Train | 6015 | 5.810 | 9.910 | 38.930 | 0.961 | 0.923 |
| Test | 2005 | 7.900 | 11.890 | 48.580 | 0.936 | 0.880 | |
| P2O5 mg kg−1 Plain | Train | 19,917 | 1.583 | 2.525 | 9.155 | 0.955 | 0.902 |
| Test | 6639 | 1.439 | 2.395 | 8.504 | 0.943 | 0.900 | |
| P2O5 mg kg−1 Apennines | Train | 6124 | 1.790 | 2.240 | 9.090 | 0.935 | 0.874 |
| Test | 2042 | 1.410 | 1.920 | 8.170 | 0.925 | 0.869 |
| Variable | Area | Mean | Std. Dev. | Min. | Median | Max. |
|---|---|---|---|---|---|---|
| N g kg−1 LUCAS | Region | 2.16 | 0.74 | 0.72 | 1.93 | 7.91 |
| Plain | 1.81 | 0.47 | 0.72 | 1.70 | 6.40 | |
| Apennines | 2.54 | 0.79 | 0.93 | 2.43 | 7.91 | |
| N g kg−1 RER | Region | 1.60 | 0.68 | 0.20 | 1.50 | 13.00 |
| Plain | 1.57 | 0.83 | 0.20 | 1.40 | 13.00 | |
| Apennines | 1.62 | 0.48 | 0.22 | 1.60 | 4.40 | |
| K2O mg kg−1 LUCAS | Region | 247.92 | 69.91 | 31.47 | 248.80 | 796.38 |
| Plain | 246.43 | 45.51 | 56.46 | 252.37 | 637.45 | |
| Apennines | 249.53 | 88.92 | 31.47 | 240.61 | 796.38 | |
| K2O mg kg−1 RER | Region | 203.86 | 77.88 | 15.77 | 196.63 | 742.85 |
| Plain | 229.26 | 76.67 | 15.77 | 231.99 | 742.85 | |
| Apennines | 176.44 | 69.43 | 28.47 | 159.36 | 655.70 | |
| P2O5 mg kg−1 LUCAS | Region | 23.88 | 10.33 | 0.00 | 24.60 | 107.14 |
| Plain | 30.53 | 7.21 | 0.00 | 29.56 | 64.42 | |
| Apennines | 16.73 | 8.18 | 0.00 | 16.17 | 107.14 | |
| P2O5 mg kg−1 RER | Region | 12.39 | 6.72 | 1.31 | 11.78 | 61.54 |
| Plain | 17.66 | 4.79 | 2.18 | 17.02 | 61.54 | |
| Apennines | 6.71 | 2.61 | 1.31 | 6.29 | 53.82 |
Disclaimer/Publisher’s Note: The statements, opinions and data contained in all publications are solely those of the individual author(s) and contributor(s) and not of MDPI and/or the editor(s). MDPI and/or the editor(s) disclaim responsibility for any injury to people or property resulting from any ideas, methods, instructions or products referred to in the content. |
© 2025 by the authors. Licensee MDPI, Basel, Switzerland. This article is an open access article distributed under the terms and conditions of the Creative Commons Attribution (CC BY) license (https://creativecommons.org/licenses/by/4.0/).
Share and Cite
Ungaro, F.; Tarocco, P.; Aprea, A. Digital Soil Mapping of Soil Macronutrients (N, P, K) in Emilia-Romagna (NE Italy): A Regional Baseline for the EU Soil Monitoring Law. Land 2025, 14, 2142. https://doi.org/10.3390/land14112142
Ungaro F, Tarocco P, Aprea A. Digital Soil Mapping of Soil Macronutrients (N, P, K) in Emilia-Romagna (NE Italy): A Regional Baseline for the EU Soil Monitoring Law. Land. 2025; 14(11):2142. https://doi.org/10.3390/land14112142
Chicago/Turabian StyleUngaro, Fabrizio, Paola Tarocco, and Alessandra Aprea. 2025. "Digital Soil Mapping of Soil Macronutrients (N, P, K) in Emilia-Romagna (NE Italy): A Regional Baseline for the EU Soil Monitoring Law" Land 14, no. 11: 2142. https://doi.org/10.3390/land14112142
APA StyleUngaro, F., Tarocco, P., & Aprea, A. (2025). Digital Soil Mapping of Soil Macronutrients (N, P, K) in Emilia-Romagna (NE Italy): A Regional Baseline for the EU Soil Monitoring Law. Land, 14(11), 2142. https://doi.org/10.3390/land14112142


