1. Introduction
Land degradation is a reduction in or loss of the biological or economic productivity and complexity of rainfed cropland, irrigated cropland, or ranges, pastures, forests and woodlands [
1]. Land degradation results from land uses or from a process or combination of processes arising from human activities [
1]. Sustainable Development Goal 15 (SDG15) calls for the protection of terrestrial ecosystems against land degradation [
2]. Land Degradation Neutrality aims at maintaining or enhancing land-based natural capital and its associated ecosystem services [
3,
4] with Target Setting Programmes defined in different countries (e.g., in Vietnam, [
5]). Reversing land degradation requires quantitative assessments and the mapping of degraded lands (SDG15.3.1 indicator).
Land degradation is caused by multiple drivers, including extreme weather conditions and human activities that degrade soil quality and land utility [
6,
7,
8]. Drought can trigger severe land degradation processes that result in long recovery periods, particularly in the tropics [
9]. These processes are a combination of drivers and feedback that are both spatiotemporally variant, context dependent and often difficult to monitor objectively [
10,
11]. The impacts of land degradation, and the underlying drivers of land condition changes should be monitored and assessed, such that remedial actions can target causes of land degradation [
7]. Symptoms of land degradation change with land use and comprise different forms of degradation such as soil erosion, fertility loss, sparse canopy cover, productivity loss and/or biodiversity decline [
12,
13]. The drivers of land degradation processes rely on the geographical context so that their assessment requires spatiotemporal analysis. Understanding the bio-physical and social impacts on the affected regions in Vietnam is a prerequisite to sustainable action.
Drought is often an underlying driver of land condition change and strongly affects land degradation. Droughts are especially intense in regions where the climate is characterised by a dry hot season, intense evapotranspiration, and a marked seasonality of rainfall [
14]. With gradual progression in time, a deficiency of precipitation or meteorological drought leads to soil water deficiencies or agricultural drought, to reduced streamflow or hydrological drought, and ultimately to socio-economic drought [
15]. In addition, ecological drought has been defined to highlight the multiple stresses that drought creates across ecosystems [
16]. Droughts pose a serious problem to vegetation and primary productivity, and biomass and agricultural production around the globe [
14,
17]. Both occasional droughts, due to seasonal or inter-annual variations in rainfall, and long-term recurring droughts can be aggravated by climate change and the influence of people on the environment [
18]. Overall, drought negatively affects food production, livelihoods, and the provision of ecosystem goods and services, and an understanding of its complexity is a prerequisite to remedial action [
19].
In regions prone to land degradation, soils are fragile due to an increased spatial and temporal heterogeneity of soil characteristics influencing water content and nutrient availability [
20,
21,
22]. In sub-humid areas where climatic factors are less influential, the state of soil properties is a major factor in vulnerability to land degradation and therefore requires careful land management. Depending upon their nature, processes of degradation may be physical (erosion, soil organic carbon loss, compaction, waterlogging), chemical (salinisation, acidification, nutrient imbalances), and/or biological (rangeland degradation, deforestation, loss in biodiversity) [
23]. The adverse environment leads to a persistent decline in economic bio-productivity of the land use or ecosystem [
16]. Vegetation plays a major role in determining the biological composition of the land and in protecting the land and soil from degradation processes [
24,
25,
26]. Population and livestock pressure, unsustainable land and water management, and human activities may exacerbate the degradation processes, the effects of which are accelerated by climate change [
6,
27]. Therefore, the interaction between land degradation and the adaptive capacity of land users is a prerequisite to identifying vulnerable systems and prioritising adaptation actions [
28].
Vietnam is considered one of the most naturally hazard-prone countries in the world, which is further compounded by high population pressures and high levels of poverty, particularly along the coast. In 1998, Vietnam ratified the United Nations Convention to Combat Desertification. Vietnam has about 21 million hectares of agricultural and forest land, of which 7.55 million hectares are affected by degradation [
29,
30]. In Vietnam, the baseline is set as the year 2010 [
31]. Of the total land area 13,048 km
2 is severely degraded (4%), 24,043 km
2 shows signs of degradation (7.3%), and 67,005 km
2 is under threat of degradation (20.4%) [
5]. Drought and desertification were reported to be severe in southeast Vietnam [
5,
31,
32,
33,
34]. Coastal sand dunes cover 4620 km
2; shifting sand dunes in combination with drought cause desertification in the southeastern provinces of Vietnam [
5]. In addition, more than 3000 km
2 in the southeastern provinces are severely affected by drought. Despite heavy rainfall and seasonal flooding during La Niña periods [
35], El Niño-related prolonged droughts in 1997–1998, 2002–2003, 2009–2010 and 2015–2016 affected millions of people and led to hundreds of millions of dollars in economic loss, particularly affecting agriculture [
29]. Drought, desertification and land degradation management are implemented through a National Action and Target Setting Programme to prevent further degradation [
5].
The impacts of land degradation on the local environment and economy are considerable in Vietnam. According to interviews with government officials and experts, the major drivers of land degradation are climate, and in particular rainfall patterns, population density and dynamics, and land use planning that includes agriculture [
31,
32,
33,
34,
35]. A quantification and stakeholder assessment of these and other possible drivers is necessary to estimate the impact, vulnerability and adaptation at the local level. Our objectives are therefore to (1) identify the major drivers and pressures related to land degradation, (2) assess the local impacts and vulnerability, and (3) identify response strategies and adaptation options. We developed a methodological framework and tested it on the heavily affected Binh Thuan province in southeast Vietnam.
2. Materials and Methods
2.1. Methodological Framework
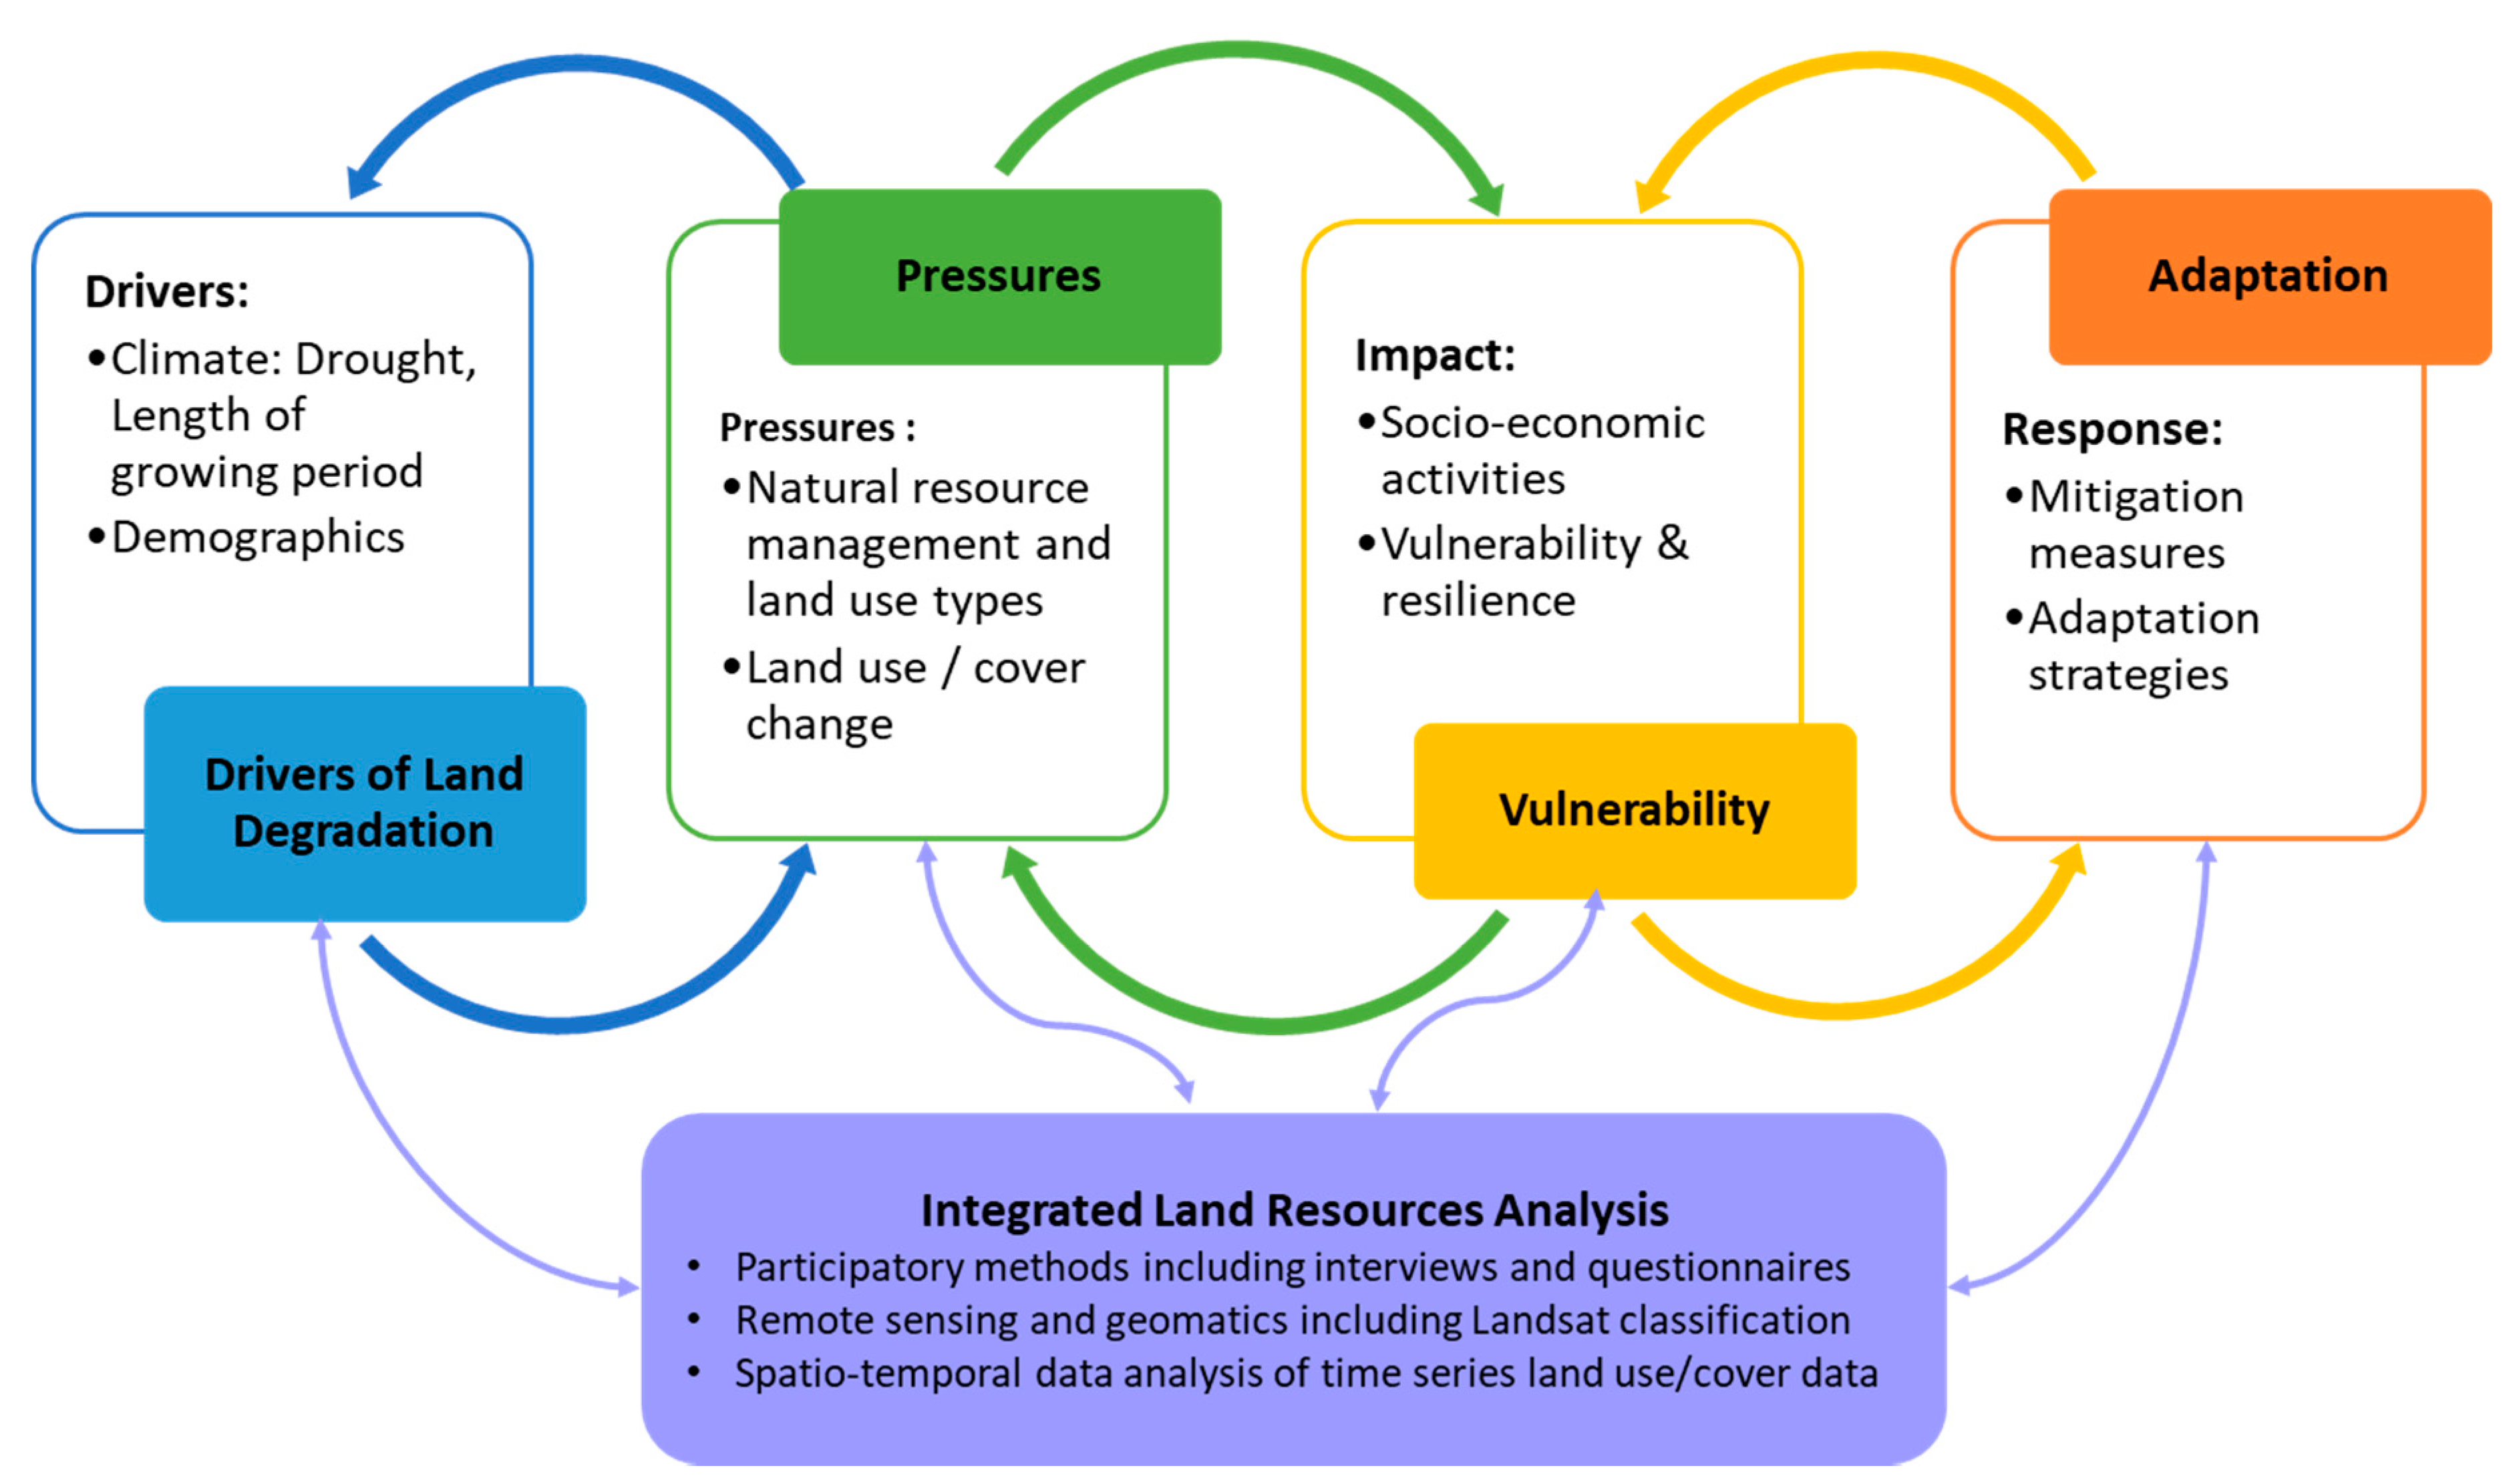
The methodological framework (
Figure 1) that we adopted comprised elements from the Driver–Pressure–State–Impact–Response (DPSIR) framework applied to soil erosion [
36], the chain of risk approach [
37], integrated land resource analysis for sustainable land management [
38,
39] and vulnerability assessment [
28]. The framework combines participatory methods and surveys with bio-meteorological analysis, geographic information system (GIS) and remote sensing, and statistical data evaluation.
All of the frameworks listed (
Figure 1) have their origin in a certain environmental application domain and region of interest (
Table 1). The frameworks have subsequently been used across the world and across a large number of disciplines, thereby capturing different aspects of land degradation [
40].
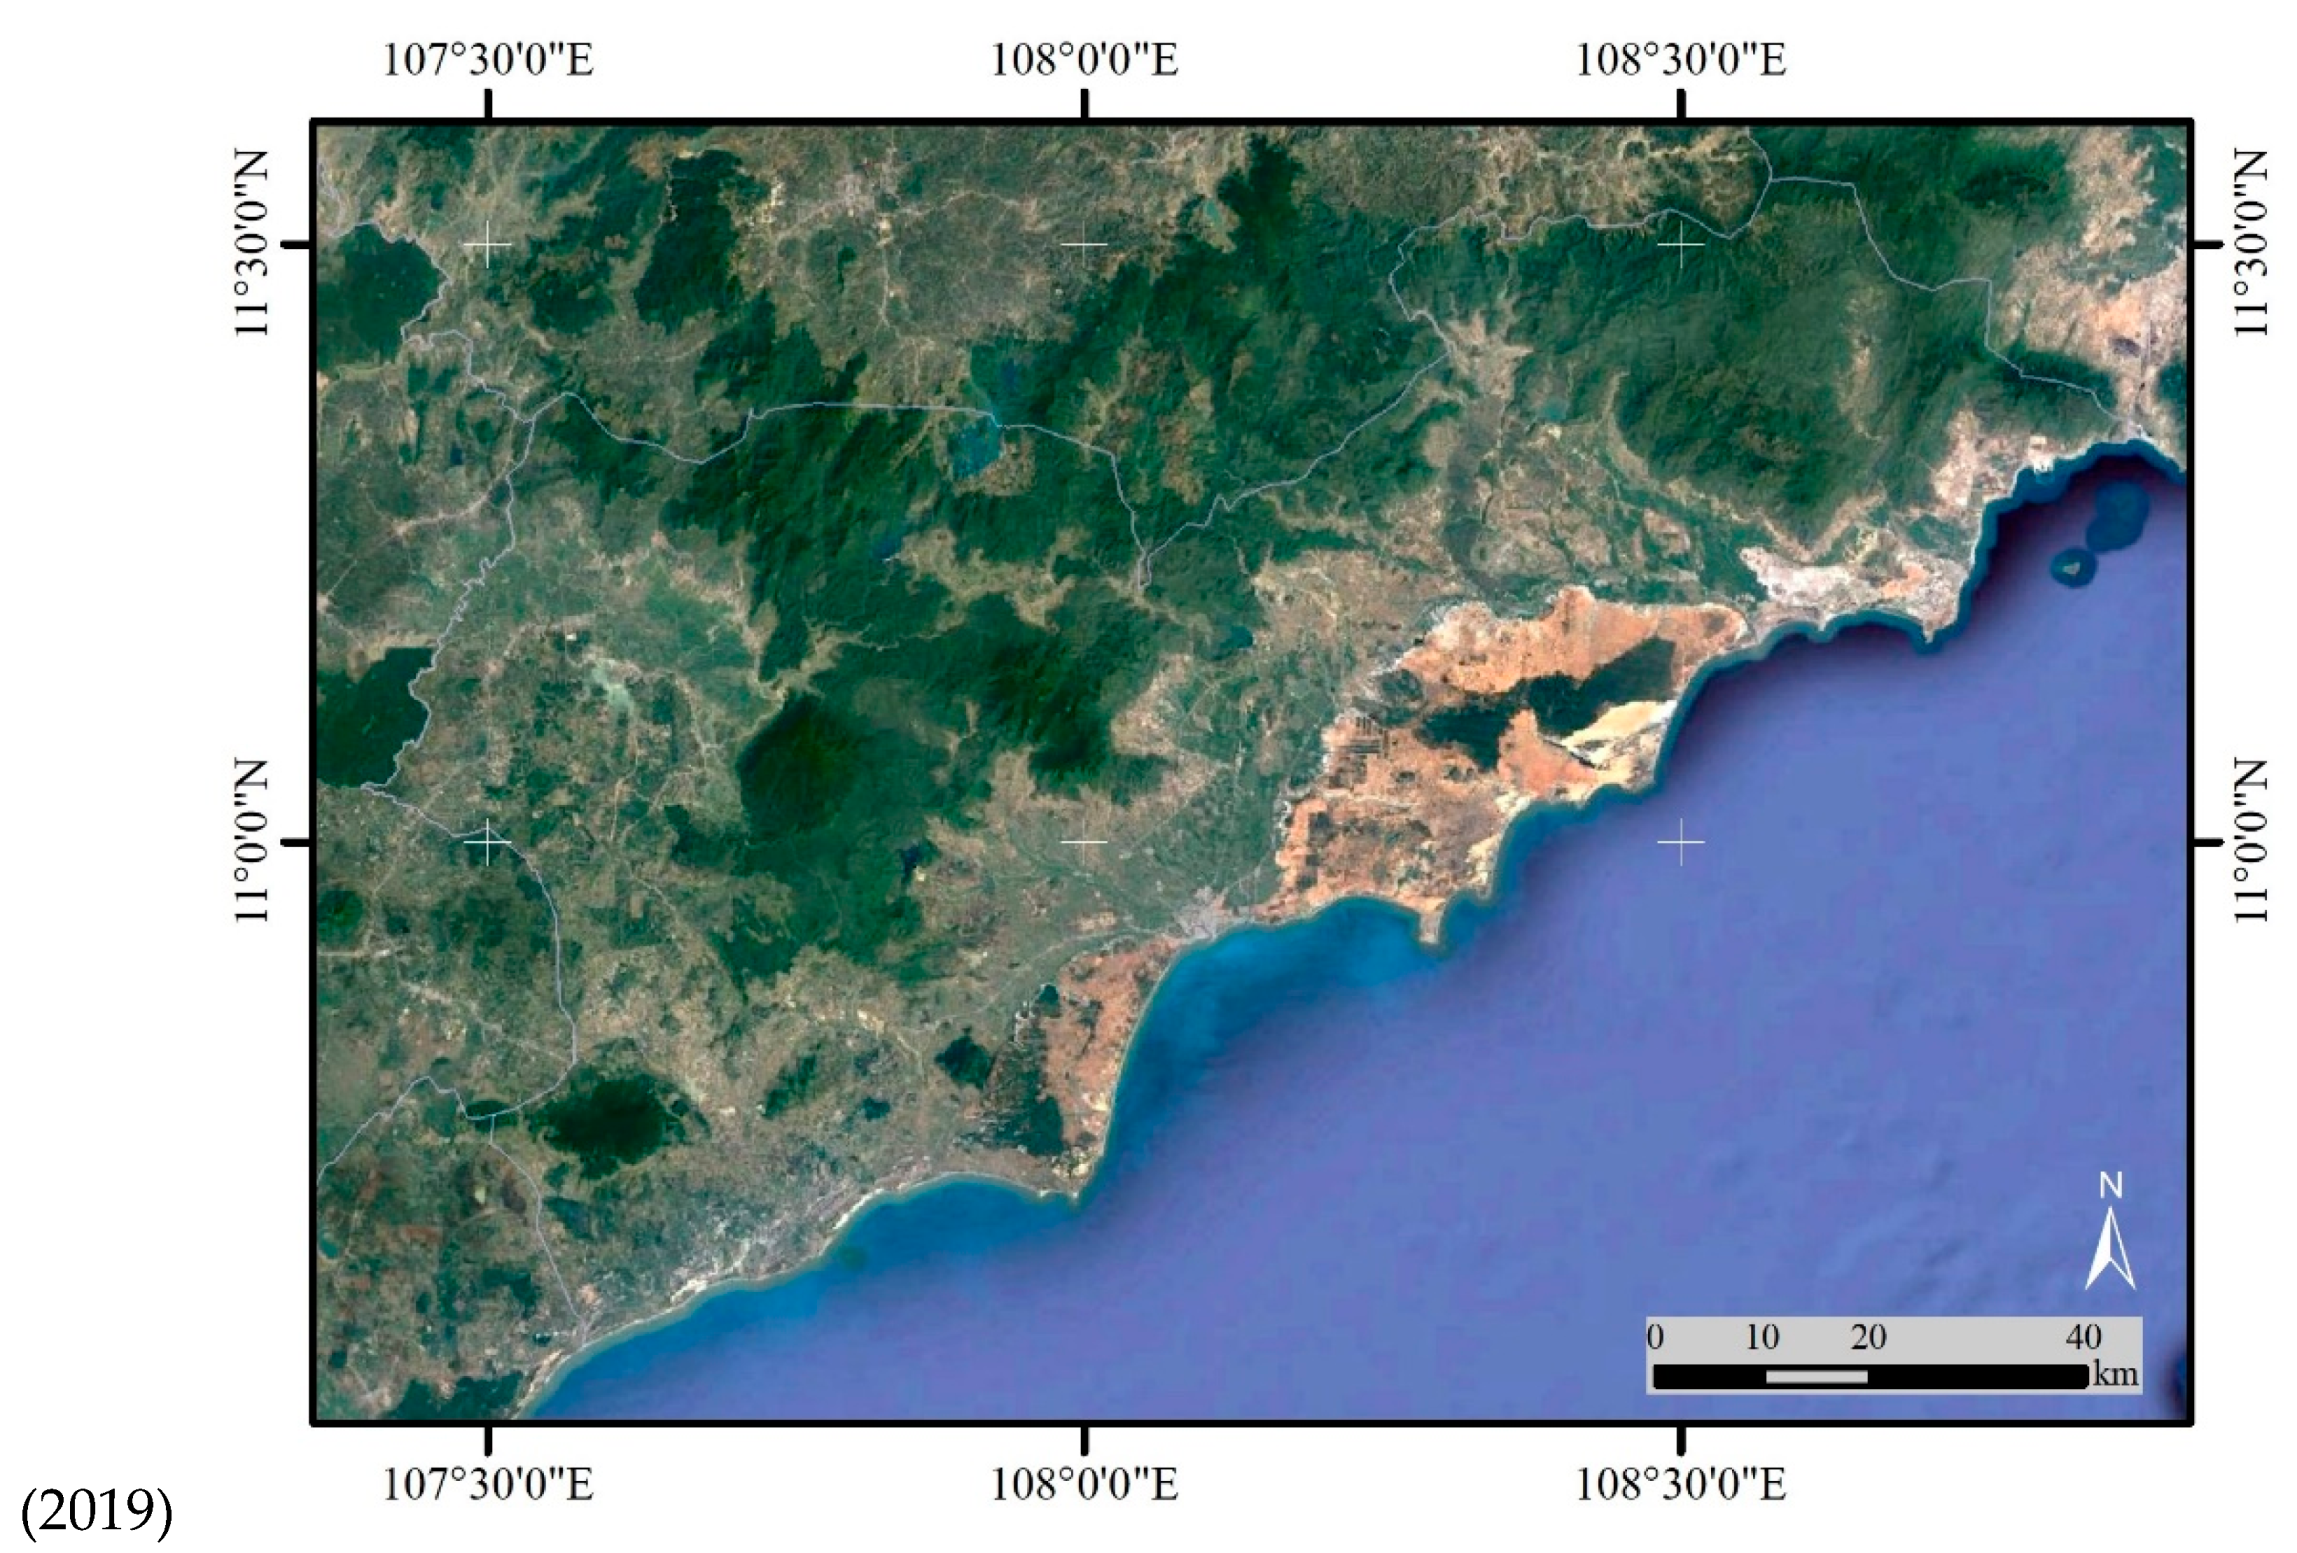
2.2. Study Area
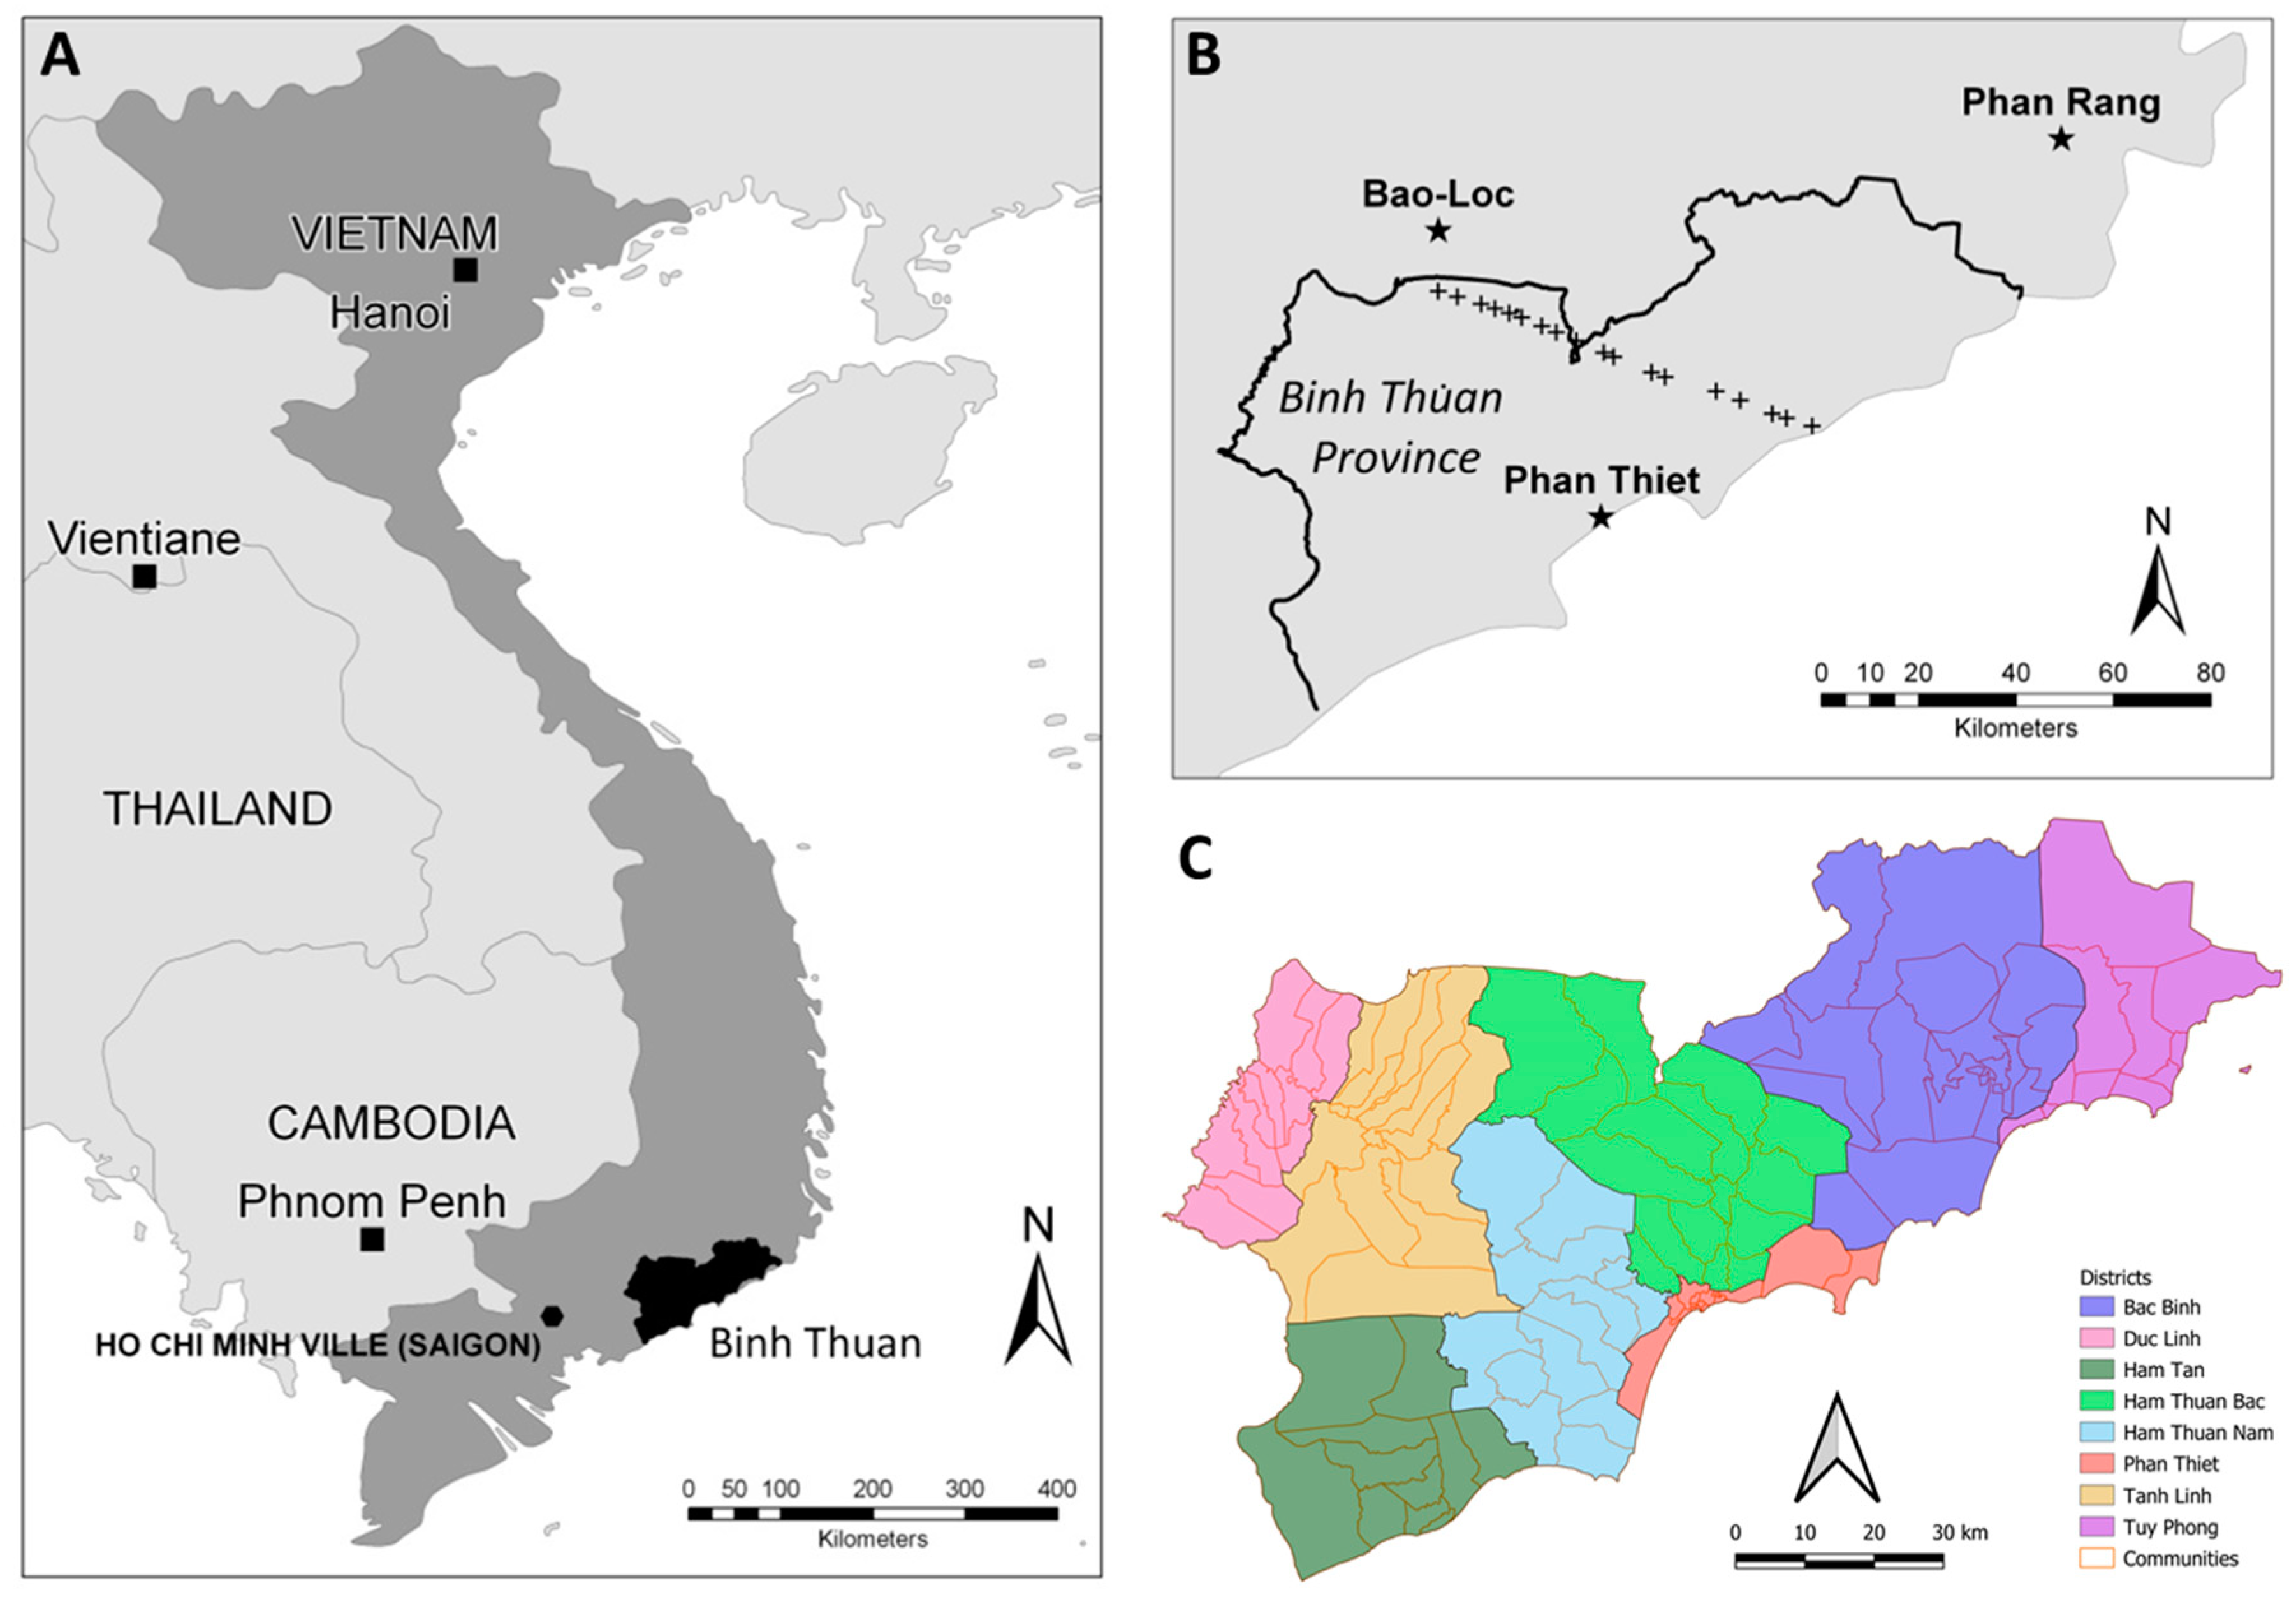
Binh Thuan is a province in southeast Vietnam with a total area of 7944 km
2 and about 200 km of coastline (
Figure 2). During the 1980–2010 period, the climate in the province was characterised by high average annual evapotranspiration rates (1370–1870 mm) and abundant sunshine (2500–2800 h per year) [
29]. Average temperatures ranged between 21.7 °C for Tmin and 34.2 °C for Tmax. A dry land wind of 10.8 ± 2.8 m/s during the dry season added to high evapotranspiration rates. Both a lack of rain and extreme heat resulted in recurrent droughts in the lowland plains and the sand dunes along the coast. The province is part of the driest regions of Vietnam and is prone to desertification [
31]. Due to drought, half of the agricultural land could not be harvested in 2005, and water shortages occurred for cattle, goats and sheep [
29]. The dams reached only 40% of their capacity. With almost zero rainfall in the northern Tuy Phong and Bac Binh districts, agricultural losses were very severe. The prolonged 2015–2016 drought was the most severe drought that the province had experienced in the past 100 years [
29], with reported damages at an estimated USD 2.6 million in 2015 and USD 4.77 million in 2016 [
29].
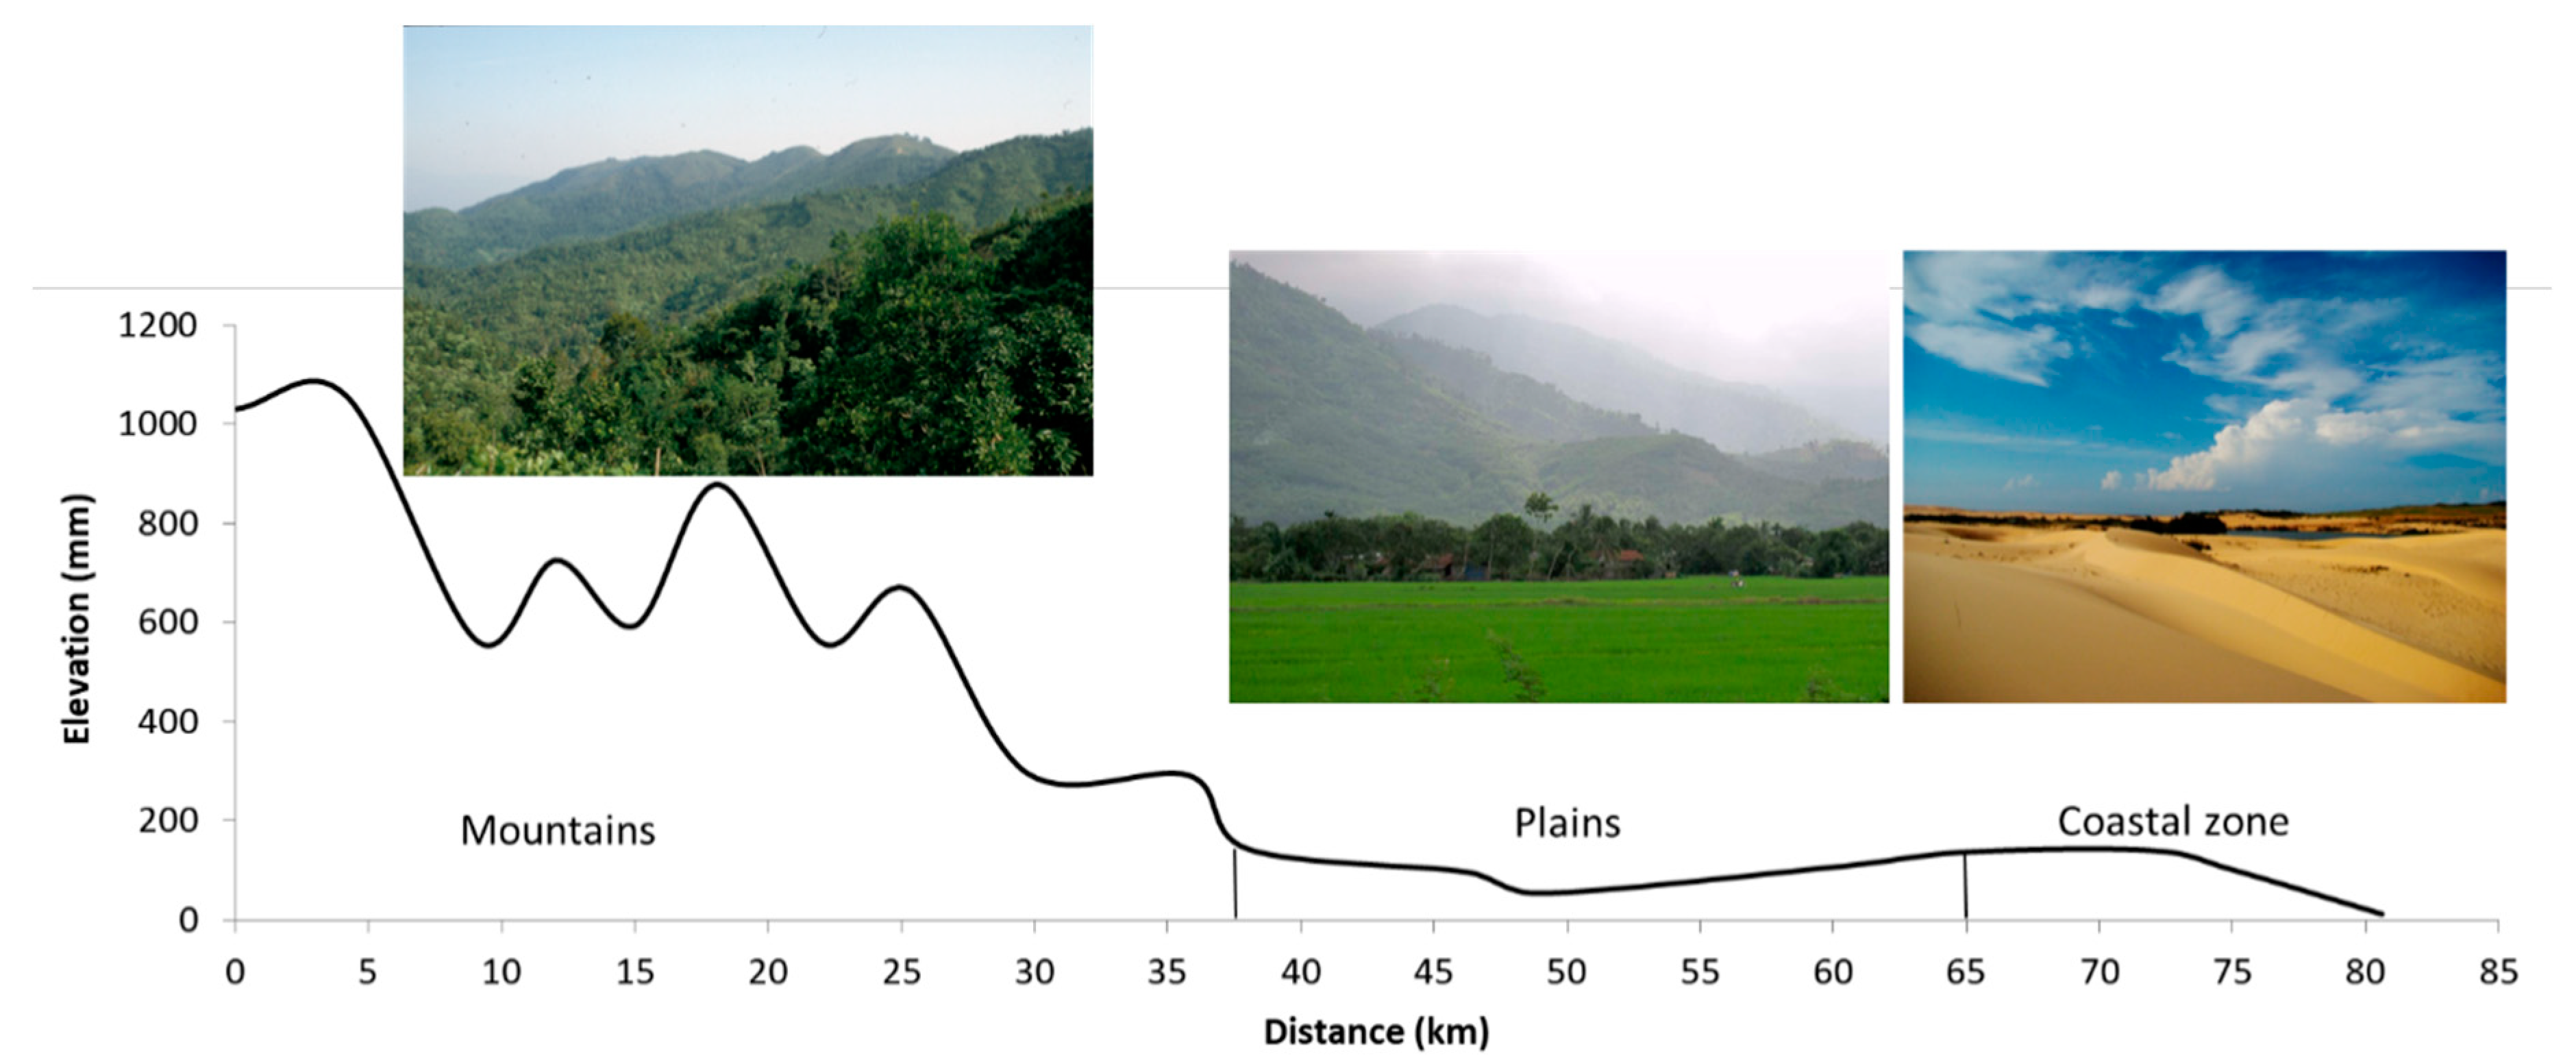
The province has a diverse and complex topography from west to east: mountains, upland hills, lowland plains, sand dunes and a narrow coastal strip. The mountains reach heights of up to 1548 m where rock outcrops dominate the landscape. The upland hilly region comprises small valleys with rainfed agriculture where erosion or even landslides may occur during the rainy season. The lowland plains are characterised by meandering rivers along which wetland rice and irrigated crops are cultivated. Soils accumulate salt as high evapotranspiration rates often exceed rainfall. Regular droughts contribute to laterite formation. Towards the coast, sandstone formations give rise to severe gullying and ravine erosion. Where surface water supplies are inadequate, villagers depend heavily on groundwater for household use and irrigation, particularly to overcome the limitations of drought. Groundwater becomes saline since overexploitation leads to the intrusion of marine water. Though the boundaries of areas affected by saline soils and groundwater may be known for a particular year, their extent and causes require regular updating, while the status and quality of groundwater salinity necessitate further monitoring. Binh Thuan is thought to have 4% of the global Titanium reserves and has therefore attracted industrial mining of sandstone along the coast, where water is used for extraction and salt is produced as a byproduct. The coastal area is bordered by an impressive sparsely vegetated dune ridge up to 200 m high. Sand dunes form a major threat to the neighbouring agricultural activities.
2.3. Bio-Meteorological Analysis
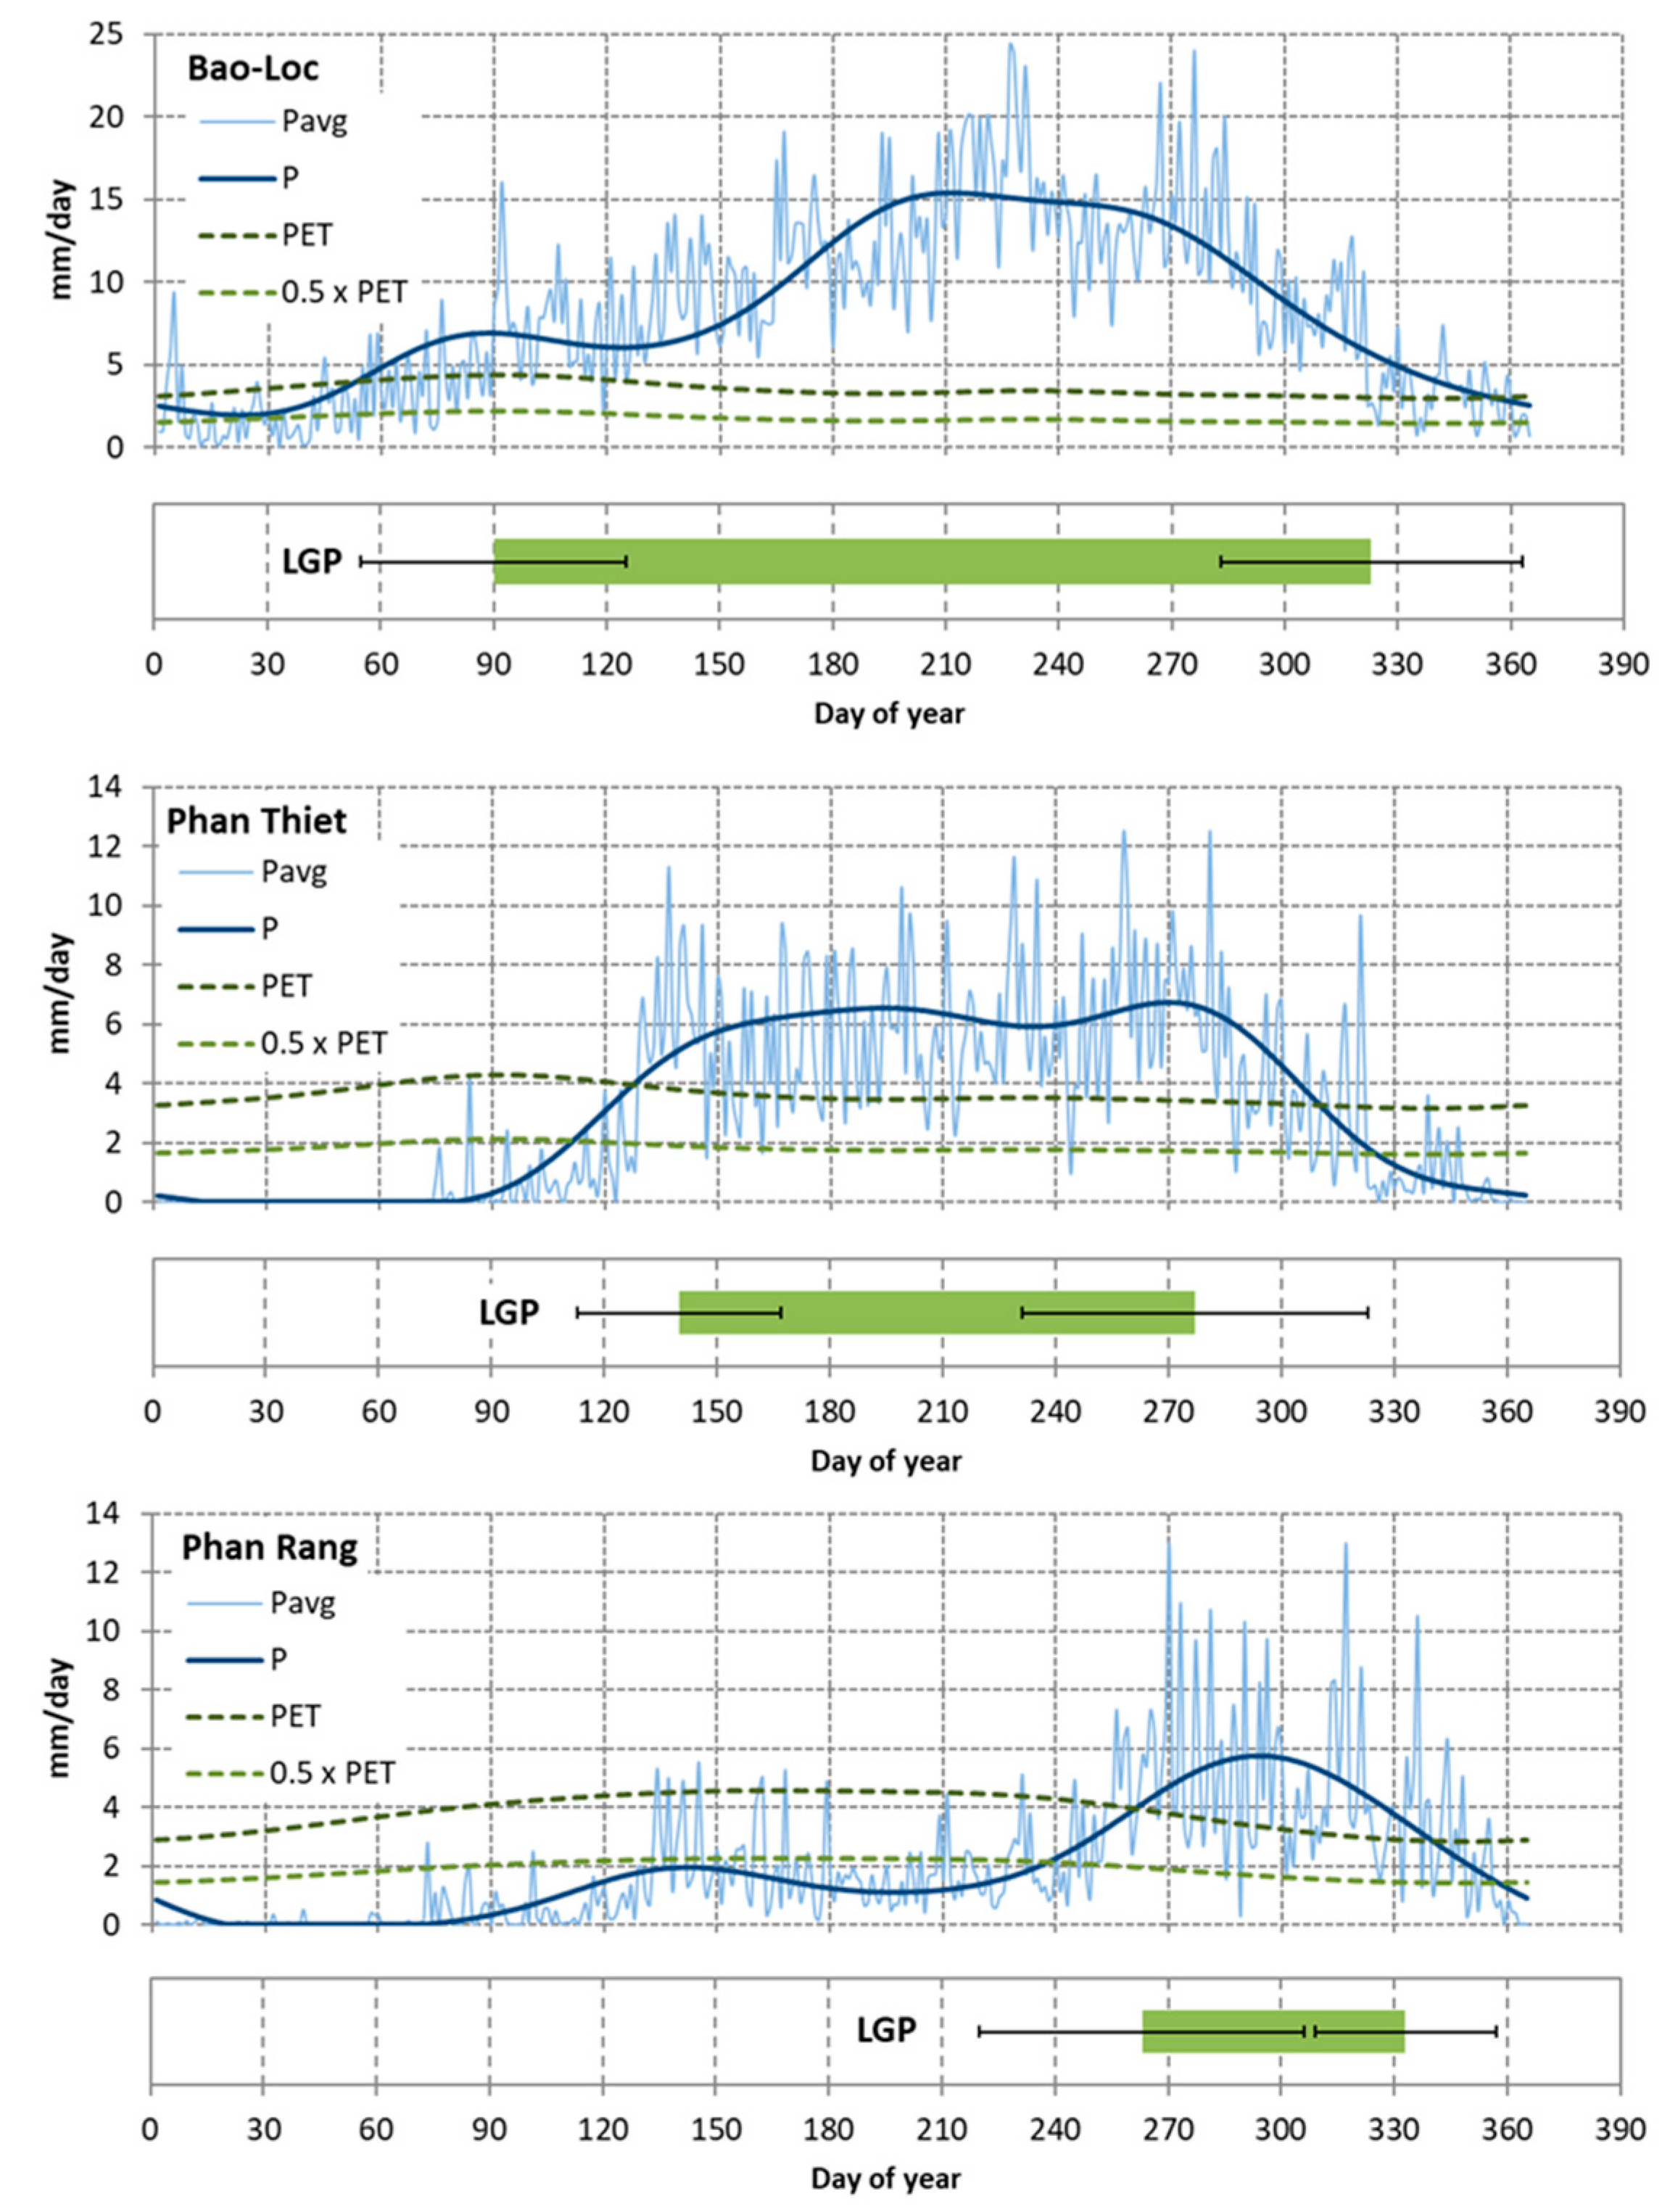
Daily meteorological data for the 1980–2009 period were collected from the meteorological Institute for the synoptic stations of Bao-Loc, Phan Thiet and Phan Rang (
Figure 2) that represent forested hills, lowland agricultural plains, and a desertified coastal zone, respectively. The potential evapotranspiration (PET) was calculated using the modified Penman–Monteith equation [
58]. The aridity index (AI) or the ratio between rainfall (P) and PET [
59] and the length of the growing period (LGP) [
60] were calculated for the three stations. Drylands are distinguished using LGP when both rainfall and evapotranspiration permit annual crop growth. Arid drylands have 1–74 growing days, semi-arid 75–119 and dry sub-humid 120–180 [
60]. In addition, climates in drylands are characterised by low and variable rainfall that translates into variable production.
2.4. Spatial Database on Land Use/Cover
Data from the General Statistics Office [
29], geodata and reports were collected from several provincial and district departments and combined in a geodatabase. Data processing consisted of establishing a common coordinate system and improving data quality through communication with the different departments where the data originated from. Thematic spatial data layers were subsequently created for the administrative boundaries, land use/cover, soil resources, road networks, and water resources, including irrigation infrastructure. Statistics on population, economic activities, agriculture and forestry were tabulated for the administrative areas.
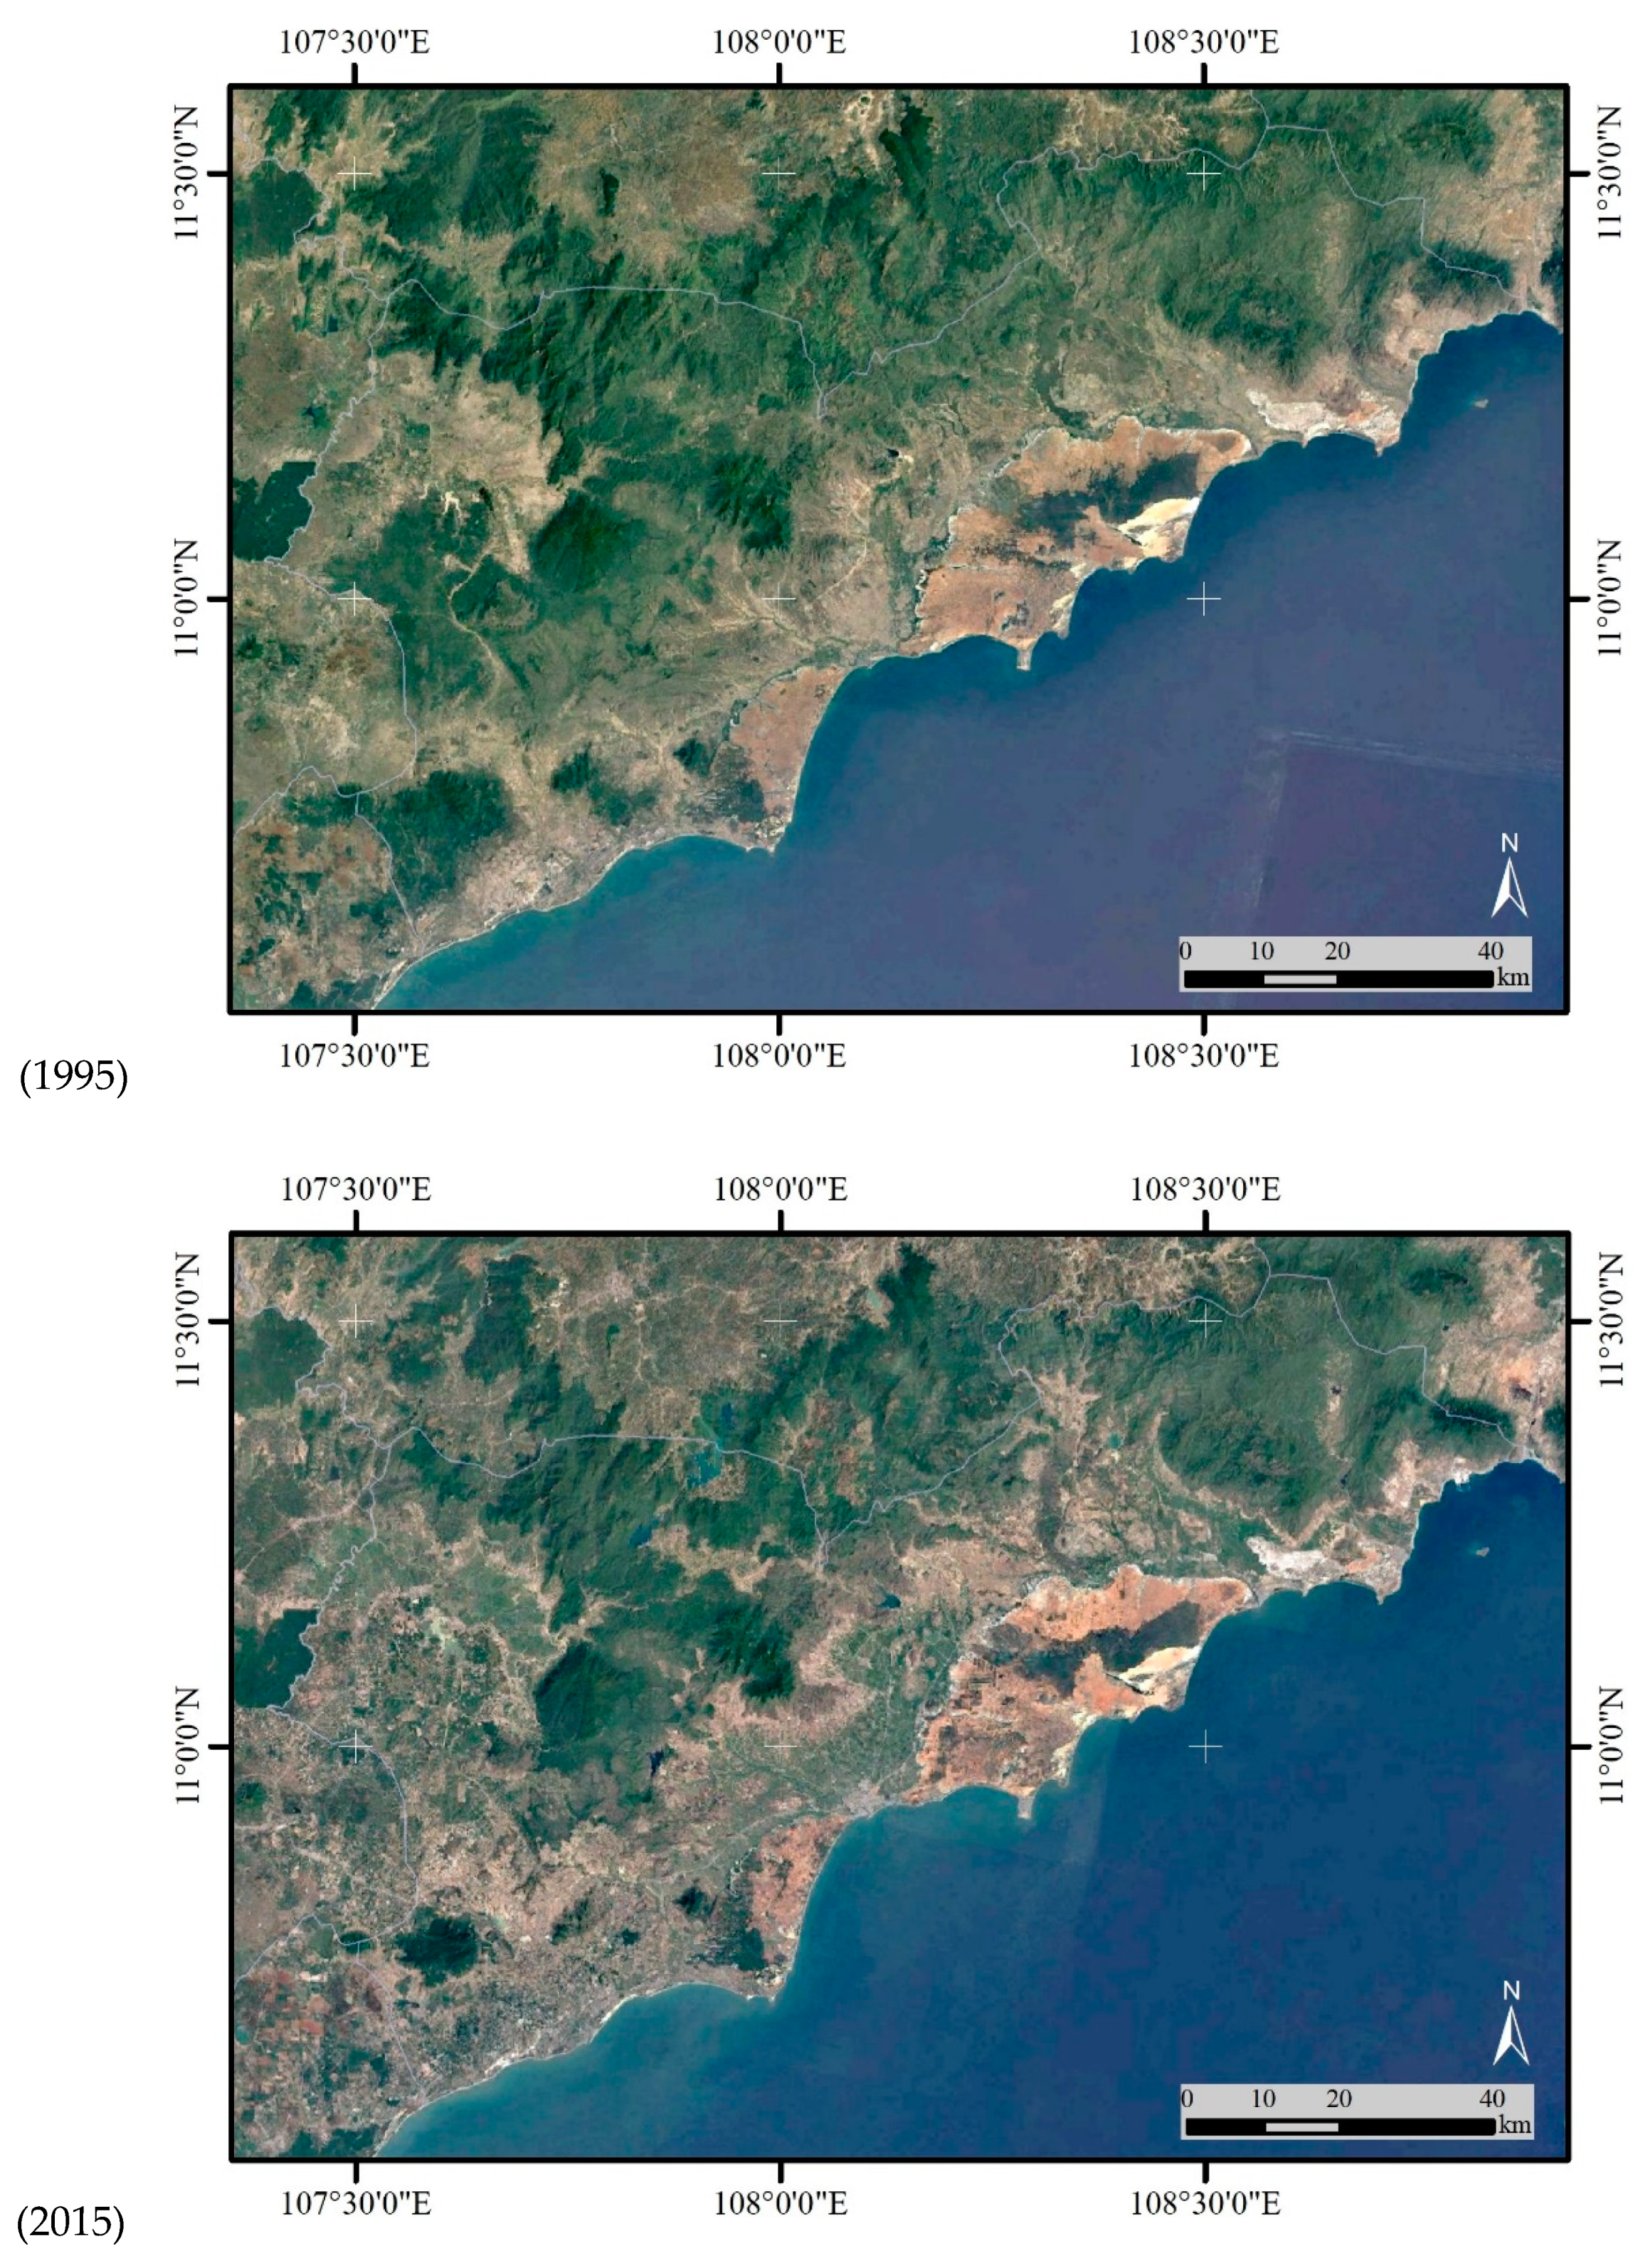
Since land cover/use changes constitute one of the major drivers or explanatory factors of drought, land degradation and desertification [
31,
33], remote sensing offered a considerable potential for quantifying land cover changes in an objective manner. Time series of Landsat images are available from the Landsat archive of the United States Geological Survey [
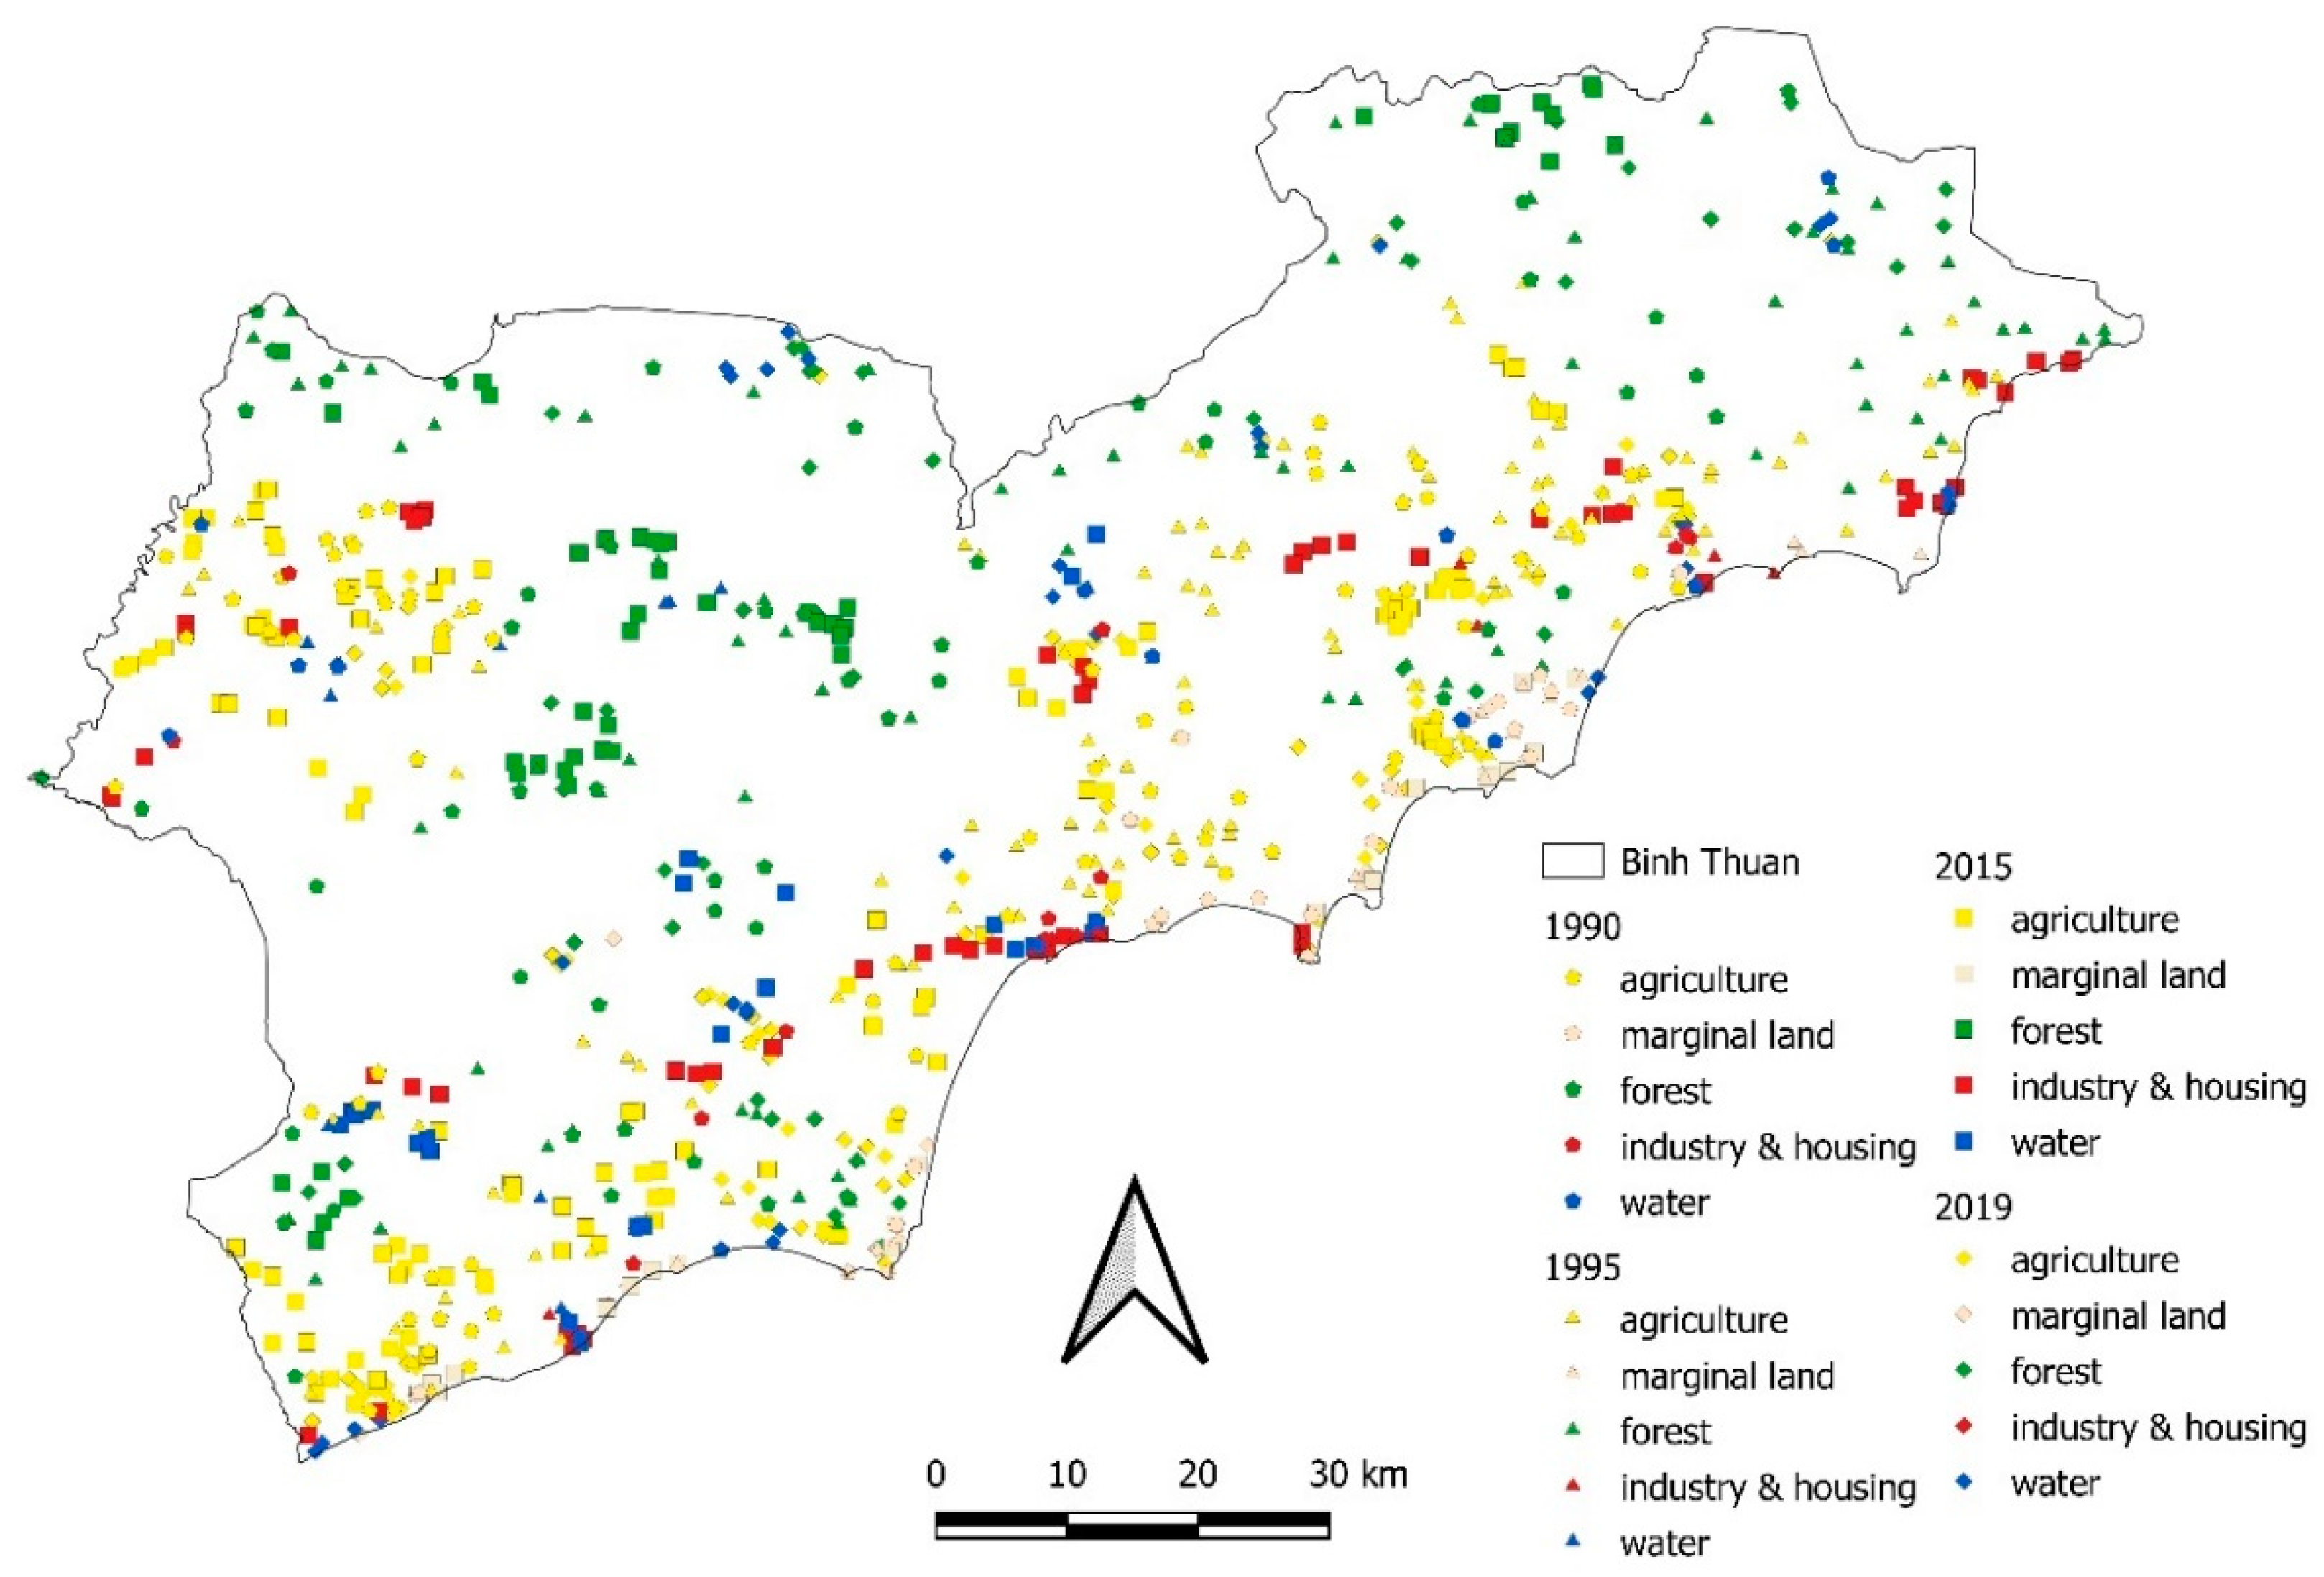
61]. Binh Thuan province was contained within Landsat path 123, row 52 and path 124, rows 52–53. Cloud-free Landsat-5TM and Landsat-8OLI images were selected to classify the land cover in the study area during the period of 1990–2019. Training samples were selected to derive distinct spectral signatures for each of the five major land cover classes by delineating polygons in representative visited sites (
Appendix A). Supervised maximum likelihood classification was used to classify the different land cover classes for the years 1990, 1995, 2000, 2005, 2010, 2015 and 2019. A kappa statistic [
62] was used to assess the classification results. Spatial and temporal land cover changes were analysed for the major land cover classes: agriculture, forest, water and aquaculture, industry, settlement and bare land. In addition, Landsat images were used to distinguish between irrigated and non-irrigated agricultural land. All spatial analysis and map visualisations were achieved with QGIS [
63].
2.5. Participatory Methods
In order to comprehend the impacts of land degradation, a field reconnaissance survey was organised to include a participatory land resource analysis [
39], and transecting the major landscapes [
38,
64] within the province to elucidate the major differences in the region (
Figure 2). Areas where land degradation occurred were part of the field observations. Informal interviews were conducted with farmers, fishermen and villagers. GPS positions were taken at observations of land degradation, vegetation, crops, water bodies and soil. Open-ended informal interviews were administered to elucidate mitigation measures and adaptation options.
At all of the 10 districts, key informants were interviewed to assess land degradation and elucidate pressures and adaptation strategies. Key persons were district officials, provincial authorities, local scientists, irrigation experts and water board officials. Stakeholder workshops were held to discuss the results and findings with the provincial and district departments of science, technology and environment, agriculture, forestry, natural resources and mining, and the water board.
The impacts of land degradation on socio-economic status were assessed using in-depth family and community questionnaires. The sample included 208 family interviews with one family member and 29 community interviews with the leader of each commune. The main items addressed in the community questionnaires were general information (area, population, land use), infrastructure (transportation, electricity, school), distribution of labour in the commune according to types of economic activities, quality of life (main water sources, household commodities, living standard), and activities to reduce poverty. The main topics of the household questionnaires were general information (number of people, main income), total compound area and economic activities (agriculture, fishery), main water source used and purpose, and annual household income and expenditure. The interviews were carried out on a voluntary basis.
Vulnerability indicators were elucidated during the interviews and compared at the household, commune and district levels. These indicators were subsequently related to land degradation using a Spearman correlation analysis.
3. Results
The first section illustrates the patterns of land degradation (
Section 3.1). All the other sections follow the different components of the framework (
Figure 1), starting with a section on the drivers of land degradation (
Section 3.2). This is followed by a description of current land use types, land cover and its changes since 1990 as pressures of land degradation (
Section 3.3). The next section explores the impacts and vulnerability of local land users at the household, community and district levels (
Section 3.4). The last section discusses adaptation strategies for coping with land degradation (
Section 3.5).
3.1. Patterns of Land Degradation
The contrasting environments, from desert-like sand dunes near the coast to rice-based agriculture on the plains and lush humid forest in the north and west, resulted in different forms of land degradation along the transect (
Figure 1 and
Figure 3,
Table 2). The different forms of land degradation covered 90,000 ha or 11.5% of Binh Thuan’s land surface in 2010. The area under severe land degradation included shifting sand dunes (63%), degraded land due to ravine and gully erosion (14%), saline areas (13%), and rock outcrops on the lowland plains (10%).
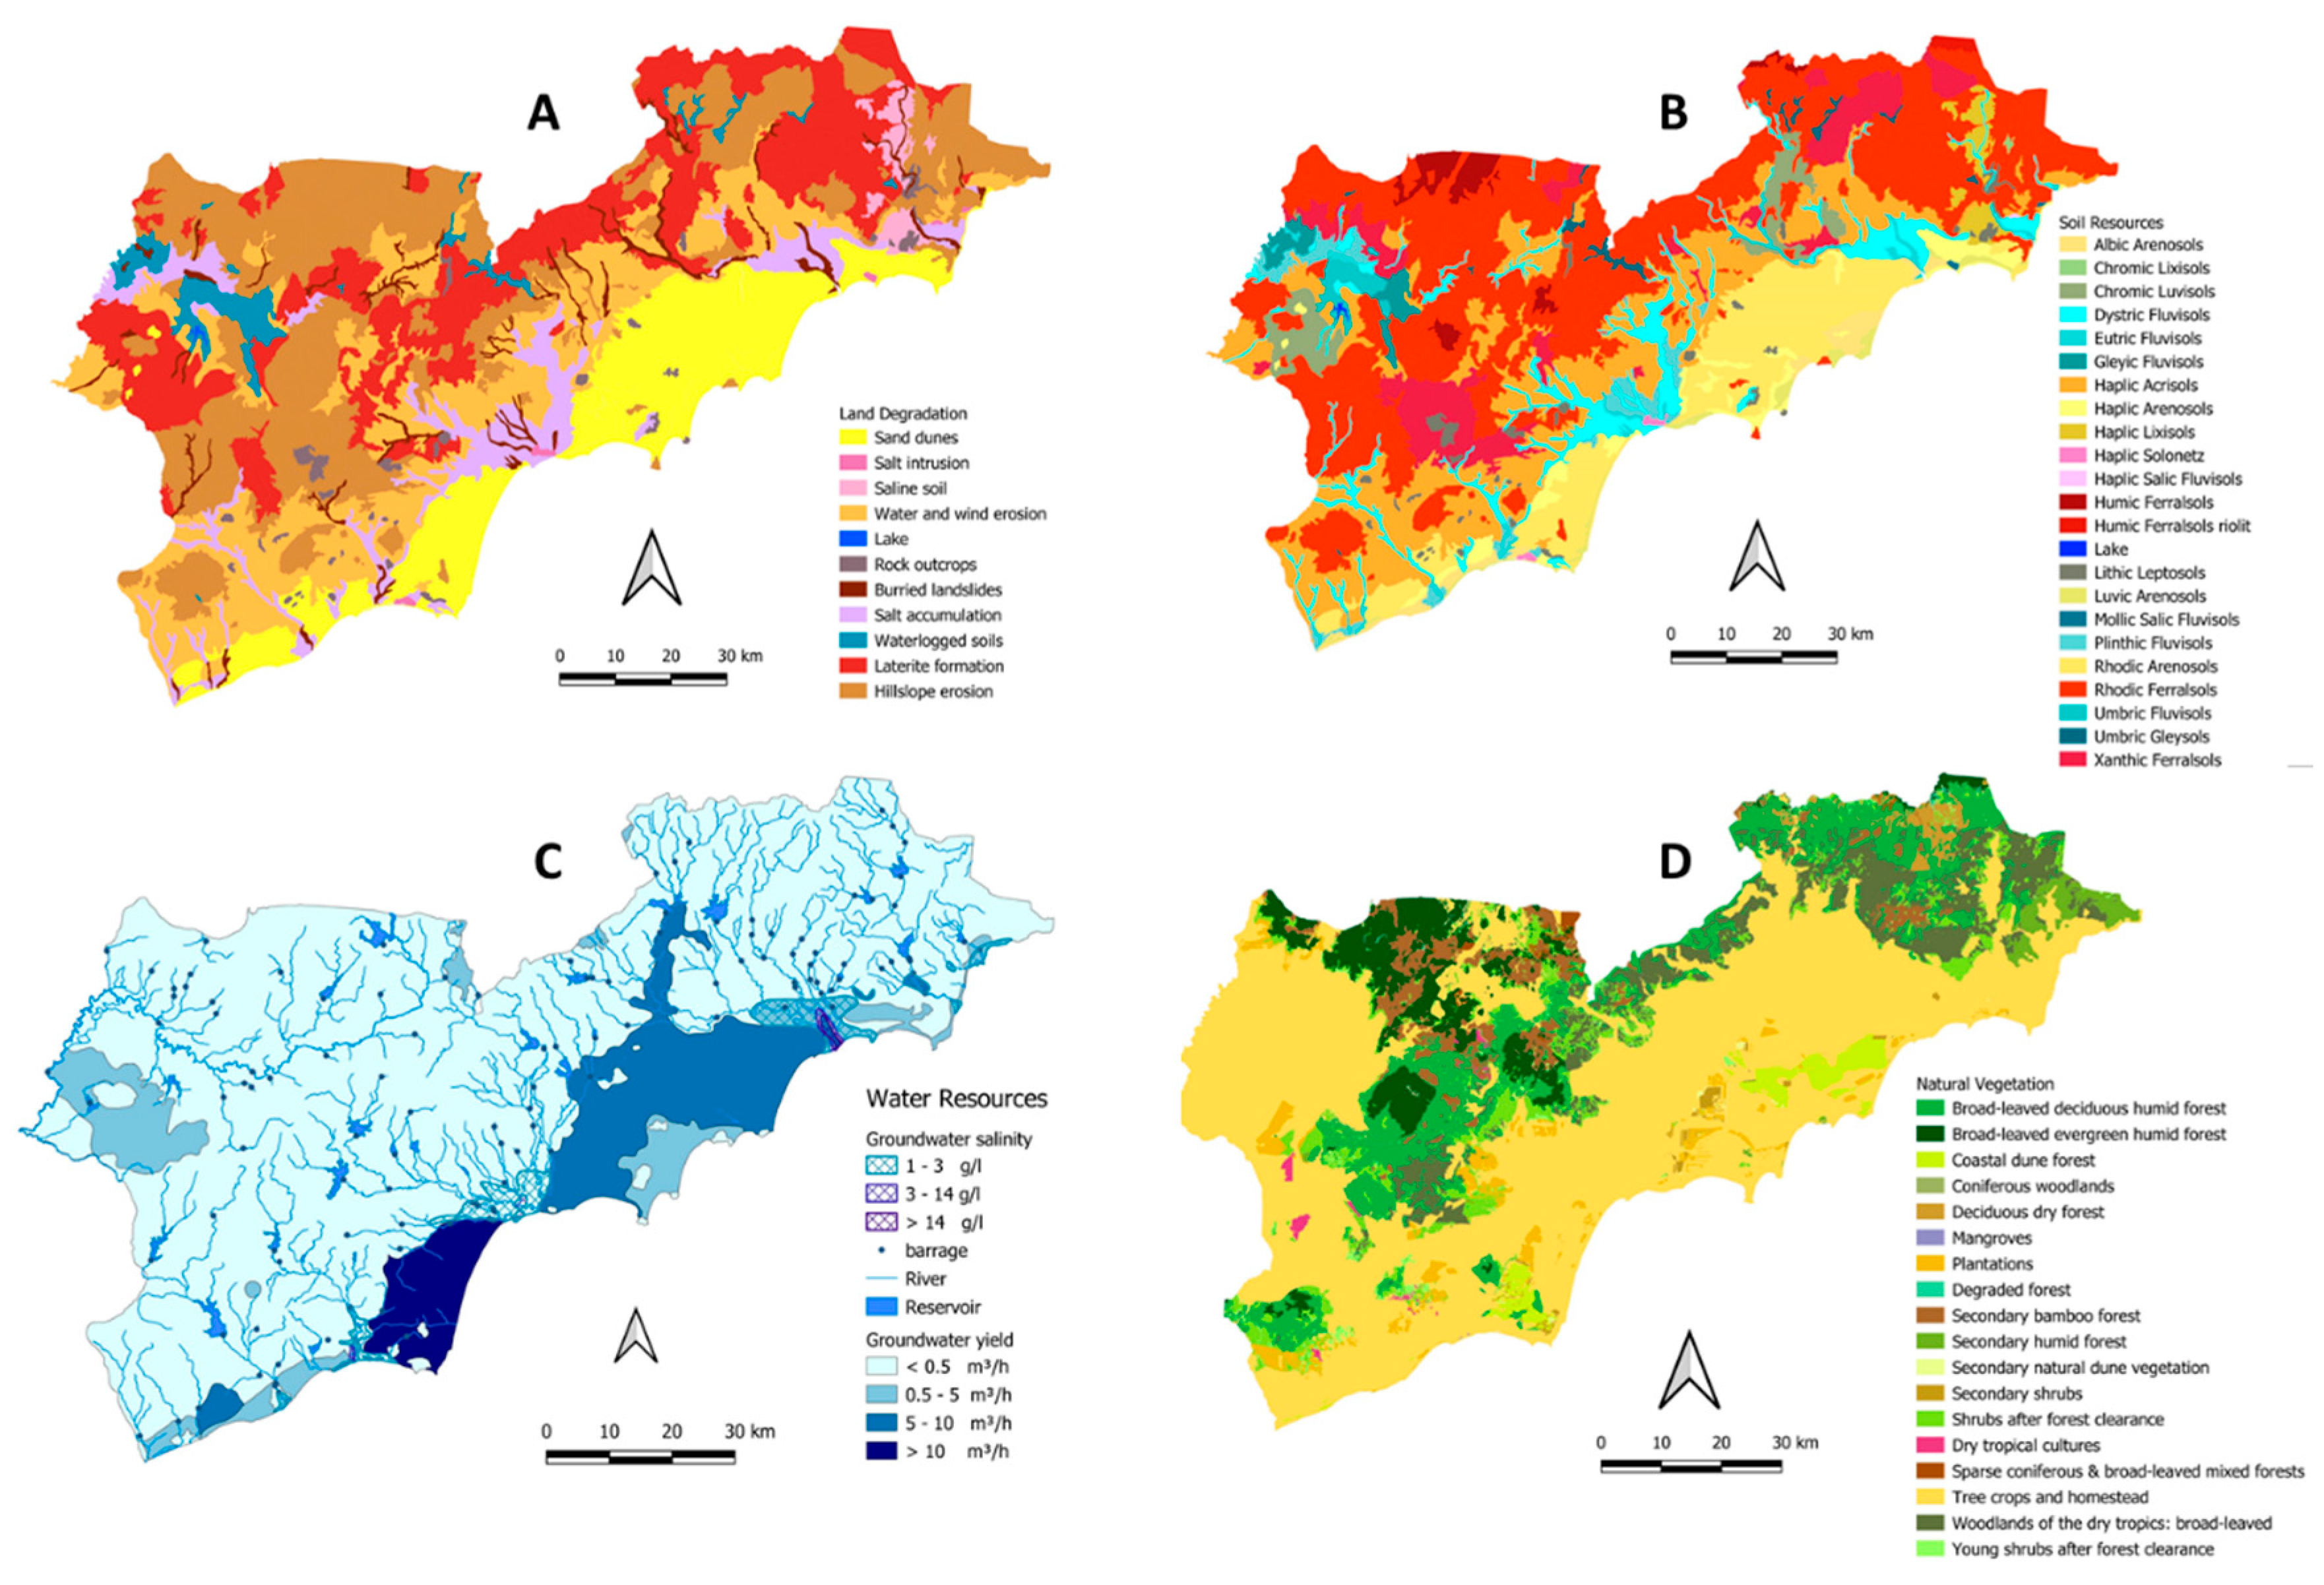
There was a clear relation between the vegetation, soil, land management, dominant agricultural crops and the different forms of land degradation (
Table 2,
Figure 3 and
Figure 4).
Sandy soils (Arenosols) developed on sandstone formations as part of a 1259-km
2 coastal dune complex (
Figure 4) with spectacular gullying and ravine erosion. The very low water holding capacity of Ferralic Arenosols encouraged the cultivation of drought-tolerant crops such as cassava, cashew and mango. Due to low rainfall, there was little surface runoff and the ability to recharge the groundwater was limited. Lakes and ponds were reported to have decreased by 50 cm in depth in the past six decades. In addition, the groundwater was becoming saline since exploitation leads to the intrusion of marine water. Cactus-like vegetation, coconut groves, grasses, dry shrubs and coniferous trees alternated between sand dunes and barren countryside.
The alluvial plains along the major rivers consisted of Fluvisols (994 km
2) and Gleysols (51 km
2) (
Figure 4). These alluvial soils had a variable texture from very clayey to very sandy depending on their position in the landscape and vicinity to the main river and were suitable for irrigated dragon fruit (Hylocereus undatus) and wetland rice (Oryza sativa). The natural vegetation included mangrove marshes at river deltas in the southern area and bamboo-dominant forests along seasonal streams (
Figure 4).
Between the coastal dunes and the mountains, an undulating plain consisted of clay enriched subsoils (
Figure 4), comprising Haplic Acrisols (1542 km
2, 20% of the area), Luvisols (2210 km
2 or 3% of the area) and Lixisols (96 km
2, less than 2%). The highly weathered soils, with an increasing clay content in the subsoil were poor in nutrients and had a low binding and water-holding capacity. Regular droughts contributed to laterite formation. Saline soils (0.3% or 238 km
2) occurred at the transition between sand dunes and plains. Soils accumulated salt as high evapotranspiration rates often exceeded rainfall. Salinisation and laterisation affected soil suitability, vegetation and agricultural land use. Elevations below 800 metres supported shrubs dominated by thorny trees as part of the dry coastal forest ecoregion (
Figure 4).
The Rhodic Ferralsols in the mountains were highly weathered, red, clayey soils that covered 45% of the province or 3490 km
2 and were mostly found in tropical, humid rainforests (
Figure 4). Leptosols formed on granite outcrops and covered only 1.2% of the entire area (936 km
2). The highly contrasting topography with sloping surfaces and high rainfall intensities during the rainy season triggered soil erosion, landslides, flash floods, leaching and waterlogging. The original vegetation was a mixture of evergreen, semi-evergreen and deciduous forest distributed over the hills and mountainous nature reserves. Near the mountain summits, a broadleaved evergreen forest of the humid tropics occurred, whereas a degraded and secondary deciduous broadleaved forest covered lower elevations (
Figure 4).
3.2. Drivers of Land Degradation
3.2.1. Climate
Phan Thiet and Phan Rang stations displayed an annual negative water balance with an average deficit of 625 mm and 1030 mm, respectively, caused predominantly by a distinct dry season with virtually no rainfall (
Figure 5). The dry season lasted around 9 months (263–311 days) in the northeastern sand dunes (Phan Rang,
Figure 5), 6–8 months (179–243 days) on the lowland plains (Phan Thiet,
Figure 5) and 0–3 months (0–110 days) in the mountains (Bao-Loc,
Figure 5).
Monthly and daily 10-day precipitation showed a high variability in annual rainfall for the three stations (
Figure 5). Rainfall ranged between 449–1332 mm in the driest regions (Phan Rang), 784–1768 mm on the lowland plains (Phan Thiet) and 2195–5262 mm in the mountains (Bao-Loc) between 1980 and 2009.
The average length of the climatological growing period (LGP in
Figure 5) increased from 119 days in the northeastern dry zone around Phan Rang (AI = 0.27 to 0.70, semi-arid), to 183 days in the rice growing plains of Phan Thiet (AI = 0.44 to 0.99, dry sub-humid) and up to 365 days in mountainous Bao-Loc (AI = 1.5 to 3.99, humid) (
Figure 5). A large variability was observed in the onset and end of the growing period between the different years, as evidenced by the error bars (LGP in
Figure 5).
The monsoon was reported to arrive late more often and rainfall during the onset of the wet season became more erratic, causing a shift in the growing season. During the period of 1980–2009, there were between 5 and 6 dry months a year with rainfall below 5 mm/month and between 3 and 4 months with rainfall below 1 mm/month in Phan Rang. The topographical characteristics of the region created a micro-climate of localised semi-arid to arid areas, intensified by a long dry period of up to 9 months a year. Long sunshine duration, strong winds and an extended dry period have contributed to prolonged drought and subsequent land degradation processes. With an annual rainfall of less than 500 mm, the northeastern part of the province was the driest region, with sandstorms sweeping through the countryside during the dry season.
3.2.2. Population Dynamics
Bình Thuan province had a population of 1,239,200 people in 2018, corresponding to a density of 156 persons/km2. The population density ranged from 1085 persons/km2 in cities such as Phan Thiet to less than 67 persons/km2 in the most rural district of Bac Binh. The population had grown by 15.7% since 2000. Growth was particularly strong in the cities and towns at 1.0% per year. As a result, settlement areas increased by 43.5% between 2000 and 2018, and industry and services by 136.6%, making Binh Thuan one of the most urbanised provinces of the southeast coast of Vietnam.
Migration points to urbanisation and rural outmigration, which were not higher than in the entire country. A minor rural outmigration of 800 persons per year during the 2000–2010 period in the northern districts reflected the trend that (mainly) young people preferred to work in industry and major cities. Migration between rural and urban areas was explained by economic reasons such as the attraction of industry, increased tourism along the coast, or other service sectors. During the 2010–2018 period, the rural population increased by 5.3% and the urban by 5.4%. The net migration rates during the same period fluctuated from −5.4% to 0% in 2016–2017 and −1.6% in 2018 and showed an overall outmigration. The data, however, did not provide evidence for land degradation-induced migration.
3.3. Pressures of Land Degradation
3.3.1. Major Land Use Types
Forests occupied more than 60% of the area prior to 2000, almost 46% of the area in 2010 (
Figure 6), and 43.3% in 2018 (
Table 3): an overall decline of 29% during the 1998–2018 period. This decline was not evenly spread within the province. The Thanh Linh district lost 52% of its forest cover from 1965 to 1998, leading to drought and flash floods. Past deforestation in the 1970s increased agricultural production, and the inherently poor soil quality of predominantly sandstone originated soils resulted in desertification near the coast. During dry periods, the reliance and pressure on natural vegetation and forest resources increased, not just for wood and charcoal but also for wild edible and marketable forest products.
From 2008 onwards, sand dunes have been stripped of vegetation for titanium mining purposes, causing the expansion of sand dunes. In addition, water used for filtering titanium from sand and salt byproducts tainted the agricultural land and water resources due to salinity. The noise, dust and pollution adversely affected the tourist sector along the coast. On the other hand, the same tourist sector put a lot of pressure on freshwater resources and competed with household water supplies and irrigated agriculture.
3.3.2. Land Cover Change
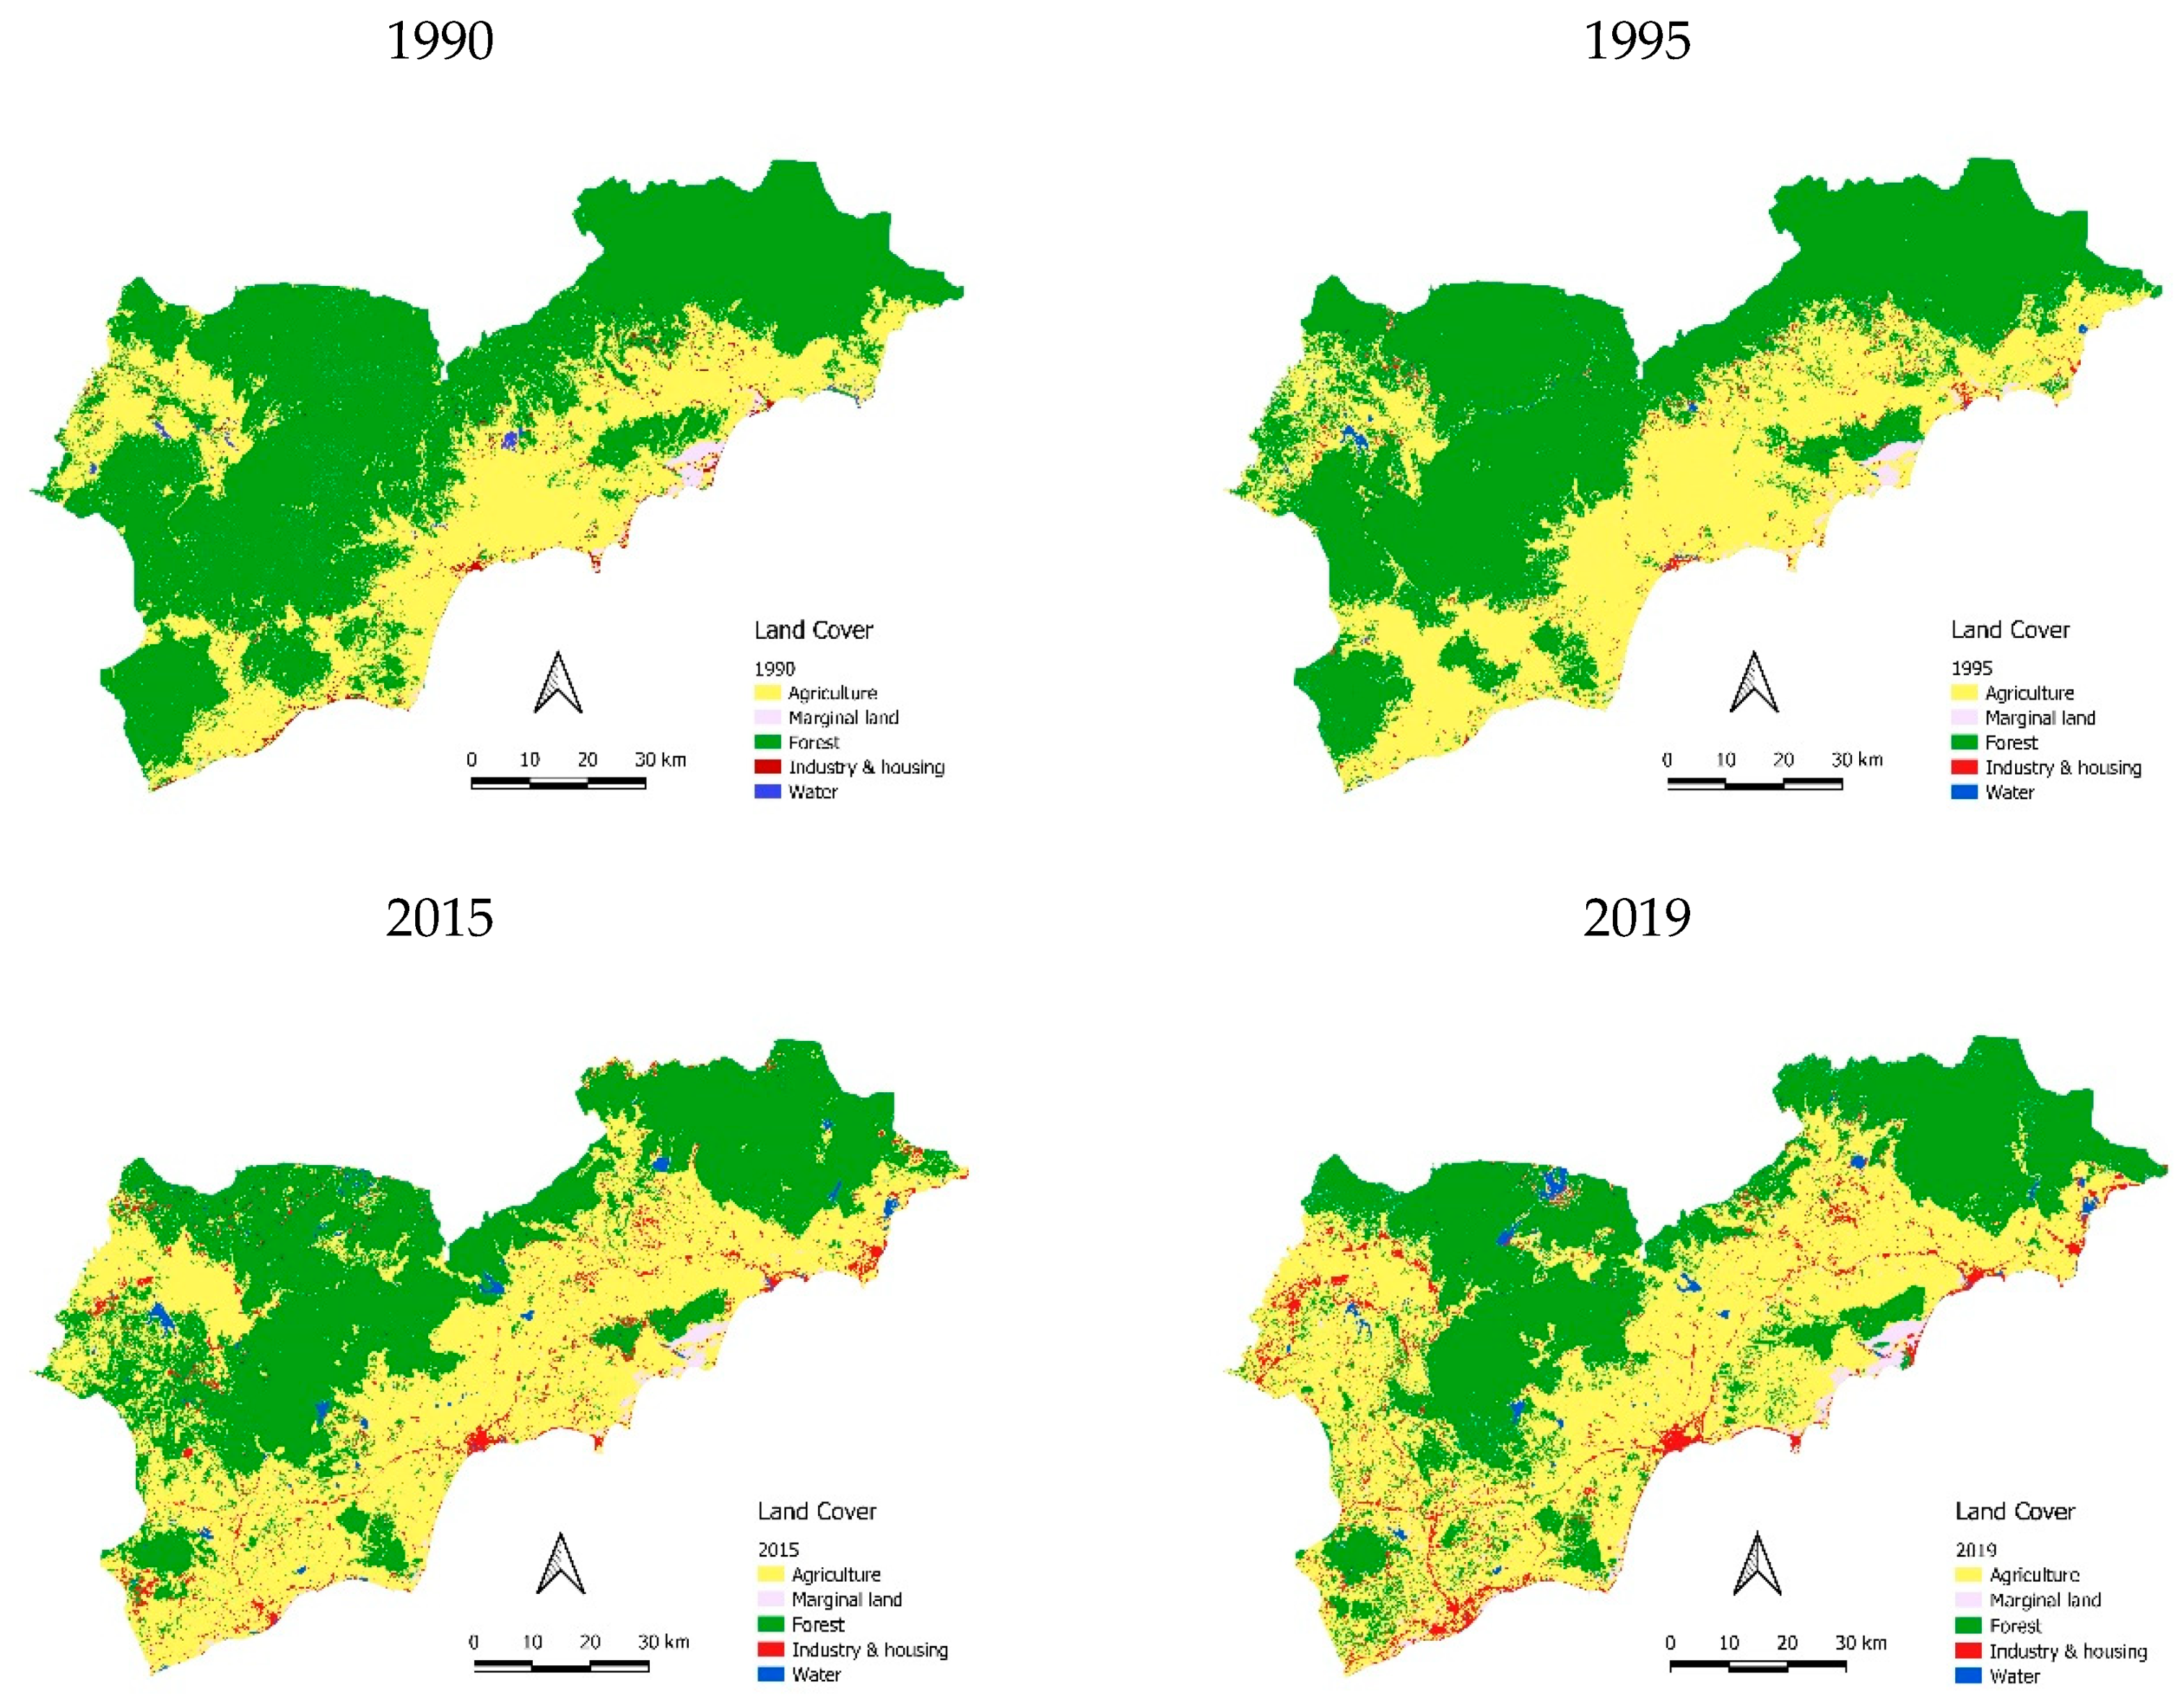
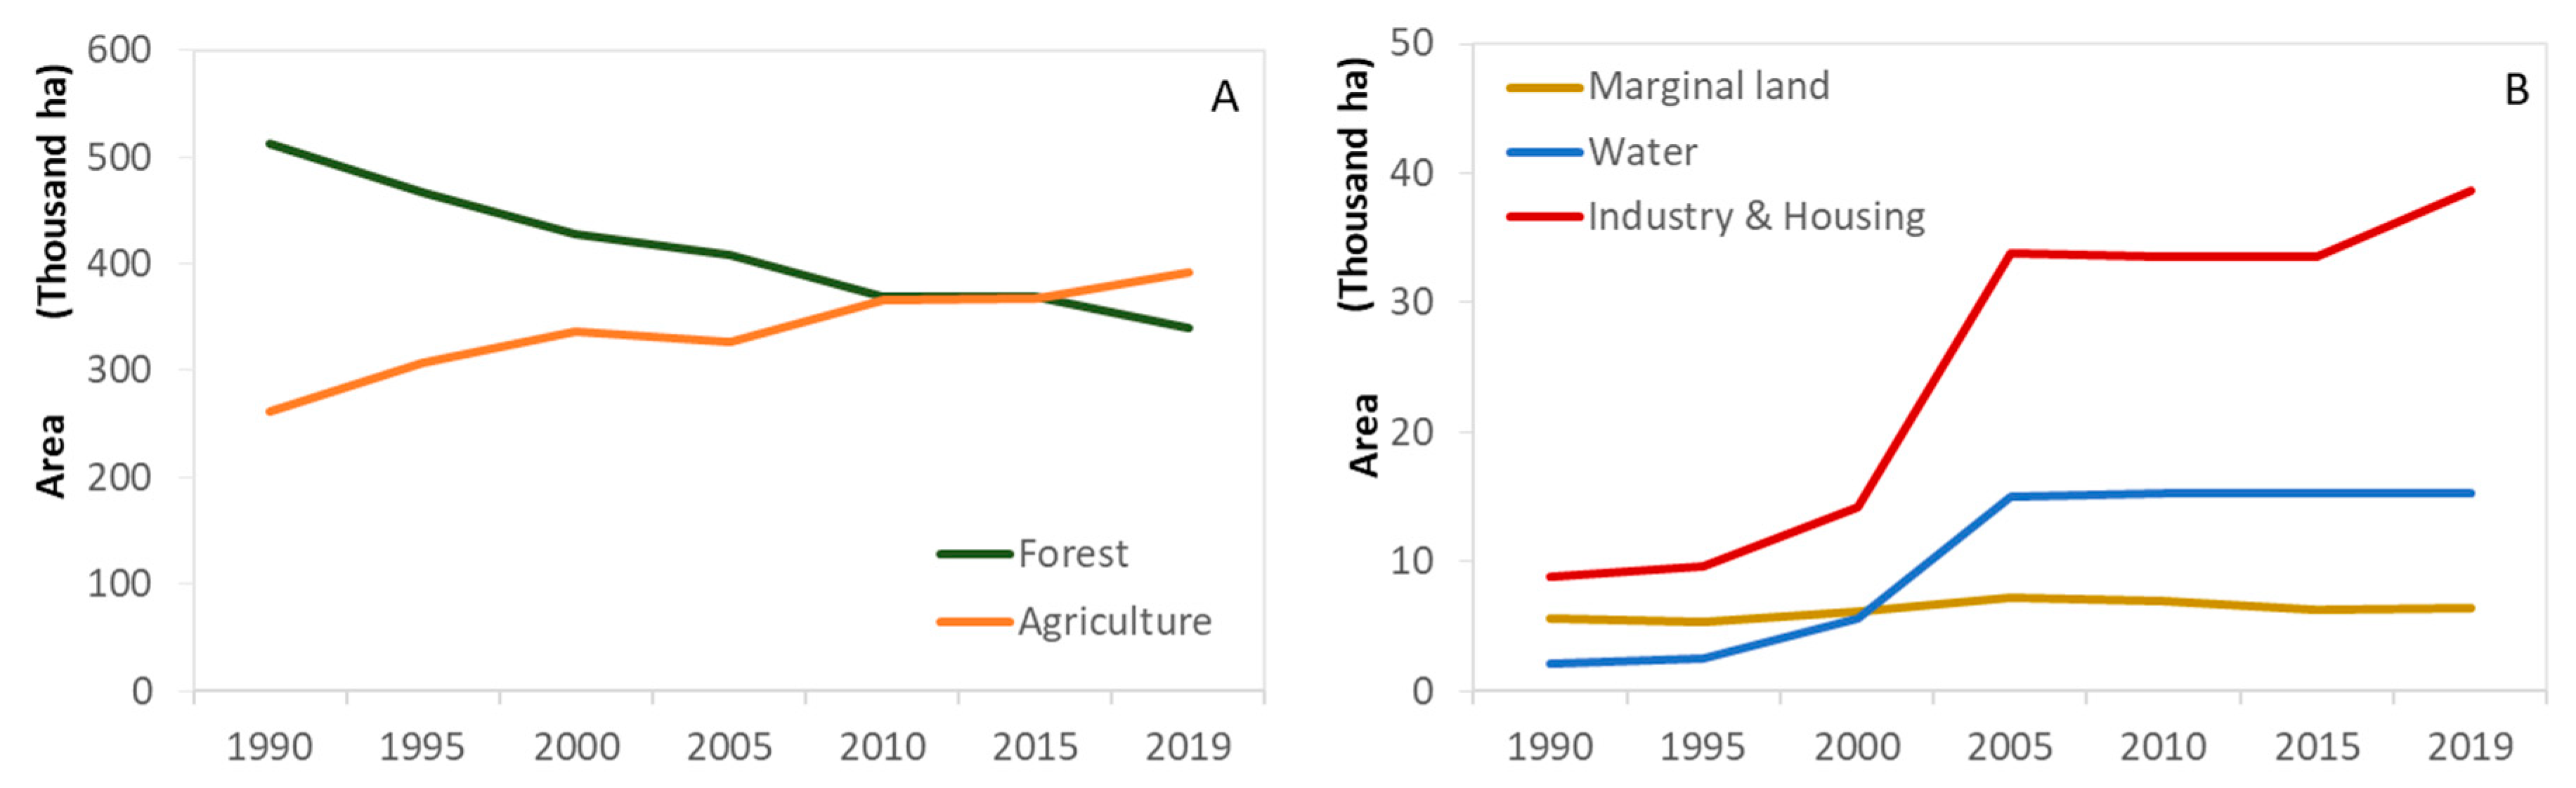
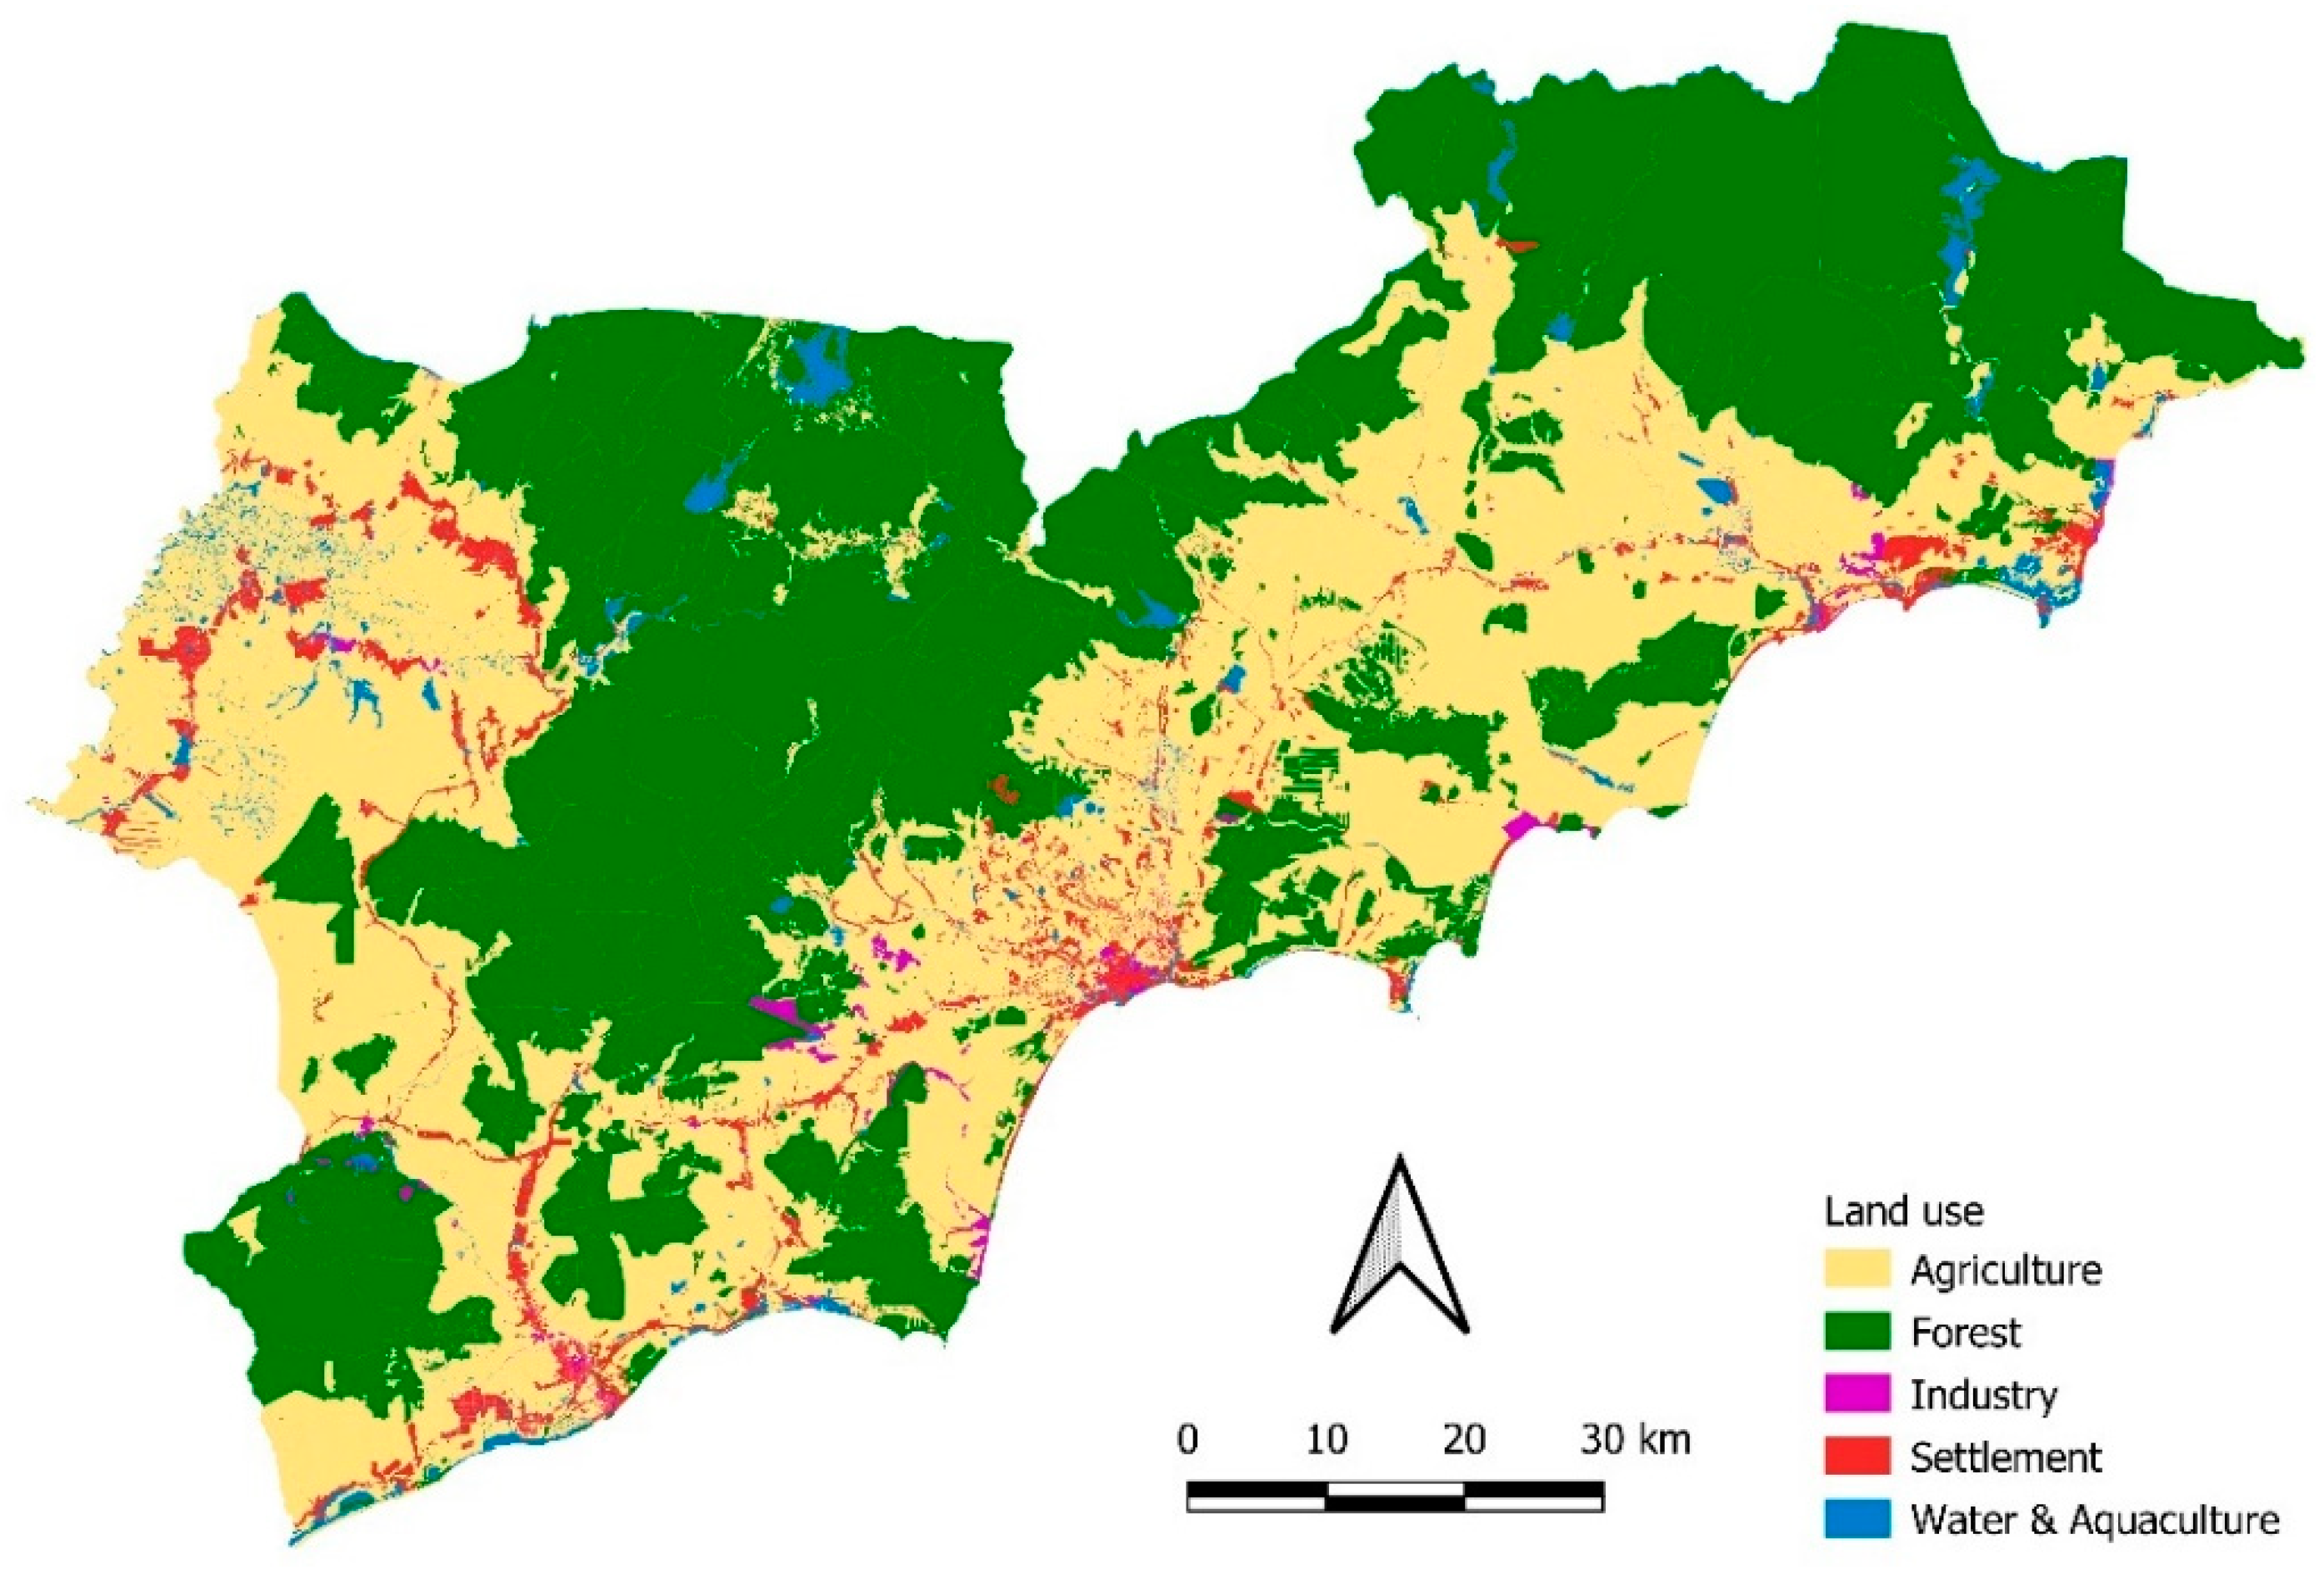
The long observation period of the Landsat archive allowed us to identify five major land cover classes: forest, agriculture, water, industry and housing, and marginal land, with a kappa statistic between 0.81 and 0.95 for each land cover map. A further distinction between cultivated and non-cultivated agricultural areas allowed for an analysis of natural resource use and irrigation development in the province.
With 46.2% of the total land managed by farmers in 2010 (
Figure 6), agricultural land use almost equalled forested area (46.7%), as clearly confirmed by a land cover time series analysis using the Landsat archive (
Figure 7,
Figure A1 and
Figure A3). The area for rice cultivation in 2010 declined by 7%, following the severe droughts of 2005. Rice production, however, did not decline due to irrigation and the subsequent possibility of growing a third crop for one year. Irrigated agriculture took place on 83,482 ha in 2010, mainly on Acrisols (56%), followed by Ferralsols (18%), Luvisols (14%) and Fluvisols (12%) (
Figure 4 and
Figure 6). Priority was given to irrigated rice as the major staple food crop. Suitable irrigation perimeters were identified mainly on Fluvisols (45%) and Acrisols (24%), followed by Luvisols (15%). Nearly 20% of the land was used to grow perennial crops. Irrigated dragon fruit has gained importance as a cash crop grown for both local consumption and export.
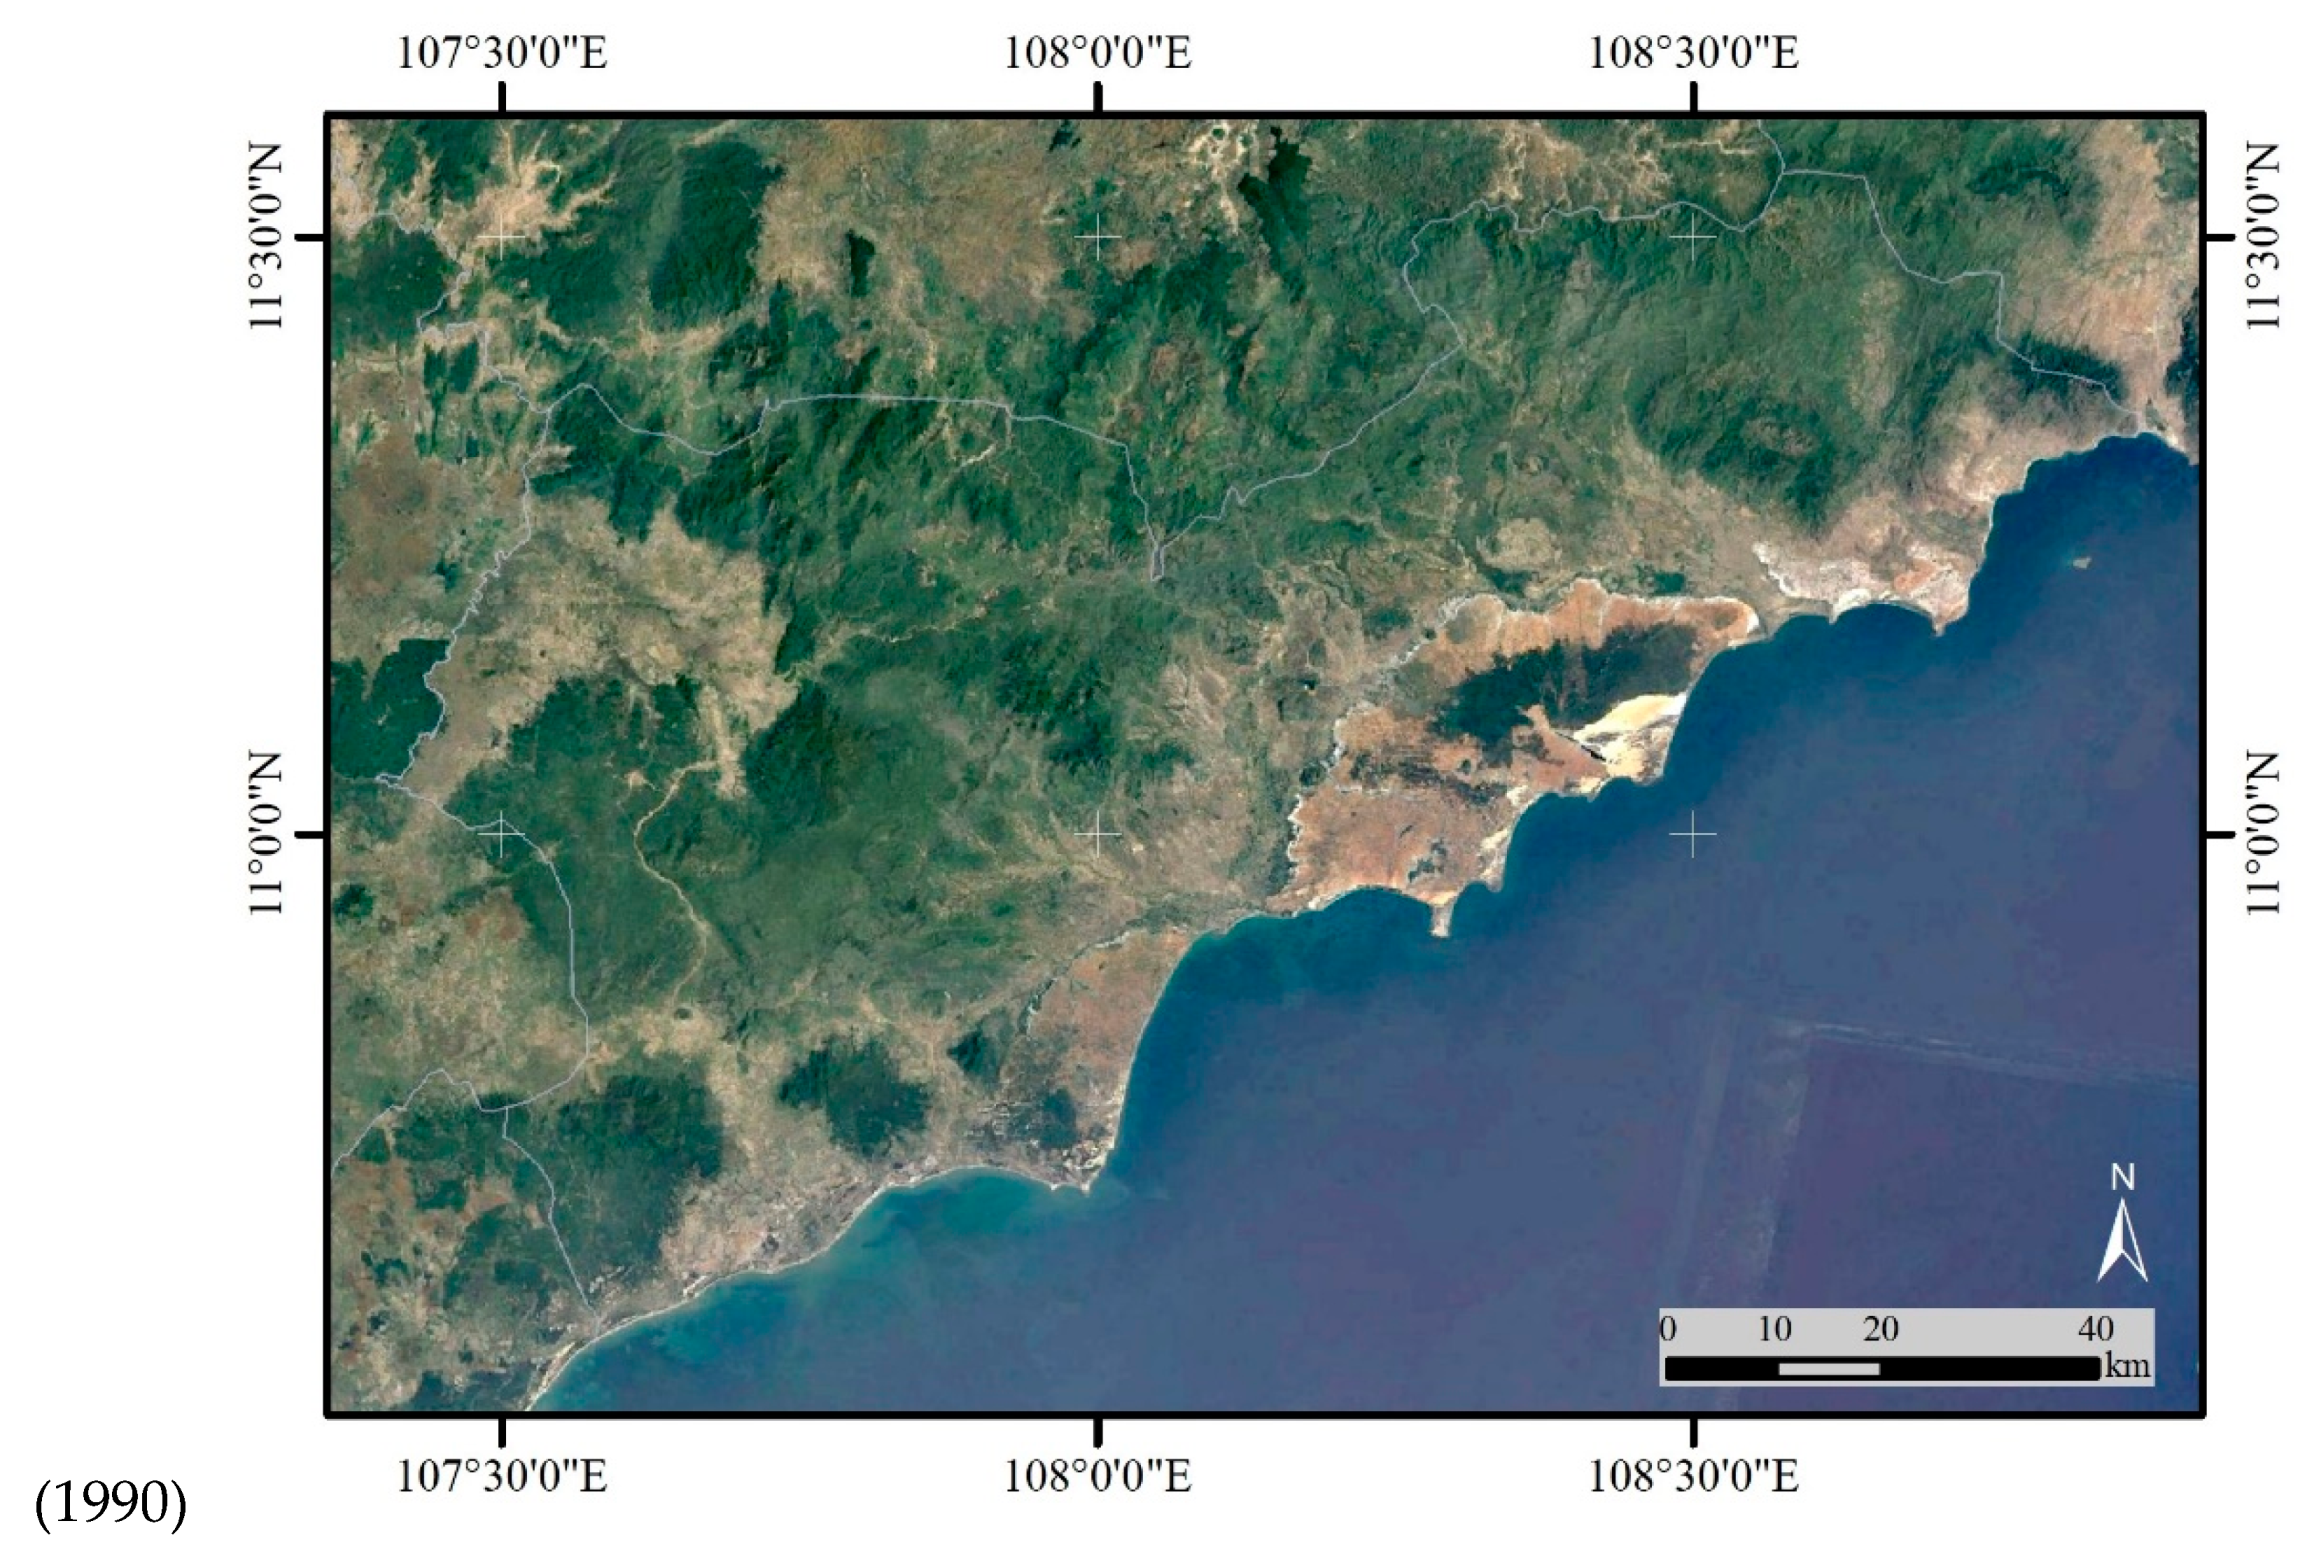
Land cover changes during the 1990–2019 period showed an increase in agricultural land cover from 33% in 1990 to nearly 50% in 2019 (
Figure 7,
Figure A1 and
Figure A3). Between 1998 and 2018, maize (9405–9,573 ha) was, after paddy rice (78,571–125,207 ha), the most important staple food crop. Vegetables (25,189–22,128 ha) and oilseed crops such as sesame and peanuts (11,424–12,761 ha) were stable in terms of area, while cassava (5354–30,868 ha) increased enormously in terms of area and was mainly grown on light textured and poor soils. Fruit trees (4968–40,878 ha), of which dragon fruit formed the largest part, increased more than eightfold in terms of area.
Farmers cultivated, on average, 4 ha of agricultural crops, mostly rice (55% area) followed by maize, cassava, melon and sesame. With the increasing availability of irrigation infrastructure, most of the farmers preferred to increase their cropping intensity to three rice crops per year. Paddy production in the worst-affected districts of Thuy Phong and Bac Binh (
Figure 2 for location) has more than quadrupled from 55,592 to 246,946 tonnes during the 1998–2018 period, while the planted area has declined by 14.5% between 1998–2018, but increased by 60% between 2010–2018, owing to irrigation. Cash fruit crops such as dragon fruit have also increased in the districts of Thuy Phong and Bac Binh from 236 ha in 2004 to 4460 ha in 2018.
The increase in agricultural area happened at the expense of forested area, which decreased from nearly 65% in 1990 to 43% of the province in 2019. Urban development, including settlements, industry and services, comprised 5% of the area in 2019, and quadrupled between 1990 and 2019. Water bodies increased sevenfold due to dam construction in the forested and humid northern area of the province and due to the rise in aquaculture in the plains. Marginal land included sand dunes and rock outcrops and covered less than 1% in 1990, with a 12% increase by 2019, mainly due to deforestation in the hills, while the sand dunes seem to have stabilised following revegetation programmes. Bare land covered only 8.5% of the total degraded land in the province and showed that pressure on the land is high.
Historical devegetation left the sandy areas near the coast to cope with intense heat, drought and flood cycles. Shifting sand dunes and gully formation were found to restrict land use development, threaten roads and buildings, and affect vegetation, habitats and agricultural productivity. The plains with clay soils and meandering streams hosted rice-based farming systems. Paddy rice occurred where rainfall and topography allowed the rice fields to be submerged during at least part of the growing season.
3.4. Impacts and Vulnerability
While drought and intense heat may have contributed to poverty in rural areas without access to water resources, particularly so in the east of the province, the west of the province was at risk of flooding and water erosion. Combined effects of drought and human activity increased natural resource degradation and ecological vulnerability, which, in turn, affected socio-economic vulnerability.
3.4.1. Vulnerability at the Household Level
The majority of households (n = 208, 66%) lived in larger villages or urbanised areas and relied on tap water. Bridging the dry season gap with the available freshwater resources remained a major challenge in rural areas. Dams and reservoirs supplied the cities, major villages and coastal areas with drinking water and hydroelectricity, and the plains with water for irrigation. Groundwater in the coastal areas was at risk of becoming saline due to high water demands and overexploitation.
Households of, typically, between five and eight people lived on a 0.1-ha compound that comprised a house, a home garden with fruit trees and vegetables (73% of compounds, n = 208), a pond and a patio. Rural families used well water (40%) and harvested rainwater (5%), but were at a disadvantage in comparison to those that benefitted from piped water near urban areas or from new water infrastructure in the rural areas.
Households reported an average yearly income of around EUR 4000, of which around 58% came from agriculture (crops, animal husbandry, aquaculture). The self-reported average annual income per household was higher than the official statistics and doubled in 2.5 years’ time, while the inflation rate was 18%. With incomes rising faster than inflation, investment was possible and contributed to the resilience of farmers looking for a solution to drought and land degradation. Significant variations existed according to the location and source of income. Income levels were higher in the coastal area due to aquaculture (mostly shrimps), fishery, tourism and cattle breeding. The majority of expenses were food, homestead maintenance, schooling and energy. The most popular investment was in housing and land acquisition, followed by boats and fishing equipment. Poor households had a monthly income per adult below EUR 18 in the cities or below EUR 14 in the rural areas. Between 0 and 32% of the households in the communes of the worst affected districts were poor, at an average of 12%, which is below the country’s average of 19%.
3.4.2. Vulnerability Indicators at the Household, Community and District Levels
Overall, there is a good agreement between the vulnerability indicators at the district (
Figure 8A), commune (
Figure 8B) and household levels (
Figure 8C).
At the district level, a Spearman correlation analysis between vulnerability indicators and land degradation revealed that land degradation was positively related to population pressure and the share of rainfed arable and agricultural areas, and negatively related to the presence of surface water availability and paddy rice cultivation at the district level (
Figure 8A). Remoteness, calculated as accessibility to major roads, and the share of agricultural land and forest to total surface area were weakly related to land degradation at the district level (
Figure 8A).
The results at the community level (
Figure 8B) showed positive correlations between land degradation and the number of households, the share of rainfed to agricultural land, and the share of non-paddy to agricultural land. Less degradation occurred in communities with higher shares of forest to total area, higher paddies to agricultural area, and higher ground and surface water availability. Incidentally, communities with less land degradation also had a larger share of the rural poor.
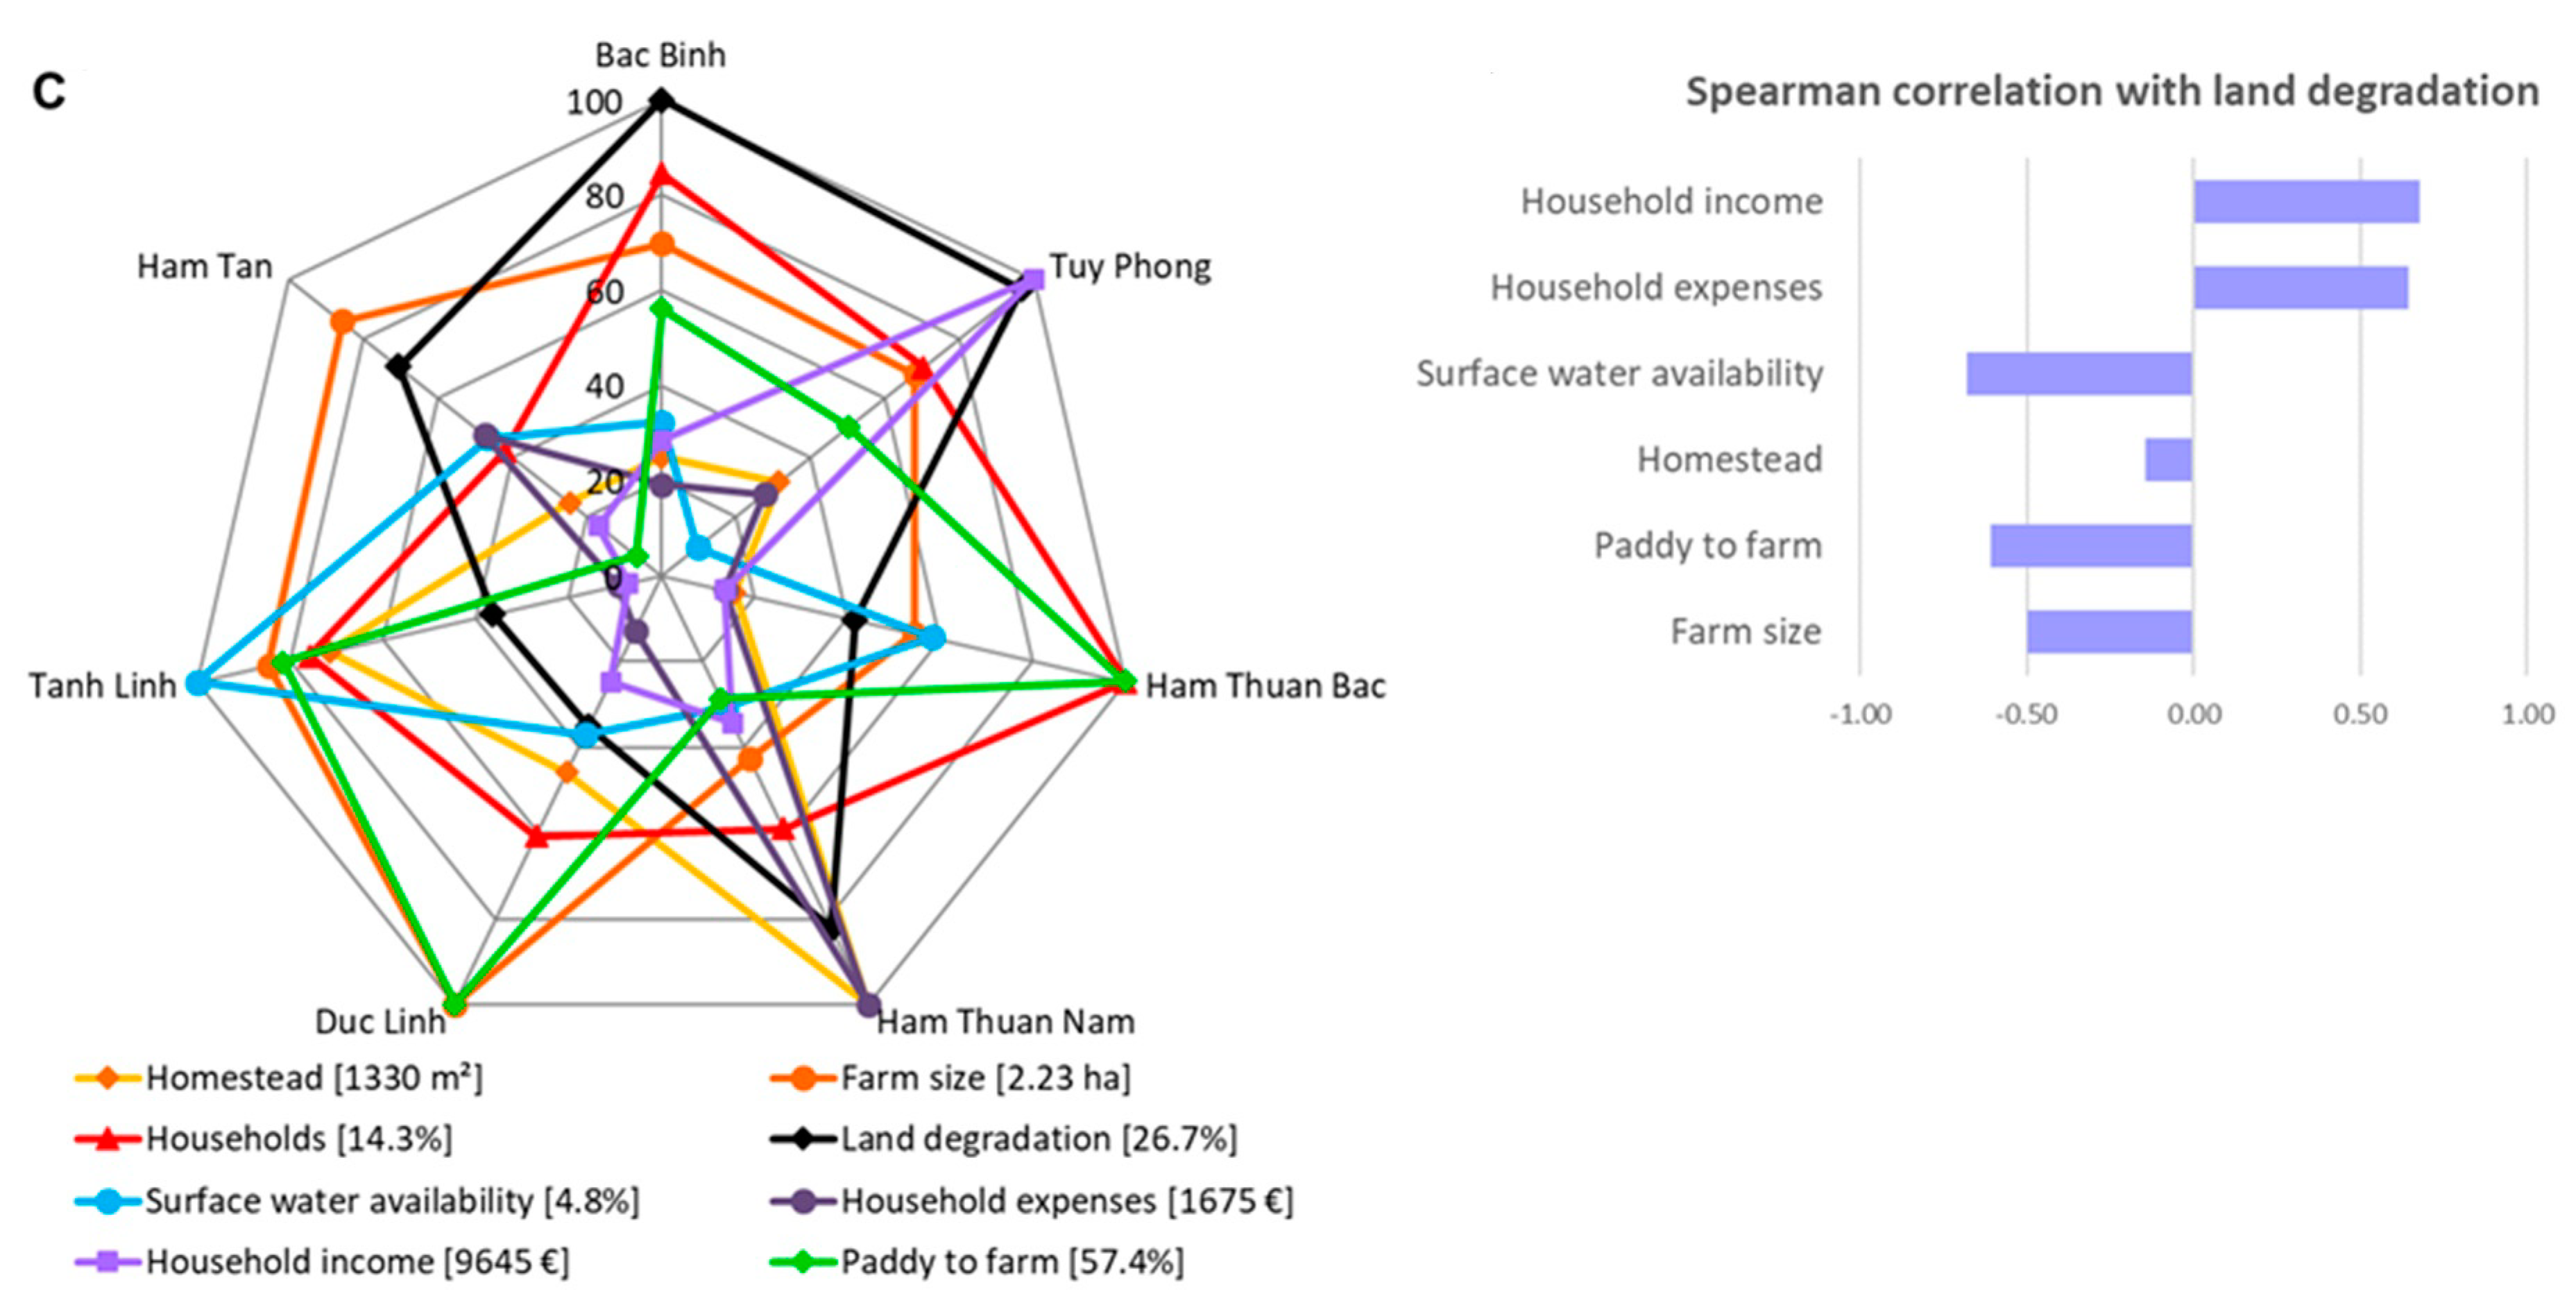
At the household level (
Figure 8C), land degradation was negatively correlated to larger farm sizes, higher shares of paddy cultivation to farmed area and surface water availability for household use. Large farm sizes were associated with paddy cultivation. The homestead area had a weak negative correlation with land degradation. Household expenses were higher in the most degraded areas, but so were household incomes. The household finances indicated that there were economic opportunities in the worst affected areas (
Figure 8C). Across the district, community and household levels (
Figure 8), the share of paddy cultivation, access to water resources and the share of forested area were related to less land degradation, whereas population density and rainfed non-paddy agriculture were linked to more land degradation.
3.5. Adaptation Strategies
Efforts to combat land degradation in the Binh Thuan province included sand dune stabilisation through the replanting of affected areas with adapted tree species and the construction of dams for water supply to the worst affected areas. The government planted more forests along the coast with trees that helped stabilise sand dunes, such as casuarina (Casuarina equisetifolia), cashew (Anacardium occidentale) and China trees (Melia azedarach). New drought-tolerant tree crops such as Jatropha and Sterculia were also introduced. The sand dunes offered opportunities for tourism with colourful canyon-like ravines. On sandy soils, a shift to drought-tolerant crops such as cassava and cashew has occurred. Lucrative lizard farms in the dry sandy areas produced valuable meat for consumption.
Binh Thuan province had 484,190 hectares of forest area in 1998, covering 60% of its natural land area (
Table 3); the forest cover declined by 32% between 1990–2019 according to Landsat imagery analysis (
Figure 7 and
Figure A1). The province is one of six localities that are implementing the United Nations Programme on Reducing Emissions from Deforestation and Forest Degradation (UN-REDD) in Vietnam, aimed at increasing carbon reserves through better forest resource management. The programme is mainly directed towards forest protection in hilly and mountainous communities.
On the lowland plains and hills, mitigation and adaptation efforts included land, water and soil resource management to prevent salinisation, laterite formation and erosion. At all levels of decision making (farm, village, district and province), many efforts were undertaken to cope with prolonged dry periods and bridge the dry season with the water resources available. These efforts included the construction of household water jars for rainwater harvesting from roofs by the United Nations Children’s Fund (UNICEF). Several dams were constructed to produce hydroelectricity, supply water to households and industry, and support irrigated agriculture.
The availability of irrigation water was more influential than drought impacts on the cultivated area and its production. Adaptation options included the installation of reservoir dams for water supply to cities, households and agriculture. The irrigated area of crops increased from 46,160 ha in 2005 to 119,100 ha in 2015. The annual rice production increased from 333,408 tonnes in an area of 84,568 ha in 2005 to 717,848 tonnes in 124,188 ha in 2017, owing mainly to the possibility of an additional crop per year. Water availability for irrigation resulted in three rice crops per year, but exerted a tremendous pressure on water resources.
Extension services focused on agriculture and water resource development with the introduction of opportunity cash crops to alleviate crop water demands. Less water-demanding crops such as dragon fruit were increasingly grown near rivers and streams under sprinkler or furrow irrigation. The area planted with dragon fruit increased almost exponentially from 5799 ha in 2005 to 13,404 ha in 2010 and 26,069 ha in 2015, while annual production rose from 96,806 in 2005 to 299,302 in 2010 and 468,355 tonnes in 2015. The soils were fertilised by animal manure at the base of the individual plants. In fields where rice paddies were converted into dragon fruit plantations, the soil had a compacted layer at around 0.3 m, resulting in shallow rooting depths with frequent requirements for water during droughts. Climate smart precision farming with solar power systems to regulate drip irrigation and artificial lighting to extend daylight hours were used to boost dragon fruit production for export.
4. Discussion
The paradigm shift of including degradation processes, the context of ecosystem deterioration and the integration between human and natural factors has broadened the definition of desertification [
65]. The attention has subsequently shifted to land degradation [
66], so that an increased number of countries have ratified the Convention on Combating Desertification, such as Vietnam in 1998. According to the atlas of desertification [
59], the area with an aridity index lower than 0.65 equals 1233 km
2 or 15% of the Binh Thuan Province versus 11.5% of the total area affected by desertification, as calculated by [
31]. The areas affected by land degradation in the province cover a larger area.
Elucidating the drivers that cause land degradation is a prerequisite to further establishing monitoring and assessment systems [
7]. The drivers in southeast Vietnam are related to climate (distinct dry season, dry land winds) and demographic dynamics. Vietnam is often characterised as a country with a high exposure and sensitivity to climate change effects [
30]. Signs exist of long-term changes to the dry season with a projected longer duration due to further delays in the onset of the growing season and an increase in temperature of 1.6–2.5 °C by 2100 [
67]. There is a statistically significant increase of +0.30 °C for Tmin, +0.15 °C for Tmax and +0.22 °C for Tmean per decade, which will increase evaporation rates. With projected climate change and population growth, desertification is projected to increase by 122% by 2050 [
31]. Delays in the wet season in individual years occurred, in part, due to the large variations in the 30 years examined. In a dry sub-humid climate, there is a difference between “occasional droughts due to seasonal or inter-annual variations in rainfall” and “long-term droughts”. People can adapt more easily to the former than to the latter.
The pressures included natural resources (e.g., Arenosol, Solonetz, Leptosol) and their management (e.g., salt intruded groundwater, laterisation), land use (agriculture, mining) and changes in land use/cover (e.g., deforestation). These pressures and their impact constitute ecological vulnerability [
28], in relation to which action can be taken. The effective monitoring of pressures must include remote sensing archives [
52] and encourage stakeholder participation [
51]. Policy efforts in Vietnam include increasing forest coverage through the REDD+ mechanism [
68], developing and monitoring water supply systems [
69], encouraging sustainable farming practices [
70], and reducing poverty in affected areas [
71]. A time series reconstruction and analysis of land use/cover during the 1990–2019 period demonstrated the importance of natural resource management in land degradation. The pressure on water resources for the irrigated farming of rice and dragon fruit, the mining industry and tourism are high, particularly because of the proximity of Ho Chi Minh City. Only coarse inventories of current water resources are known, their use or potential to bridge the dry season and their limitations are less well known. For example, salt intrusion into groundwater is reported in coastal areas, but the extent of the problem is unknown.
Slowly progressing drought and land degradation allow for their management and increase resilience. People who can adapt to drought and land degradation will do so mostly through private decisions: by planting different crops or by seeking other employment opportunities and moving house. Even with better crops, better soil and water conservation, better planting patterns and better weather forecasts, all of which are needed, there will still be regional calamities. Within this context, Binh Thuan emerges as a region with a high human ecological resilience. This is strengthened by flexibility in crop selection, a stable population, investment in irrigation logistics, and the financial strength of the province and its inhabitants. Adaptations of the traditional land use regimes such as farming new crops and aquaculture have a role in the transition processes of adaptation. The best protection against land degradation was prosperity, as we elucidated through interviews and questionnaires. Wealthier, healthier people are better able to deal with higher food prices, or invest in new farming techniques such as irrigation, or seek other opportunities. Weaker elements, according to this analysis, entail the lack of expansion opportunities for new agricultural areas and the limited private investments in agriculture. On the other hand, agriculture is more vulnerable to land degradation, whereas industry and services are not. The region’s relative prosperity is related to its location along Vietnam’s major national route, connecting major cities along a north–south axis, and providing a fast connection to the major markets of the heavily populated Ho Chi Minh City. A comprehensive strategy to cultivate less water-demanding crops, combined with the efficient use of irrigation water, integrated with rational water use in households, tourism and other industrial sectors, are part of the adaptation plan.
Pressures on natural resources such as vegetation and soil need monitoring, particularly in the wake of climate adaptation to land degradation [
28,
53,
55]. Improved natural resource management has set examples for combatting recurrent ecological drought [
16] and desertification [
72]. The concept of eco-tourism to combine local subsistence with sustainable tourism [
73] has great potential in the province, and has been successfully implemented in Northern Vietnam [
74]. The provincial government has a role in monitoring, building a warning system to mitigate land degradation impacts in the rural areas and providing institutional capacity to an integrated policy of strategic natural resource management targeted to the different stakeholders. Further monitoring is also needed to investigate the limits of the current adaptation options. An integrated natural resource management policy requires the development of a spatially explicit decision support system as a comprehensive information platform to support decision making by different stakeholders in the province (e.g., farmers, the water board, planners, government officials, policy makers) and to provide scenario and impact analysis. A spatially explicit information platform may help with early warnings and support decision making by different stakeholders.
5. Conclusions
We developed an integrated framework to analyse the drivers of land degradation, its pressures and impacts, vulnerability and resilience, and adaptation options. Our methods combined participatory approaches, spatiotemporal data analysis, and time series Landsat image processing. These methods were tested on southeast Vietnam, which is severely affected by drought, land degradation and desertification.
The drivers of land degradation in southeast Vietnam are climate and demography. The pressures comprise land resource management and land use/cover change. The most vulnerable are farmers without access to natural resources and the rural poor. Reduced water availability has forced local farmers to adapt by growing less water-demanding crops such as dragon fruit. The relatively high income in the area allowed investments, increased resilience and seemed to counteract outmigration. The socio-economic impacts in the worst affected northeastern districts showed that, as a result of slowly progressing adaptation, no negative impacts on income, expenditure, and poverty were found. The vicinity to Ho Chi Minh City and the attraction of investments contributed to the province’s prosperity.
Policies include action programmes on reforestation, improved water supply for household use and irrigation, sustainable agriculture, rural development, and coastal zone management to combat land degradation. The majority of the national and local policies are supported by international programmes. However, the adaptation options and limitations warrant further research.

 ,
, 
