Article

Infiltration-Friendly Agroforestry Land Uses on Volcanic Slopes in the Rejoso Watershed, East Java, Indonesia

by
Didik Suprayogo
1,*,
Meine van Noordwijk
1,2,3,
Kurniatun Hairiah
1,
Nabilla Meilasari
1,
Abdul Lathif Rabbani
1,
Rizki Maulana Ishaq
1 and
Widianto Widianto
1
1
Soil Science Department, Faculty of Agriculture, Brawijaya University, Jl. Veteran no 1, Malang 65145, Indonesia
2
World Agroforestry Centre, ICRAF, Indonesia Office, Bogor 16001, Indonesia
3
Plant Production Systems, Wageningen University, 6708 PB Wageningen, The Netherland
*
Author to whom correspondence should be addressed.
Land 2020, 9(8), 240; https://doi.org/10.3390/land9080240
Submission received: 9 June 2020 / Revised: 5 July 2020 / Accepted: 14 July 2020 / Published: 23 July 2020
(This article belongs to the Special Issue Agroforestry-Based Ecosystem Services)

Abstract

:
Forest conversion to agriculture can induce the loss of hydrologic functions linked to infiltration. Infiltration-friendly agroforestry land uses minimize this loss. Our assessment of forest-derived land uses in the Rejoso Watershed on the slopes of the Bromo volcano in East Java (Indonesia) focused on two zones, upstream (above 800 m a.s.l.; Andisols) and midstream (400–800 m a.s.l.; Inceptisols) of the Rejoso River, feeding aquifers that support lowland rice areas and drinking water supply to nearby cities. We quantified throughfall, infiltration, and erosion in three replications per land use category, with 6–13% of rainfall with intensities of 51–100 mm day−1. Throughfall varied from 65 to 100%, with a zone-dependent intercept but common 3% increase in canopy retention per 10% increase in canopy cover. In the upstream watershed, a tree canopy cover > 55% was associated with the infiltration rates needed, as soil erosion per unit overland flow was high. Midstream, only a tree canopy cover of > 80% qualified as “infiltration-friendly” land use, due to higher rainfall in this zone, but erosion rates were relatively low for a tree canopy cover in the range of 20–80%. The tree canopy characteristics required for infiltration-friendly land use clearly vary over short distances with soil type and rainfall intensity.

1. Introduction

Water access for all, the Sustainable Development Goal 6 of the Agenda 2030 agreed by the United Nations [1], not only refers to drinking water and sanitation. It requires the protection of “infiltration-friendly” land uses in upland watersheds as a source of clean water [2]. Sufficient groundwater recharge is important to the sustainable management of groundwater resources to maintain streamflow throughout the year, as well as to feed springs [3,4]. While much of the public discourse is in terms of forest versus agriculture, thresholds for specific soil and climate regimes are needed within the intermediate agroforestry spectrum of land uses [5]. Thresholds to critical hydrological functions are likely dependent on local context but need to be understood to guide natural resource management in the challenging trade-offs between local and external priorities [6]. Hydrological functions, and their sensitivity to climate change, can be characterized by a number of metrics [7]. Much of the literature on forest hydrology is concerned with reductions in annual water yield due to increased canopy interception and/or tree water use by fast-growing forest stands [8], without a distinction between (fast) overland and (slower, infiltration-dependent) subsurface flow pathways. A recent review [9] found that the recovery of annual river flow with the age of planted forest is an exception rather than a rule. However, the recovery of infiltration with tree cover can increase dry season flows [10] without increasing annual water yield. Changes in streamflow regime will reflect both changes in evapotranspiration (ET) and in infiltration after the change in land use under given climatic conditions [11,12]. On the other hand, a high tree (Acacia auriculiformis) canopy, without an understory and permanent litter layer, was associated with high erosion rates due to high-impact drips from the leaves [13]. Empirical data and process-level understanding is needed of these diverse and partly contradictory effects of tree cover, especially in human-managed land uses.
Agroforestry systems with high canopy densities can, if a permanent litter layer is present, maintain high infiltration rates and can positively impact on hydrologic functions through: (1) a green canopy cover at the tree and understory level, (2) land surface roughness, (3) litter at the soil surface, and (4) water uptake by trees and other vegetation [14,15]. Five aspects that hydrologically differentiate natural forest from open-field agriculture, with intermediate functionality for managed forest, plantations, agroforestry, and trees outside forest [16,17], are: (1) the leaf area index (LAI) that allows photosynthesis when stomata are open and transpiring, and that, along with leaf morphology and rainfall intensity, determines canopy interception, retention, and subsequent evaporation, (2) the surface litter that prevents crusting and supports infiltration [18] while reducing soil evaporation and reduces the entrainment of soil particles if overland flow still occurs, (3) the soil macroporosity that governs infiltration and allows for the aeration of deeper soil layers between rainfall events while recovering at a decadal time scale after reforestation [19,20], (4) the root systems that govern water extraction from deeper soil layers, in conjunction with the phenology of the aboveground canopy [21], and (5) possible influences on rainfall events [22,23]. Each of these five aspects has its own dynamic (time constants) and dependency on the type of trees and their management, challenging the definition of hydrologically adequate land use choices. Rather than prescribing, independent of soil types and slope, the type and quantity of tree cover that is needed, as tends to happen in forest zoning, it may help if limits to infiltration-friendly land use (focused on the third function) can be operationalized in a local context. In terms of watershed hydrology, infiltration-friendly land uses can be interpreted as any land use that allows high rates of water infiltration so that surface runoff is a small (to be defined in local context) fraction of rainfall and the watershed functions of flow buffering and erosion control are secured (to specified standards). River flow in watersheds that provide perfect buffering might theoretically be constant every day, but in practice, a “flow persistence” metric of about 0.85 is hard to surpass [24]. Flow buffering is essential for climate resilience [25] and high flow persistence metrics are desirable, as they directly relate to peak flow transmission [26].
The discussion on forests and watershed functions in Indonesia became based on specific theories about underlying mechanisms and measurements in the 1930s [27,28,29,30], but at the policy level, a generic dichotomy between “forest” and “non-forest” conditions was maintained. The Indonesian spatial planning law prescribes that 30% forest cover is needed in all local government entities to secure hydrological forest functions [31]. As the 30% norm originated in studies of flooding risk in relation to spring snow melt in Switzerland [32], a more nuanced and process-based understanding is needed to underpin effective policies on desirable forest cover, especially in densely populated Java, where agroforests are common. In Southeast Asia, 8.5% of the global human population lives on 3.0% of the land area. With 7.9% of the global agricultural land base, the region has 14.7% and 28.9% of such land with at least 10% and 30% tree cover, respectively, and is the world’s primary home of “agroforests” [33].
On densely populated Java, volcanic slopes are home to large numbers of farmers, while also serving as sources of water for lowland agriculture and the rapidly growing cities. The shrinking area of state-managed forests is no longer able to secure the required watershed functions, but at least part of the agroforestry managed by farmers can meet the required hydrological functions [34]. In the Rejoso Watershed (Pasuruan, East Java, Indonesia), numerous stakeholders depend on the watershed functions of densely populated mountain slopes to meet their water demand. These include local communities, farmers using water irrigation, the Regional Water Company, and bottled water industries. A major infrastructure is planned to bring water to Surabaya and the surrounding urban centers. However, the quantity and quality of the water at the source of the pipe have been decreasing over the past 10 years, putting the infrastructure investment at risk. Decreasing water resources are likely due to land use changes in the recharging area of the Rejoso Watershed on the northern slopes of the Bromo-Semeru volcanic mountain range, and/or decreased pressure on artesian wells across the land due to increased extraction for paddy rice fields. Among the hydrologic functions, infiltration is critical, as water travels through the subsoil to artesian wells at the foot of the volcano, in addition to surface rivers.
This research in the Rejoso Watershed using runoff and soil erosion plot-scale studies under natural rainfall [35] within the locally relevant range of land cover types was thus designed to assess which land uses can maintain infiltration rates under local peak rainfall intensity and restrict soil erosion to acceptable levels. The specific questions were:
  • Which existing land uses limit infiltration below the required rates at peak rainfall events?
  • Which factors that are directly observable, such as tree cover, litter layer thickness, or surface roughness, can be used to define thresholds for “infiltration-friendly land use”?
  • Do the answers to questions 1 and 2 need to be differentiated between the upper and middle watershed, with current vegetable production and agroforestry as dominant land uses, respectively?

2. Materials and Methods
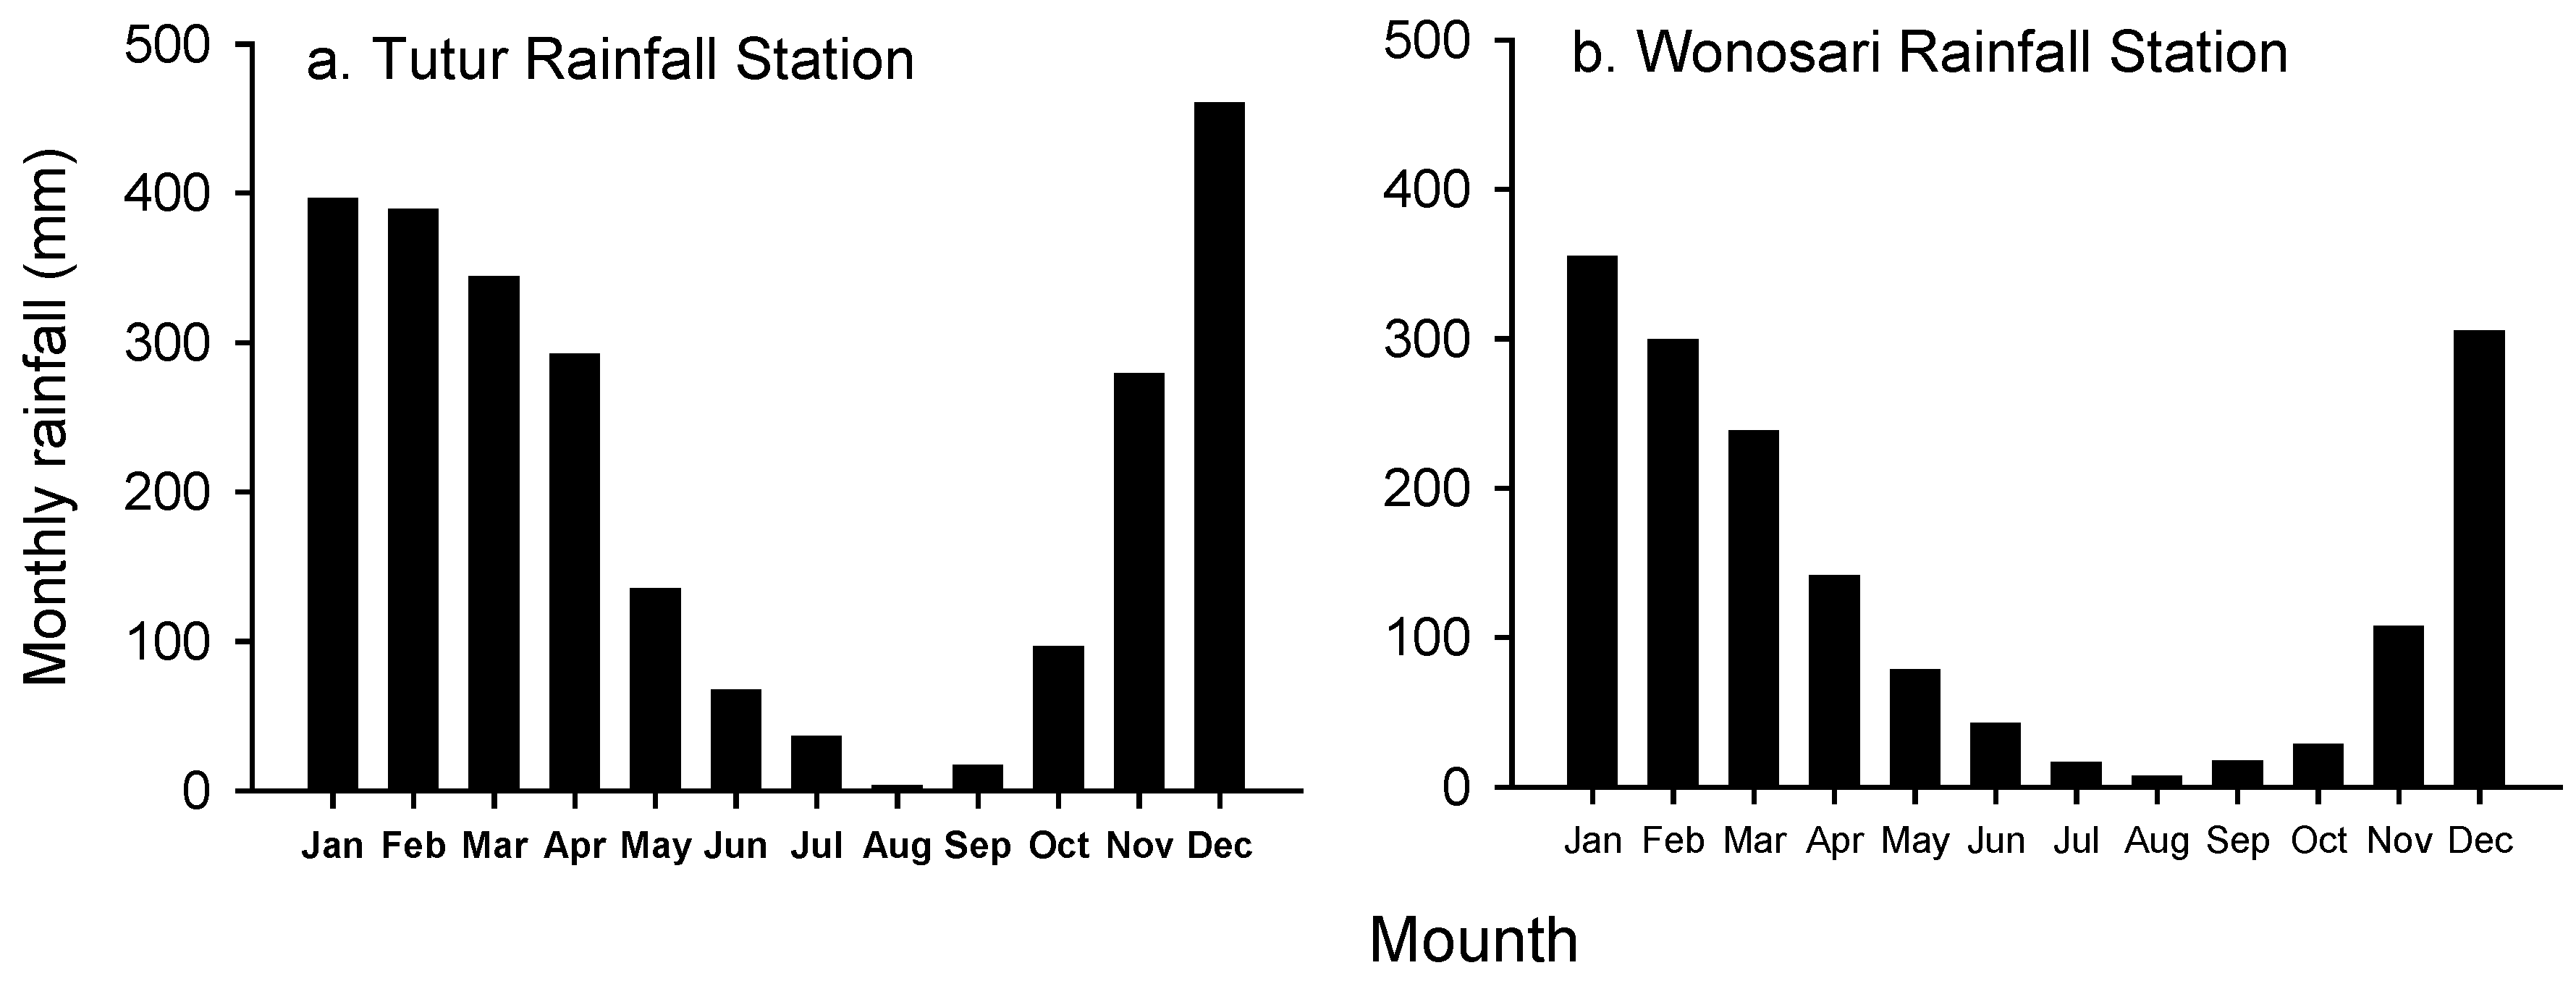
2.1. Study Area

The Rejoso Watershed, is located on the northern slope of Mount Bromo, covering 16 sub-districts in Pasuruan District, East Java Province, Indonesia. The Rejoso Watershed is located between 7°37′13.35″ and 7°55′18.63″ South, and between 112°48′32.51″ to 113°55′55″ East (Figure 1).
The Rejoso Watershed covers an area of 634 km2 with a hydrologic (watershed) length of the main channel of about 22 km. This study was conducted in two locations, namely in the upstream (above 800 m a.s.l.) and midstream (400–800 m a.s.l.) sections, with the dominant vegetation (land cover) selected for each location (Figure 1).
Climatic conditions that influence hydrology and erosion are largely determined by the influence of the northwest and southwest monsoons. The northwest monsoon, picking up large amounts of moisture over the Indian Ocean, brings in most of the annual precipitation in the area, and predominates during the period from November through April. Although there is considerable variation in the amount and distribution of rainfall from year to year, most places in the watershed receive about 91% of the rainfall during the November–May wet season (monthly rainfall > 100 mm) in the upper stream and about 91% of the rainfall during the November–April wet season in the midstream (Figure 2). Due to topographic influences, there is considerable spatial variation in annual precipitation as well, ranging from 1655 mm to 3675 mm, with extreme yearly rainfall in 2010, with an annual precipitation of 5298 mm over 24 years of rainfall measurements (1990–2013) in the upper stream compared with an annual precipitation ranging from 1020 mm to 2603 mm in the midstream. The May to October period is considered the dry season. Then the southeast monsoon predominates, bringing much smaller amounts of precipitation due to the lower atmospheric moisture caused by lower temperatures in the Southern Hemisphere at this time of the year. The annual precipitation in the upstream (average annual precipitation = 2488 mm) is higher than the in midstream (average annual precipitation = 1632 mm). Over 24 years of measurements, the maximum daily rainfall in the upper stream and midstream ranged from 80 mm day−1 to 200 mm day−1 and 60 mm day−1 to 320 mm day−1, respectively. Based on Schmidt–Ferguson climate classification, the upper stream and midstream are considered rather wet (C) and average (D), respectively.
The Rejoso Watershed consists of four types of soil, namely: Andisols, Inceptisols, Alfisols, and Entisols. Andisols are mainly found on the upper slopes of the volcano. Andisols have a distinct black to very dark brown surface horizon rich in organic matter, which usually overlies a brown to dark yellowish-brown subsoil. The clay fraction is dominated by allophane. Andisols are highly permeable, porous with low bulk density, have high water-holding capacity, and a crumb structure. The most common texture is sandy loam. These soils have high inherent fertility and are highly erodible only when seriously disturbed. The middle and some lower volcanic slopes, consisting of easily weatherable permeable tuffs and ash deposits, give rise to deep soils—Inceptisols and Alfisols. Inceptisols have only limited horizon differentiation. Their texture ranges from deep friable clays to clay loams. Alfisols are soils which have an accumulation of clay in the subsoil. Their texture ranges from loam to clay loam in the topsoil and clay loam to clay in the subsoil. Both soils have moderate to high inherent fertility but are highly susceptible to erosion. The fourth group, Entisols, are soils that lack horizon development and are found on volcanic sands, ashes, and tuffs. Entisols occur on recent and sub-recent lahars of the Bromo volcano. Entisols with a coarse texture are extremely erodible and have very low water-holding capacities. Permanent vegetative cover, and especially diversified tree crops and agroforestry or forestry, are the most suitable land utilization types to prevent erosion.

2.2. Land Cover Types Compared

In important research traditions associated with the Universal Soil Loss Equation (USLE) [37], the quantification of erosion requires a “bare soil” reference, expressing the degree of protection provided by vegetation relative to this “control”. Fortunately, bare soil is rare in this landscape, and it would be considered an extreme, rather than a standard agricultural point of reference. Artificially clearing land to allow such treatment to be measured would give results that are hard to be interpreted, as soil changes after clearing would lead to a time-dependence of the results, rather than being an unambiguous point of reference. By referring to the more process-based Rose equation [38], separating overland flow as a transport medium and “entrainment” as a soil characteristic relative to the energy-dependent transport capacity of such flow, we do not depend on the USLE framework (that infers that soil loss is universal, but does not account for its counterpart process, sedimentation [39]) but can focus on existing land covers and associated land uses in the landscape.
In both the upstream and midstream parts of the catchment, four dominant land use systems were assessed (Table 1), spatially replicated in three separate measurement plots. Upstream land uses included old and young pine plantations (production forest) and highland vegetable crops with variations in tree canopy cover in the landscape on steep (30–60%) to very steep (>60%) land with imperfect ridge terraces. Midstream land uses included production forest, multistrata coffee-based agroforestry, clove-based agroforestry, and several mixed agroforestry types with variations in tree canopy cover in the landscape on moderately steep (15–30%) and steep (30–60%) land with bench terraces sloping outward.

2.3. Quantifying Terms of Water and Soil Balance

2.3.1. Overview

As forest and tree cover can influence various steps in the chain from rainfall to streamflow and erosion, we aimed to quantify (1) the direct effect of tree canopies on the retention of part of the rainfall (followed by direct evaporation), versus the fraction reaching the soil surface by throughfall and stemflow, (2) the partitioning of the latter into infiltration and overland flow, (3) the entrainment of soil particles into this overland flow. Within the time and resources available we did not assess (4) the seepage of groundwater beyond the root zone and access by vegetation, (5) the pathways and release of groundwater into streams, (6) the routing of overland flow into streams, or (7) the in-field (or riparian filter zone) sedimentation of entrained soil particles, beyond the scale of the measurement plots. However, we did characterize the vegetation and soil characteristics that influence the various processes.

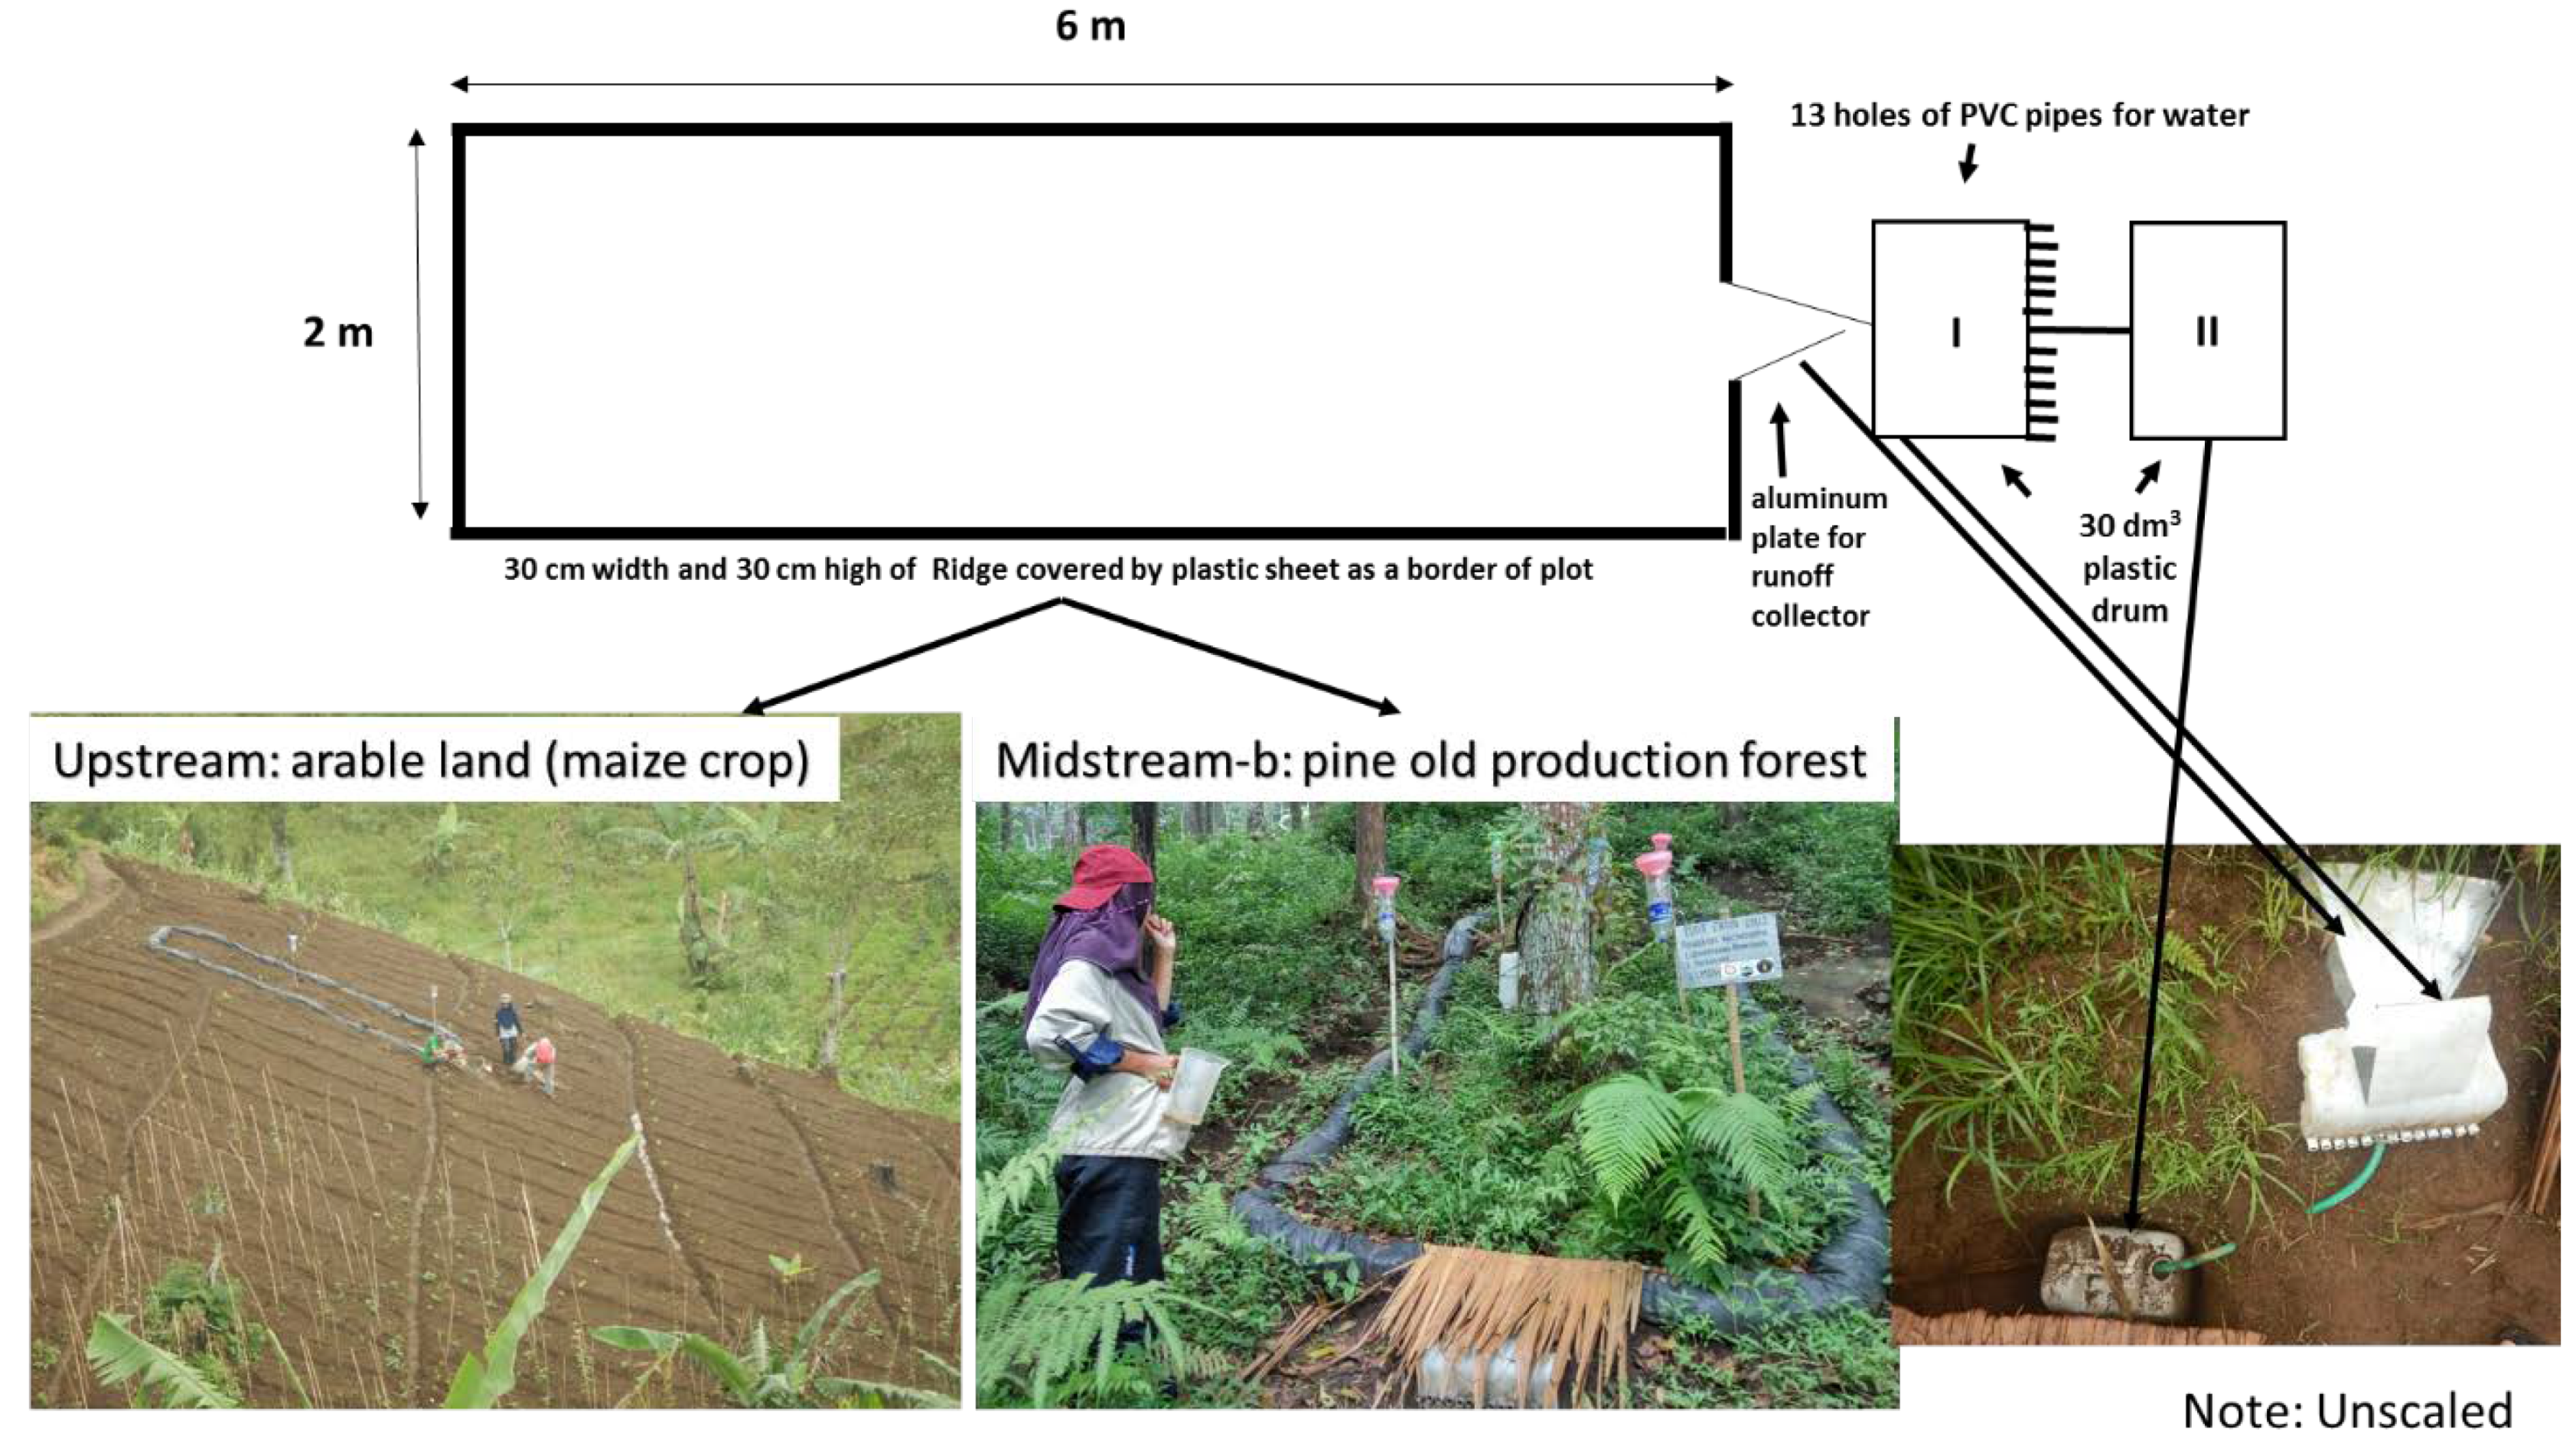
2.3.2. Rainfall and Throughfall

Rain gauges, outside of the direct influence of tree canopies, were installed in four observation locations (with adjacent erosion plots) upstream and four observation locations midstream of the Rejoso Watershed. In each runoff plot, throughfall was measured with five replications. The throughfall gauges below the tree canopy had a horizontally placed 30 cm diameter funnel 120 cm above the soil surface and a collector bottle with a volume of 1.5 dm3 placed with bamboo as a support. Throughfall and rainfall were collected every day for two months of the rainy season, from March to May 2017. Attempts were made to also quantify stemflow, but due to technical problems with the method used, no reliable data were obtained, and the results are not shown here.

2.3.3. Water Infiltration and Soil Erosion Measurement

Water infiltration was quantified in each land cover type via its complement, surface runoff, and expressed in the runoff/throughfall ratio. As the throughfall for quantified infiltration was measured below the tree canopy, the amounts were the net of canopy retention and possible stemflow. Surface runoff was measured in 6 m × 2 m plots protected from surface run-on, with two drums at the lower end to collect surface runoff and sediment concentrations for soil erosion measurements (Figure 3).
In each plot, the water flow was collected into two collection drums with a capacity of 30 dm3. The first drum had a divider system channeling into 13 channels (PVC pipes) with equal diameters and level positions, with one connected with a second drum. The volume of water flowing from each pipe was measured to calibrate the water volume proportion entering into the second drum. The potential capacity of the runoff collector thus was (30 dm3 * 13) + 30 dm3 = 420 dm3 for 12 m2 or 35 mm. We did nor encounter situations where the second tank overflowed. Runoff samples at each plot were collected every day and the rain that occurred during the measurement period was measured by measuring the water depth in each drum. The amount of runoff in each rain event was calculated using Equations (1) and (2):
R t = V d I + ( 13   V d II )
V d = 1000   ( D L W )
where Rt is total runoff (dm3), Vd is the water volume in drums I and II (dm3), L = length and W = width of drum (cm), and D is the water depth in each drum (cm). The total runoff was then divided by the area of the plot (2 m × 6 m) to convert to mm. Data could be compared to a classification developed elsewhere [40] that indicates a runoff coefficient of 0.14 as adequate for Andisols, and 0.20 for Inceptisols.
Soil erosion in each rain event was determined by collecting 1 dm3 of runoff sediment in each drum. The sample was filtered with “newsprint” and dried in an oven with a temperature of 105 °C to get the weight of the sediment (S). In earlier studies, we found that effluent from this readily available filter material had a negligible sediment concentration [41]. Erosion (E) in each rain event was calculated using Equation (3):
E = ( ( V d 1 S ) + ( 13 ( V d 2 S ) ) ) ( 10 2 A )
where E is soil erosion (Mg ha−1), S is sediment (g dm−3), and A is the area of the plot (m2).

2.4. Determination of Soil Properties

Three bulk mineral soil samples were collected from each layer of soil of 0–10 cm, 10–20 cm, 20–30 cm, 30–40, and 40–50 cm for soil texture analysis and each layer of soil of 0–10 cm, 10–20 cm, and 20–30 cm for soil bulk density, particle density, total soil porosity, and soil organic matter content. Particle size distribution (particles < 2 mm) was determined with the Bouyoucos densimeter method [42] after H2O2 pre-treatment and after samples had been dispersed in 5% sodium hexametaphosphate and 5% dispersing solution. Bulk density (oven dry weight per unit volume) was measured for a block-sized sample (20 cm × 20 cm × 10 cm = 4000 cm3) collected in field moisture conditions (modified from [43]). Particle density was measured by the pycnometer method. Total soil porosity (∅), the percentage of the total soil volume that is not filled by solid (soil) particles [44], was calculated from bulk density data and particle density using Equation (4):
= ( 1 ρ b ρ p )   ×   100 %
where ∅ is porosity (%), ρb is bulk density (g cm−3), and ρp is particle density (g cm −3).
Soil organic carbon (SOC) was determined by dichromate oxidation [45]. Soil infiltration was measured by the standard double-ring infiltrometer test [46]. The double-ring infiltrometer as often constructed from a thin-walled steel pipe with inner and outer cylinder diameters of 20 and 30 cm, respectively.
The soil macro-porosity was measured using the methylene blue method, by looking at the blue distribution pattern of the methylene blue solution in the soil profile. The methylene blue solution (70 g methylene blue per 200 L of water) was gradually poured into the ground, which had been bound by a metal frame measuring 100 cm × 50 cm × 30 cm (Figure 3) and left for 36 h until the methylene blue solution soaked into the soil. Methylene blue will pass through soil macropores but be absorbed by micropores and soil surfaces. After all the methylene blue solution had disappeared from the soil surface, the top 5 cm of soil was removed from a 100 cm × 100 cm sample area and infiltration patterns were recorded, before a further 10 cm of soil was removed for a second map (at 15 cm below the soil surface), and a further 10 cm of soil for a third map (25 cm below soil surface). For mapping blue patches in each horizontal plane, a transparent sheet of plastic was placed on the surface and all visible blue patches were mapped with marker pens. Blue distribution patterns, redrawn on tracing paper, were photocopied for analysis of the black-and-white pattern of the fraction of soil involved in macropore flow with the IDRISI computer program.

2.5. Other Plot Characteristics

2.5.1. Canopy Cover

The canopy cover can be defined as the percentage of tree canopy area occupied by the vertical projection of tree crowns [47]. The percentage of canopy cover is measured by scathing the shadow of sunshine at ground level using 10 m × 10 m sheets of white paper. The canopy projection when the sun was overhead was drawn to scale on white paper in each of the four quadrants of the 20 m × 20 m plots, after which the shaded areas were cut out and weighed separately. Canopy cover was calculated according to Equation (5):
% Canopy   Cover = W   Canopy W   Total ×   100
where %Canopy Cover is the percentage of tree canopy cover, W Canopy is the paper weight representing canopy cover and W Total is the paper weight representing the total area of observation, respectively.

2.5.2. Understory and Litter

Understory vegetation and litter were measured according to the rapid carbon stock appraisal protocol [48], using 50 cm × 50 cm samples for fresh weight, with subsamples dried for dry weight determination.

2.5.3. Land Surface Roughness

Surface roughness was measured in each plot as the standard deviation of elevation measured every 30 cm along a thread (thin rope) installed 30 cm from the surface vertically, horizontally, and diagonally over the erosion plot [49]. The measurement of the difference in elevation was set to a pixel size of 30 cm × 30 cm. Each plot was divided into six pixels for a 2 m plot width and 20 pixels for a 6 m plot length, so there were 120 pixels (N). Pixels were made on a flat plane 30 cm from the ground point of reference with a thin rope. In each center, the pixel was measured vertically parallel to the thin rope towards the surface of the ground with a ruler. The results of the measurements of height differences in each pixel were used to calculate Ra with the equation:
R a = 1 N n = 1 N h n
where N = Number of pixels in the patch and hn = difference of elevation between the nth pixel in the patch and the mean value.

2.6. Data Analysis

To answer the first research question, the null hypothesis was that within the forest to open field agriculture continuum of any observed difference in soil hydrological functions could be due to random variation. To see if that null hypothesis could be rejected, we examined differences in soil infiltration, runoff coefficient, and soil erosion between the dominant land uses in the upstream and midstream with Fisher’s Least Significant Differences (LSD) test. Fisher’s LSD test, which establishes differences between groups defined for independent samples, was used for hypothesis testing, given that the data met the requirements for normality and the homogeneity of variances. A probability level of 0.05 was set for rejecting the null hypothesis of no difference in tests of statistical significance. We used the GenStat 15th edition software for Fisher’s LSD tests. The soil infiltration, runoff coefficient, and soil erosion were then compared with the soil infiltration category [50], existing infiltration adequacy standards, and acceptable soil erosion rates. An acceptability threshold, below which soil erosion is less than an “agriculturally permissible” rate (Eapr, Mg ha−1 year−1), was derived as:
E apr = ( Depth   of   soil Factor   of   soil   depth Time   horizon ) Soil   bulk   density
Both Andisols and Inceptisols are deep (beyond 120 cm soil depth) and have a soil depth factor of 1.0. We chose 400 years as a time horizon. Given the average soil bulk density of Andisols (0.83 g cm−3) and Inceptisols (0.99 g cm−3), we obtained Eapr Andisol = 24.9 Mg ha−1 year−1 and Eapr Inceptisol 29.7 Mg ha−1 year−1.
For the second research question, we tested a number of plot scale characteristics as possible indicators of “infiltration-friendly” plot characteristics: tree canopy cover, understory vegetation, litter necromass, and land surface roughness. Linear regression relationships between the surface runoff/rainfall ratio or soil erosion and the amount of rainfall, tree canopy cover, understory, litter, and land surface roughness were determined using SigmaPlot version 10.0. While a search for “explanatory” factors might have explored multiple regression, our focus was single indicators that could be used as proxies for follow-up discussions with farmers about adjusting land use.
The third research question required the analysis of data for the first two research questions, with the expectation that any thresholds for acceptable hydrological disturbance could be zone-specific, given variations in rainfall, soil type, and the specific characteristics of land use and vegetation.

3. Results

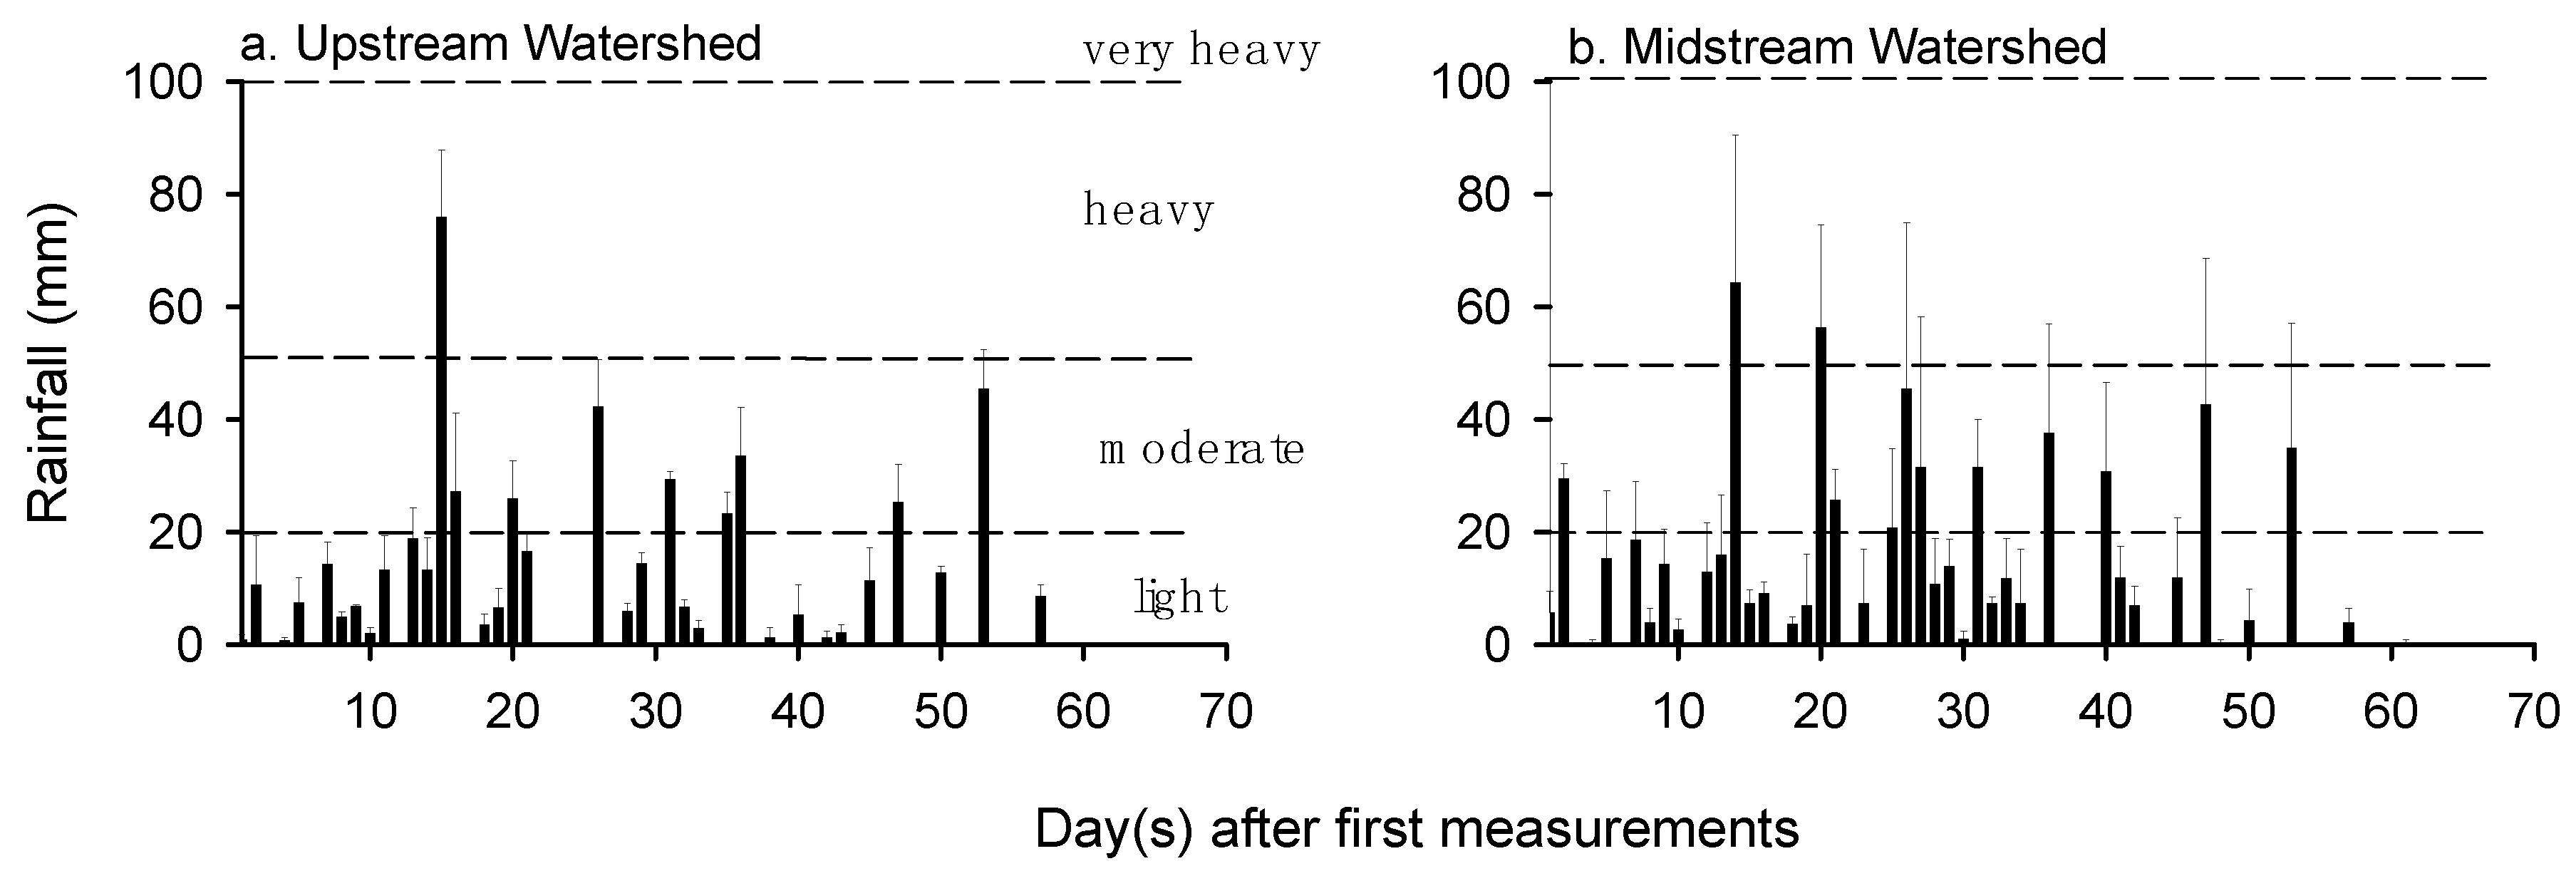
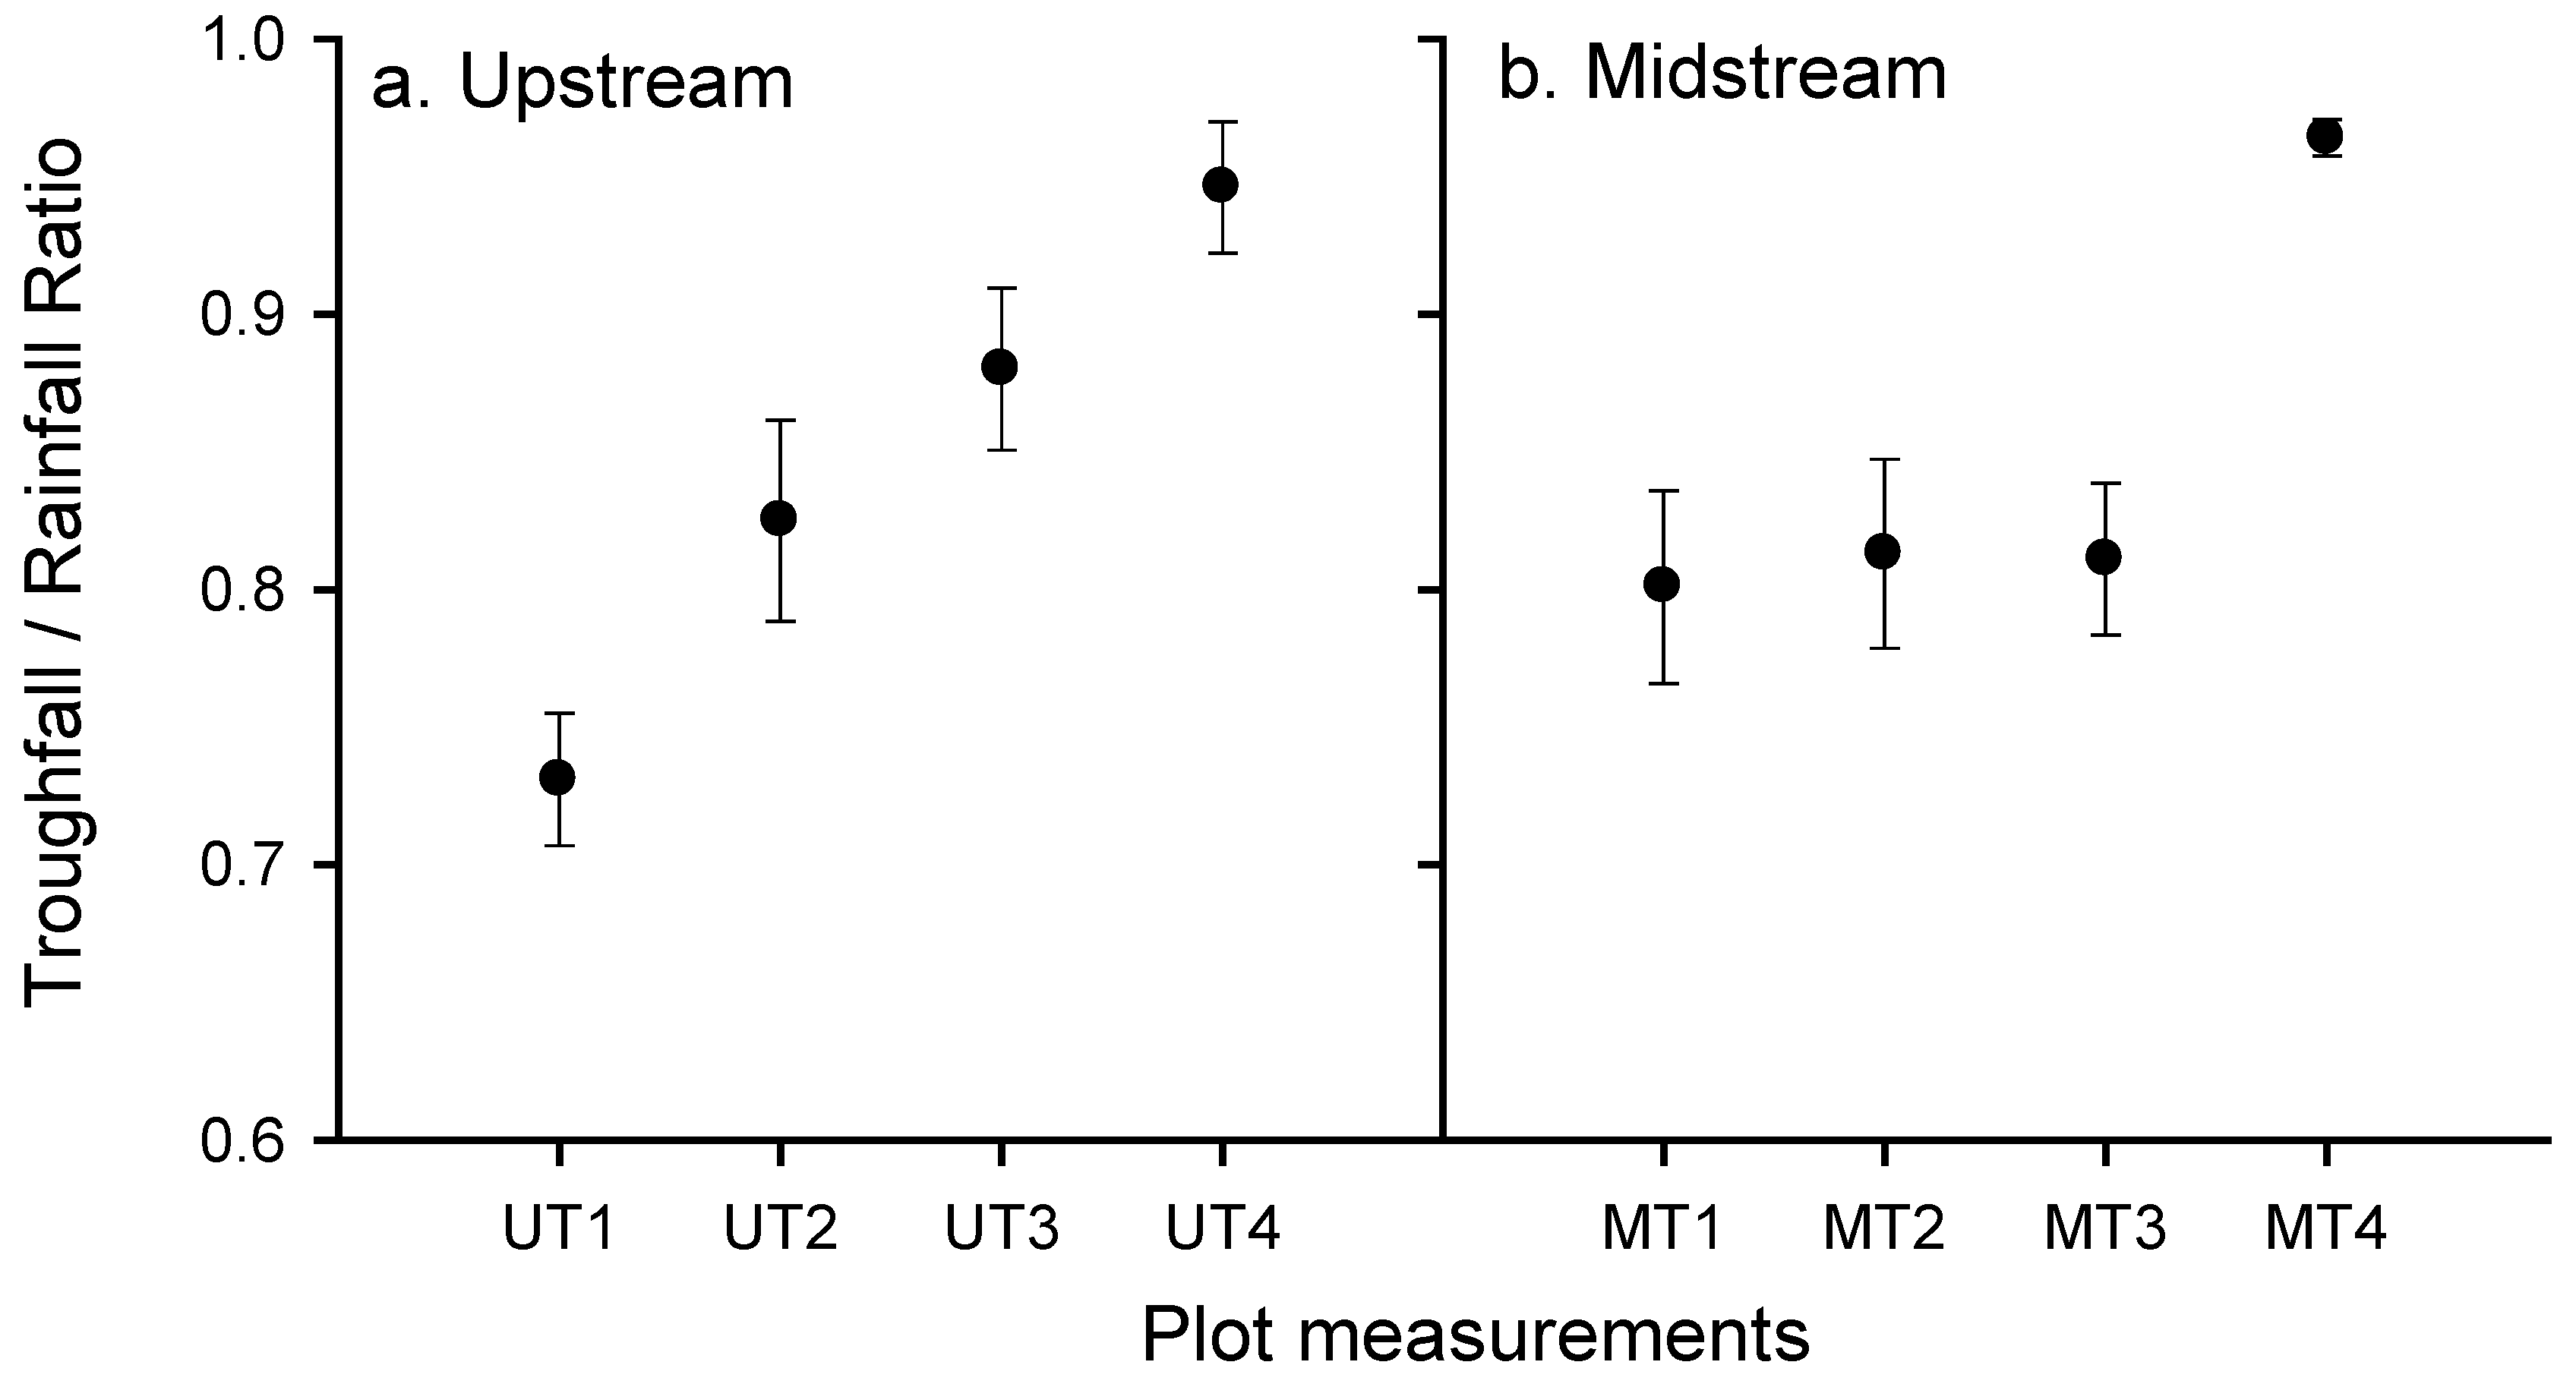
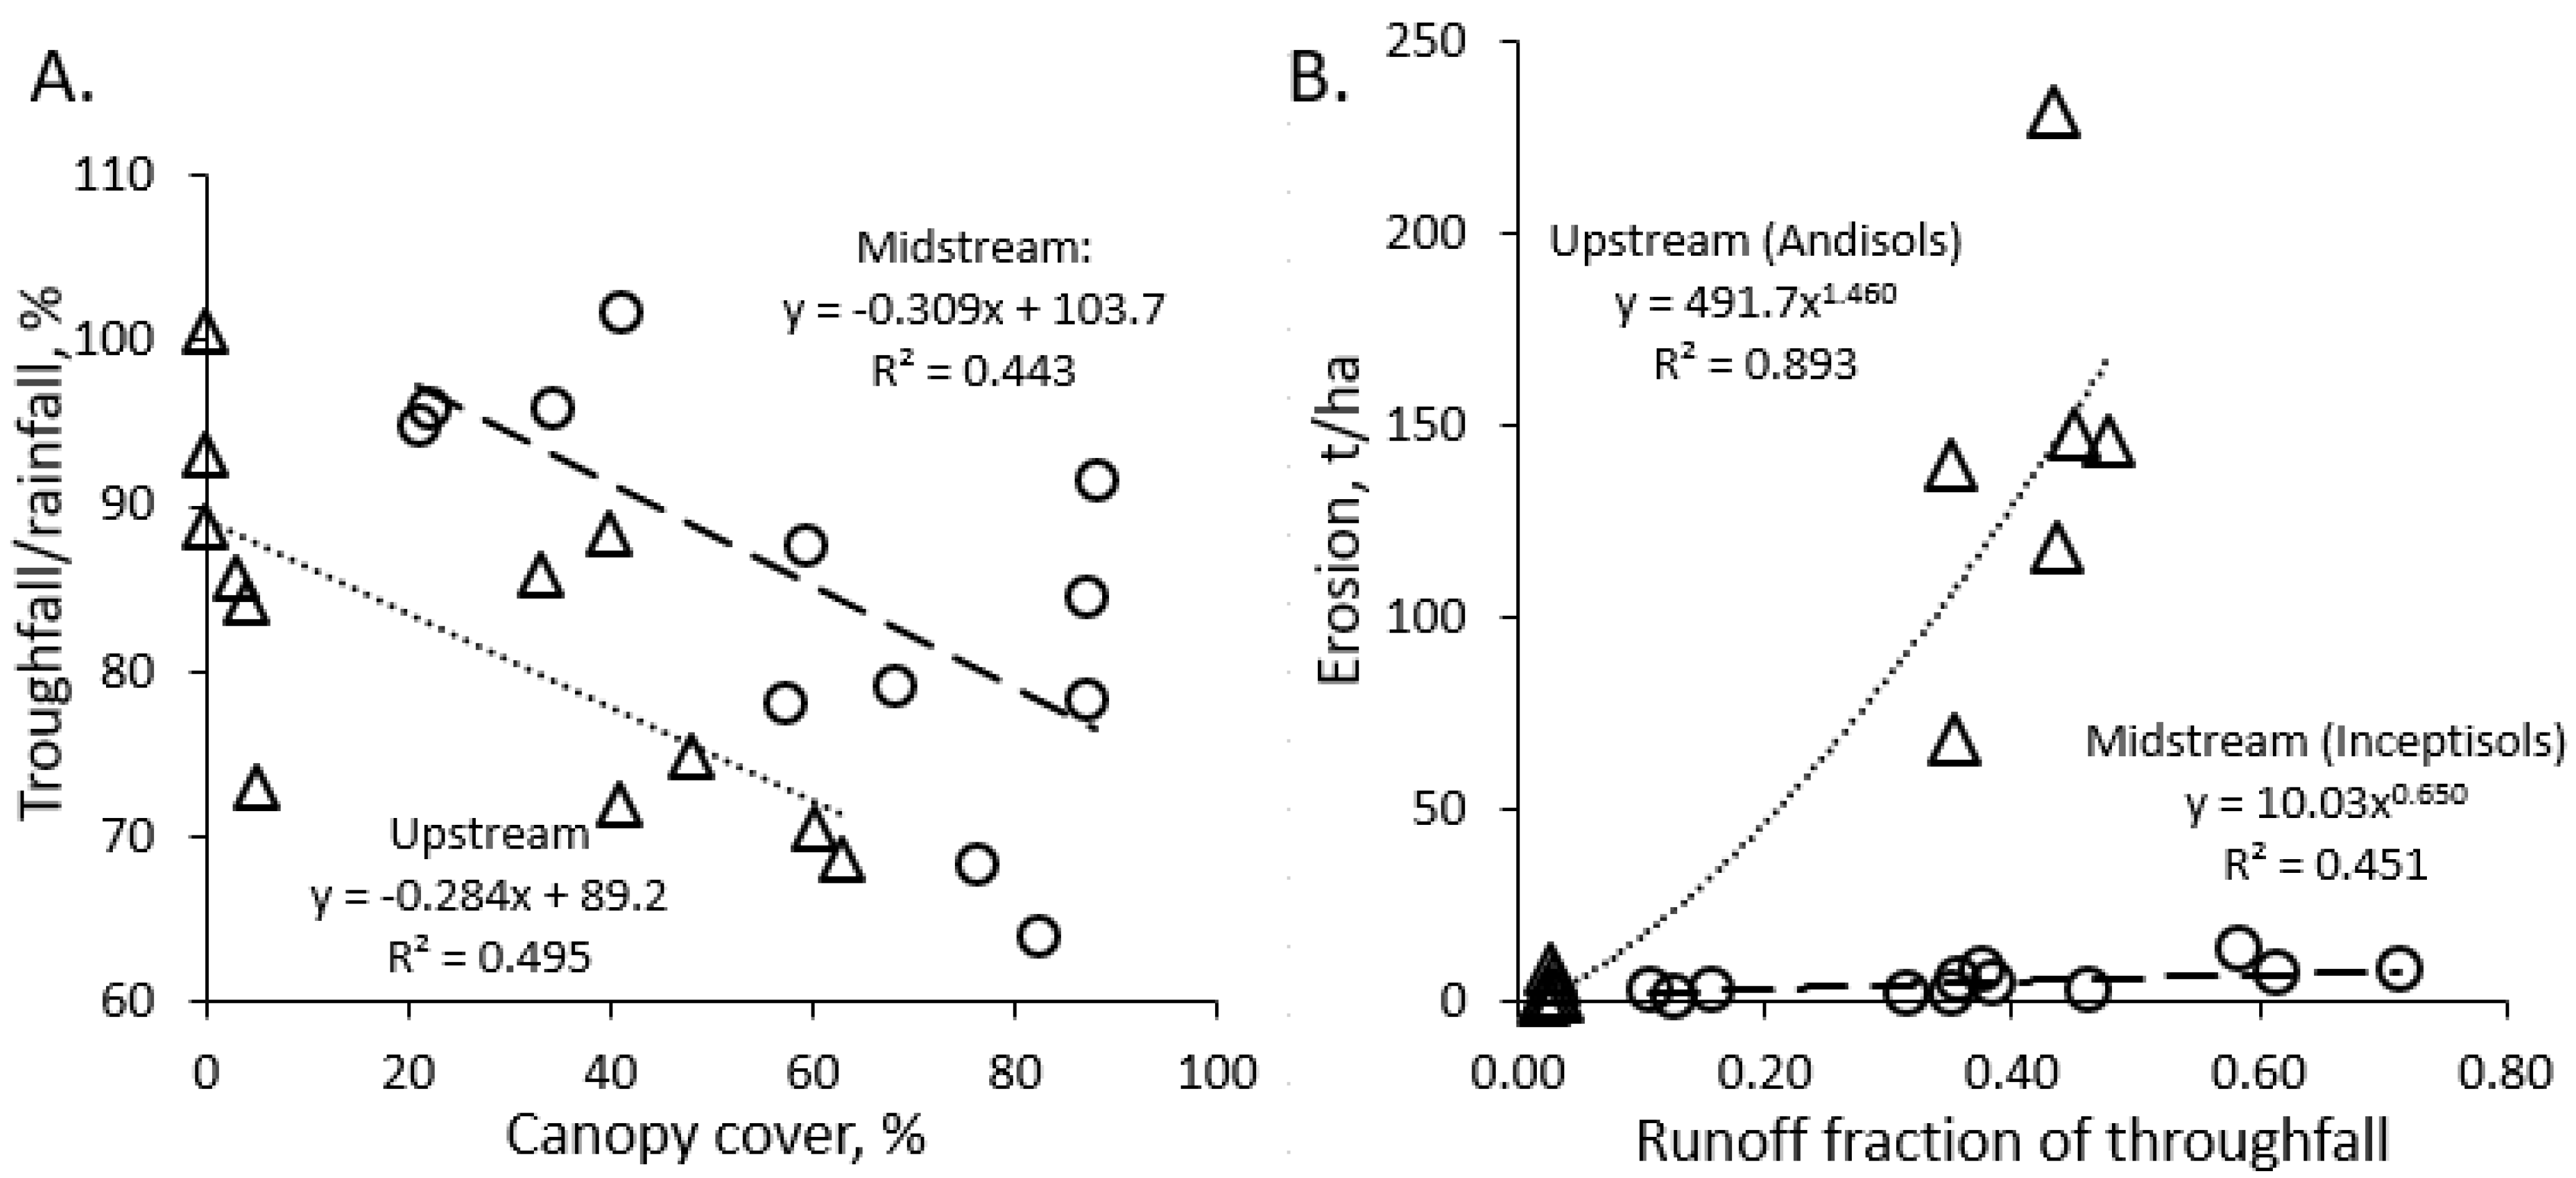
3.1. Rainfall and Throughfall

Within the measurement period, 31 rainy days were recorded (Figure 4). Rainfall variation between the upstream and midstream observation plots was relatively high, with an average of 520 mm (range 476–556 mm among 12 rain gauge measurements), and an average of 666 mm (range 541–840 mm among 12 rain gauge measurements), respectively. In the upstream and midstream areas, 71% and 57% of the rainy days had < 20 mm day−1 (“light rain”), 24% and 31% had “moderate” rainfall (21–50 mm day−1) and 6% and 13% “heavy” rain (51–100 mm day−1), respectively; none had “very heavy rain” (>100 mm day−1). Such rain conditions indicate that the rain erosivity in the midstream is higher than that of the upstream.
In the upstream area, the old production forest obtained a throughfall/rainfall ratio of 0.73 (standard deviation (SD) = 0.05), while for open-field agriculture it was 0.94 (SD = 0.5) (Figure 5a). For young production forests of Casuarina junghuniana-based agroforestry, the throughfall/rainfall ratio was 0.83 (SD = 0.05). In the midstream, the throughfall/rainfall ratio in agroforestry systems with tree canopies of 87%, 75%, and 52% were 0.81 (SD = 0.07) 0.81 (SD = 0.07), and 0.1 (SD = 06), respectively (Figure 5b). For agroforestry with low cover (26%), the throughfall/rainfall ratio was 0.96 (SD = 0.01).

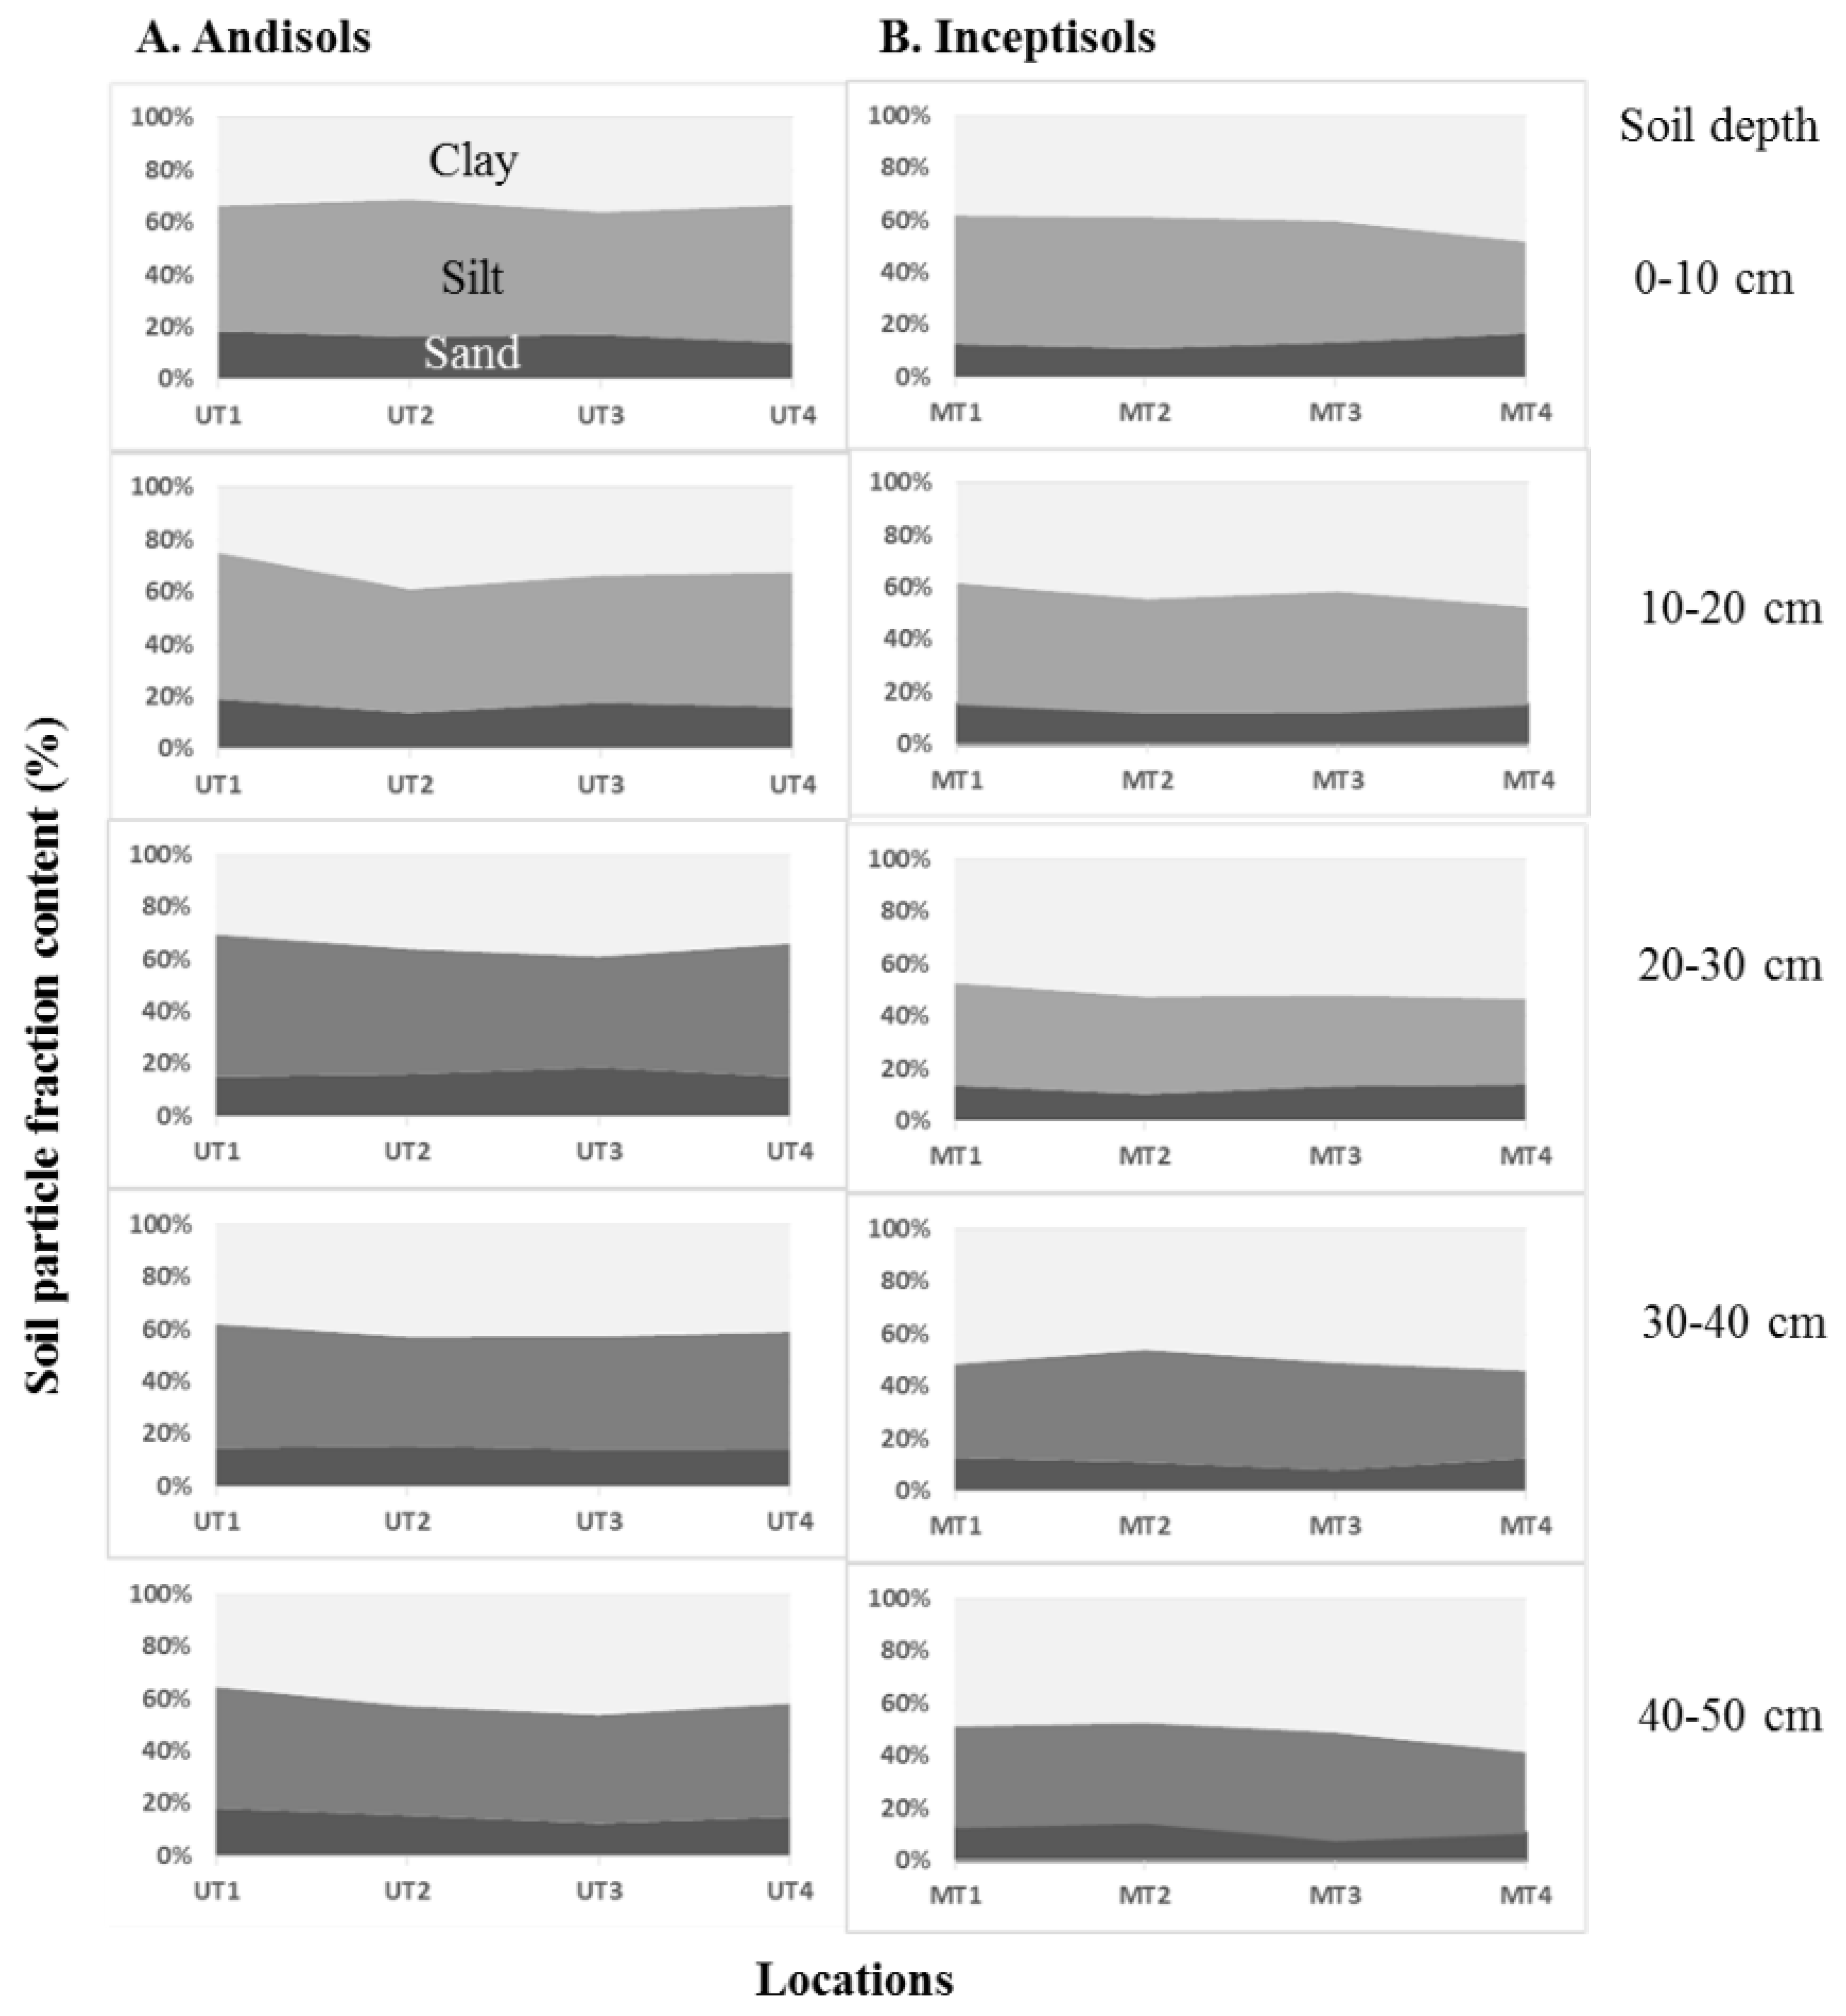
3.2. Soil Properties

The Andisols in the upstream area had a 40–60% silt fraction in all soil measured layers; the Inceptisols had a higher clay fraction (Appendix A). The upstream area had a lower bulk density and higher soil porosity, with a lower clay content than the midstream area (Table 2). The soil organic carbon content varied from 0.65 to 2.12%.

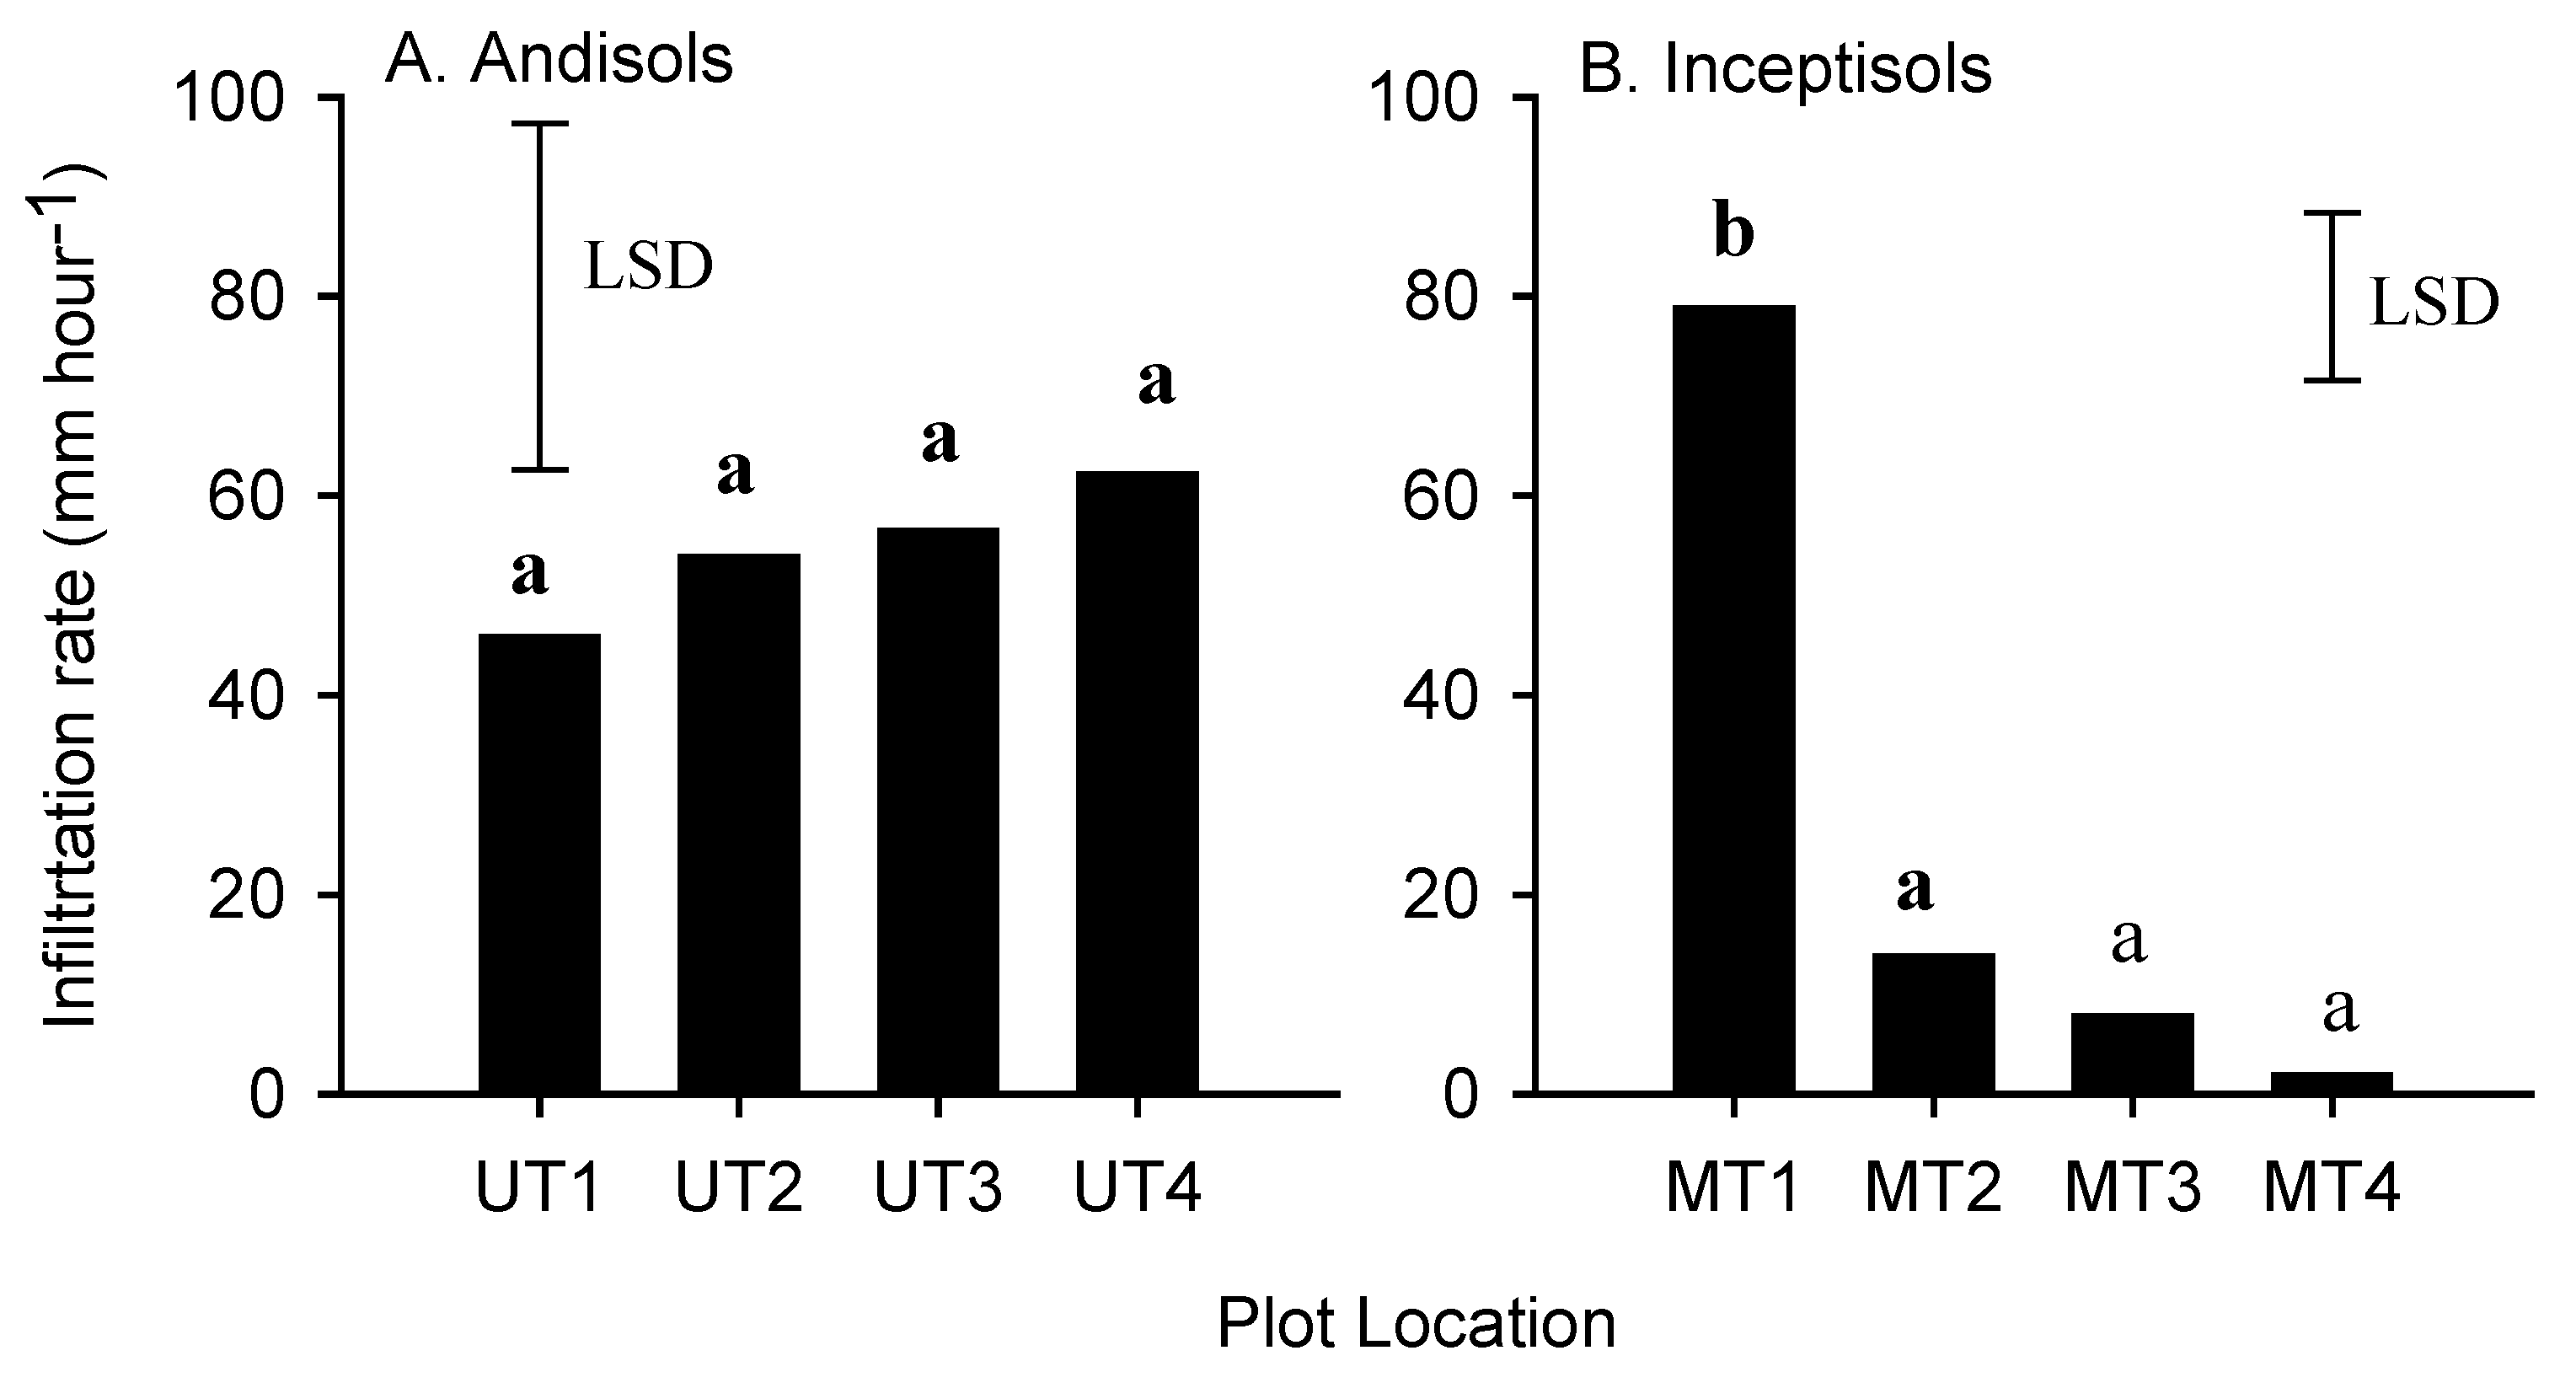
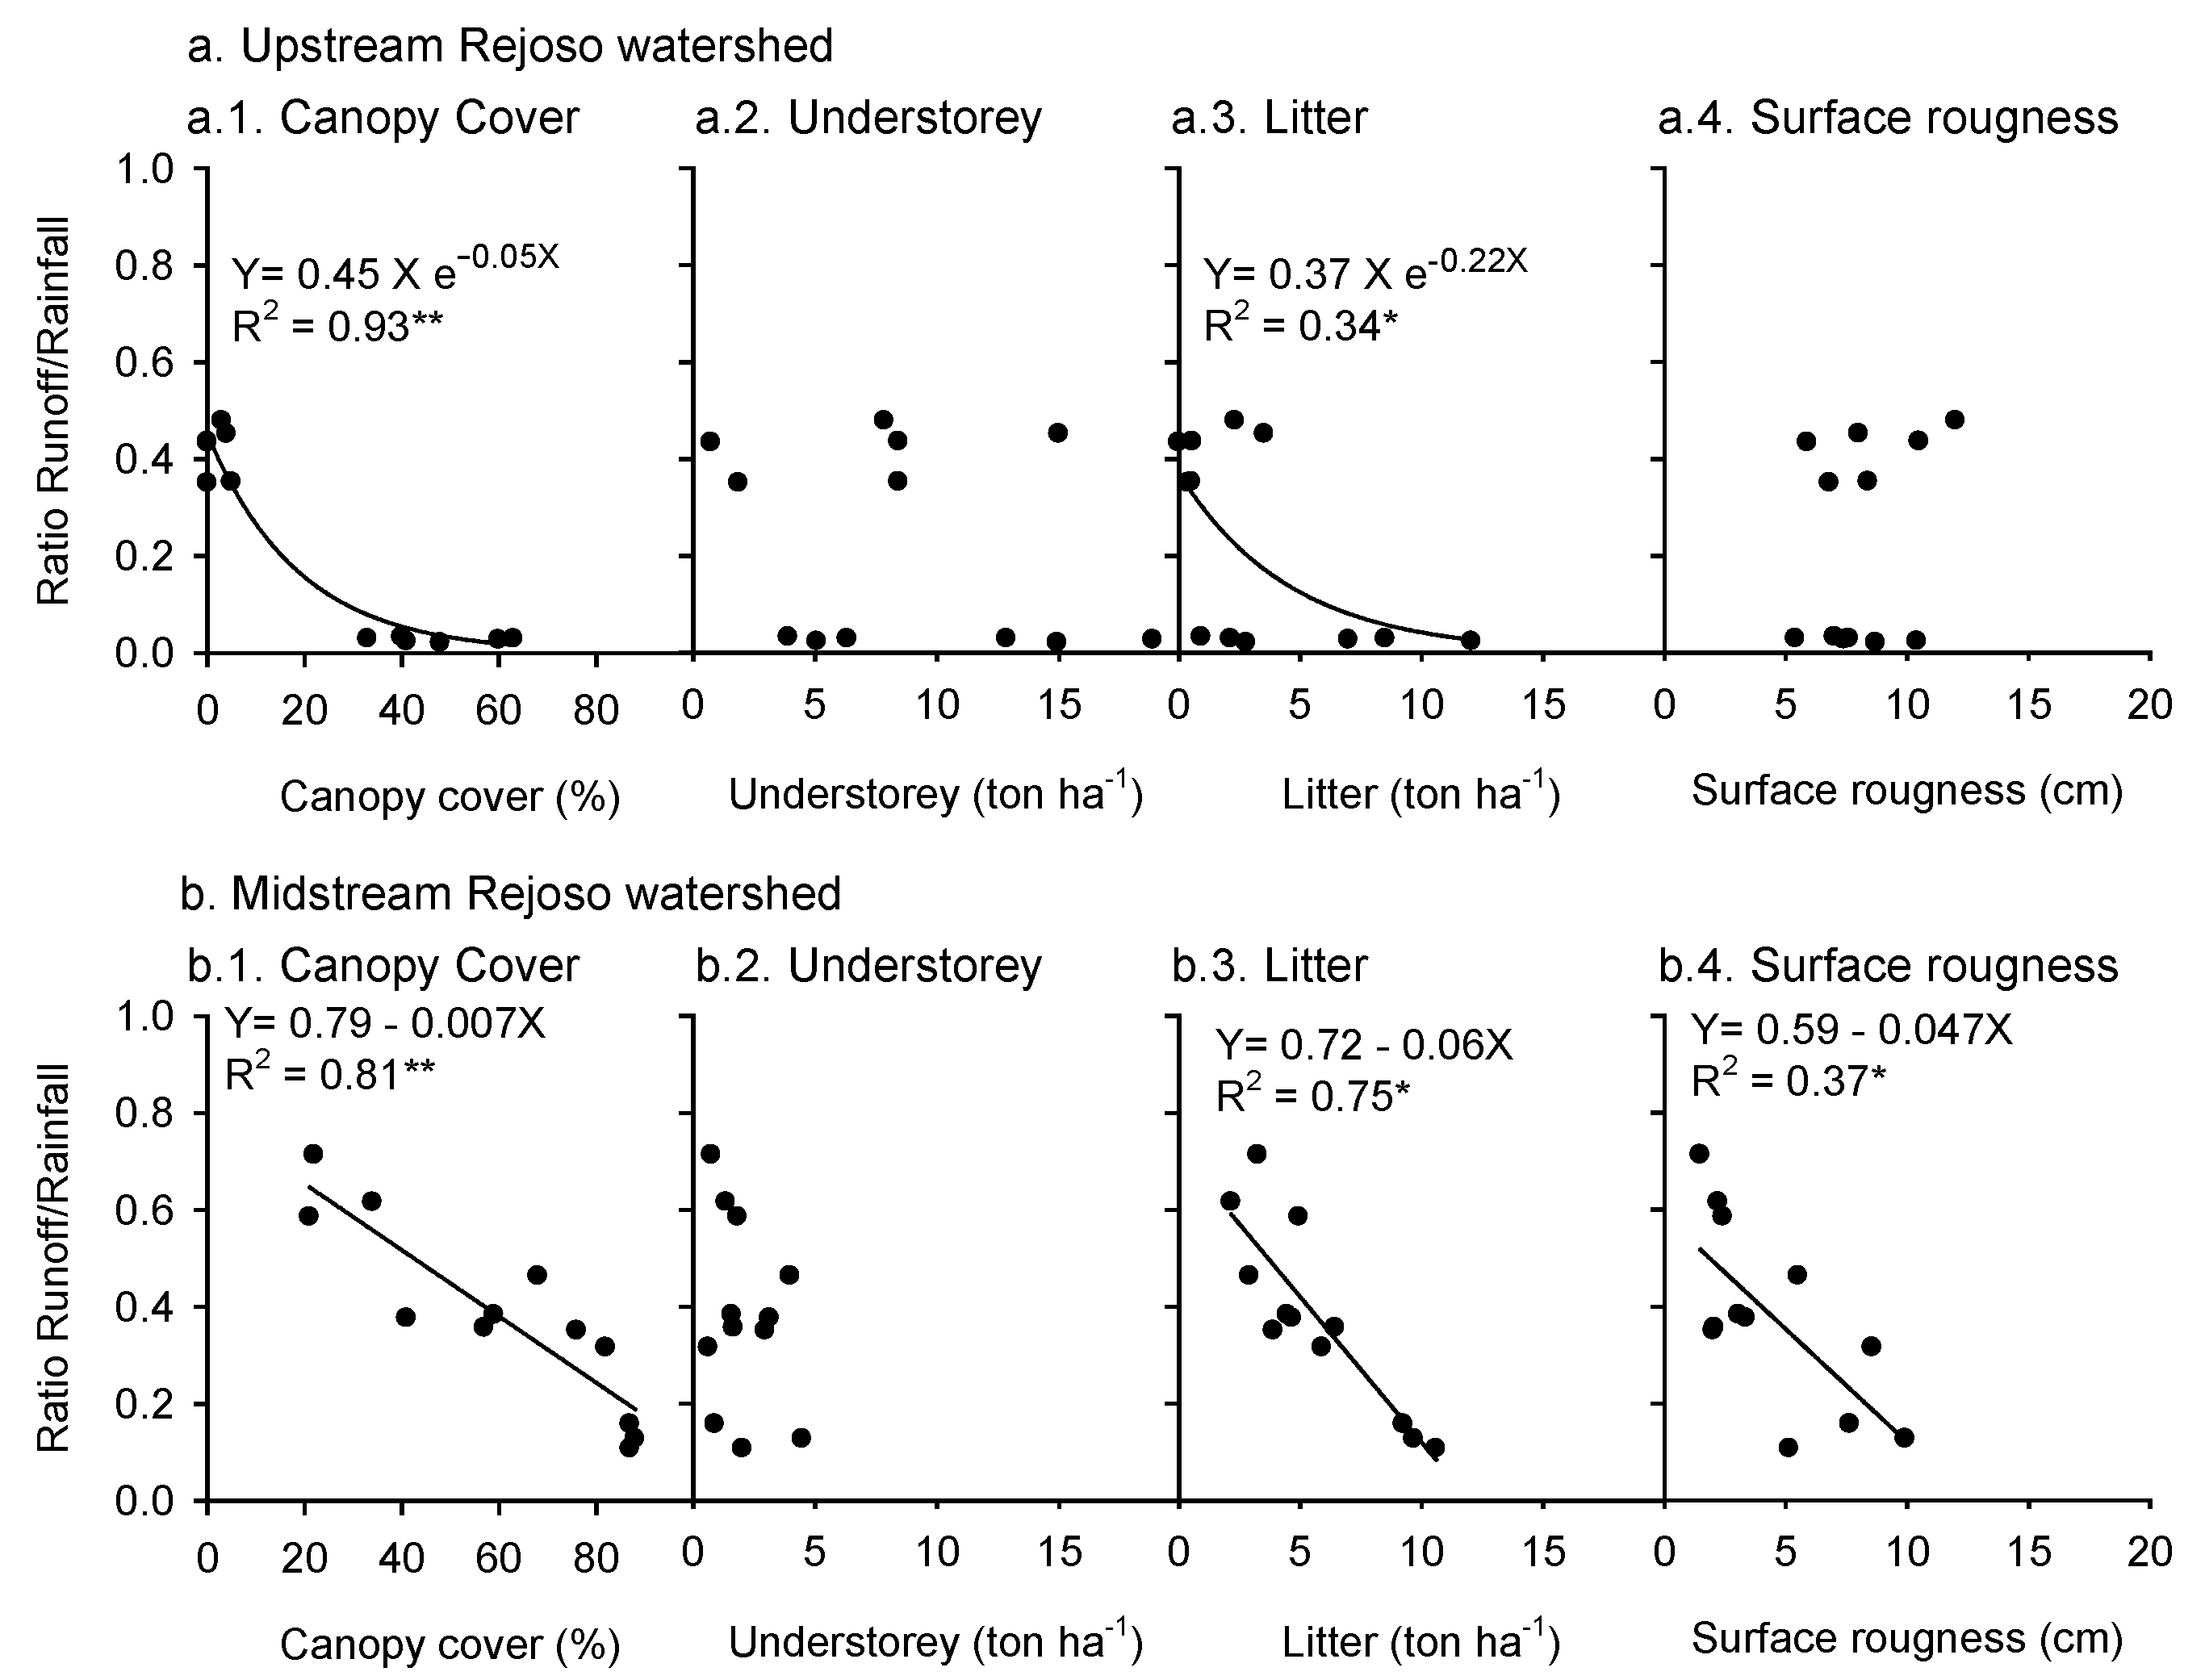
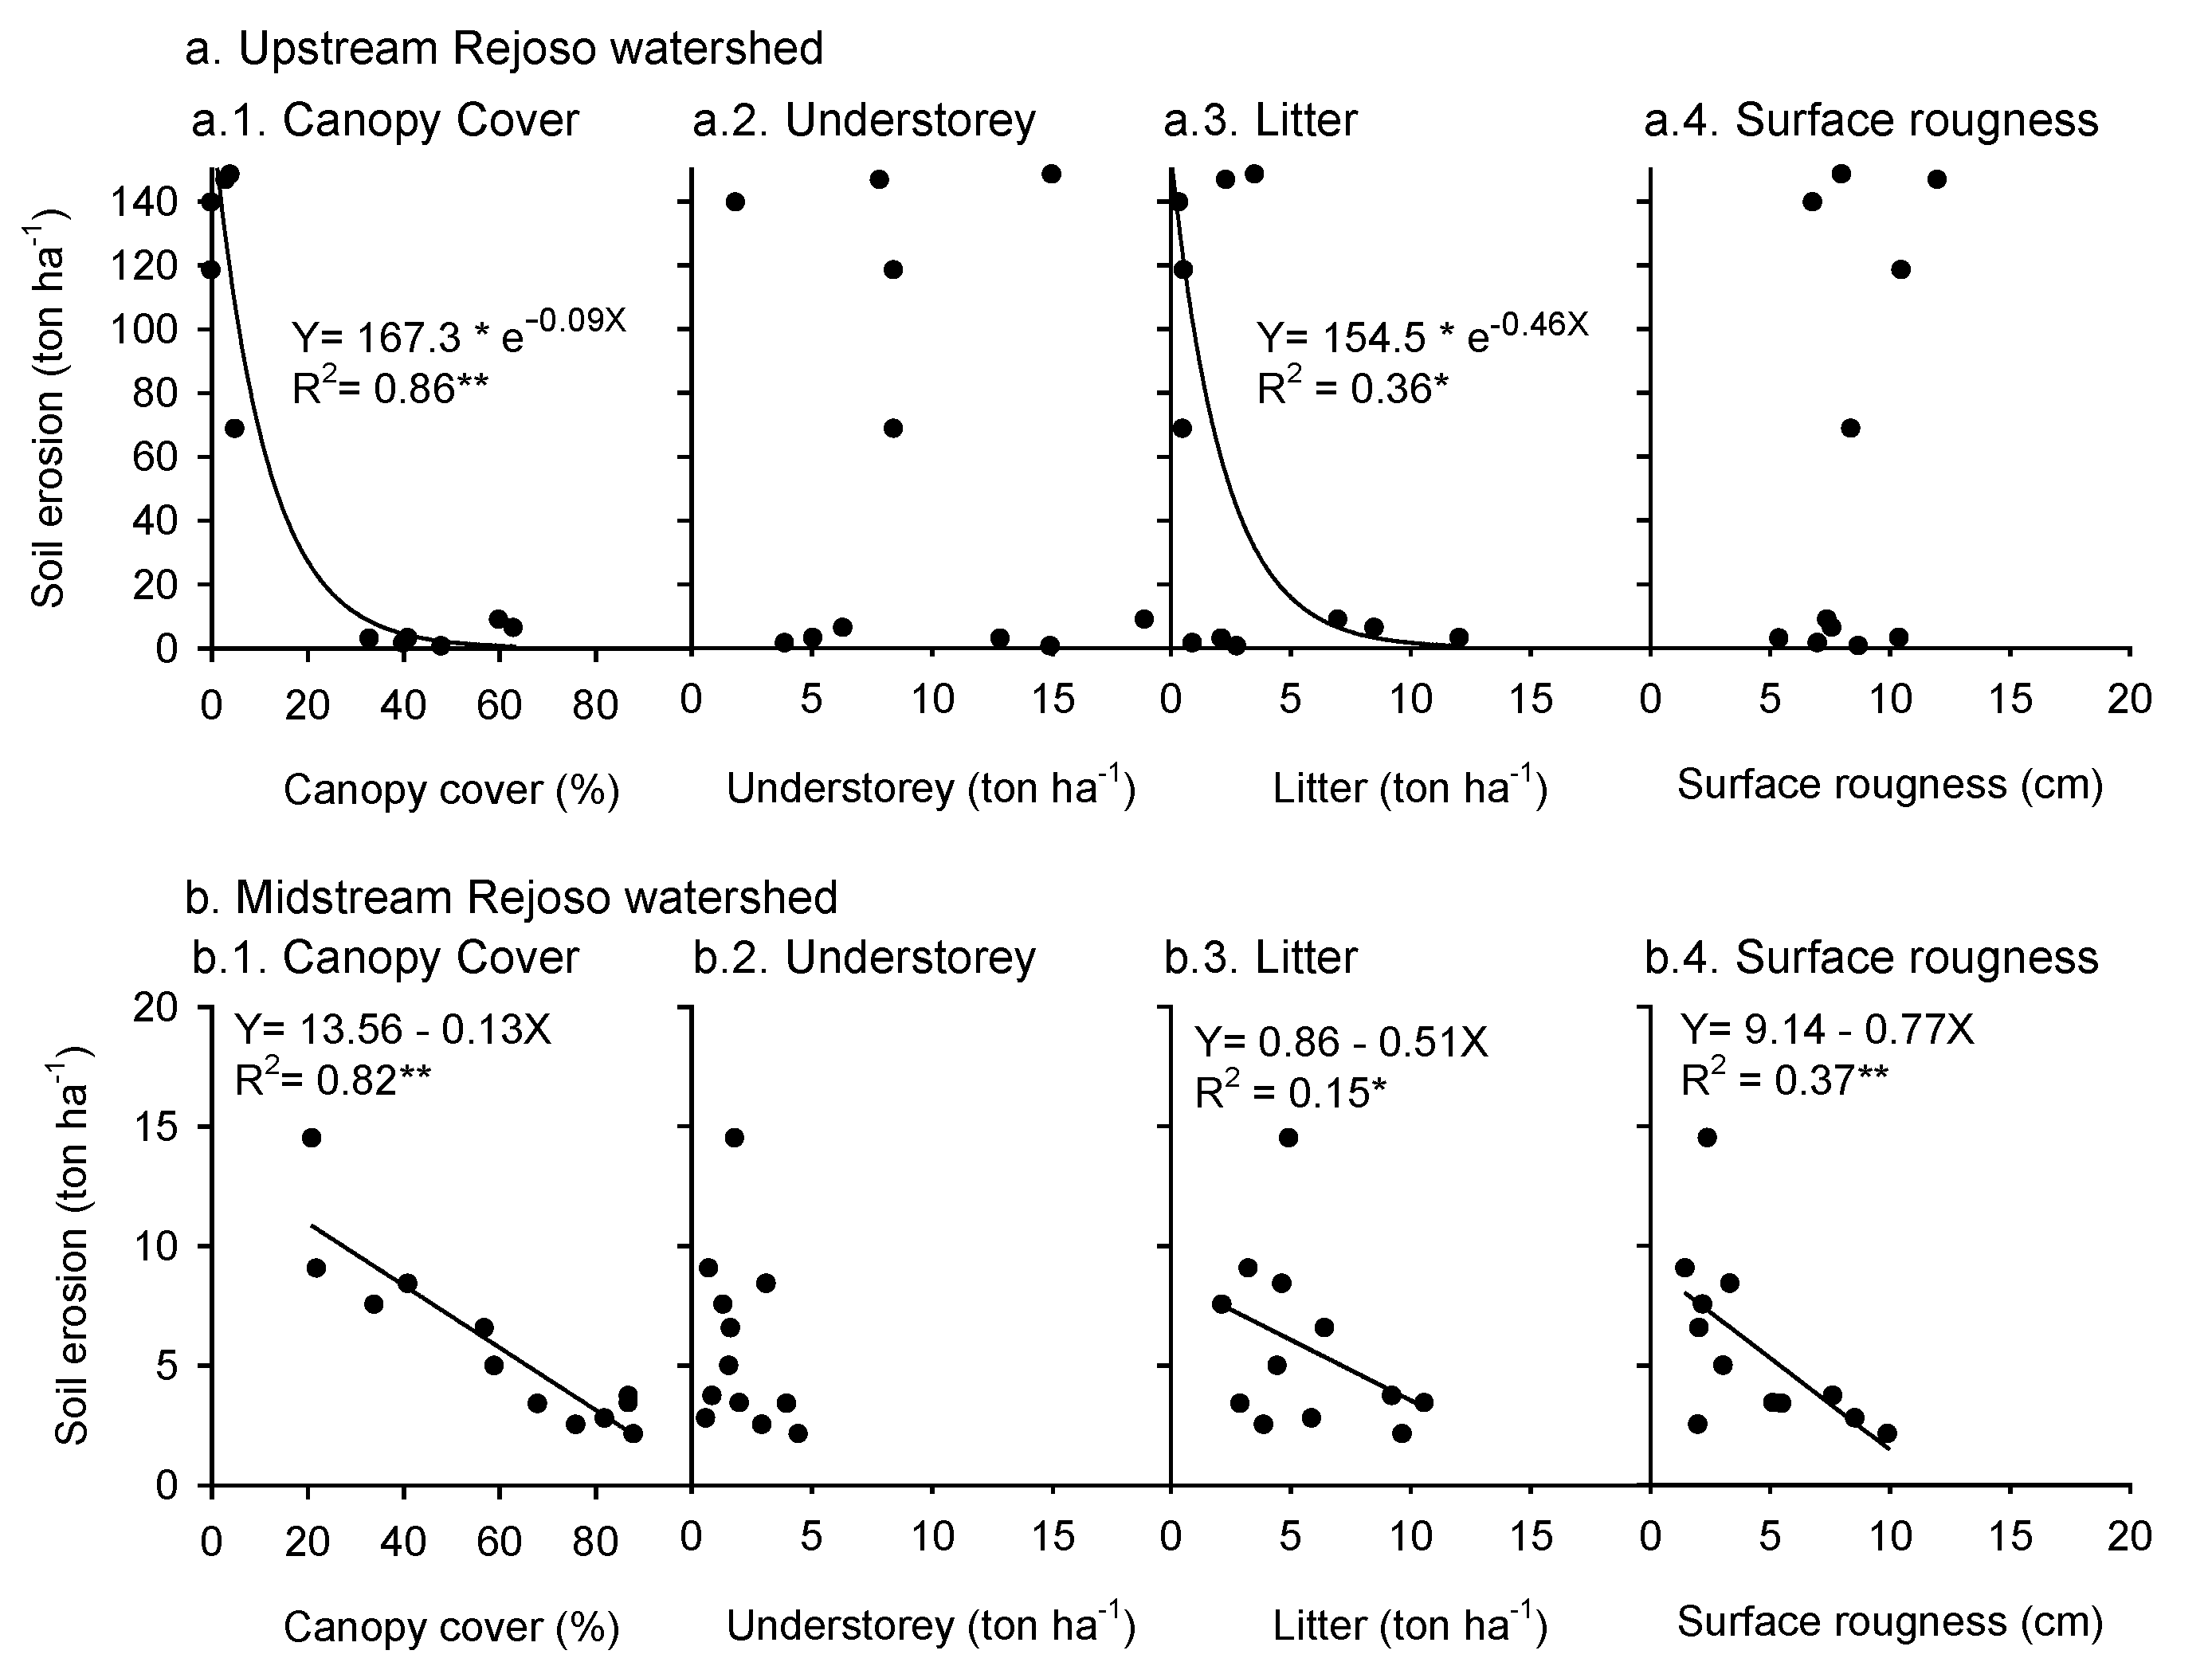
3.3. Land Characteristics Related to Runoff and Soil Erosion

Production forests in the upstream area had a lower tree canopy cover than those midstream but higher than those in agroforestry systems (Table 3). Agroforestry in the upstream area had a very low tree canopy cover because trees were planted only along field edges. Midstream agroforestry gardens ranged from high (75%) to low (26%) canopy cover. Understory vegetation was more prominent upstream than midstream. Litter layer necromass and land surface roughness were generally aligned with tree canopy cover.

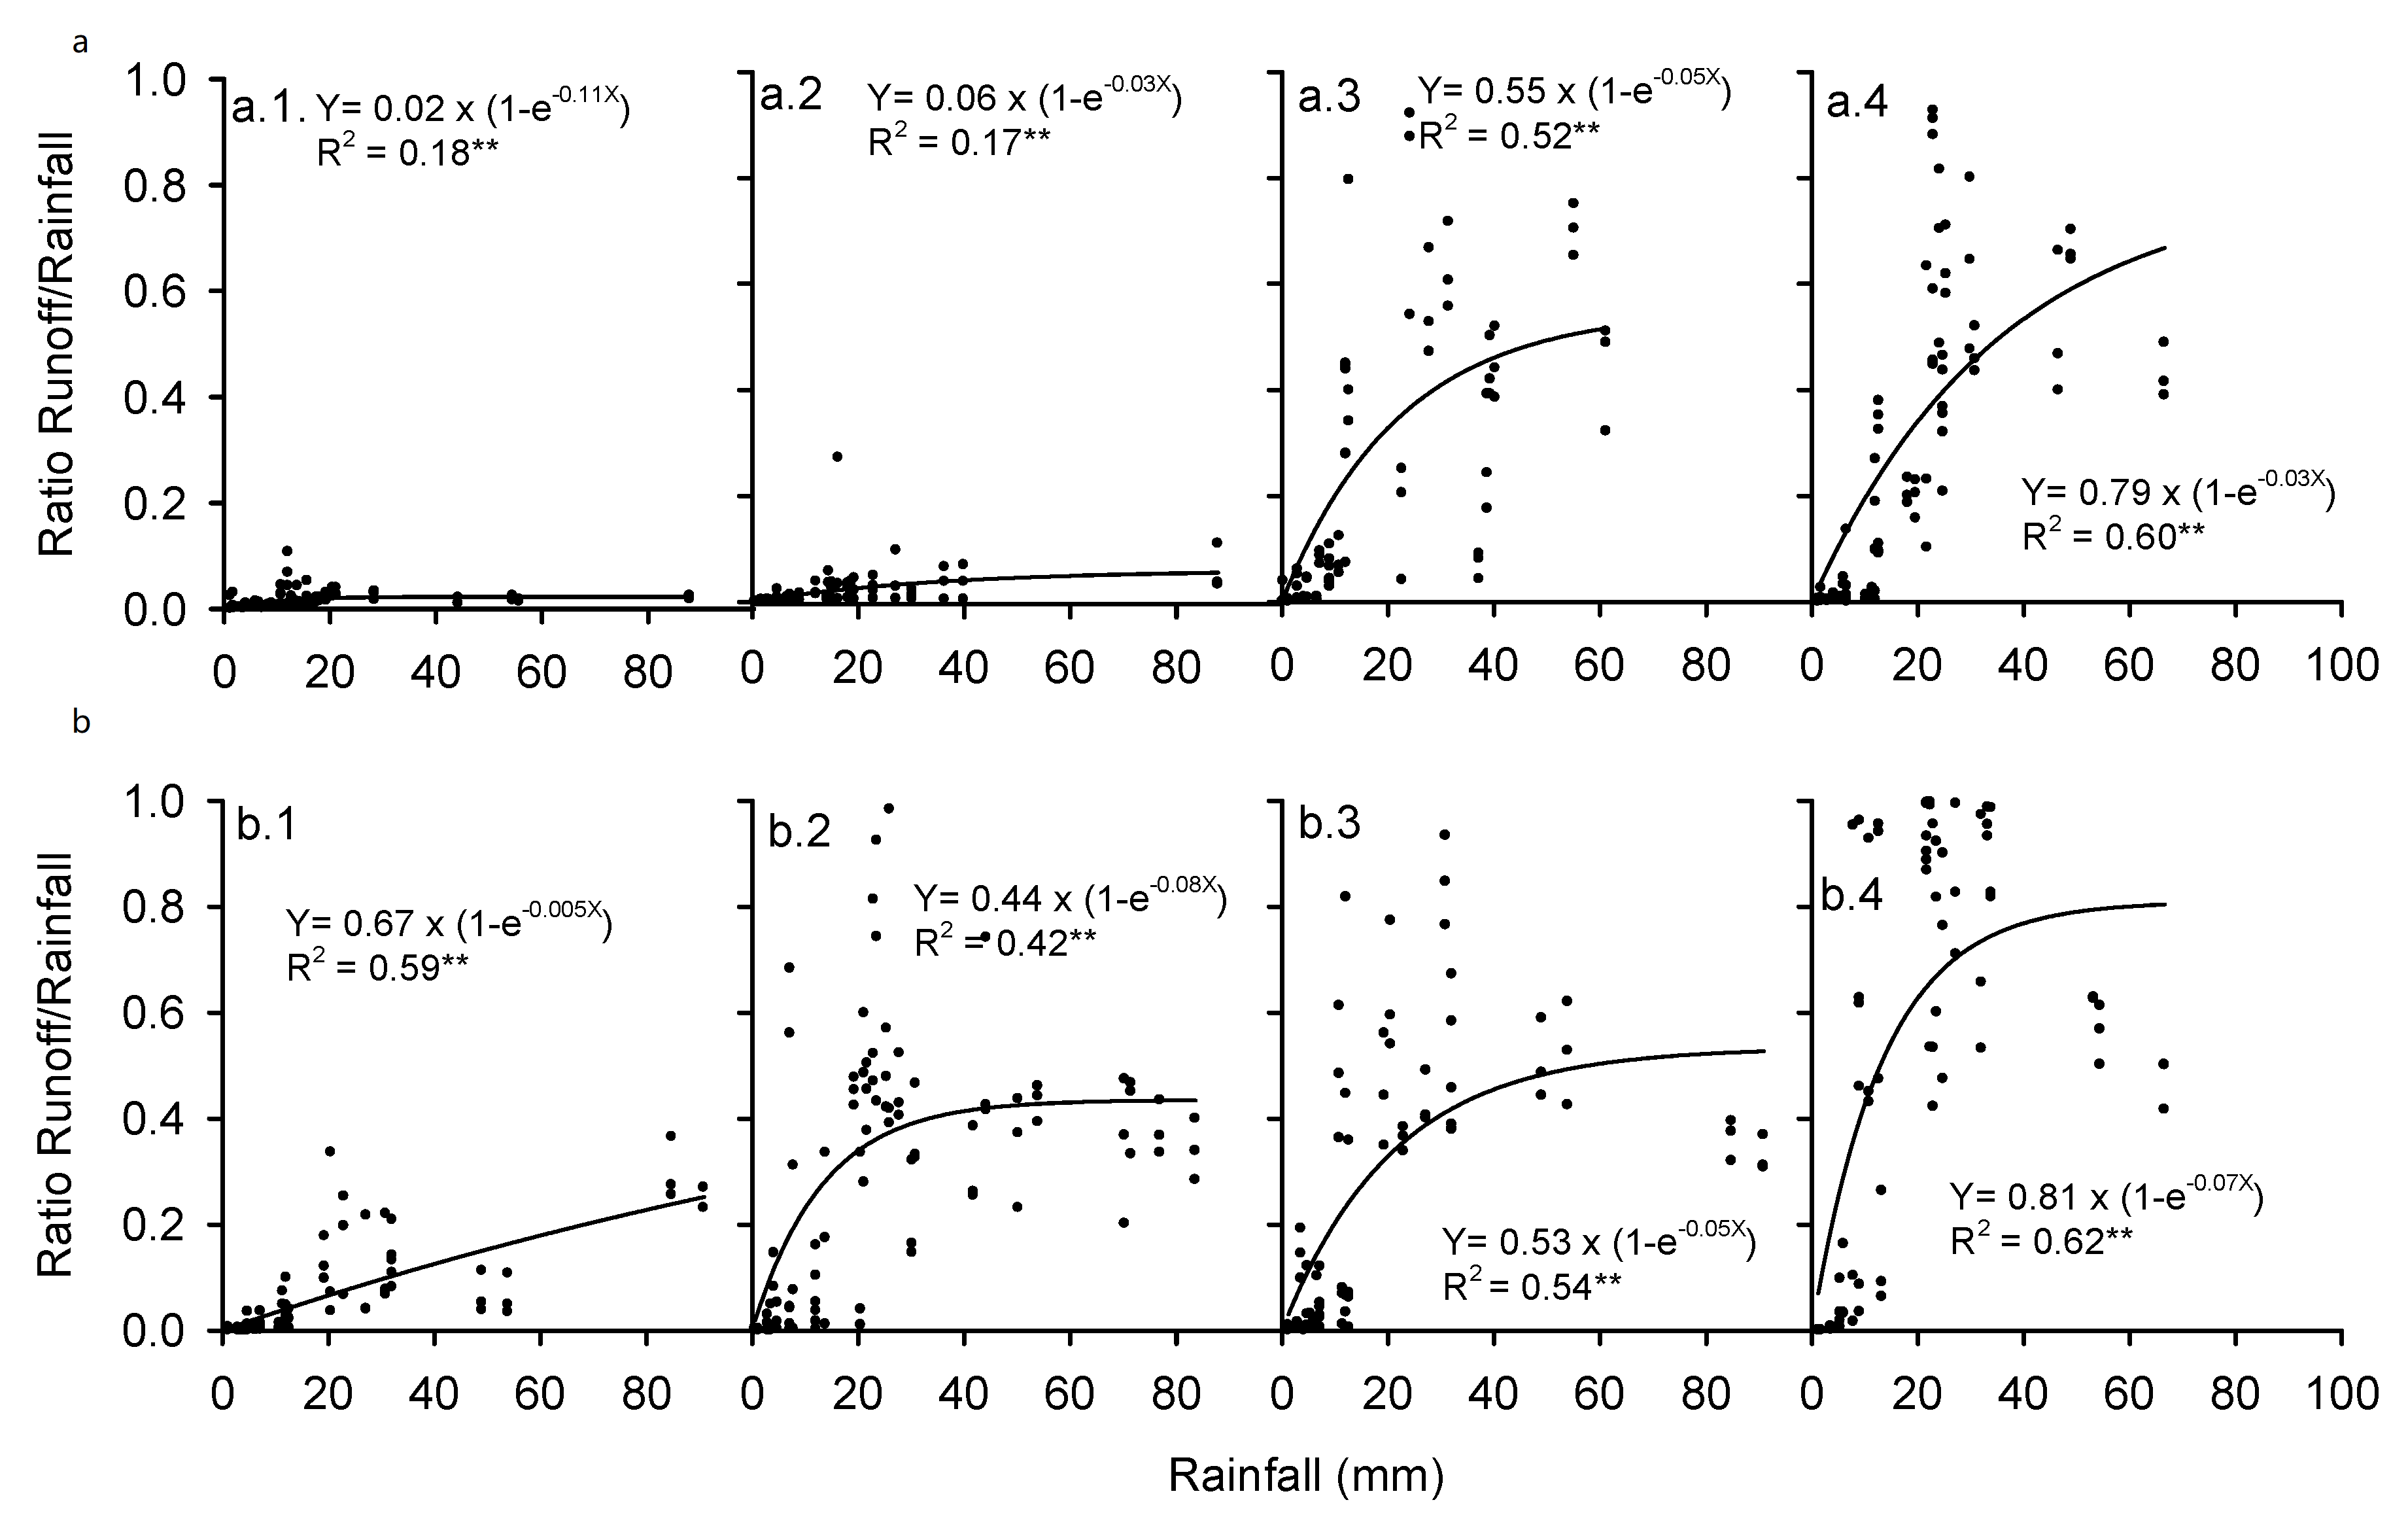
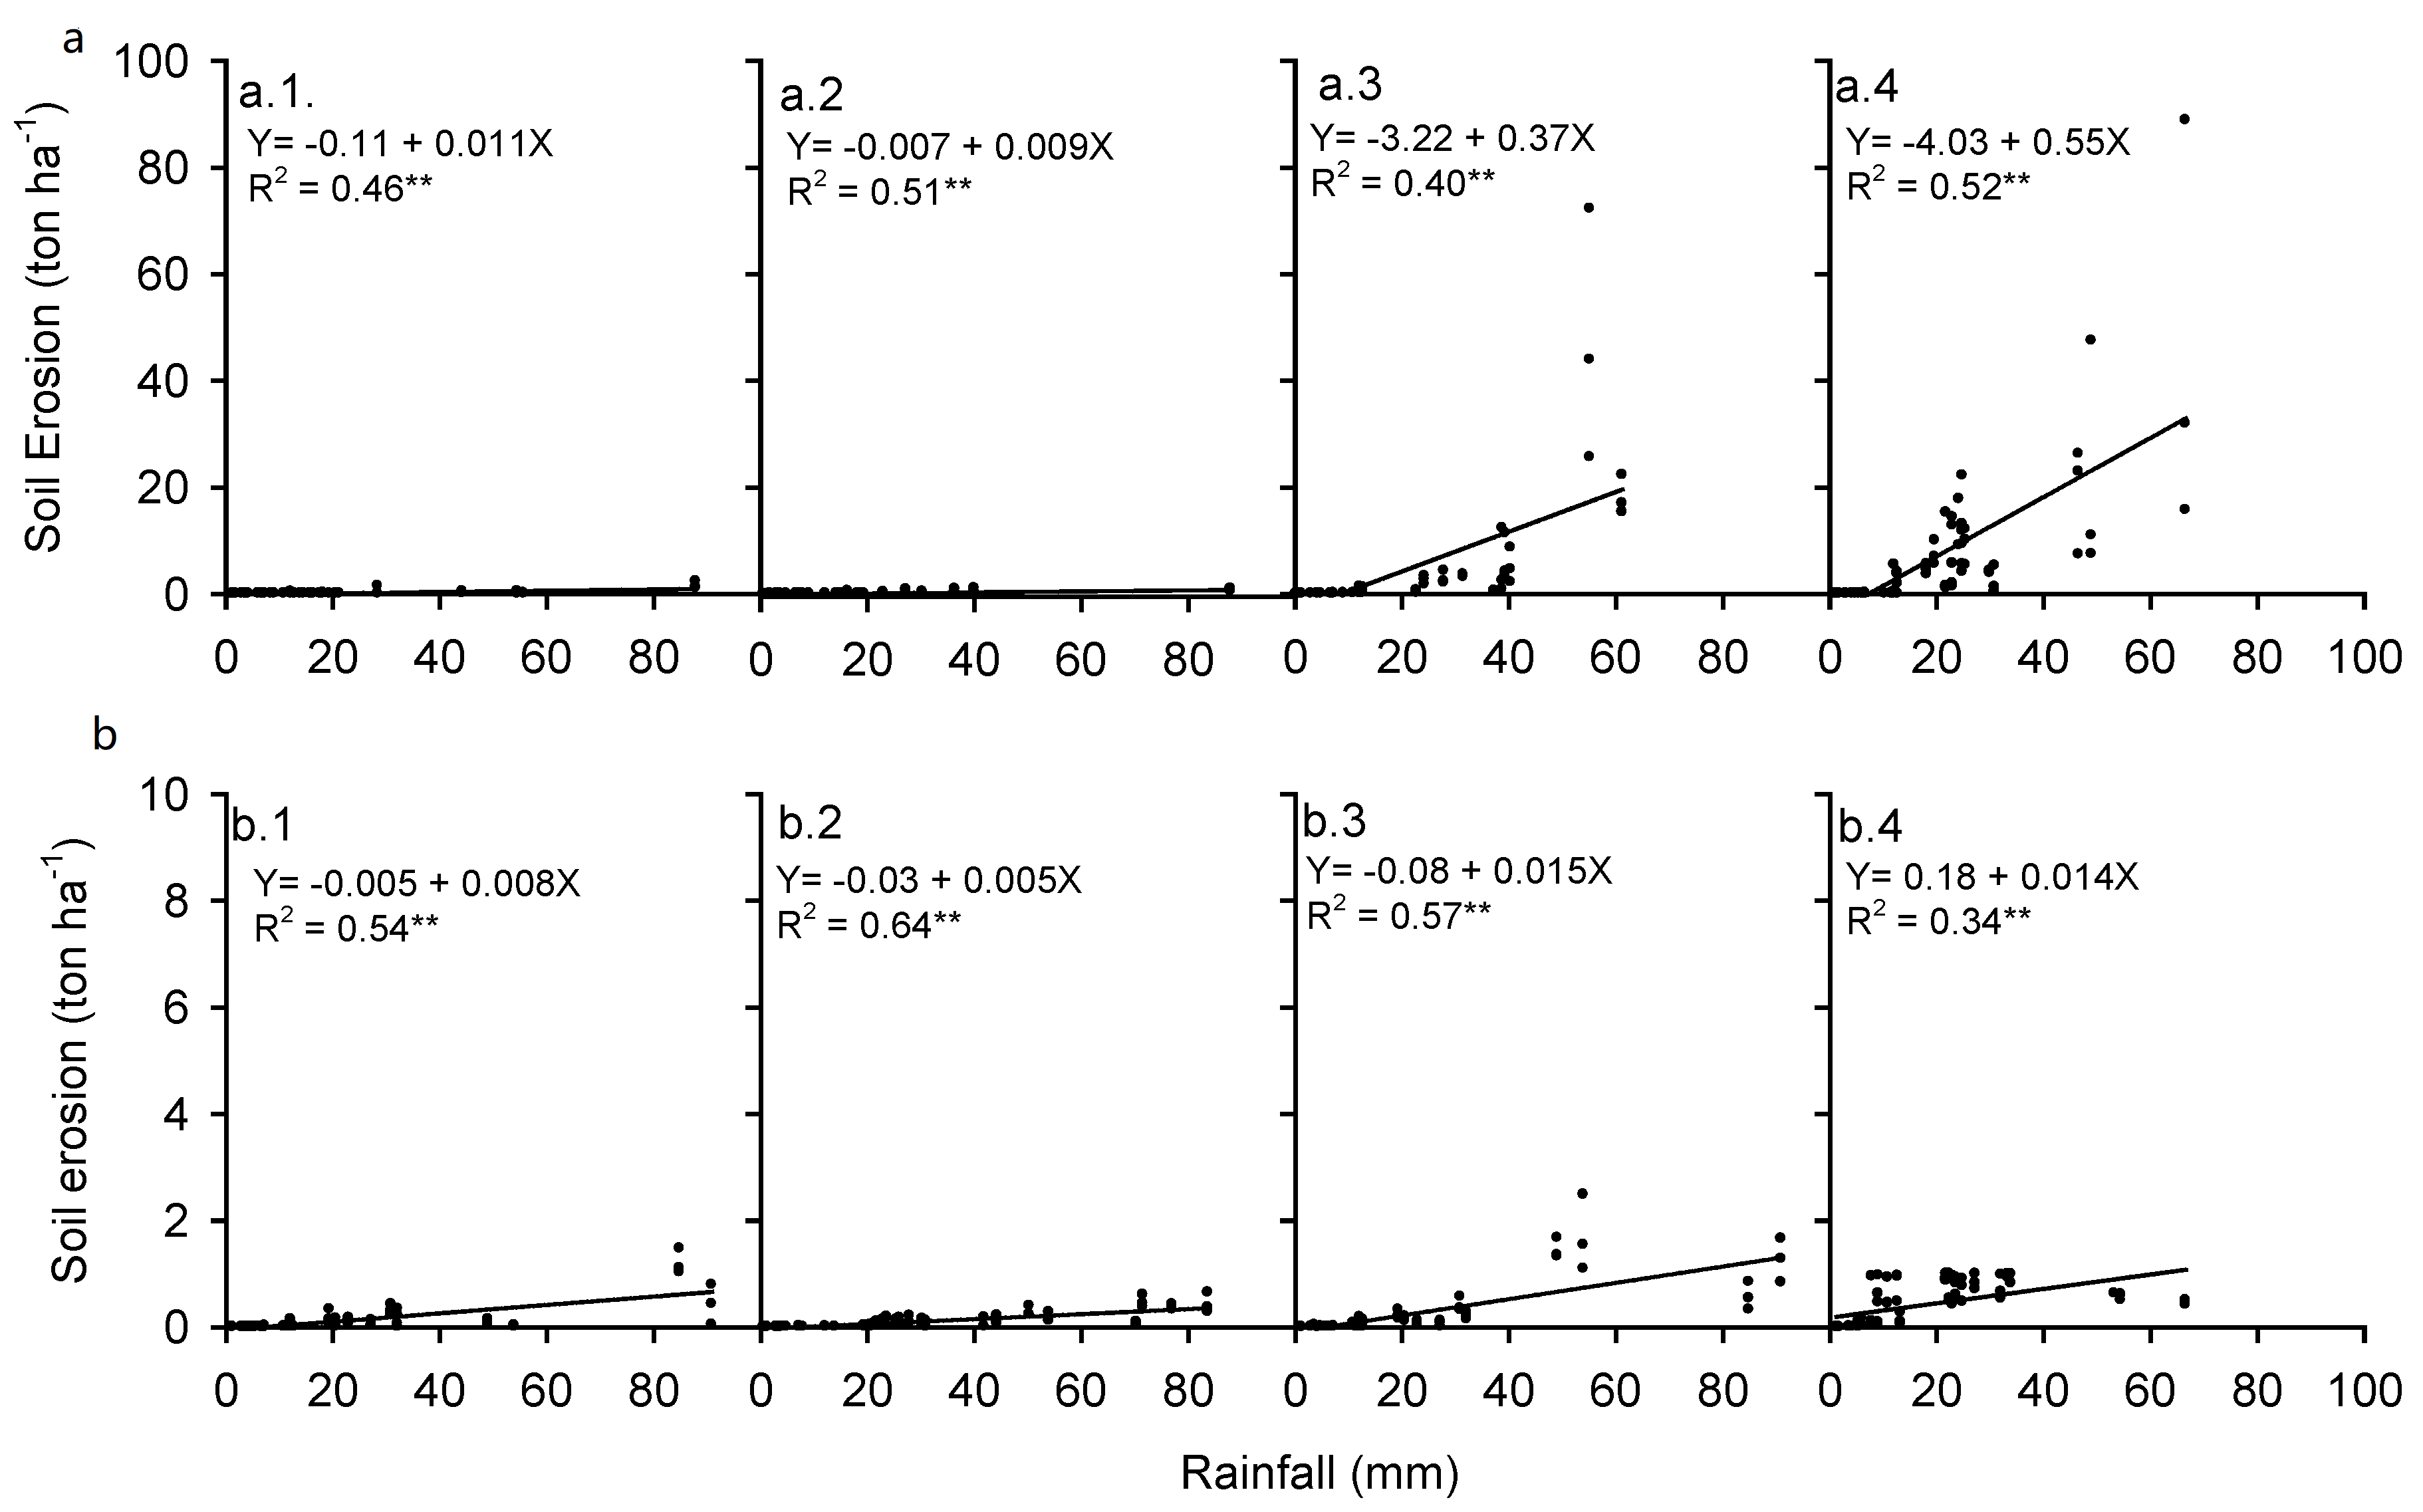
3.4. Runoff and Soil Erosion

Decreasing tree canopy cover in agroforestry systems significantly increased the surface runoff/rainfall ratio or the surface runoff/throughfall ratio (Table 4). In these results, the relationship between surface runoff with rainfall or throughfall was in line, and the ratio of surface runoff/rainfall was further used. The ratio of surface runoff/rainfall is also known as the runoff coefficient.
Infiltration rates in the andisols of the upper watershed were all above 45 mm hour−1 (Figure 6a). In the midstream area, forest plots had a high infiltration rate, but in the agroforestry systems infiltration rates were low and the apparent declined with decreasing tree cover was not statistically significant (Figure 6b).
In the upstream area, with decreasing tree canopy cover, the surface runoff/rainfall ratio increased 16-fold compared to production forest (Figure 7a). In the midstream area, agroforestry systems with a tree canopy cover > 80% were still able to support low surface runoff (Figure 7b). With a tree canopy cover of < 80%, surface runoff increased rapidly on days with moderate rainfall (20–50 mm day−1) (Figure 7b).
In production forests with a closed tree canopy cover, soil erosion rates were low (Table 4 and Figure 8a.1,a.2,b.1). These production forests still had a protective understory vegetation that contributed to litter necromass and surface roughness (Table 3), controlling splash erosion. Upstream, with a reduction in tree cover, canopy soil erosion increased dramatically from 20 to 110 times the rates measured in forested plots (Table 4). Erosion rates in all plots increased with the amount of rainfall (Figure 8a.3,a.4). Midstream agroforestry systems had erosion rates ranging from 2.8 to 10.3 Mg ha−1 in the measurement period (Table 4). As annual rainfall is approximately three times what was recorded in the measurement period, with similar rainfall intensities, these erosion rates are to be multiplied by a factor of three, leading to 9–31 Mg ha−1 year−1.

3.5. Thresholds for Infiltration-Friendly Land Use

Increasing tree canopy cover, while maintaining understory vegetation and litter necromass, is a strong indicator of watershed health and the main driver of low surface runoff (or high soil infiltration) and low soil erosion in production and agroforestry forest systems in the Rejoso Watershed (Figure 8a.1, Figure 9a.1, Figure 10b.1 and Figure 11b.1).
Understory vegetation theoretically can reduce splash impacts on the soil and supports infiltration, as does the litter necromass present. However, the result of this study indicated that understory had no statistically significant relationships with runoff coefficient and soil erosion (Figure 9a.3,b.3 and Figure 10a.3,b.3). Land surface roughness, in contrast to litter necromass, had no consistent relationship with runoff or erosion (Figure 9a.4 and Figure 10a.4).
Summarizing (Figure 11), we found a similar slope (3% more canopy water retention per 10% canopy cover) but a 10% higher canopy retention overall in the upstream area (with lower rainfall intensity and more small events) and a strong difference between the two soil types in erosion per unit surface runoff, offsetting the higher infiltration in Andisols.

4. Discussion

Our study only covered two months’ worth of data, rather than the recommended 3–5 years for such studies. Measurements included one-fourth of the mean annual rainfall, and the validity of the result may be primarily limited by the assumption that it represented a fair sample of the rainfall intensities that can be expected in the landscape. With a disproportional fraction of erosion normally associated with extreme events (compare the curvature of responses in Figure 11B), scaling up our comparison among land cover types to a multi-year basis may underestimate the relevance of controlling overland flows.
The first research question tested the hypothesis that, along the forest to open field agriculture continuum, there is a significant decrease in soil hydrological functions. The results of the present study confirmed that the conversion of high-density forest to land uses with a lower tree canopy significantly decreased soil infiltration rates (Table 2). The results of this study align with previous studies that showed that decreases in ground cover resulted in decreases in soil infiltration rates [51]. Forests and coffee agroforestry have been shown to reduce surface runoff and erosion compared with coffee monoculture [52]. Soil infiltration into Andisols both under deciduous and pine forest was higher than that in cropland in a study on the Canary Islands [53]. A study in China [54] found that the soil infiltration rate of forest was greater than that of agroforestry. A meta-analysis [55] concluded that converting any land use type with permanent vegetation cover (grassland, shrub, or forest) to seasonal cropland leads to a decline in the soil infiltration rate, harming soil and water conservation, while agroforestry improved the soil infiltration capacity compared to cropland and plantations.
The degradation of the soil hydrological functions of forest could be attributed to the decrease in soils’ macroporosity, organic matter content, and increased soil bulk density (Table 2), which had relevance to the decreasing infiltration rates (Figure 8). Among various land use patterns, plant root activities are important factors affecting soil infiltration [56]. The reason why cropland has a lower infiltration rate than the land use types with a high density of trees compared with those with a low density of trees in forest may be verified by the fact that soils beneath the canopies of woody plants had a more extensive distribution of plant roots and a greater number of macropores, which are biologically produced pores [57,58], which created a positive feedback on infiltration [59,60]. The soil macroporosity, needed for effective infiltration, is the result of a continuous process of compaction and the filling in of macropores with fine soil particles, and the creation of biogenic channels (formed by old tree roots, earthworms, and other soil engineers) or abiotic processes (cracks). As no heavy machinery is used in any of these land use systems, compaction is restricted to human feet and motorbikes on specific tracks. The formation of old tree root channels can cause long time lags between land cover change and soil macroporosity [61,62], obscuring relations between current tree cover and soil hydrologic functions. “Fallows” were found to be intermediate between forests and grasslands in terms of infiltration in Madagascar [63]. Recovery of infiltration after the reforestation of grasslands in the Philippines was found to be a matter of decades rather than years [64]. In studies elsewhere in Indonesia, forest soils had more macropores and higher surface infiltration rates than monoculture coffee plantations [52]. Land use changes, especially from forest to cropland, have caused remarkable changes in soil properties, including the loss of organic matter and increases in bulk density [65], which lead to decreased infiltration rates [66]. Some researchers suggested a positive relationship between soil organic matter and infiltration rate [67,68].
Our study results can be compared to earlier studies in the volcanic uplands of West and East Java. Sediment delivery to streams increased after a clear-felling and replant operation in the Citarum Basin (W. Java), which involved the delayed flushing of material trapped during forest clearance and the incipient gullying of trails created by farmers involved in the replanting program, rather than by in-field erosion [69]. A study [70] of the Kali Konto catchment in East Java similarly concluded that “despite their relatively small areal extent (5% in the study area), rural roads, trails and settlements are significant producers of runoff and sediment at the catchment scale and should be included in watershed management programs designed to reduce catchment sediment yields and reservoir siltation.” Soil conservation practices that transform slopes to relatively flat terrace beds and steep terrace risers are, in the absence of vegetation, still subject to erosion, with splash impacts on the terrace risers as a major cause [71,72].
The second research question came out with the hypothesis that the dominant factors that determine “infiltration friendliness” at the plot scale are tree canopy cover, understory vegetation, litter necromass, and land surface roughness. Our research shows that a number of land cover types had infiltration rates below the required rates at peak rainfall events. Among the four factors tested, tree cover and litter layer necromass could be used to define zone-specific thresholds for infiltration-friendly land use, but understory vegetation and surface roughness could not. Although slopes in the upper watershed are much steeper than in the midstream, the coarser texture and likely higher aggregate stability means that thresholds for canopy cover and litter necromass can be lower. A first “line of defense” of forests is the canopy retention of rainfall, prolonging the time for infiltration, as canopy dripping lasts beyond the rainfall event. Canopy retention of rainfall tends to be relatively high for small (but potentially frequent) rainfall events, and low for high rainfall intensities. Our throughfall results for the two zones corresponded with differences in observed intensity. A five-year study in the Amazon forests of Colombia [73] showed that throughfall ranged from 82 to 87% of gross rainfall in the forests studied (with a canopy cover of 83–91%) and varied with event-level gross rainfall, but also with forest structure, while stemflow contributed, on average, only 1.1% of gross rainfall in all forests. Throughfall is more spatially heterogeneous than rainfall, creating a challenge for its measurement. Roving, rather than fixed, location throughfall gauges led to narrower confidence intervals of throughfall fractions in longer-term studies [74] in lower montane rainforest in Puerto Rico, where throughfall was 75% and stemflow 4.1% of rainfall, with palms responsible for about 3% and other trees 1.1%. Spatial heterogeneity in throughfall can be expected to lead to uneven patterns of deep percolation and groundwater recharge in “patchy” forests [75]. Canopy interception can lead to direct evaporation, throughfall, or stemflow [76]. The ratio between throughfall and stemflow depends on the architecture of leaves (e.g., erect leaves favoring stemflow, pendulous leaves favoring throughfall) and stems. Storage along the stem pathway depends on bark properties [77]. Stemflow accounted for less than 3% of gross rainfall for tropical hardwoods in a study in Panama, while it was high for tall grasses [78]. High stemflow fractions have also been reported for bamboo, bananas, shaded coffee and cocoa, and understory shrubs [79,80,81,82]. Canopy interception and direct evaporation tend to be high in coastal areas with frequent light rainfall events, but low where tropical rainstorms are predominant and the canopy storage is rapidly saturated [83,84]. By creating throughfall drops that are larger than those of open-field rainfall, tree canopies may increase sub-canopy erosivity [13,84].
Many authors have emphasized that the key to hydrologic functions is in the soil rather than the aboveground parts of the forest [12]. Still, we found strong and direct relations with canopy cover. Positive effects of canopy cover on infiltration were related to raindrop interception in earlier studies [75]. Interception will (a) reduce the destructive power of rainwater splash on the ground surface (as long as the erosive canopy drips described earlier are avoided), (b) allow more time for infiltration as water reaches the surface more slowly, (c) keep a thin water film on the leaves that will (d) cool the surrounding air when it subsequently evaporates. It reduces the amount of water reaching the soil surface, but by increasing air humidity it also decreases transpiration demand when stomata are open. Coffee gardens close to forest had high macroporosity and infiltration rates relative to more compacted pasture and sugarcane land on volcanic slopes in Costa Rica [85]. Dye infiltration patterns in a comparison of natural forest and rubber plantations in Yunnan (China) showed [86] that the fine roots of understory vegetation promoted subsurface flow and reduced water erosion. The effects of trees on infiltration have been described as a “double-funneling” [87] with stemflow (dependent on the insertion angle of branches on the main stem), bringing water to the soil surface connection point for root-induced preferential flow [88,89].
A comparison of infiltration rates (median Ks values 16–98 mm h–1) in broadleaf, pine-dominated, and mixed community-managed forest in Nepal [90] found the less intensively used pine-dominated site to be more conducive to vertical percolation than the other two forest types. These results were remarkable in relation to the negative local perceptions of the role of pine plantations on declining water resources.
Understory vegetation can theoretically reduce splash impacts on the soil and supports infiltration, as does the litter necromass present. However, the result of this study indicated that the understory shows no significant relationships with the runoff coefficient and soil erosion. This is possibly because surface runoff and erosion are largely controlled by land cover. The growth and development of the understory is determined by canopy cover. Likewise, the tree plantations in each plot are also diverse, so this also affects the diversity of the understory vegetation underneath. The result of this study indicates that the litter layer in the old production forest both upstream and midstream is significantly thicker than that other land uses (Table 3) and there is a significant correlation with the runoff coefficient and soil erosion (Figure 7 and Figure 8, respectively). Litter is the parts of the body of the plant (in the form of leaves, branches, twigs, flowers, and fruit) that die (deciduous or pruned) and lie on the surface of the soil either intact or partially weathered. The role of litter in maintaining infiltration and soil erosion is through: (a) M=maintaining soil looseness by protecting the soil surface from rainwater, so that aggregates and soil macropores are maintained, (b) providing food sources for soil organisms, especially “soil engineers” (e.g., earthworms), so that the organism can live and develop in the soil, thus, the number of macro pores is maintained through the activity of these organisms, and (c) maintaining water quality in the river through the filtering of soil particles carried by surface runoff before entering the river. In a study in North China [91], the presence of the litter of Quercus variabilis, representing broadleaf litter, and Pinus tabulaeformis, representing needle leaf litter, reduced surface runoff rates by 29.5% and 31.3%, respectively. The overall effect of fast plus slow decomposing surface litter means the protection of the soil surface from splash erosion, surface roughness that reduces sediment entrainment, an energy source for soil biota, and a conducive microclimate [92,93].
Infiltration fractions depend on the scale of measurement and on variations in slope steepness, as overland flow can re-infiltrate on less steep foot-slopes in the case of the upper plots [94] or water infiltrates can re-emerge as surface flow depending on subsoil conductivity [95,96]. Such effects will need to be included if catchment level hydrology is to be predicted from plot-level measurements. The land surface roughness also contributes to a high infiltration rate, reducing soil erosion. In the upstream, there is no significant different between land uses, but in the midstream, land surface roughness in agroforestry systems with tightly different canopies is significantly higher than rare canopies (Table 3). Without a high canopy cover (Table 3), this roughness was not able to control surface runoff and erosion in the upstream area. This is due to a steep slope in this plot. Both the production forest and agroforestry systems with high canopies maintained a relatively high land surface roughness compared with rare canopies in the midstream area. In the midstream, the land surface roughness was significantly correlated with the runoff coefficient and soil erosion. The role of surface roughness as a sediment filter may depend on frequent regeneration to counter homogenization [97]. Surface roughness in the landscape includes a cavity, the meandering of streams due to the presence of litter, necromass, tree trunks, and rocks, which provide opportunities for water flow to stop for longer periods and experience infiltration. This condition also functions as a sediment filter. This function needs to be managed through land management, so that surface roughness is maintained on the ground.
Shifts in local rainfall patterns between sub-watersheds make it difficult to disentangle the relative importance of land use and climate change through statistical pattern analysis without knowledge of the underlying processes [98,99]. The holy grail of scientific hydrology, connecting overall aggregated flow patterns to local extreme events and possible hysteresis, is still worth searching for even if a general solution might ultimately prove impossible to find [100]. For the deep seepage component of the hillslope and catchment water balance, we can expect that extreme events are less important than gradual changes that influence average flows, but empirical analysis of the uncertainties involved is still a challenge [101].
The third research question is, as an analysis, the answers to the previous two research questions with the hypothesis that it is not always that the upstream watershed area is more sensitive to hydrological disturbance due to changes in land use than the midstream, but the factor of soil properties also determines considerations in watershed hydrological management. From a land use policy perspective, our results suggest that maintaining high (~80%) canopy cover in the mid-slope farmer-controlled landscape under bench terracing, which does not match the slope criteria for designation as watershed protection forest, is important. In Indonesia, protection forest areas have the primary functions of the protection of life support systems to regulate water management, prevent flooding, control soil erosion, and maintain soil fertility [102].
Erosion rates of 9–31 Mg ha−1 year−1, as estimated here, are a challenge, especially if the 400-year time frame of using up all soil, as used in Equation 7, is replaced by a tolerance equal to the rate of soil formation. A study in a high rainfall area with Inceptisols in Central Java [103] estimated that the rate of chemical weathering was around 0.85 Mg ha−1 yr−1 and used that as estimate of erosion rates that can be sustained indefinitely without affecting soil depth. Volcanic ash inputs add soil on top of the profile but may also be disproportionately included in what gets removed from the plots. Our measurements in Rejoso suggested that critical thresholds of the degree of canopy cover that is hydrologically desirable depend on soil and climatic conditions, which may vary over a relatively short distance. When the focus is on erosion and net sediment transport, the scale of consideration strongly influenced conclusions in the volcanic Way Besai Watershed in Sumatra as well [104]. With the higher rainfall intensities in midstream Rejoso and more erodible soils upstream, the risks for degradation from a downstream perspective are differentiated by zone. Combining our plot-level results with efforts of hydrologic modeling for the Rejoso catchment as a whole [105,106] can guide further advice to a local watershed forum on the measures and incentives needed to restore and protect the watershed as a whole.
The Indonesian legal requirement of 30% forest cover across all its local government entities [31] is a coarse translation of the hydrologic relations at risk. It clearly matters what the land cover in the “non-forest” parts of the landscape is and how vegetation interacts with soils and geomorphology in shaping rivers and groundwater flows [107,108]. Our findings for the Rejoso Watershed show that, within the agroforestry spectrum, hydrologic the thresholds of infiltration friendliness exist between the systems that are mostly “agro” and those that are mostly “forest”, but higher tree cover systems are desirable.

5. Conclusions

Our results demonstrated that vegetation-based thresholds for adequate infiltration, given the existing rainfall intensities, differed between the middle and upper Rejoso Watershed. Despite steep slopes and low tree cover, the upper watershed, with its course soil texture (pseudo-sand/silt), low bulk density due to a high content of amorphic minerals, strong micro-aggregation and individual minerals, sponge-pores typical of Andosols, and land management practices that combine vegetable crops with a tree canopy cover of around 55%, can maintain infiltration and keep erosion at acceptable levels. In the midstream part of the catchment, despite gentle slopes under bench terracing, infiltration-friendly land use on the fine-textured Inceptisols required a canopy cover of 80%. Beyond tree canopy cover, litter layer necromass was found to be a good and easily observed indicator of infiltration rates, while understory vegetation and surface roughness may support infiltration, but are not sufficiently strong indicators.

Author Contributions

D.S., W.W., K.H., and M.v.N. designed the study. N.M. collected data in the midstream, A.L.R. collected data in the upstream, R.M.I. coordinated the data collection in the field, and were academically supervised by D.S., W.W., and K.H. D.S., K.H. and M.v.N. shaped the manuscript, which was approved by all co-authors.

Funding

Fieldwork for this research was funded by the Danone Ecosystem Fund via the World Agroforestry Centre, ICRAF, Indonesia office. This research was also partially funded by the Indonesian Ministry of Research, Technology and Higher Education under the WCU Program managed by the Institute of Research and Community Services, Universitas Brawijaya and Institut Teknologi Bandung.

Acknowledgments

Authors thank to the community of the Rejoso Watershed and the “Rejoso Kita” Forum. They also thank the Department of Soil Science, Faculty of Agriculture, University of Brawijaya and the Research Group of Tropical Agroforestry for their support of the research. The authors would like to thank the Social Investment Indonesia (SII) organization for connecting the local stakeholders during fieldwork. The manuscript benefitted from the comments of Sampurno Bruijnzeel and an anonymous reviewer.

Conflicts of Interest

The authors declare no conflict of interest.

Appendix A

Figure A1. Soil texture in five different layers in runoff plot measurements.
Land 09 00240 g0a1

References

  1. UN-Water. 2018 UN World Water Development Report, Nature-Based Solutions for Water; UN-Water: Nairobi, Kenya, 2018. [Google Scholar]
  2. Ostovar, A.L. Investing upstream: Watershed protection in Piura, Peru. Environ. Sci. Policy 2019, 96, 9–17. [Google Scholar] [CrossRef]
  3. Ali, M.; Hadi, S.; Sulistyantara, B. Study on land cover change of Ciliwung downstream watershed with spatial dynamic approach. CITIES 2015 International Conference, Intelligent Planning towards Smart Cities, CITIES 2015, 3–4 November 2015, Surabaya, Indonesia. Procedia—Soc. Behav. Sci. 2016, 227, 52–59. [Google Scholar] [CrossRef] [Green Version]
  4. Jacobs, S.R.; Timbe, E.; Weeser, B.; Rufino, M.C.; Butterbach-Bahl, K.; Breuer, L. Assessment of hydrological pathways in East African montane catchments under different land use. Hydrol. Earth Syst. Sci. 2018, 22, 4981–5000. [Google Scholar] [CrossRef] [Green Version]
  5. Van Noordwijk, M.; Bayala, J.; Hairiah, K.; Lusiana, B.; Muthuri, C.; Khasanah, N.; Mulia, R. Agroforestry solutions for buffering climate variability and adapting to change. In Climate Change Impact and Adaptation in Agricultural Systems; Fuhrer, J., Gregory, P.J., Eds.; CAB-International: Wallingford, UK, 2014; pp. 216–232. [Google Scholar]
  6. Van Noordwijk, M.; Bargues-Tobella, A.; Muthuri, C.W.; Gebrekirstos, A.; Maimbo, M.; Leimona, B.; Bayala, J.; Ma, X.; Lasco, R.; Xu, J.; et al. Agroforestry as part of nature-based water management. In Sustainable Development through Trees on Farms: Agroforestry in Its Fifth Decade; van Noordwijk, M., Ed.; World Agroforestry (ICRAF): Bogor, Indonesia, 2019; pp. 261–287. [Google Scholar]
  7. Van Noordwijk, M.; Kim, Y.S.; Leimona, B.; Hairiah, K.; Fisher, L.A. Metrics of water security, adaptive capacity, and agroforestry in Indonesia. Curr. Opin. Environ. Sustain. 2016, 21, 1–8. [Google Scholar] [CrossRef]
  8. Filoso, S.; Bezerra, M.O.; Weiss, K.C.; Palmer, M.A. Impacts of forest restoration on water yield: A systematic review. PLoS ONE 2017, 12, e0183210. [Google Scholar] [CrossRef] [Green Version]
  9. Bentley, L.; Coomes, D.A. Partial river flow recovery with forest age is rare in the decades following establishment. Glob. Chang. Biol. 2020, 26, 1458–1473. [Google Scholar] [CrossRef] [Green Version]
  10. Zhang, J. Hydrological Response of a Fire-Climax Grassland and a Reforest Before and After Passage of Typhoon Haiyan (Leyte Island, the Philippines). Ph.D. Thesis, Free University, Amsterdam, The Netherlands, 2018. [Google Scholar]
  11. Bruijnzeel, L.A. Hydrological functions of tropical forests: Not seeing the soil for the trees? Agric. Ecosyst. Environ. 2004, 104, 185–228. [Google Scholar] [CrossRef]
  12. Peña-Arancibia, J.L.; Bruijnzeel, L.A.; Mulligan, M.; van Dijk, A.I. Forests as ‘sponges’ and ‘pumps’: Assessing the impact of deforestation on dry-season flows across the tropics. J. Hydrol. 2019, 574, 946–963. [Google Scholar] [CrossRef]
  13. Wiersum, K.F. Effects of various vegetation layers of an Acacia auriculiformis forest plantation on surface erosion in Java, Indonesia. In Soil Erosion and Conservation; El-Swaify, S.A., Moldenhauer, W.C., Lo, A., Eds.; John Wiley & Sons: Hoboken, NJ, USA, 1985; pp. 79–89. [Google Scholar]
  14. Hairiah, K.; Suprayogo, D.; Widianto, B.; Suhara, E.; Mardiastuning, A.; Widodo, R.H.; Prayogo, C.; Rahayu, S. Forests conversion into agricultural land: Litter thickness, earthworm populations and soil macro-porosity. Agrivita 2004, 26, 68–80. [Google Scholar]
  15. Suprayogo, D.; Widianto, K.; Hairiah, I.N. Watershed Management: Hydrological Consequences of Land Use Change during Development; Universitas Brawijaya Press: Malang, Indonesia, 2017. [Google Scholar]
  16. Creed, I.F.; van Noordwijk, M. Forest and Water on a Changing Planet: Vulnerability, Adaptation and Governance Opportunities; A Global Assessment Report. World Series Volume 38; IUFRO: Vienna, Austria, 2018. [Google Scholar]
  17. Jones, J.A.; Wei, X.; Archer, E.; Bishop, K.; Blanco, J.A.; Ellison, D.; Gush, M.; McNulty, S.G.; van Noordwijk, M.; Creed, I.F. Forest-Water Interactions under Global Change. In Forest-Water Interactions; Ecological Studies 240; Levia, D.F., Carlyle-Moses, D.E., Michalzik, B., Nanko, K., Tischer, A., Eds.; Springer Nature: Picassopl, Switzerland, 2020; pp. 589–624. [Google Scholar] [CrossRef]
  18. Liu, Y.; Cui, Z.; Huang, Z.; Miao, H.T.; Wu, G.L. The influence of litter crusts on soil properties and hydrological processes in a sandy ecosystem. Hydrol. Earth Syst. Sci. 2019, 23, 2481–2490. [Google Scholar] [CrossRef] [Green Version]
  19. Zhang, J.; van Meerveld, H.I.; Tripoli, R.; Bruijnzeel, L.A. Runoff response and sediment yield of a landslide-affected fire-climax grassland micro-catchment (Leyte, the Philippines) before and after passage of typhoon Haiyan. J. Hydrol. 2018, 565, 524–537. [Google Scholar] [CrossRef]
  20. Zhang, J.; Bruijnzeel, L.A.; Quiñones, C.M.; Tripoli, R.; Asio, V.B.; van Meerveld, H.J. Soil physical characteristics of a degraded tropical grassland and a ‘reforest’: Implications for runoff generation. Geoderma 2019, 333, 163–177. [Google Scholar] [CrossRef]
  21. Van Noordwijk, M.; Lawson, G.; Hairiah, K.; Wilson, J. Root distribution of trees and crops: Competition and/or complementarity. In Tree–Crop Interactions: Agroforestry in a Changing Climate; CABI: Wallingford, UK, 2015; pp. 221–257. [Google Scholar]
  22. Ellison, D.; Morris, C.E.; Locatelli, B.; Sheil, D.; Cohen, J.; Murdiyarso, D.; Gutierrez, V.; van Noordwijk, M.; Creed, I.F.; Pokorny, J. Trees, forests and water: Cool insights for a hot world. Glob. Environ. Chang. 2017, 43, 51–61. [Google Scholar] [CrossRef]
  23. Ellison, D.; Wang-Erlandsson, L.; van der Ent, R.J.; van Noordwijk, M. Upwind forests: Managing moisture recycling for nature-based resilience. Unasylva 2019, 251, 13–26. [Google Scholar]
  24. Van Noordwijk, M.; Tanika, L.; Lusiana, B. Flood risk reduction and flow buffering as ecosystem services—Part 1: Theory on flow persistence, flashiness and base flow. Hydrol. Earth Syst. Sci. 2017, 21, 2321–2340. [Google Scholar] [CrossRef] [Green Version]
  25. Shannon, P.D.; Swanston, C.W.; Janowiak, M.K.; Handler, S.D.; Schmitt, K.M.; Brandt, L.A.; Butler-Leopold, P.R.; Ontl, T. Adaptation strategies and approaches for forested watersheds. Rev. Artic. Clim. Serv. 2019, 13, 51–64. [Google Scholar] [CrossRef]
  26. Van Noordwijk, M.; Tanika, L.; Lusiana, B. Flood risk reduction and flow buffering as ecosystem services—Part 2: Land use and rainfall intensity effects in Southeast Asia. Hydrol. Earth Syst. Sci. 2017, 21, 2341–2360. [Google Scholar] [CrossRef] [Green Version]
  27. Coster, C. Wortelstudien in de tropen. V. Gebergtehoutsoorten [Root studies in the Tropics. V. Tree species of the mountain region]. Tectona 1935, 28, 861–878. [Google Scholar]
  28. Coster, C. De verdamping van verschillende vegetatievormen op Java [The transpiration of different types of vegetation in Java]. Tectona 1937, 30, 1–124. [Google Scholar]
  29. Gonggrijp, L. De verdamping van gebergtebosch in West Java op 1750–200 m zeehoogte [The transpiration of mountain forest in West Java at an elevation of 1750–2000 m above sea level]. Tectona 1941, 34, 437–447. [Google Scholar]
  30. Galudra, G.; Sirait, M. A discourse on Dutch colonial forest policy and science in Indonesia at the beginning of the 20th century. Int. For. Rev. 2009, 11, 524–533. [Google Scholar] [CrossRef]
  31. Government of Indonesia. Law (Undang-Undang) Number 26 Year 2007 about Spatial Planning; Government of Indonesia: Pemerintah, Indonesia, 2007.
  32. Van Noordwijk, M.; Creed, I.F.; Jones, J.A.; Wei, X.; Gush, M.; Blanco, J.A.; Sullivan, C.A.; Bishop, K.; Murdiyarso, D.; Xu, J.; et al. Climate-forest-water-people relations: Seven system delineations. In Forest and Water on a Changing Planet: Vulnerability, Adaptation and Governance Opportunities: A Global Assessment Report (No. 38); International Union of Forest Research Organizations (IUFRO): Vienna, Austria, 2018; pp. 27–58. [Google Scholar]
  33. Van Noordwijk, M.; Ekadinata, A.; Leimona, B.; Catacutan, D.; Martini, E.; Tata, H.L.; Öborn, I.; Hairiah, K.; Wangpakapattanawong, P.; Mulia, R.; et al. Agroforestry options for degraded landscapes in Southeast Asia. In Agroforestry for Degraded Landscapes: Recent Advances and Emerging Challenges; Dagar, J.C., Gupta, S.R., Teketay, D., Eds.; Springer: Singapore, 2020. [Google Scholar]
  34. Sajikumar, N.; Remya, R.S. Impact of land cover and land use change on runoff characteristics. J. Environ. Manag. 2015, 161, 460–468. [Google Scholar] [CrossRef] [PubMed]
  35. Anache, J.A.; Wendland, E.C.; Oliveira, P.T.; Flanagan, D.C.; Nearing, M.A. Runoff and soil erosion plot-scale studies under natural rainfall: A meta-analysis of the Brazilian experience. Catena 2017, 152, 29–39. [Google Scholar] [CrossRef]
  36. USGS. Landsat 8 OLI (2019-10-18 (6, 53). U.S. Geological Survey. 2019. Available online: https://earthexplorer.usgs.gov/ (accessed on 9 June 2020).
  37. Wischmeier, W.H. The USLE: Some reflections. J. Soil Water Conserv. 1984, 39, 105–107. [Google Scholar]
  38. Hairsine, P.B.; Rosem, C.W. Modeling water erosion due to overland flow using physical principles: 1. Sheet flow. Water Resour. Res. 1992, 28, 237–243. [Google Scholar] [CrossRef]
  39. Van Noordwijk, M.; van Roode, M.; McCallie, E.L.; Cadisch, G. Erosion and sedimentation as multiscale, fractal processes: Implications for models, experiments and the real world. In Soil Erosion at Multiple Scales, Principles and Methods for Assessing Causes and Impacts; Penning de Vries, F., Agus, F., Kerr, J., Eds.; CAB International: Wallingford, UK, 1998; pp. 223–253. [Google Scholar]
  40. Knox County Tennessee. Stormwater Management Manual, Section on the Rational Method, Volume 2 Technical Guidance. Available online: https://dec.alaska.gov/water/wastewater/stormwater/swppp-dev-runoff-coefficient-values-rm (accessed on 26 April 2020).
  41. Widianto, D.S.; Noveras, H.; Widodo, R.H.; Purnomosidhi, P.; van Noordwijk, M. Alih guna lahan hutan menjadi lahan pertanian: Apakah fungsi hidrologis hutan dapat digantikan sistem kopi monokultur? Agrivita 2004, 26, 47–52. [Google Scholar]
  42. Gee, G.W.; Bauder, J.W. Particle Size Analysis. In Methods of Soil Analysis Part 1, Physical and Mineralogical Methods, 2nd ed.; Klute, A., Ed.; American Society of Agronomy: Madison, WI, USA, 1986; Volume 9, pp. 383–411. [Google Scholar]
  43. Blake, G.R.; Hartge, K.H. Bulk density. In Methods of Soil Analysis. Part I: Physical and Mineralogical Methods; Klute, A.K., Ed.; American Society of Agronomy—Soil Science Society of America: Madison, WI, USA, 1986; pp. 363–375. [Google Scholar]
  44. Nimmo, J.R. Porosity and pore size distribution. In Encyclopedia of Soils in the Environment; Hillel, D., Ed.; Elsevier: London, UK, 2004; pp. 295–303. [Google Scholar]
  45. Walkley, A.; Black, I.A. An examination of the Degtjareff method for determining soil organic matter, and a proposed modification of the chromic acid titration method. Soil Sci. 1934, 37, 29–38. [Google Scholar] [CrossRef]
  46. Bouwer, H. Intake rate: Cylinder infiltrometer. In Methods of Soil Analysis; Klute, A., Ed.; ASA Monograph 9; ASA: Madison, WI, USA, 1986; pp. 825–843. [Google Scholar]
  47. Jennings, S.B.; Brown, N.D.; Sheil, D. Assessing forest canopies and understorey illumination: Canopy closure, canopy cover and other measures. Forestry 1999, 72, 59–73. [Google Scholar] [CrossRef]
  48. Hairiah, K.; Ekadinata, A.; Sari, R.R.; Rahayu, S. Measurement of Carbon Stock: From land level to landscape. In Practical Instructions, 2nd ed.; Bogor, World Agroforestry Centre, ICRAF SEA Regional Office, University of Brawijaya (UB): Malang, Indonesia, 2011; p. 110. Available online: http://apps.worldagroforestry.org/sea/Publications/files/manual/MN0049-11.pdf (accessed on 10 April 2020).
  49. Hoechsteetter, S.; Walz, U.; Dang, L.H.; Thinh, N.X. Effect of Topography and Surface Roughness in Analyses of Landscape Structure—A Proposal Modify the Existing Set of Landscape Metrics. Landsc. Online 2008, 3, 1–14. Available online: https://gfzpublic.gfz-potsdam.de/pubman/item/item_32854 (accessed on 10 April 2020). [CrossRef]
  50. Landon, J.R. Booker Tropical Soil Manual: A Handbook for Soil Survey and Agricultural Land Evaluation in the Tropics and Subtropics; Routledge: Abingdon, UK, 2014. [Google Scholar]
  51. Gifford, G.F.; Hawkins, R.H. Hydrologic impact of grazing on infiltration: A critical review. Water Resour. Res. 1978, 14, 305–313. [Google Scholar] [CrossRef]
  52. Widianto, D.S.; Purnomosidhi, P.; Widodo, R.H.; Rusiana, F.; ZAini, Z.; Khasanah, N.; Kusuma, Z. Degradasi sifat fisik tanah sebagai akibat alih guna lahan hutan menjadi sistem kopi monokultur: Kajian perubahan makroporositas tanah. Agrivita 2004, 26, 60–67. [Google Scholar]
  53. Neris, J.; Jiménez, C.; Fuentes, J.; Morillas, G.; Tejedor, M. Vegetation and land-use effects on soil properties and water infiltration of Andisols in Tenerife (Canary Islands, Spain). Catena 2012, 98, 55–62. [Google Scholar] [CrossRef]
  54. Ma, Q.; Wang, J.; Zhu, S. Effects of precipitation, soil water content and soil crust on artificial Haloxylon Ammodendron forest. Acta Ecol. Sin. 2007, 27, 5057–5067. [Google Scholar] [CrossRef]
  55. Sun, D.; Yang, H.; Guan, D.; Yang, M.; Wu, J.; Yuan, F.; Jin, C.; Wang, A.; Zhang, Y. The effects of land use change on soil infiltration capacity in China: A meta-analysis. Sci. Total Environ. 2018, 626, 1394–1401. [Google Scholar] [CrossRef] [PubMed]
  56. Zimmermann, B.; Elsenbeer, H.; De Moraes, J.M. The influence of land-use changes on soil hydraulic properties: Implications for runoff generation. For. Ecol. Manag. 2006, 222, 29–38. [Google Scholar] [CrossRef]
  57. Dunkerley, D. A Review of the Effects of Throughfall and Stemflow on Soil Properties and Soil Erosion. In Precipitation Partitioning by Vegetation; Springer: Cham, Germany, 2020; pp. 183–214. [Google Scholar]
  58. Colloff, M.J.; Pullen, K.R.; Cunningham, S.A. Restoration of an ecosystem function to revegetation communities: The role of invertebrate macropores in enhancing soil water infiltration. Restor. Ecol. 2010, 18, 65–72. [Google Scholar] [CrossRef]
  59. Reid, K.D.; Wilcox, B.P.; Breshears, D.D.; MacDonald, L. Runoff and erosion in a pinon–juniper woodland: Influence of vegetation patches. Soil Sci. Soc. Am. J. 1999, 63, 313–325. [Google Scholar] [CrossRef] [Green Version]
  60. Bhark, E.W.; Small, E.E. Association between plant canopies and the spatial patterns of infiltration in shrubland and grassland of the Chihuahuan Desert, New Mexico. Ecosystems 2003, 6, 185–196. [Google Scholar] [CrossRef]
  61. Van Noordwijk, M.; Heinen, M.; Hairiah, K. Old tree root channels in acid soils in the humid tropics: Important for crop root penetration, water infiltration and nitrogen management. In Plant-Soil Interactions at Low pH; Springer: Dordrecht, The Netherlands, 1991; pp. 423–430. [Google Scholar]
  62. Wu, G.L.; Liu, Y.; Yang, Z.; Cui, Z.; Deng, L.; Chang, X.F.; Shi, Z.H. Root channels to indicate the increase in soil matrix water infiltration capacity of arid reclaimed mine soils. J. Hydrol. 2017, 546, 133–139. [Google Scholar] [CrossRef]
  63. Zwartendijk, B.W.; Van Meerveld, H.J.; Ghimire, C.P.; Bruijnzeel, L.A.; Ravelona, M.; Jones, J.P.G. Rebuilding soil hydrological functioning after swidden agriculture in eastern Madagascar. Agric. Ecosyst. Environ. 2017, 239, 101–111. [Google Scholar] [CrossRef] [Green Version]
  64. Van Meerveld, H.J.; Zhang, J.; Tripoli, R.; Bruijnzeel, L.A. Effects of reforestation of a degraded Imperata grassland on dominant flow pathways and streamflow responses in Leyte, the Philippines. Water Resour. Res. 2019, 55, 4128–4148. [Google Scholar] [CrossRef]
  65. Sanchez, P.A. Properties and Management of Soils in the Tropics; Cambridge University Press: Cambridge, UK, 2019. [Google Scholar]
  66. Mwendera, E.J.; Saleem, M.M. Infiltration rates, surface runoff, and soil loss as influenced by grazing pressure in the Ethiopian highlands. Soil Use Manag. 1997, 13, 29–35. [Google Scholar] [CrossRef]
  67. Martens, D.A.; Frankenberger, W.T. Modification of Infiltration Rates in an Organic-Amended Irrigated. Agron. J. 1992, 84, 707–717. [Google Scholar] [CrossRef]
  68. Osuji, G.E.; Okon, M.A.; Chukwuma, M.C.; Nwarie, I.I. Infiltration characteristics of soils under selected land use practices in Owerri, Southeastern Nigeria. World J. Agric. Sci. 2010, 6, 322–326. [Google Scholar]
  69. Bons, C.A. Accelerated erosion due to clearcutting of plantation forest and subsequent Taungya cultivation in upland West Java, Indonesia. Int. Assoc. Hydrol. Sci. Publ. 1990, 192, 279–288. [Google Scholar]
  70. Rijsdijk, A.; Bruijnzeel, L.S.; Sutoto, C.K. Runoff and sediment yield from rural roads, trails and settlements in the upper Konto catchment, East Java, Indonesia. Geomorphology 2007, 87, 28–37. [Google Scholar] [CrossRef]
  71. Purwanto, E.; Bruijnzeel, L.A. Soil conservation on rainfed bench terraces in upland West Java, Indonesia: Towards a new paradigm. In Advances in Geoecology; Catena: Reiskirchen, Germany, 1998; pp. 1267–1274. [Google Scholar]
  72. Van Dijk, A.I.J.M.; Bruijnzeel, L.A.; Wiegman, S.E. Measurements of rain splash on bench terraces in a humid tropical steepland environment. Hydrol. Process. 2003, 17, 513–535. [Google Scholar] [CrossRef]
  73. Marin, C.T.; Bouten, W.; Sevink, J. Gross rainfall and its partitioning into throughfall, stemflow and evaporation of intercepted water in four forest ecosystems in western Amazonia. J. Hydrol. 2000, 237, 40–57. [Google Scholar] [CrossRef]
  74. Holwerda, F.; Scatena, F.N.; Bruijnzeel, L.A. Throughfall in a Puerto Rican lower montane rain forest: A comparison of sampling strategies. J. Hydrol. 2006, 327, 592–602. [Google Scholar] [CrossRef]
  75. Klos, P.Z.; Chain-Guadarrama, A.; Link, T.E.; Finegan, B.; Vierling, L.A.; Chazdon, R. Throughfall heterogeneity in tropical forested landscapes as a focal mechanism for deep percolation. J. Hydrol. 2014, 519, 2180–2188. [Google Scholar] [CrossRef]
  76. Muzylo, A.; Llorens, P.; Valente, F.; Keizer, J.J.; Domingo, F.; Gash, J.H.C. A review of rainfall interception modelling. J. Hydrol. 2009, 370, 191–206. [Google Scholar] [CrossRef] [Green Version]
  77. Van Stan, J.T.; Lewis, E.S.; Hildebrandt, A.; Rebmann, C.; Friesen, J. Impact of interacting bark structure and rainfall conditions on stemflow variability in a temperate beech-oak forest, central Germany. Hydrol. Sci. J. 2016, 61, 2071–2083. [Google Scholar] [CrossRef] [Green Version]
  78. Friesen, P.; Park, A.; Sarmiento-Serrud, A.A. Comparing rainfall interception in plantation trials of six tropical hardwood trees and wild sugar cane Saccharum spontaneum L. Ecohydrology 2013, 6, 765–774. [Google Scholar]
  79. Taniguchi, M.; Tsujimura, M.; Tanaka, T. Significance of stemflow in groundwater recharge. 1: Evaluation of the stemflow contribution to recharge using a mass balance approach. Hydrol. Process. 1996, 10, 71–80. [Google Scholar] [CrossRef]
  80. Cattan, P.; Bussière, F.; Nouvellon, A. Evidence of large rainfall partitioning patterns by banana and impact on surface runoff generation. Hydrol. Process. 2007, 21, 2196–2205. [Google Scholar] [CrossRef]
  81. Siles, P.; Vaast, P.; Dreyer, E.; Harmand, J.M. Rainfall partitioning into throughfall, stemflow and interception loss in a coffee (Coffea arabica L.) monoculture compared to an agroforestry system with Inga densiflora. J. Hydrol. 2010, 395, 39–48. [Google Scholar] [CrossRef] [Green Version]
  82. Niether, W.; Armengot, L.; Andres, C.; Schneider, M.; Gerold, G. Shade trees and tree pruning alter throughfall and microclimate in cocoa (Theobroma cacao L.) production systems. Ann. For. Sci. 2018, 75, 38. [Google Scholar] [CrossRef] [Green Version]
  83. Bruijnzeel, L.A.; Wiersum, K.F. Rainfall interception by a young Acacia auriculiformis (A. Cunn) plantation forest in west Java, Indonesia: Application of Gash’s analytical model. Hydrol. Process. 1987, 1, 309–319. [Google Scholar] [CrossRef]
  84. de Almeida, W.S.; Panachuki, E.; de Oliveira, P.T.S.; da Silva Menezes, R.; Sobrinho, T.A.; de Carvalho, D.F. Effect of soil tillage and vegetal cover on soil water infiltration. Soil Tillage Res. 2018, 175, 130–138. [Google Scholar] [CrossRef]
  85. Toohey, R.C.; Boll, J.; Brooks, E.S.; Jones, J.R. Effects of land use on soil properties and hydrological processes at the point, plot, and catchment scale in volcanic soils near Turrialba, Costa Rica. Geoderma 2018, 315, 138–148. [Google Scholar] [CrossRef]
  86. Nespoulous, J.; Merino-Martin, L.; Monnier, Y.; Bouchet, D.C.; Ramel, M.; Dombey, R.; Viennois, G.; Mao, Z.; Zhang, J.L.; Cao, K.F.; et al. Tropical forest structure and understorey determine subsurface flow through biopores formed by plant roots. Catena 2019, 181, 104061. [Google Scholar] [CrossRef]
  87. Johnson, M.S.; Lehmann., J. Double-Funneling of trees: Stemflow and root-induced preferential flow. Ecoscience 2006, 13, 324–333. [Google Scholar] [CrossRef]
  88. Gonzalez-Ollauri, A.; Stokes, A.; Mickovski, S.B. A novel framework to study the effect of tree architectural traits on stemflow yield and its consequences for soil-water dynamics. J. Hydrol. 2020, 582, 124448. [Google Scholar] [CrossRef]
  89. Liang, W.L. Effects of Stemflow on Soil Water Dynamics in Forest Stands. In Forest-Water Interactions; Springer: Cham, Germany, 2020; pp. 349–370. [Google Scholar]
  90. Badu, M.; Nuberg, I.; Ghimire, C.P.; Bajracharya, R.M.; Meyer, W.S. Negative Trade-Offs between Community Forest Use and Hydrological Benefits in the Forested Catchments of Nepal’s Mid-hills. Mt. Res. Dev. 2020, 39, 822–832. [Google Scholar] [CrossRef]
  91. Li, X.; Niu, J.; Xie, B. The Effect of Leaf Litter Cover on Surface Runoff and Soil Erosion in Northern China. PLoS ONE 2014, 9, e107789. [Google Scholar] [CrossRef] [Green Version]
  92. Hairiah, K.; Sulistyani, H.; Suprayogo, D.; Purnomosidhi, P.; Widodo, R.H.; Van Noordwijk, M. Litter layer residence time in forest and coffee agroforestry systems in Sumberjaya, West Lampung. For. Ecol. Manag. 2006, 224, 45–57. [Google Scholar] [CrossRef]
  93. Derpsch, R.; Franzluebbers, A.J.; Duiker, S.W.; Reicosky, D.C.; Koeller, K.; Friedrich, T.; Sturny, W.G.; Sá, J.C.M.; Weiss, K. Why do we need to standardize no-tillage research? Soil Tillage Res. 2014, 137, 16–22. [Google Scholar] [CrossRef]
  94. Stomph, T.J.; De Ridder, N.; Steenhuis, T.S.; Van de Giesen, N.C. Scale effects of Hortonian overland flow and rainfall-runoff dynamics: Laboratory validation of a process-based model. Earth Surf. Process. Landf. 2002, 27, 847–855. [Google Scholar] [CrossRef]
  95. Gomi, T.; Sidle, R.C.; Miyata, S.; Kosugi, K.I.; Onda, Y. Dynamic runoff connectivity of overland flow on steep forested hillslopes: Scale effects and runoff transfer. Water Resour. Res. 2008, 44, 1–16. [Google Scholar] [CrossRef]
  96. Moreno-de las Heras, M.; Nicolau, J.M.; Merino-Martín, L.; Wilcox, B.P. Plot-Scale effects on runoff and erosion along a slope degradation gradient. Water Resour. Res. 2010, 46, 1–12. [Google Scholar] [CrossRef] [Green Version]
  97. Rodenburg, J.; Stein, A.; van Noordwijk, M.; Ketterings, Q.M. Spatial variability of soil pH and phosphorus in relation to soil run-off following slash-and-burn land clearing in Sumatra, Indonesia. Soil Tillage Res. 2003, 71, 1–14. [Google Scholar] [CrossRef]
  98. Pradiko, H.; Soewondo, P.; Suryadi, Y. The change of hydrological regime in upper Cikapundung Watershed, West Java Indonesia. Procedia Eng. 2015, 125, 229–235. [Google Scholar] [CrossRef] [Green Version]
  99. Nurhayati, S.A.; Sabar, A.; Marselina, M. The effect of land use changes to discharge extremities in Cimahi Watershed–Upper Citarum Watershed, West Java. In E3S Web of Conferences; EDP Sciences: Ulis, France, 2020; Volume 148, p. 07002. [Google Scholar]
  100. Beven, K. Searching for the Holy Grail of scientific hydrology: Q t=(S, R,? t) a as closure. Hydrol. Earth Syst. Sci. Discuss. 2006, 10, 609–618. [Google Scholar] [CrossRef] [Green Version]
  101. Graham, C.B.; Van Verseveld, W.; Barnard, H.R.; McDonnell, J.J. Estimating the deep seepage component of the hillslope and catchment water balance within a measurement uncertainty framework. Hydrol. Process. 2010, 24, 3631–3647. [Google Scholar] [CrossRef]
  102. Government of Indonesia. Law (Undang-Undang) Number 41 Year 1999 about Forestry; Government of Indonesia: Pemerintah, Indonesia, 1999.
  103. Bruijnzeel, L.A. Evaluation of runoff sources in a forested basin in a wet monsoonal environment: A combined hydrological and hydrochemical approach. Hydrol. Humid Trop. Reg. IAHS Publ. 1983, 140. [Google Scholar]
  104. Verbist, B.; Poesen, J.; van Noordwijk, M.; Suprayogo, D.; Agus, F.; Deckers, J. Factors affecting soil loss at plot scale and sediment yield at catchment scale in a tropical volcanic agroforestry landscape. Catena 2010, 80, 34–46. [Google Scholar] [CrossRef]
  105. Tanika, L.; Khasanah, N.; Leimona, B. Simulasi Dampak Perubahan Tutupan Lahan Terhadap Neraca Air Di Das Dan Sub-Das Rejoso Menggunakan Model. Genriver; Report; World Agroforestry Centre (ICRAF) Southeast Asia Regional Program: Bogor, Indonesia, 2018. [Google Scholar]
  106. Ridwansyah, I.; Pawitan, H.; Sinukaban, N.; Hidayat, Y. Watershed Modeling with ArcSWAT and SUFI2 in Cisadane Catchment Area: Calibration and Validation of River Flow Prediction. Int. J. Sci. Eng. 2014, 6, 92–101. [Google Scholar] [CrossRef] [Green Version]
  107. Liu, Z.; Ma, D.; Hu, W.; Li, X. Land use dependent variation of soil water infiltration characteristics and their scale-specific controls. Soil Tillage Res. 2018, 178, 139–149. [Google Scholar] [CrossRef]
  108. Zhao, Y.; Wang, Y.; Wang, L.; Zhang, X.; Yu, Y.; Zhao, J.; Lin, H.; Chen, Y.; Zhou, W.; An, Z. Exploring the role of land restoration in the spatial patterns of deep soil water at watershed scales. Catena 2019, 172, 387–396. [Google Scholar] [CrossRef]
Figure 1. A. Position of the Rejoso Watershed in East Java as part of the Indonesian archipelago in Southeast Asia. B. The Rejoso Watershed from upstream (at the bottom) to sea level and land uses considered to be a hydrological threat; purple indicates open soil, green tree cover (base map in [36]).
Land 09 00240 g001
Figure 2. Monthly rainfall distribution in the Rejoso Watershed from the average of 24 years of rain events (1990–2013) in the (a) upstream (Tutur Rainfall Station) and (b) midstream (Wonosari Rainfall Station).
Land 09 00240 g002
Figure 3. Runoff and soil erosion plot design.
Land 09 00240 g003
Figure 4. Distribution of rainfall during observation starting on March 03, 2017 in the Rejoso Watershed.
Land 09 00240 g004
Figure 5. The throughfall/rainfall ratio variability in measured runoff plots (a) upstream, (b) midstream.
Land 09 00240 g005
Figure 6. Soil infiltration rate measured using a double-ring infiltrometer (n = 6).
Land 09 00240 g006
Figure 7. The relationship between surface runoff/rainfall ratio and the amount of rainfall in production forest and agroforestry systems in (a) the upstream Rejoso Watershed, under (a.1) 55% canopy cover of pine-based old production forest, (a.2) 40% canopy cover of pine-based young production forest, (a.3) 5% canopy cover of Casuarina-based agroforestry with cabbage crop, (a.4) 0% tree canopy cover of arable land (maize crop); (b) the midstream Rejoso Watershed under (b.1) 87 % canopy cover of pine/mahogany-based old production forest, (b.2) 75% canopy cover of coffee-based agroforestry, (b.3) 52% canopy cover of clove-based agroforestry, (b.4) 26% canopy cover of mixed tree and crop-based agroforestry.
Land 09 00240 g007
Figure 8. Soil erosion in relation to daily rainfall rates in production forest and agroforestry in (a) the upstream Rejoso Watershed, under (a.1) 55% canopy cover of Pine-based old production forest, (a.2) 40% canopy cover of pine-based young production forest, (a.3) 5% canopy cover of Casuarina-based agroforestry with cabbage crop, (a.4) 0% tree canopy cover of arable land (maize crop); (b) the midstream Rejoso Watershed under (b.1) 87% canopy cover of pine/mahogany-based old production forest, (b.2) 75% canopy cover of coffee-based agroforestry, (b.3) 52% canopy cover of clove-based agroforestry, (b.4) 26% canopy cover of mixed tree and crop-based agroforestry.
Land 09 00240 g008
Figure 9. The runoff/rainfall ratio as a function of tree canopy cover, understory vegetation, litter necromass, and land surface roughness in the (a): upstream, (b): midstream.
Land 09 00240 g009
Figure 10. Soil erosion in relation to tree canopy cover, understory vegetation, litter necromass, and land surface roughness in the (a): upstream, (b): midstream.
Land 09 00240 g010
Figure 11. Comparison of canopy effects on throughfall in the two zones (A) and the relationship between erosion and surface runoff for the two soil types (B).
Land 09 00240 g011
Table 1. Land use, vegetation, soil conservation measure, and slope of measurement plots.
CodeLand UseVegetation (the Average Height of Trees) TerracingSlope (Plot Level, %)
Upstream Rejoso Watershed
UT1Old production forestPine (Pinus merkusii) (34 m) + grassNone35–40
UT2Young production forestPine (11 m) + grassNone50–60
UT3AgroforestryStrip cemara (Casuarina junghuniana) (13 m) + cabbageNone40–50
UT4Arable landBanana, maize, carrotNone40–50
Midstream Rejoso Watershed
MT1Old production forestMixed pine (28 m) or mahogany (Swietenia macrophylla) (12 m), banana, salak (Salacca zalacca), taro (Colocasia esculenta), elephant grass (Miscanthus giganteus).Bench terrace sloping outward3–8
MT2AgroforestryCoffee-based (2 m) mix with durian (Durio zibethinus) (10 m), mahogany (9 m), Leucaena leucocephala (8 m), Paraserianthes falcataria (11 m), Albizia saman (11 m), dadap (Erythrina variegata) (11 m), bananaBench terrace sloping outward3–8
MT3AgroforestryClove (Syzygium aromaticum) (8 m), bananaBench terrace sloping outward3–8
MT4AgroforestryMango (Mangifera indica) (10 m), durian (10 m), Randu kapuk (Ceiba pentandra) (11 m), maize, cassava, groundnut Bench terrace sloping outward3–8
Table 2. Bulk density, particle density, soil porosity, macro-porosity, and organic C of runoff plots.
Location Code
at Soil Depth (cm)
Bulk Density
(g cm−3) *
Particle Density (g cm−3) *Soil Porosity (%) *Soil Macro- Porosity (%)Corg (%) *
0–1010–2020–300–1010–2020–300–1010–2020–300–1010–2020–300–1010–2020–30
Upstream Rejoso Watershed: Andisols
UT10.87a0.81a0.83a2.16a2.23a2.31a60a63a64c8.0b5.2b0.9a2.05bc1.61c1.79b
UT20.85a0.86a0.82a2.27a2.30a2.33a63a63a65c5.1ab1.5a0.3a2.46c1.56bc1.78b
UT30.81a0.84a0.85a2.14a2.12a2.28a62a60a63b4.7ab2.1ab1.4a1.17a0.58a0.71a
UT40.84a0.88a0.84a2.28a2.29a2.08a63a62a60a3.0a0.3a0.1a1.35ab1.06ab0.92a
LSD0.070.130.120.170.210.384513.523.41.80.850.500.50
Midstream Rejoso Watershed: Inceptisols
MT10.83a0.85a0.83a2.20a2.28a2.20a62c63a62b13.6ab7.0bc2.5c1.73a1.87a1.65b
MT20.96b0.91a0.91a2.42b2.38a2.21a60bc62a59ab16.1b8.3c1.8bc2.22a1.59a1.84b
MT31.03bc0.96a0.94ab2.38b2.36a2.40a57ab59a61b11.7a3.4ab0.9ab2.19a1.61a1.01a
MT41.09c1.04a1.04b2.38b2.33a2.33a54a55a55a11.4a0.8a0a1.71a1.36a1.12a
LSD0.100.240.110.150.170.2241044.03.91.00.840.540.41
* The same letter indicates no statistically significant differences between locations with Fisher’s Least Significant Differences (LSD) test (p < 0.05).
Table 3. Canopy cover, understory vegetation, litter necromass, and soil roughness of the sample plots.
CodeLand CoverTree Canopy Cover (%) *Understory Vegetation (Mg ha−1) *Litter (Mg ha−1) *Soil Roughness (%) *
Upstream Rejoso Watershed
UT1Old production forest55b10.1b9.2b8.5a
UT2Young production forest40b10.5b 2.0a7.0a
UT3Agroforestry4a10.1b2.1a9.5a
UT4Arable land0a3.7a0.3a7.7a
LSD 155.63.74.6
Midstream Rejoso Watershed
MT1Old Production Forest87c2.5a9.8b7.6b
MT2Agroforestry75c2.5a4.8a5.4ab
MT3Agroforestry52b2.1a5.2a2.8a
MT4Agroforestry26a1.3a3.5a2.0a
LSD 142.62.44.5
* The same letter indicates no statistically significant differences between locations with Fisher’s LSD test (p < 0.05).
Table 4. Rainfall, runoff, ratio runoff/rainfall, and soil erosion in the runoff plots in each land cover type.
CodeLand CoverRainfall (mm)Runoff (mm) *Runoff/Rainfall Ratio *Runoff/Throughfall Ratio *Soil Erosion (Mg ha−1) *
Upstream Rejoso Watershed
UT1Old production forest555 14.3a0.03a0.04a 5.86a
UT2Young production forest49213.2a0.03a0.03a1.47a
UT3Agroforestry476203.3b0.43b 0.56c120.98b
UT4Arable land556225.7b0.41b0.43b163.22b
LSD 46.30.090.1187
Midstream Rejoso Watershed
MT1Old Production Forest61680.2a0.13a0.16a3.07a
MT2Agroforestry841316.3c0.38b0.48b2.88a
MT3Agroforestry616228.8b0.37b0.46b6.63ab
MT4Agroforestry541344.9c0.64c0.66c10.33b
LSD 86.60.120.124.22
* The same letter indicates no statistically significant differences between locations with Fisher’s LSD test (p < 0.05).

