Article

Coastal Typology: An Analysis of the Spatiotemporal Relationship between Socioeconomic Development and Shoreline Change

1
Department of Geography, Environment, and Spatial Sciences, Michigan State University, East Lansing, MI 48823, USA
2
Remote Sensing and GIS Research and Outreach Services, Michigan State University, East Lansing, MI 48823, USA
*
Author to whom correspondence should be addressed.
Land 2020, 9(7), 218; https://doi.org/10.3390/land9070218
Submission received: 20 April 2020 / Revised: 30 June 2020 / Accepted: 1 July 2020 / Published: 4 July 2020
(This article belongs to the Section Soil-Sediment-Water Systems)

Abstract

:
Globally, coastal communities are impacted by hazards including storm events, rising water levels, and associated coastal erosion. These hazards destroy homes and infrastructure causing human and financial risks for communities. At the same time, the economic and governance capacity of these communities varies widely, impacting their ability to plan and adapt to hazards. In order to identify locations vulnerable to coastal hazards, knowledge of the physical coastal changes must be integrated with the socio-economic profiles of communities. To do this, we couple information about coastal erosion rates and economic data in communities along the Great Lakes to develop a typology that summarizes physical and economic vulnerability to coastal erosion. This typology classifies communities into one of four categories: (1) High physical and economic vulnerability to coastal erosion, (2) High physical but low economic vulnerability to coastal erosion, (3) Low physical and low economic vulnerability to coastal erosion, and (4) High economic but low physical vulnerability to coastal erosion. An analysis of this typology over three time periods (2005–2010), (2010–2014), and (2014–2018) reveals the dynamic nature of vulnerability over this fourteen year time span. Given this complexity, it can be difficult for managers and decision-makers to decide where to direct limited resources for coastal protection. Our typology provides an analytical tool to proactively address this challenge. Further, it advances existing work on coastal change and associated vulnerability in three ways. One, it implements a regional, analytical approach that moves beyond case study-oriented work and facilitates community analyses in a comparative context. Two, the typology provides an integrated assessment of vulnerability that considers economic vulnerability to coastal erosion, which is a contextual variable that compounds or helps mitigate vulnerability. Three, the typology facilitates community comparisons over time, which is important to identifying drivers of change in Great Lakes coastal communities over time and community efforts to mitigate and adapt to these hazards.

1. Introduction

Coastlines around the world are experiencing rapid and dramatic climatic and environmental changes. These changes are increasing physical and socio-economic vulnerability to coastal hazards [1]. In the United States, coastlines are typically associated with oceans, however, the Great Lakes region represents a significant portion of the country’s coastline, stretching 750 miles from east to west [2]. In total, the Great Lakes coastline stretches more than 4530 miles, which is slightly less than the 5090 miles of all other U.S coastlines combined (East Coast, Gulf Coast, and Pacific Coast) [3]. Like other coastal areas, Great Lakes shores experience coastal hazards including fluctuating water levels, storm waves and surges, and resulting beach, dune, and bluff erosion [4]. These hazards pose threats to the nearly 34 million people in the U.S. and Canada who rely on the lakes for many things including tourism, industrial and commercial activities, and drinking water [5,6]. In February of 2020, four of the five Great Lakes posted record setting lake levels [7,8].
Coastal erosion from rising water levels on the Great Lakes causes damage to homes and infrastructure [9,10,11]. Damage from rising lake levels and associated erosion costs taxpayers millions of dollars [12] and in 2020 the Michigan State Senate proposed a $300 million loan fund to help cities along the lakes combat flooding [7]. Given the multifaceted importance of the Great Lakes coastlines and the cost of associated natural hazards, it is imperative to characterize the vulnerability of communities to coastline changes through space and time. To achieve this goal, we develop a typology that serves as an analytical framework for characterizing and understanding the spatiotemporal vulnerability of coastal communities to erosion hazards. We explore this typology in the context of the Great Lakes region; however, it could be implemented in any coastal setting globally.
This typology advances existing work on coastal change and associated vulnerability in three ways. One, it implements a regional, analytical approach that moves beyond case study-oriented work and facilitates community analyses in a comparative context. Two, the typology provides an integrated assessment of vulnerability that considers economic vulnerability to coastal erosion, which is a contextual variable that compounds or helps mitigate vulnerability. Three, the typology facilitates community comparisons over time, which is important to identifying drivers of change in Great Lakes coastal communities and community efforts to mitigate and adapt to these hazards.

1.1. Physical Factors Impacting Coastal Vulnerability

Multiple factors make the Great Lakes a unique and challenging system to manage, however, four key physical attributes are commonly identified as primary drivers of these challenges. First, the Great Lakes are geologically young water bodies, thus their coastal zones are generally composed of a relatively uniform layer of highly erodible sand and loose gravel [13,14]. This surface and subsurface composition makes the landscape more vulnerable to storms and lake level fluctuations. Regions along the shoreline not vulnerable to erosion and coastline change, for the most part, are defined by bedrock exposure [15]. However, this geology is relatively limited in the region and mainly situated in the western portion of Lake Superior and the northwestern portion of Lake Michigan [13]. Thus, the majority of the Great Lakes coastlines are composed of unconsolidated sediments (e.g. sand silt, clay, and gravel) that are highly vulnerable to change. Second, regional scale storm events affect the lakes, exacerbating coastal erosion [16,17]. Storm-related hazards, such as storm surges and seiches influence water levels with variable spatiotemporal impacts. Third, the water levels across the system naturally oscillate on multiple time scales (e.g., seasons to centuries) in response to changing precipitation regimes and other hydrological variables such as groundwater flow evapotranspiration [3,18]. When lake levels are high, erosion and landward migration of shorelines can be rapid and high magnitude. Some recovery does occur when lake levels fall, but in most locations erosional loss during high lake phases is permanent. Finally, water levels across all of the Great Lakes are difficult to predict, on both short and long timescales. Across the geologic and instrumental records of Great Lakes water levels there are documented periods of high, low, and stable water levels [19]. For example, as recently as 10 years ago coastal vulnerability assessments for the Lake Michigan-Huron basin focused on low water levels and associated impacts. Now (2020), water levels are at record highs and erosion and coastal damage are occurring throughout the region [9,10,11].

1.2. Measurement and Monitoring of Coastal Change

Water level fluctuations in the Great Lakes region alter the vulnerability of the shoreline to erosion from storms and human disturbances [18,20]. When lake levels are high, erosion vulnerability is also high, but when lake level falls, the erosion vulnerability is lower. During these periods, other coastal challenges become more pressing, such as harbor shoaling which necessitates costly maintenance dredging. This temporal component of coastal vulnerability is important for identifying appropriate management actions at a given moment in time as well as for proactive future planning.
The standard practice for assessing coastal vulnerability is the use of static measurements over time. For example, the Michigan Department of Environment Great Lakes and Energy (EGLE) considers a shoreline as a High Risk Erosion Area (HREA) if the long-term average rate of recession (as defined by the landward edge of active erosion) is greater than 1 foot per year over a minimum period of 15 years [21]. These HREA sites are a regulatory boundary and the recession rates that drive the designation are also used to designate coastal setback distances for 30- and 60-year future time horizons [21]. These HREA sites are updated through time as new aerial imagery and other data are made available and provide a metric for designating coastal locations prone to erosion. However, they do not capture the temporal variability of changes in rates that are inherent in the Great Lakes region due to fluctuating water levels.
Coastal processes work at different spatial and temporal scales, resulting in varying geomorphic vulnerabilities that must be accounted for in planning and management decisions. Given the delineation of erosion risk based on long-term trends, assessed risk may not accurately reflect coastal vulnerability during a given year or even decade as the actual vulnerability could be greater due to elevated lake levels, or lower if lake levels are low.

1.3. Socioeconomic Risk Factors Impacting Coastal Vulnerability

Coastal vulnerability is usually reported based on physical conditions, but the socio-economic conditions play an equally important rule, particularly when it comes to the financial resources needed to recover from damages and implement hazard mitigation strategies. For example, areas with the same erosion risk may be impacted in entirely different ways based on their socio-economic conditions. Areas with low socio-economic population clusters and minimal financial resources are more vulnerable and may be disproportionally impacted by high rates of coastal retreat than areas with higher socio-economic population clusters and more financial resources [22].
Residents of coastal communities face multiple types of hazards that have direct impacts on their livelihoods including coastal flooding associated with rising water levels and damages related to storm events [23]. In addition to natural hazards, vulnerability can be enhanced in these communities due to their demographics, land use practices and level of socioeconomic development [24]. Along the Great Lakes, an increasing number of people could become vulnerable to natural hazards because the region is popular for residential and industrial development. There is a near constant demand for coastal property across the Great Lakes region stemming from development pressure because of the high economic and social value of coastal areas [25]. Uses for coastal land are highly varied with certain communities focusing on industrial activities whereas, others have seen increased levels of recreation and tourism over time [26].
Across the State of Michigan broad-scale coastal development is ongoing. This development and its impact on land uses means that many communities may need to intensify hazard mitigation planning. However, it is well documented that communities across the state also have different levels of preparedness to deal with coastal change and hazards [27]. On one end of the resilience spectrum there are communities with the funds, support, and capacity to engage groups to assist with management plans or to install coastal protection structures. Conversely, there are communities that have fewer resources and less community engagement and thus are more vulnerable to coastal hazards. Coastal management in the Great Lakes region, as is the case in all U.S. coastal states except Alaska, is implemented by states with assistance and guidance by the federal government (U.S. Coastal Zone Management Act). This allows states to focus on managing their own priorities and uses for the coastline as well as their unique hazards and vulnerabilities. It also means states must works towards developing a framework for balancing the environmental and socio-economic vulnerabilities of their communities in order to properly plan for and manage coastal hazards.

1.4. Research Motivation

The majority of coastal hazards research focuses on analyses of the physical characteristics of coastal vulnerability, with little reference to social and economic indicators [28,29]. Across the Great Lakes region, vulnerability studies also tend to focus on the environmental variables neglecting to mention or incorporate data on the critical social dimension [30]. In order to produce meaningful planning or policy information it has been shown that understanding the social and economic dimensions of vulnerability is key to developing effective hazard adaptation and mitigation strategies [31,32].
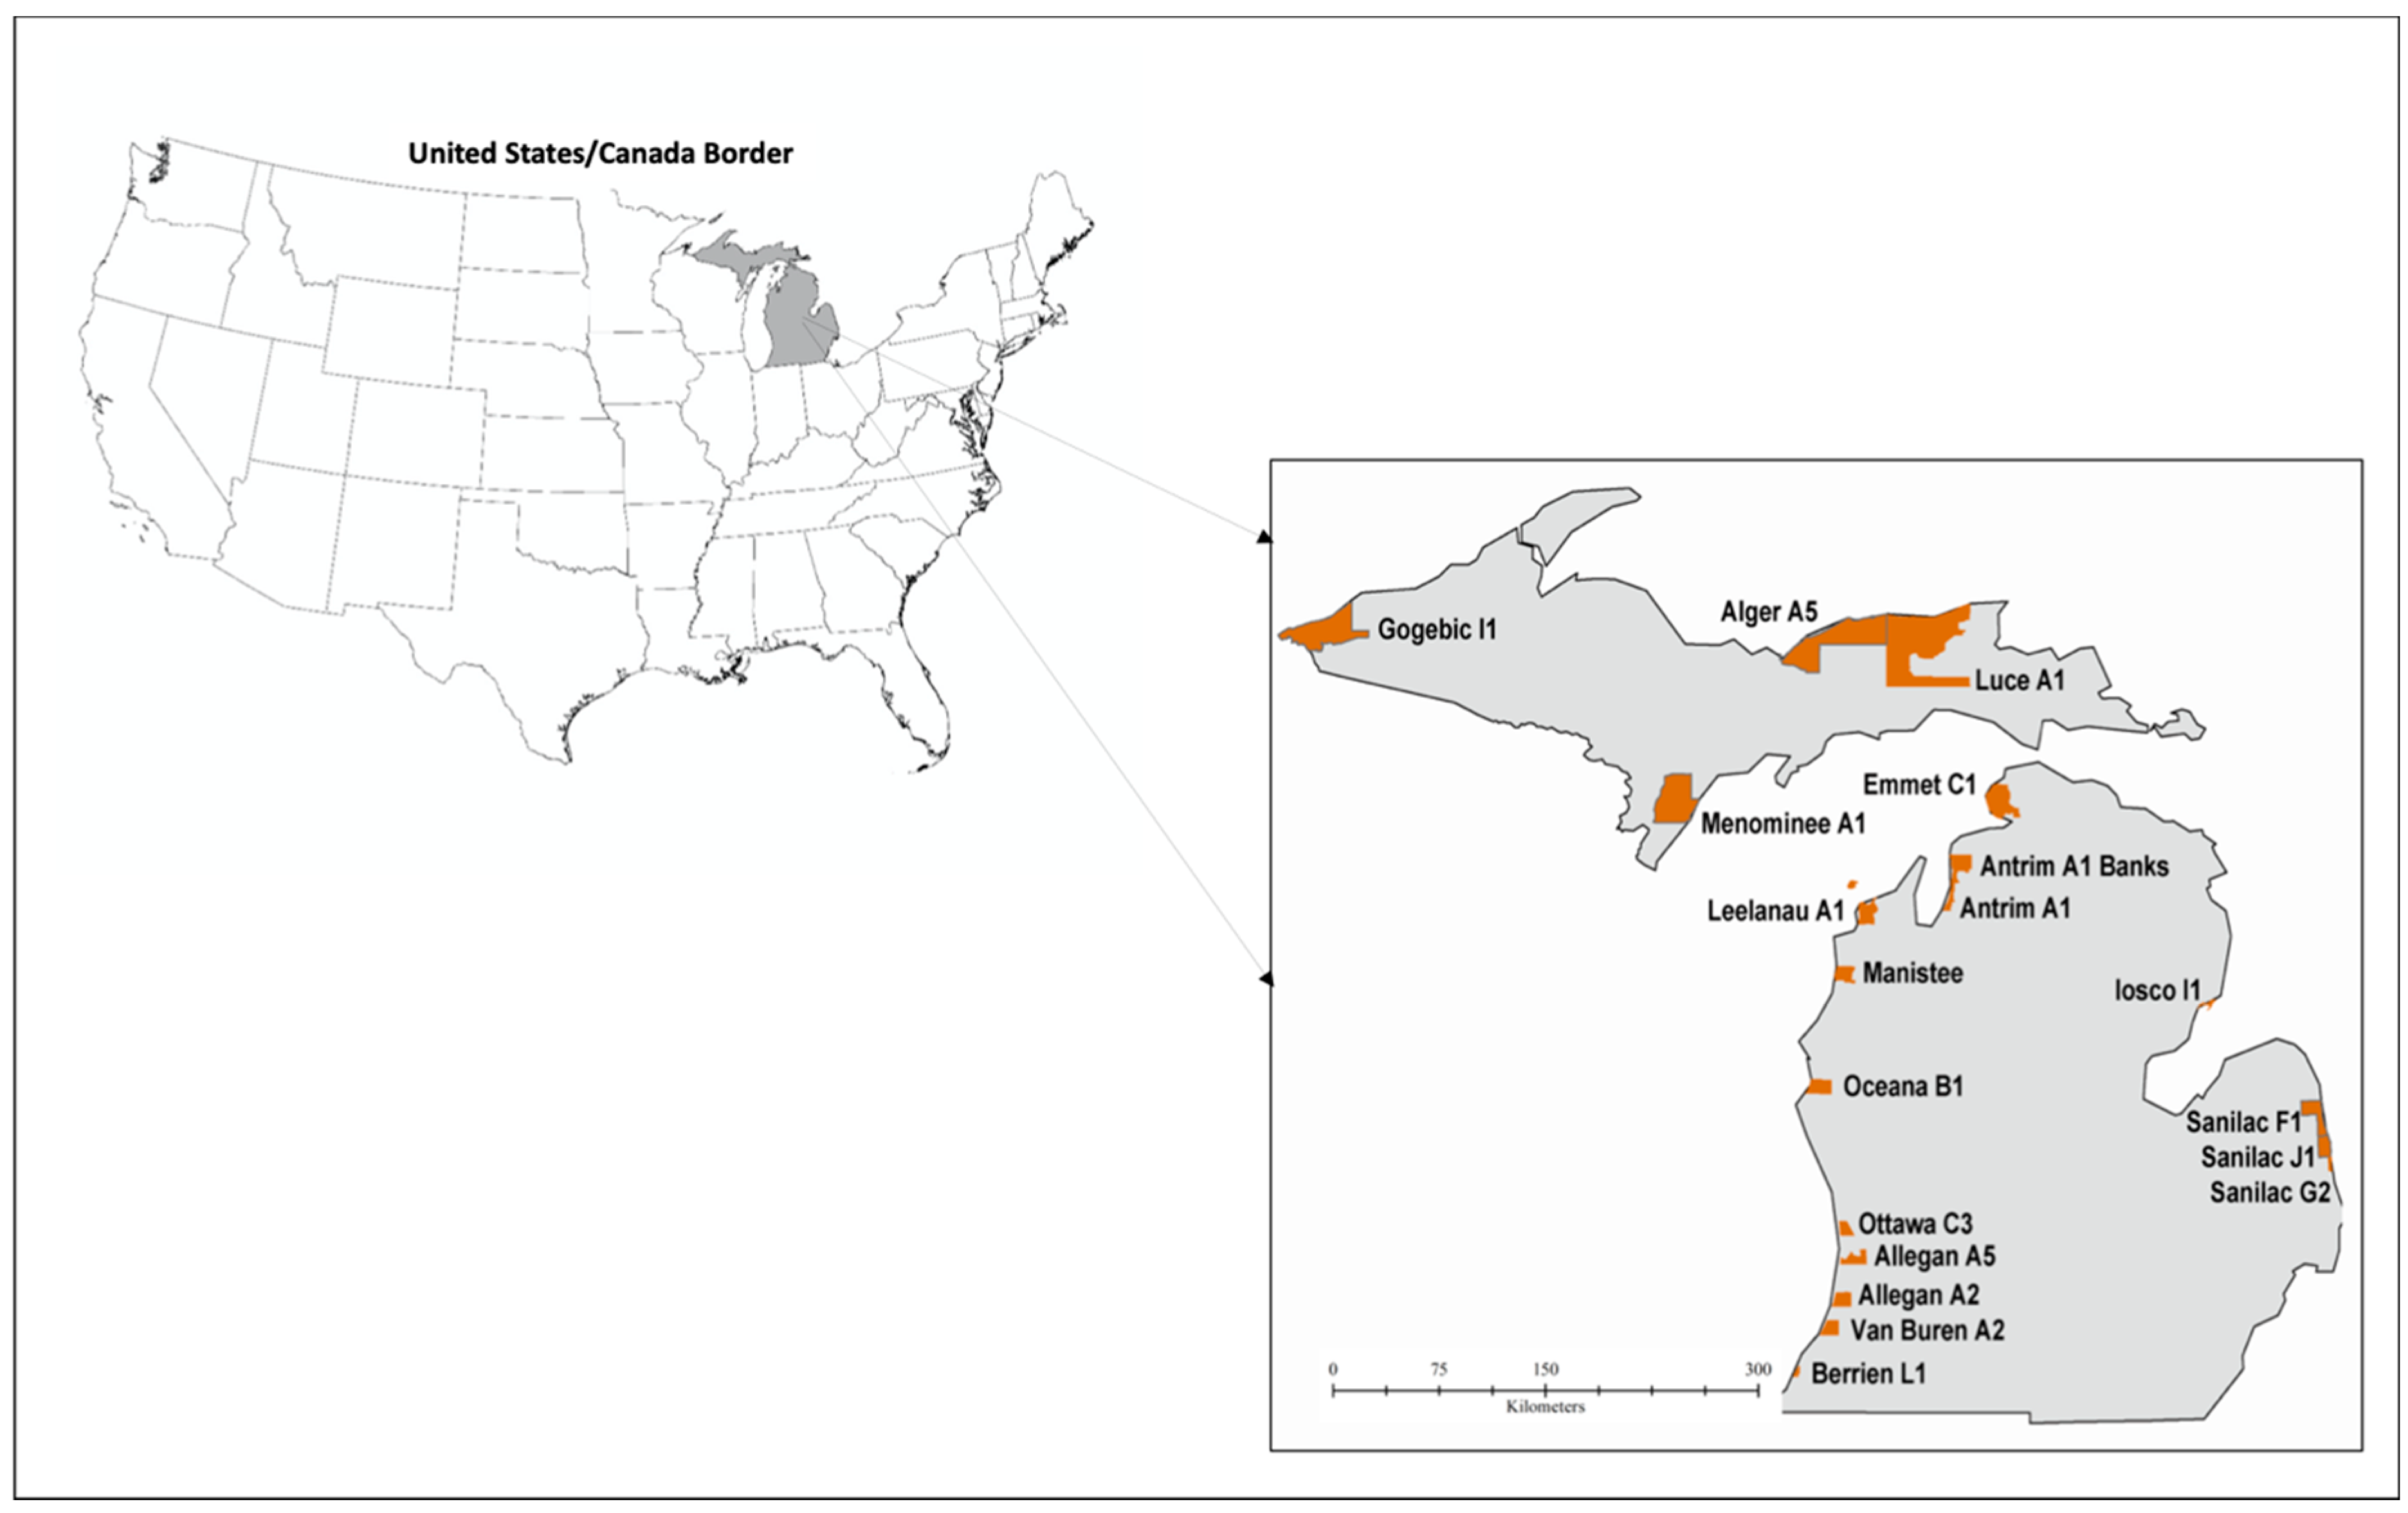
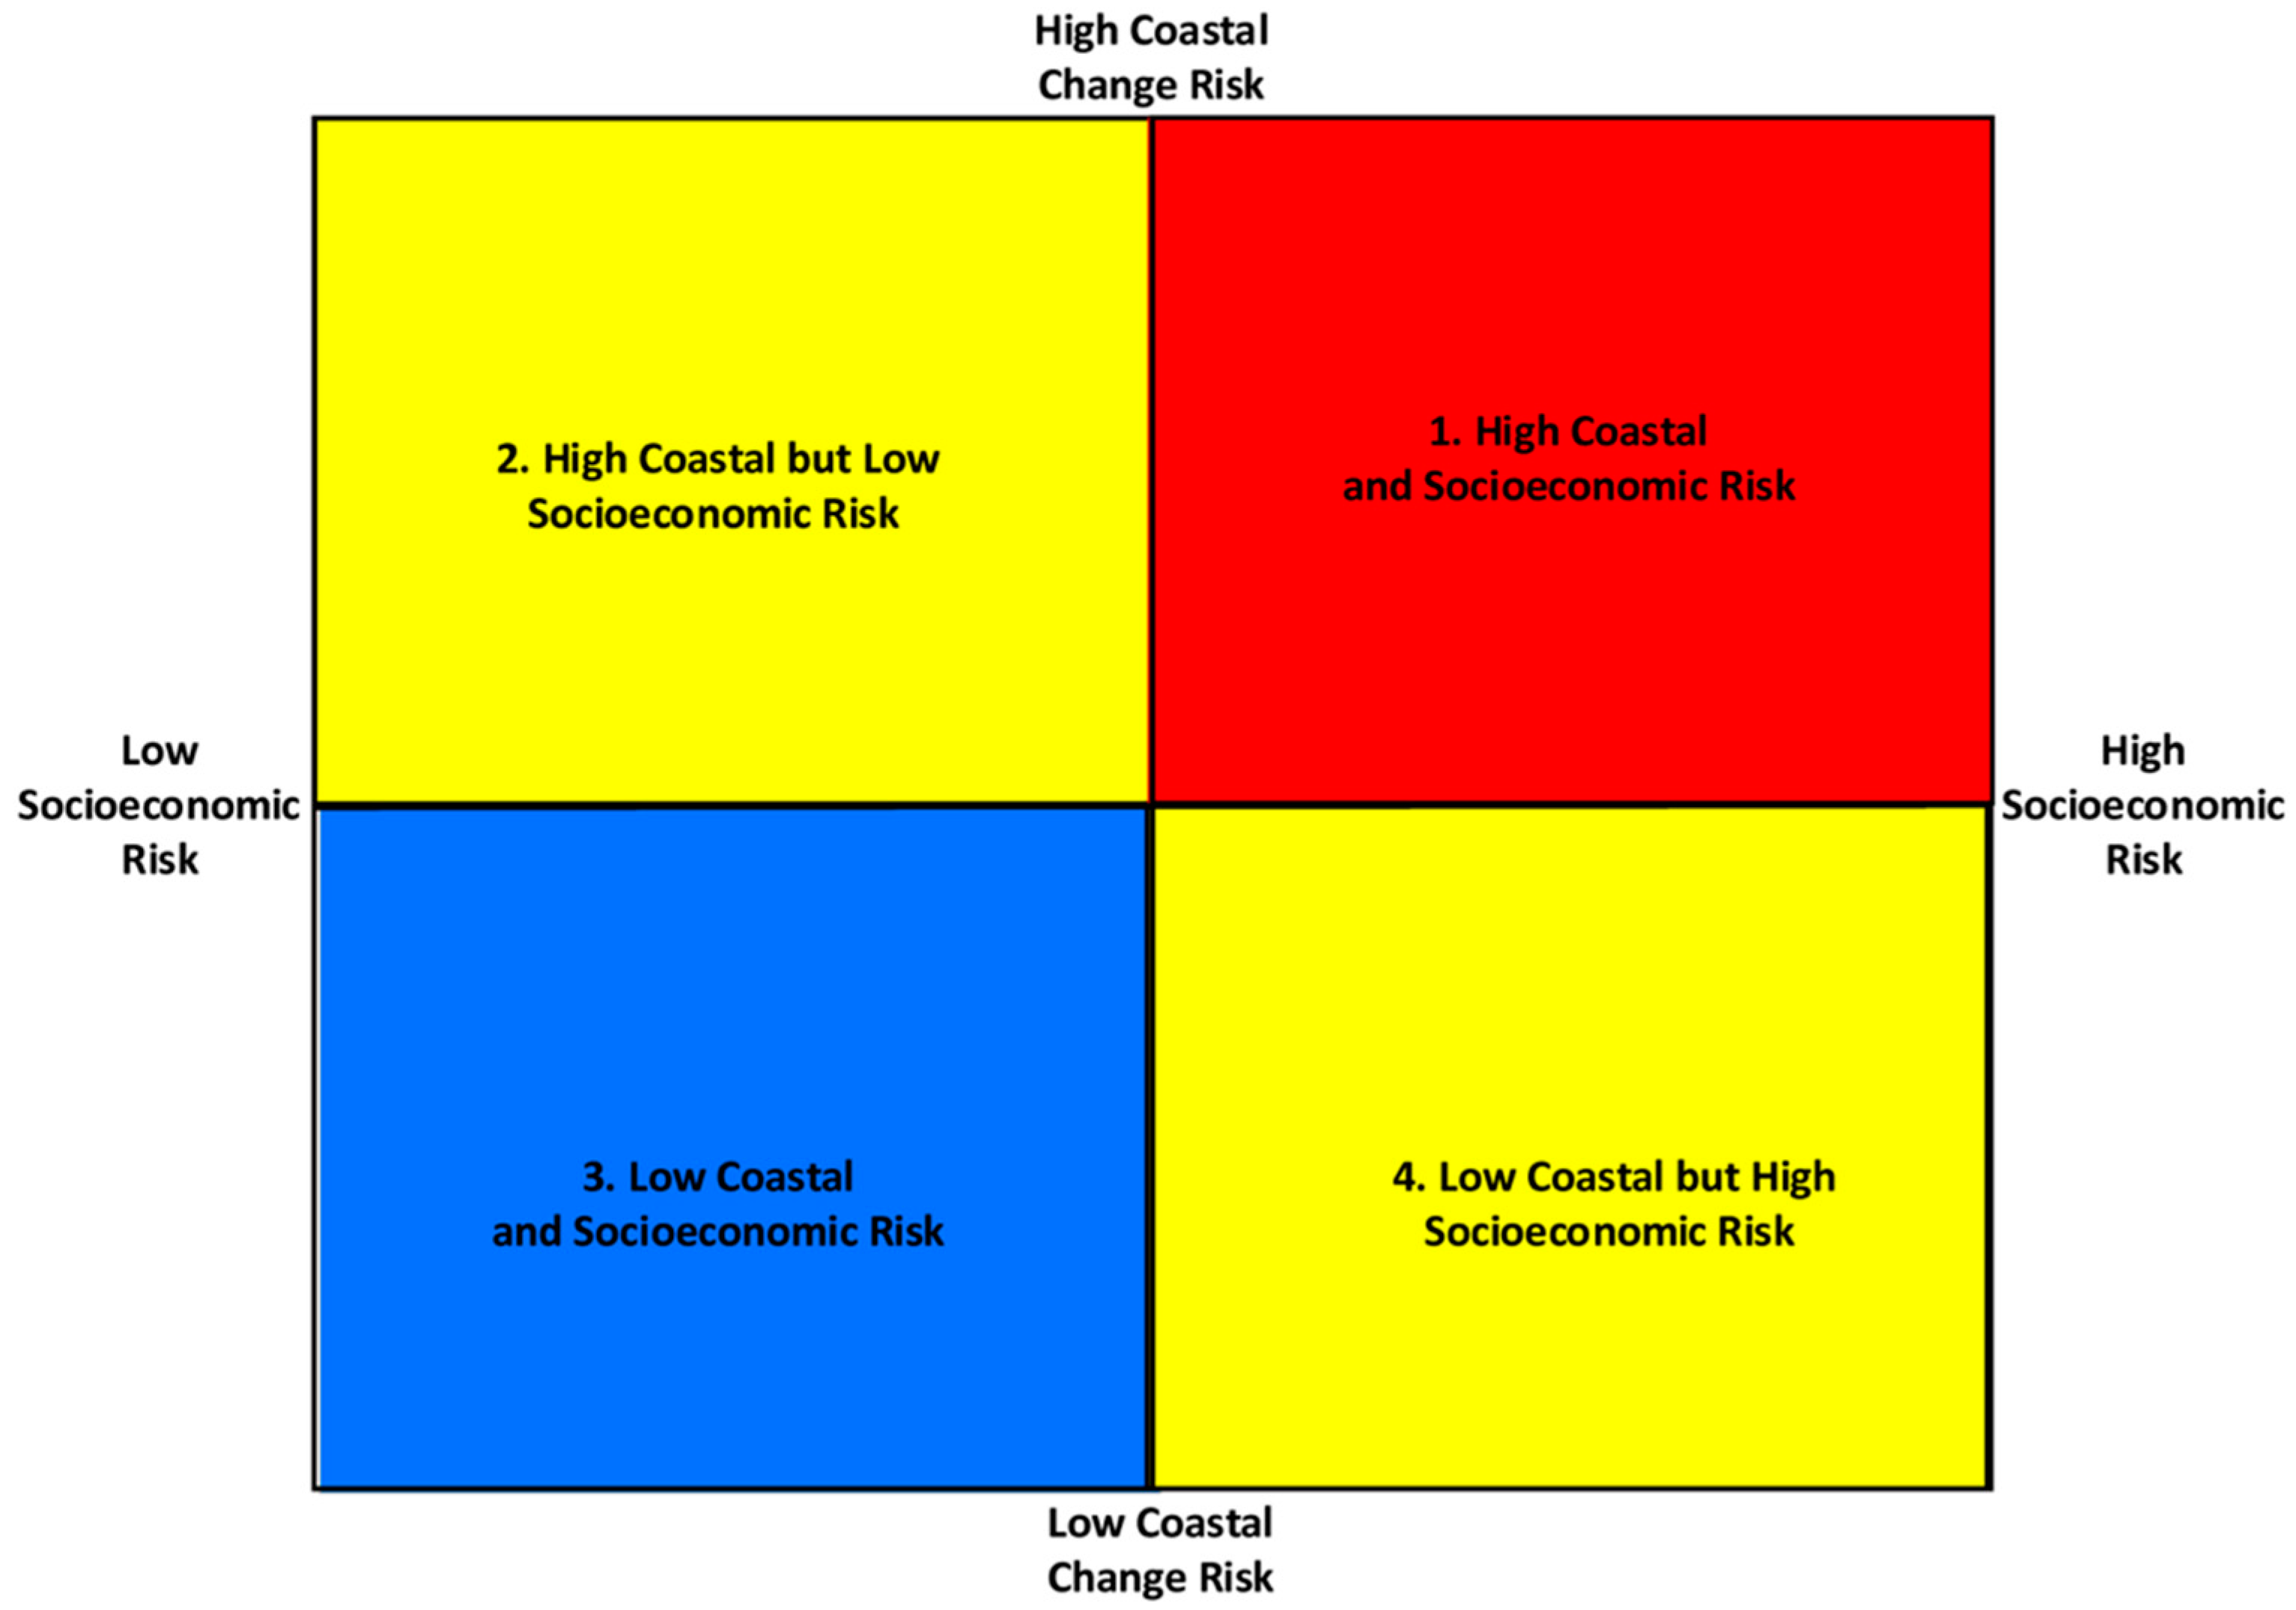
This study, which is grounded in the risks-hazards body of research, aims to develop an analytical framework for multivariate assessments of coastal community vulnerability. To do this, we develop a typology that organizes communities into various risk levels considering both physical and socio-economic dimensions of vulnerability. We use this framework to analyze the spatiotemporal dynamics of coastal erosion risk along the coast of Michigan to answer the following research questions: How dynamic is coastal erosion risk over time? What are the drivers of this risk? What is the geographic variability in risk drivers? We explore these questions by documenting patterns of coastal erosion and socio-economic vulnerability in 19 coastal communities in the State of Michigan since 2005.

2. Materials and Methods

2.1. Study Area

This study examines linkages between coastal erosion and socioeconomic vulnerability in the Great Lakes region of the United States, which is one of the largest sources of freshwater in the world. Combined, Lakes Superior, Michigan, Huron, Erie, and Ontario represent 95% of the total freshwater supply in the U.S. and 80–90% of the freshwater in North America [33]. We focus on the shores of the State of Michigan, which has the longest and most varied shoreline of all the Great Lakes states. The shoreline types along the coast of Michigan are also representative of shorelines found throughout the rest of the Great Lakes and other coastal regions globally (e.g., bluffs, sandy beaches, wetlands, gravel beaches, etc.). This variation makes it an ideal natural laboratory to develop our analytical framework.
Most coastal risk assessments are based on long-term averages of erosion rates given the data and time-intensive nature of computing coastal erosion rates. Our study uses higher temporal resolution data in order to better understand the vulnerability associated with erosional impacts. To do this, we digitized erosion lines on coastal imagery and then used these lines to compute erosion rates. Due to the data intensive nature of this process, we randomly sub-sampled sites from along the Michigan coast to complete the coastal vulnerability analyses.
The starting point for this sampling process was The State of Michigan’s High Risk Erosion Areas Program (HREA), which is implemented by the Michigan Department of Environment, Great Lakes, and Energy (EGLE). The HREA program has identified, through a combination of aerial photograph analyses and on the ground surveying, 519 shoreline reaches throughout the state that are at high risk for erosion. In order to generate a representative subsample of these HREA’s, we first placed each of the 519 reaches into one of four groups based on their retreat rates: 1–3 (0.305–0.914 m) ft/year, 3–5 (0.914–1.524 m) ft/year, 5–10 (1.524–3.048 m) ft/year, and 10–20 (3.048–6.096 m) ft/year. Using all the data, we determined what percentage of the sites were in each of the bins and then calculated how many sites would need to be in each bin to generate a representative subsample with only 20 sites.
From here, we randomly selected the appropriate number of sites from within each bin (16 for 1–3 ft/year; 2 for 3–5 ft/year; 1 for 5–10 ft/year; 1 for 10–20 ft/year). This generated 20 unique sites that were then used for the shoreline change and socio-economic analyses. Two of the randomly selected sites (Manistee C1 and C2) were immediately adjacent to each other and thus were treated as one site, which results in 19 sites total for the analyses in this manuscript. Figure 1 displays the location of these sites across the state of Michigan. The combined tracts for Manistee C1 and C2 are labeled as Manistee.

2.2. Data

2.2.1. Coastal Change Data

To compute coastal erosion rates, National Agriculture Imagery Program (NAIP) orthoimagery were downloaded for each of the study sites outlined in Figure 1 from the United States Geological Survey’s Earth Explorer website. Georeferenced (UTM Zone 16N NAD83) aerial images from 2005, 2010, 2014 and 2018 were downloaded for each site. For two sites (Alger A5 and Antrim A1) 2009 imagery were used in place of 2010 imagery due to apparent georeferencing issues. All aerial images were imported into ESRI’s ArcMap for digitization of the erosion hazard line (Figure 2). A shapefile for each time period and site was generated by manually digitizing the erosion hazard line from each of the images (e.g., [34]). The erosion hazard line was visually defined as the most landward extent of active erosion as expressed through geomorphic features, such as an erosional scarp. This metric is a better representation of the erosional impacts at a site than digitizing the shoreline because it is not influenced by the position of the water level at the time of the image collection. The erosion line marks the position of quasi-permanent loss of beach, dune, or other coastal habitat in response to the cumulative impact of fluctuating water levels, storms, and anthropogenic disturbance.
Given the relatively coarse temporal resolution of the imagery we cannot ascribe change to specific storm events or anthropogenic disturbances, but our time bins do track the general fluctuations in water level for Lakes Michigan-Huron and Superior. Water levels for both lake systems were anomalously low for about a decade starting in 2000 until 2013 [35]. From 2013, water levels rose rapidly to record and near-record high levels [36], which is largely driven by increased precipitation into the Great Lakes Basin [37]. The position of the erosion hazard line generated from the aerial images generally tracks coastal response to these fluctuations in water level with the 2005 to 2010 time period reflecting conditions during the low water level period. The time period from 2010 to 2014 reflects rising water level conditions out of the low water level period, whereas the time period from 2014–2018 reflects rising water level conditions beyond lake wide averages and towards record highs.

2.2.2. Coastal Change Analysis Methods

Changes between the digitized erosion hazard lines were analyzed for each time step and site in the standard way that shoreline change analyses are conducted globally [34,38,39]. The Digital Shoreline Analysis System (DSAS, which is an ArcGIS add-on that automatically measures positional changes between shorelines and erosion hazards lines by calculating the distance between a specific line and a fixed baseline along transects, was utilized to conduct the coastal change analyses [40]. Digitized erosion hazard lines associated with specific dates were imported into ArcGIS and added to a personal geodatabase for each site. All shorelines for each site were merged into one feature class within the geodatabase and this was imported into ArcMap where the Buffer and Trace tools were used to create a baseline landward of these shorelines. Next, the DSAS toolbar in ArcMap was used to generate shore-normal transects along the site at 50 m spacing. The final step in the GIS component of the shoreline analysis was to calculate change in the position of the erosion hazard line across each of the transects using the DSAS add-on. Along each transect, the distance between the baseline and the erosion hazard line was computed and placed into an attribute table. The intersection data was then exported out of ArcGIS as a text file and imported into Microsoft Excel for further analysis.
For each site and date, the distance between the baseline and the erosion hazard line calculated along the 50 m spaced transects was tabulated. In order to generate the magnitude of positional changes for our specific time periods (2005–2010, 2010–2014, and 2014–2018), these distances were subtracted. These distances were then divided by the time elapsed between the two lines in order to generate a retreat rate in m/year. The number of transects for each site varied depending on the alongshore width of the site so the computed retreat rates were averaged to generate one retreat rate per site and time period. Positive retreat rates indicate no observed erosion and a migration of the erosion line lakeward; suggesting accretion and minimal vulnerability. Negative retreat rates indicate erosion and a migration of the erosion line landward.
The retreat rates were used to assign a coastal change vulnerability ranking for each site through time. Coastal change vulnerability was defined using the State of Michigan’s High-Risk Erosion Area criterion, which is 1 ft/year (−0.305 m/year) [21]. Sites with erosion rates higher than −0.305 m/year are defined as high coastal change vulnerability and sites with lower than −0.305 m/year are defined as low coastal change vulnerability. The vulnerability rankings were assigned to each site and time period examined in this study in order to evaluate how coastal change vulnerability varies through time. Additionally, these vulnerability rankings allow for a direct comparison to the socio-economic vulnerability that was also computed in this study.

2.2.3. Demographic and Economic Data

In addition to the physical vulnerability of communities, as quantified by erosion rates, economic data were used in this study to consider social determinants of vulnerability. To characterize this aspect of vulnerability, five year estimates of Census tract characteristics were obtained from the American Community Survey for three study periods that aligned temporally with the computed erosion rates: 2006–2010, 2010–2014, and 2014–2018. Table 1 contains the description and source information for these data as well the erosion data described above. It is important to note that while we refer to the first time period as pertaining to 2005–2010, there is a slight difference in the temporal alignment between the economic and the erosion rate data for the first time period. The economic data are available for 2006–2010 while the erosion rate data are for 2005–2010.
From these data, per capita income was selected as the key driver of vulnerability for several reasons. First, it is a commonly used indicator of vulnerability in other studies and assessments [41]. Second, per capita personal income is taxed and forms part of the community tax base which is related to the community capacity to raise money from residents to use toward coastal hazard mitigation. Other variables could be used to measure the economic capacity of people and communities, such as median home value. That said, around the Great Lakes region, many people have had homes gifted to them from family members [42]. Thus, while their median home value may be high, it may not necessarily reflect the economic situation of the household. Per capita income also reflects incoming cash flows to households which speaks to the financial capacity of people now and in the future to afford protective response measures to coastal hazards. Finally, in some locales in Michigan, as well as other locations throughout the Great Lakes, high bluff erosion rates are causing homes to fall into the Great Lakes, thus they may not be considered fungible assets for people [43].

2.2.4. Socio-Economic Data Analysis Methods

To align the erosion and the Census data, Census tracts were selected that intersected the 20 study sites presented in Figure 1. These tracts are the small polygons that appear in the figures throughout this paper. We use the term tracts to refer to these polygons to differentiate them from other Census geographies used in the United States (e.g., block groups or blocks). This selection process yielded 19 Census tracts; one tract (Manistee) contained two of the study sites. After aligning these tracts with the sites identified for erosion analysis, they were classified as economically vulnerable or not based on the median per capita income for the 19 tracts of interest. Tracts that fell below per capita median income were classified as economically vulnerable while those that fell at or above median per capita income were not considered economically vulnerable. Between 2006 and 2010 this means that communities with median incomes below $24,063 were classified as economically vulnerable. Between 2010–2014 this means that communities with median incomes below $27,136 were classified as economically vulnerable. Between 2014–2018 this means that communities with median incomes below $30,236 were classified as economically vulnerable.

2.3. Typology of Vulnerable Communities

The combination of the coastal and economic vulnerability rankings generates the total vulnerability of a site to coastal hazards. Figure 3 proposes a typology that integrates information about the physical and economic vulnerability of communities. Communities classified into typology category one have high erosion rates and lower than median per capita income. These are the communities at the highest risk to coastal hazards because they are both physically and economically vulnerable. Communities classified into typology category two possess moderate risk due to high erosion rates but above median per capita incomes. Communities classified into typology category three have the lowest possible risk to coastal hazards because they have low physical and economic vulnerability. Communities classified into typology category four possess moderate vulnerability to coastal hazards. Despite their low physical vulnerability to coastal processes they possess high economic vulnerability should a hazard arise. Here it is important to note that categories two and four are colored similarly because they both contain some type of vulnerability but would not be considered the highest priority for allocating resources given that they exhibit only one of the two types of vulnerability. In typology category two, this vulnerability is physical and in typology category four that vulnerability is economic.
This type of framework is valuable because it considers two dimensions of coastal vulnerability; physical vulnerability to erosion hazards and the economic capacity to take steps that mitigate these hazards. As we will demonstrate in this manuscript, these typologies are also useful because they document changes in coastal vulnerability over time and the extent that vulnerability is dynamic.

3. Results

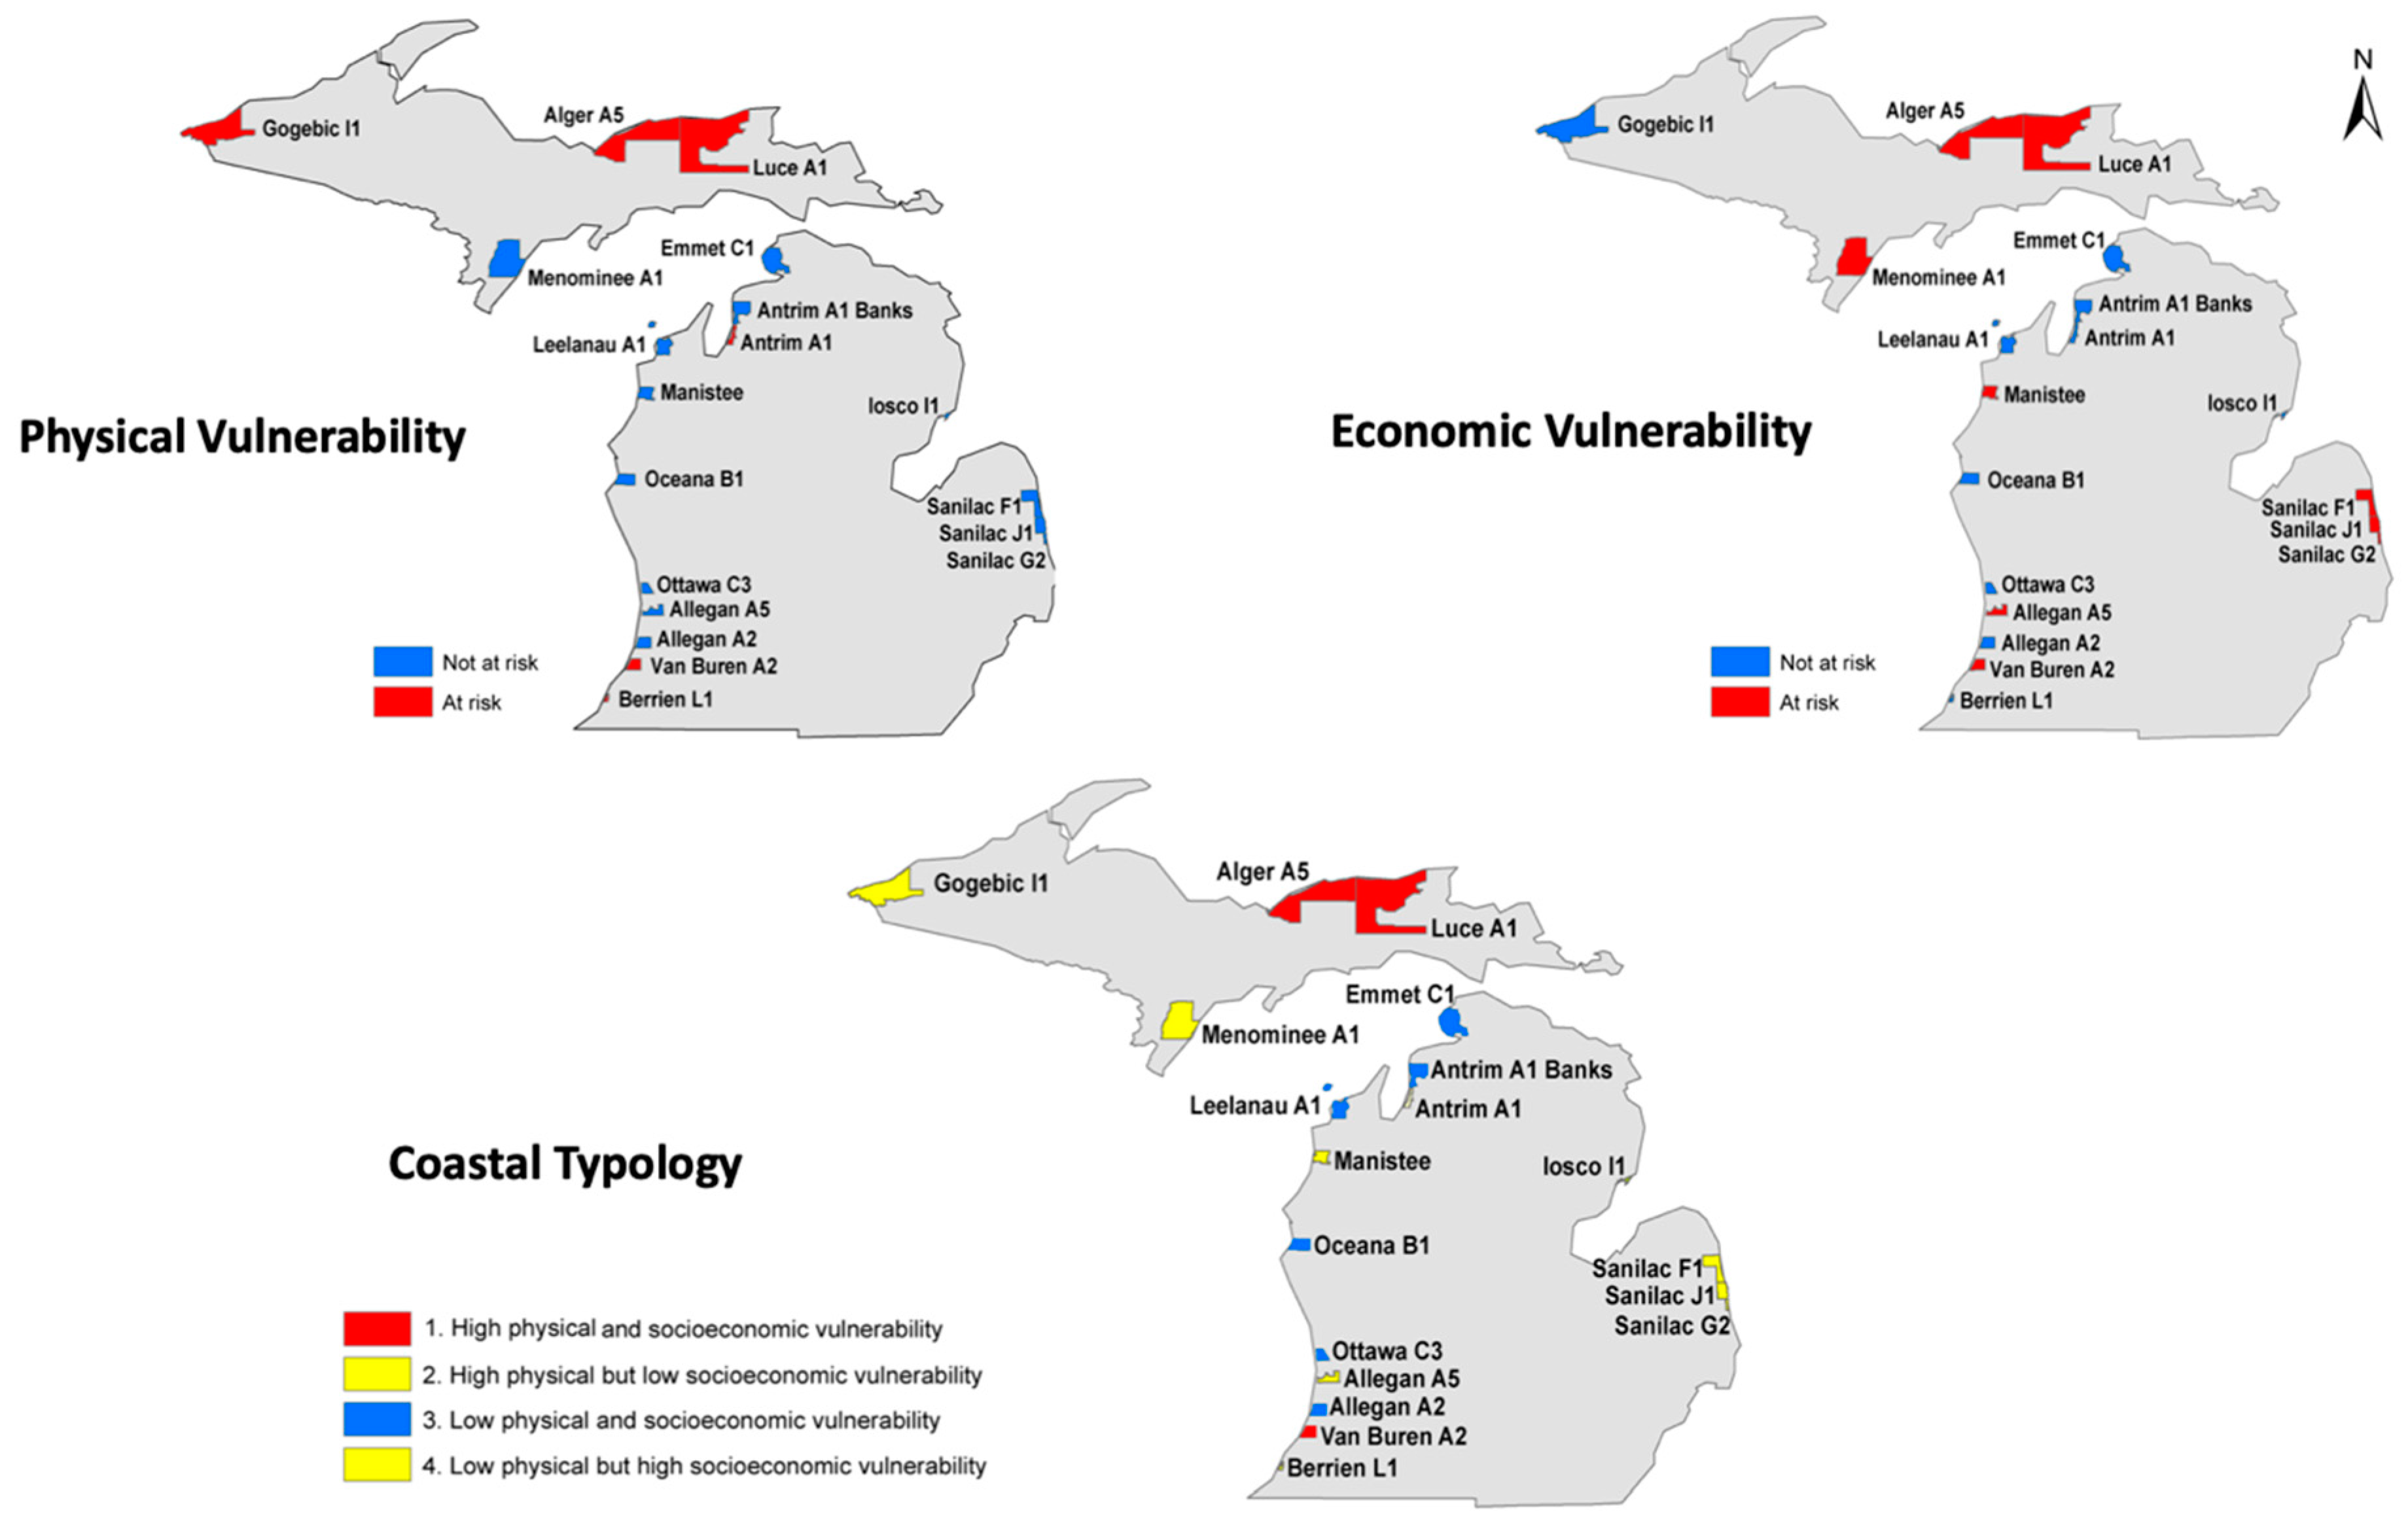
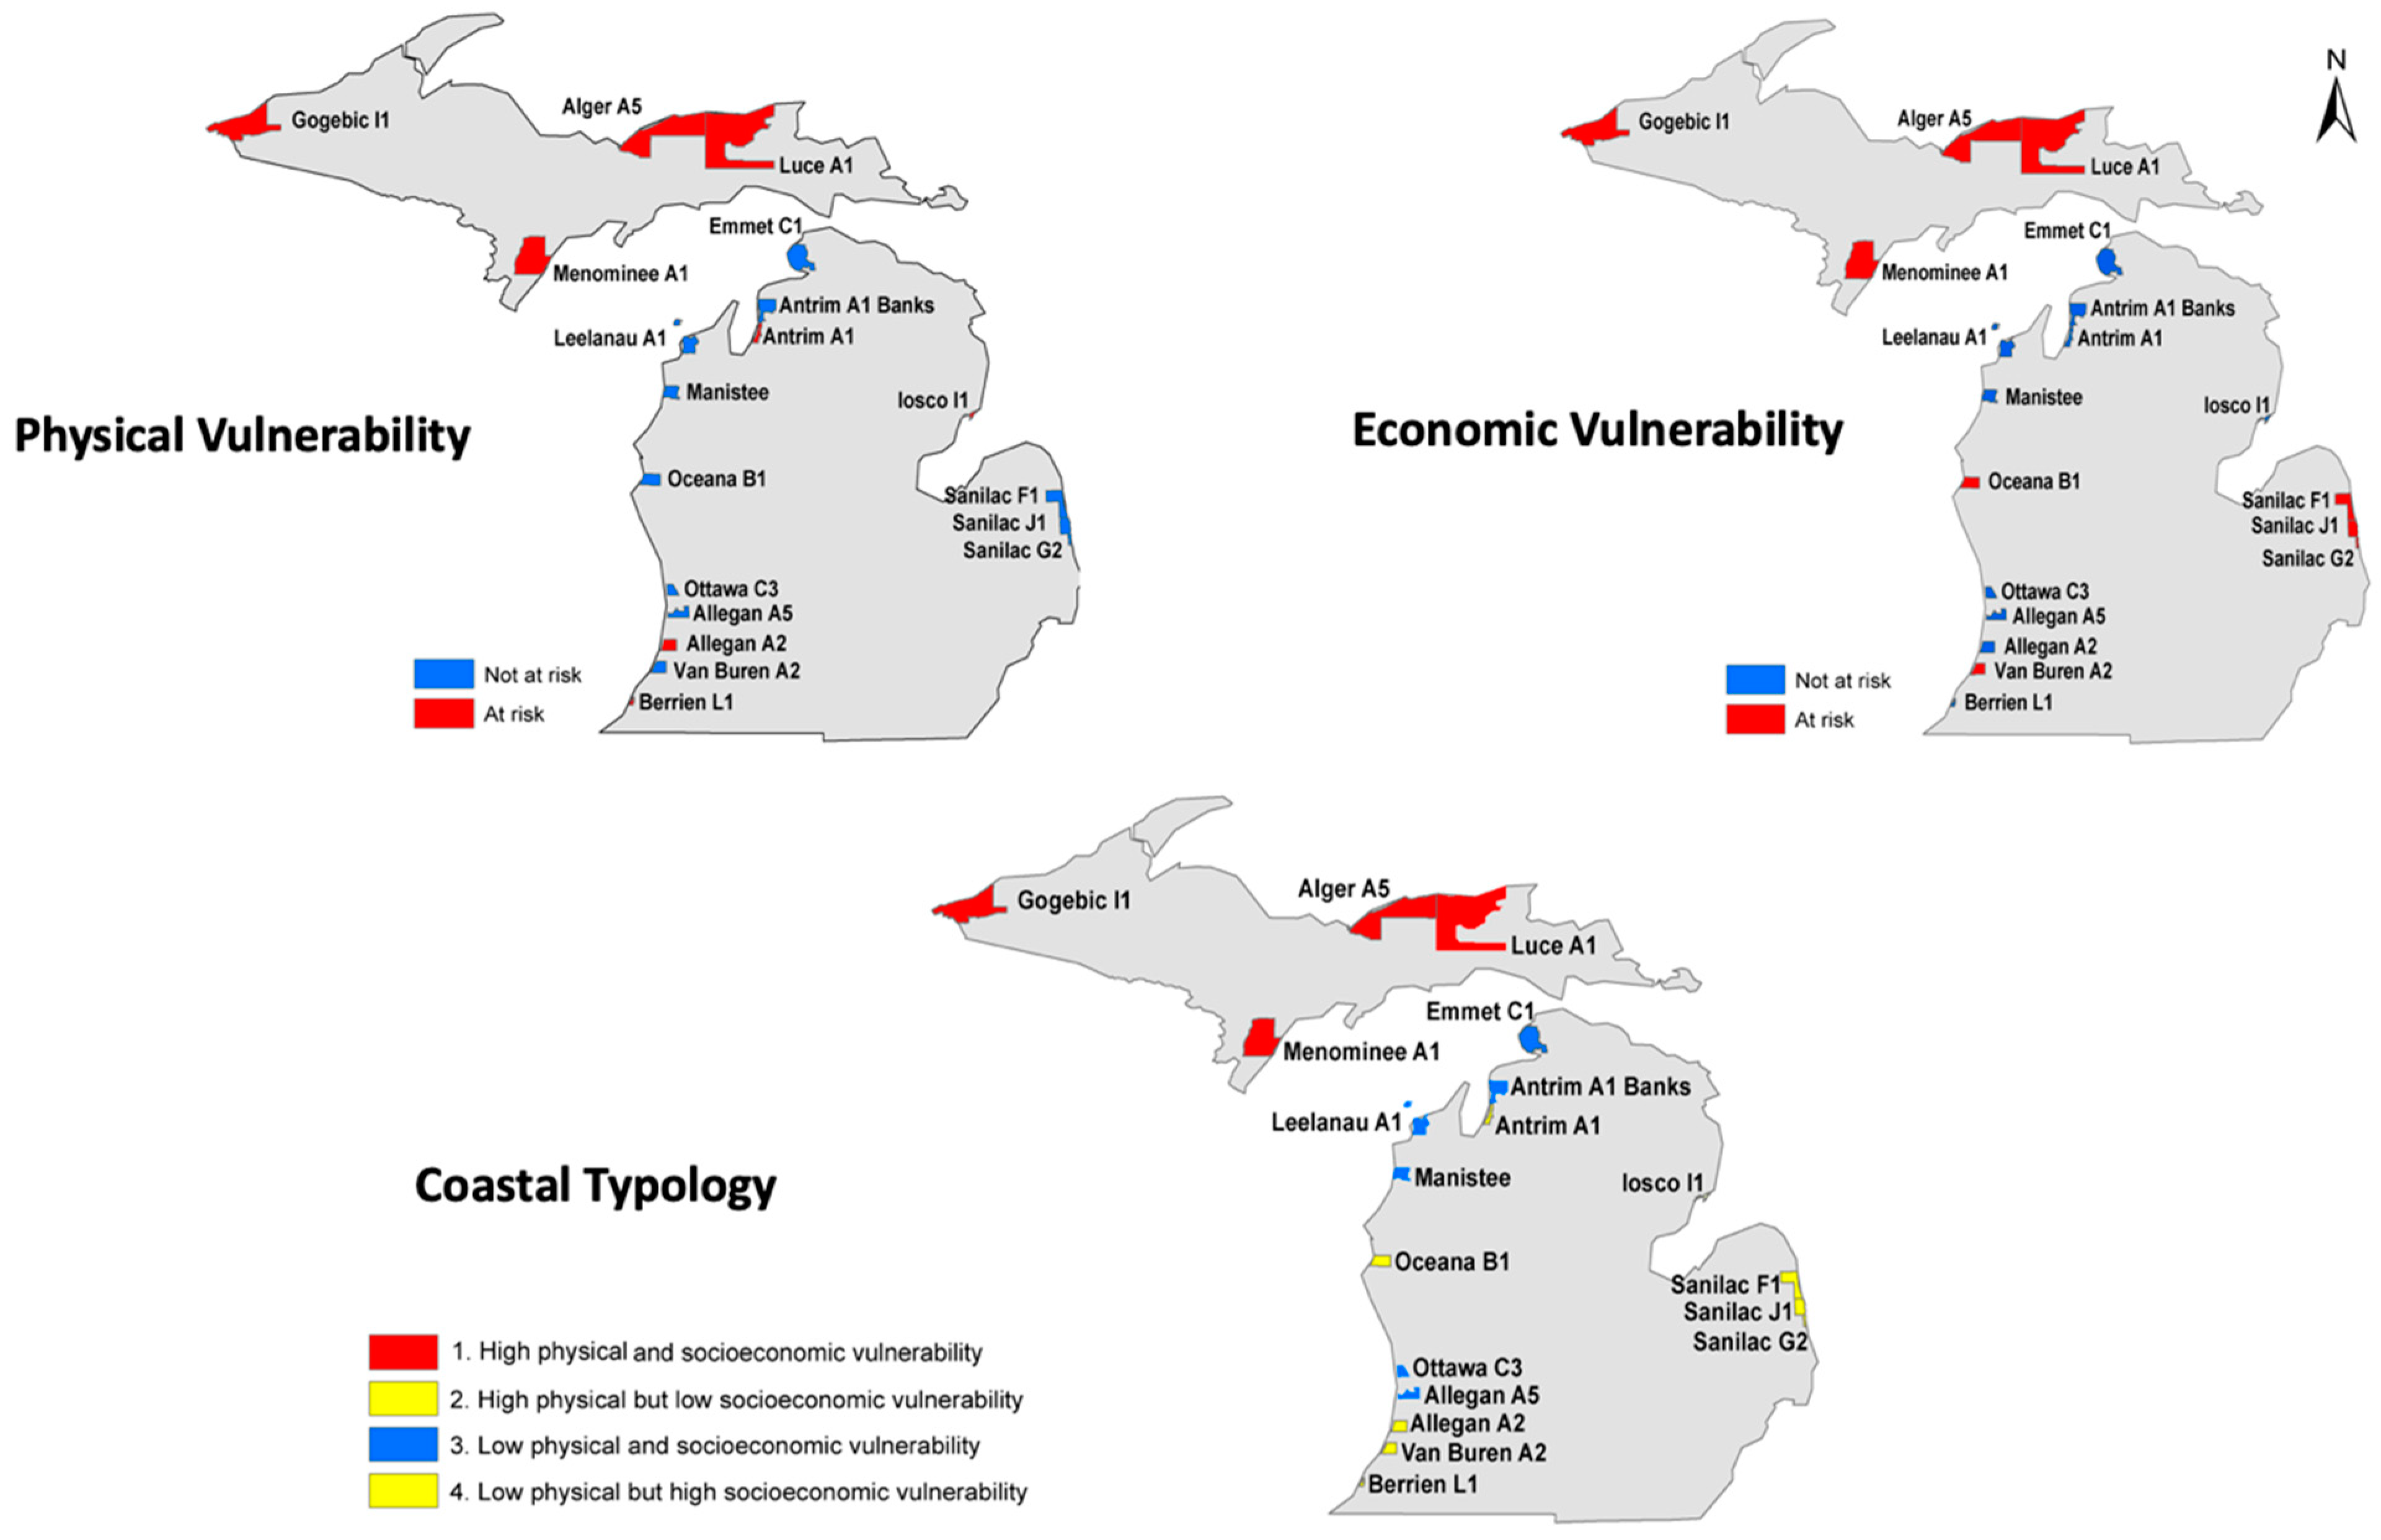
Figure 4 displays three maps for the 2005–2010 period. The first panel of this figure displays a map of coastal erosion (i.e., physical) vulnerability. The retreat rates for each site and time step were used to define whether a site had high or low erosional vulnerability depending on whether the erosion rate is higher or lower than the HREA definition (−0.305 m/year). From 2005–2010, 6 of the 19 sites were identified as having high erosion vulnerability. These sites were Alger A5, Antrim A1, Berrien L1, Gogebic I1, Luce A1, and Van Buren A2.
The second panel of this figure displays information about per capita income (i.e., economic vulnerability). It highlights that there are eight tracts classified as economically vulnerable. Three of these tracts are located in the Upper Peninsula near the communities of Menominee, Alger and Luce, respectively. Three of these tracts are located on the Lake Michigan side of the state near the communities of Manistee, Allegan, and Van Buren. Two tracts are located on the Lake Huron side of the state near the community of Sanilac.
The third panel of this figure contains a map of the typology for 2005–2010. For this time period, there are three tracts classified in typology category one; physically and economically vulnerable to coastal erosion. Two of these are in the Upper Peninsula on the shores of Lake Superior near the communities of Alger and Luce. One is located along Lake Michigan in Van Buren County. There are six tracts in typology category four which contains communities with low erosion rates but high economic vulnerability. One of these tracts is located in the lower portion of the Upper Peninsula near the community of Menominee. Two of these tracts are located along Lake Michigan near the communities of Allegan and Manistee. Three of these tracts are locate on the shores of Lake Huron near the community of Sanilac.
Figure 5 displays three maps for the period 2010–2014. The top left contains a choropleth map of physical (erosional) vulnerability. From 2010–2014, 8 of the 19 sites were defined as having high erosional vulnerability. In general, the sites that had high erosion rates in the first time step remained vulnerable, however, there were some exceptions. Van Buren A2 switched to low erosional vulnerability during this time step and Allegan A2, Iosco A1, and Menominee A1 all switched to high erosion vulnerability.
The top right contains a choropleth map of per capita income. There are nine tracts with below median per capita incomes. Four of these are located in the Upper Peninsula near the communities of Gogebic, Menominee, Alger, and Luce. Two of the low income tracts are located on the Lake Michigan coast near the communities of Oceana and Van Buren. Three of these tracts are located near the community of Sanilac on the Lake Huron coast.
The bottom right contains a map depicting the typology results for this time period. During this period, the same four tracts (near Gogebic, Menominee, Alger, and Luce) with below median income were classified into typology category one because they also had high coastal erosion rates. There were five tracts classified into typology category four indicating high economic vulnerability but low vulnerability to coastal erosion. These tracts are split between the coastlines of Lakes Michigan and Huron: two tracts are along Lake Michigan near the communities of Van Buren and Oceana and three tracts are located along Lake Huron near the community of Sanilac.
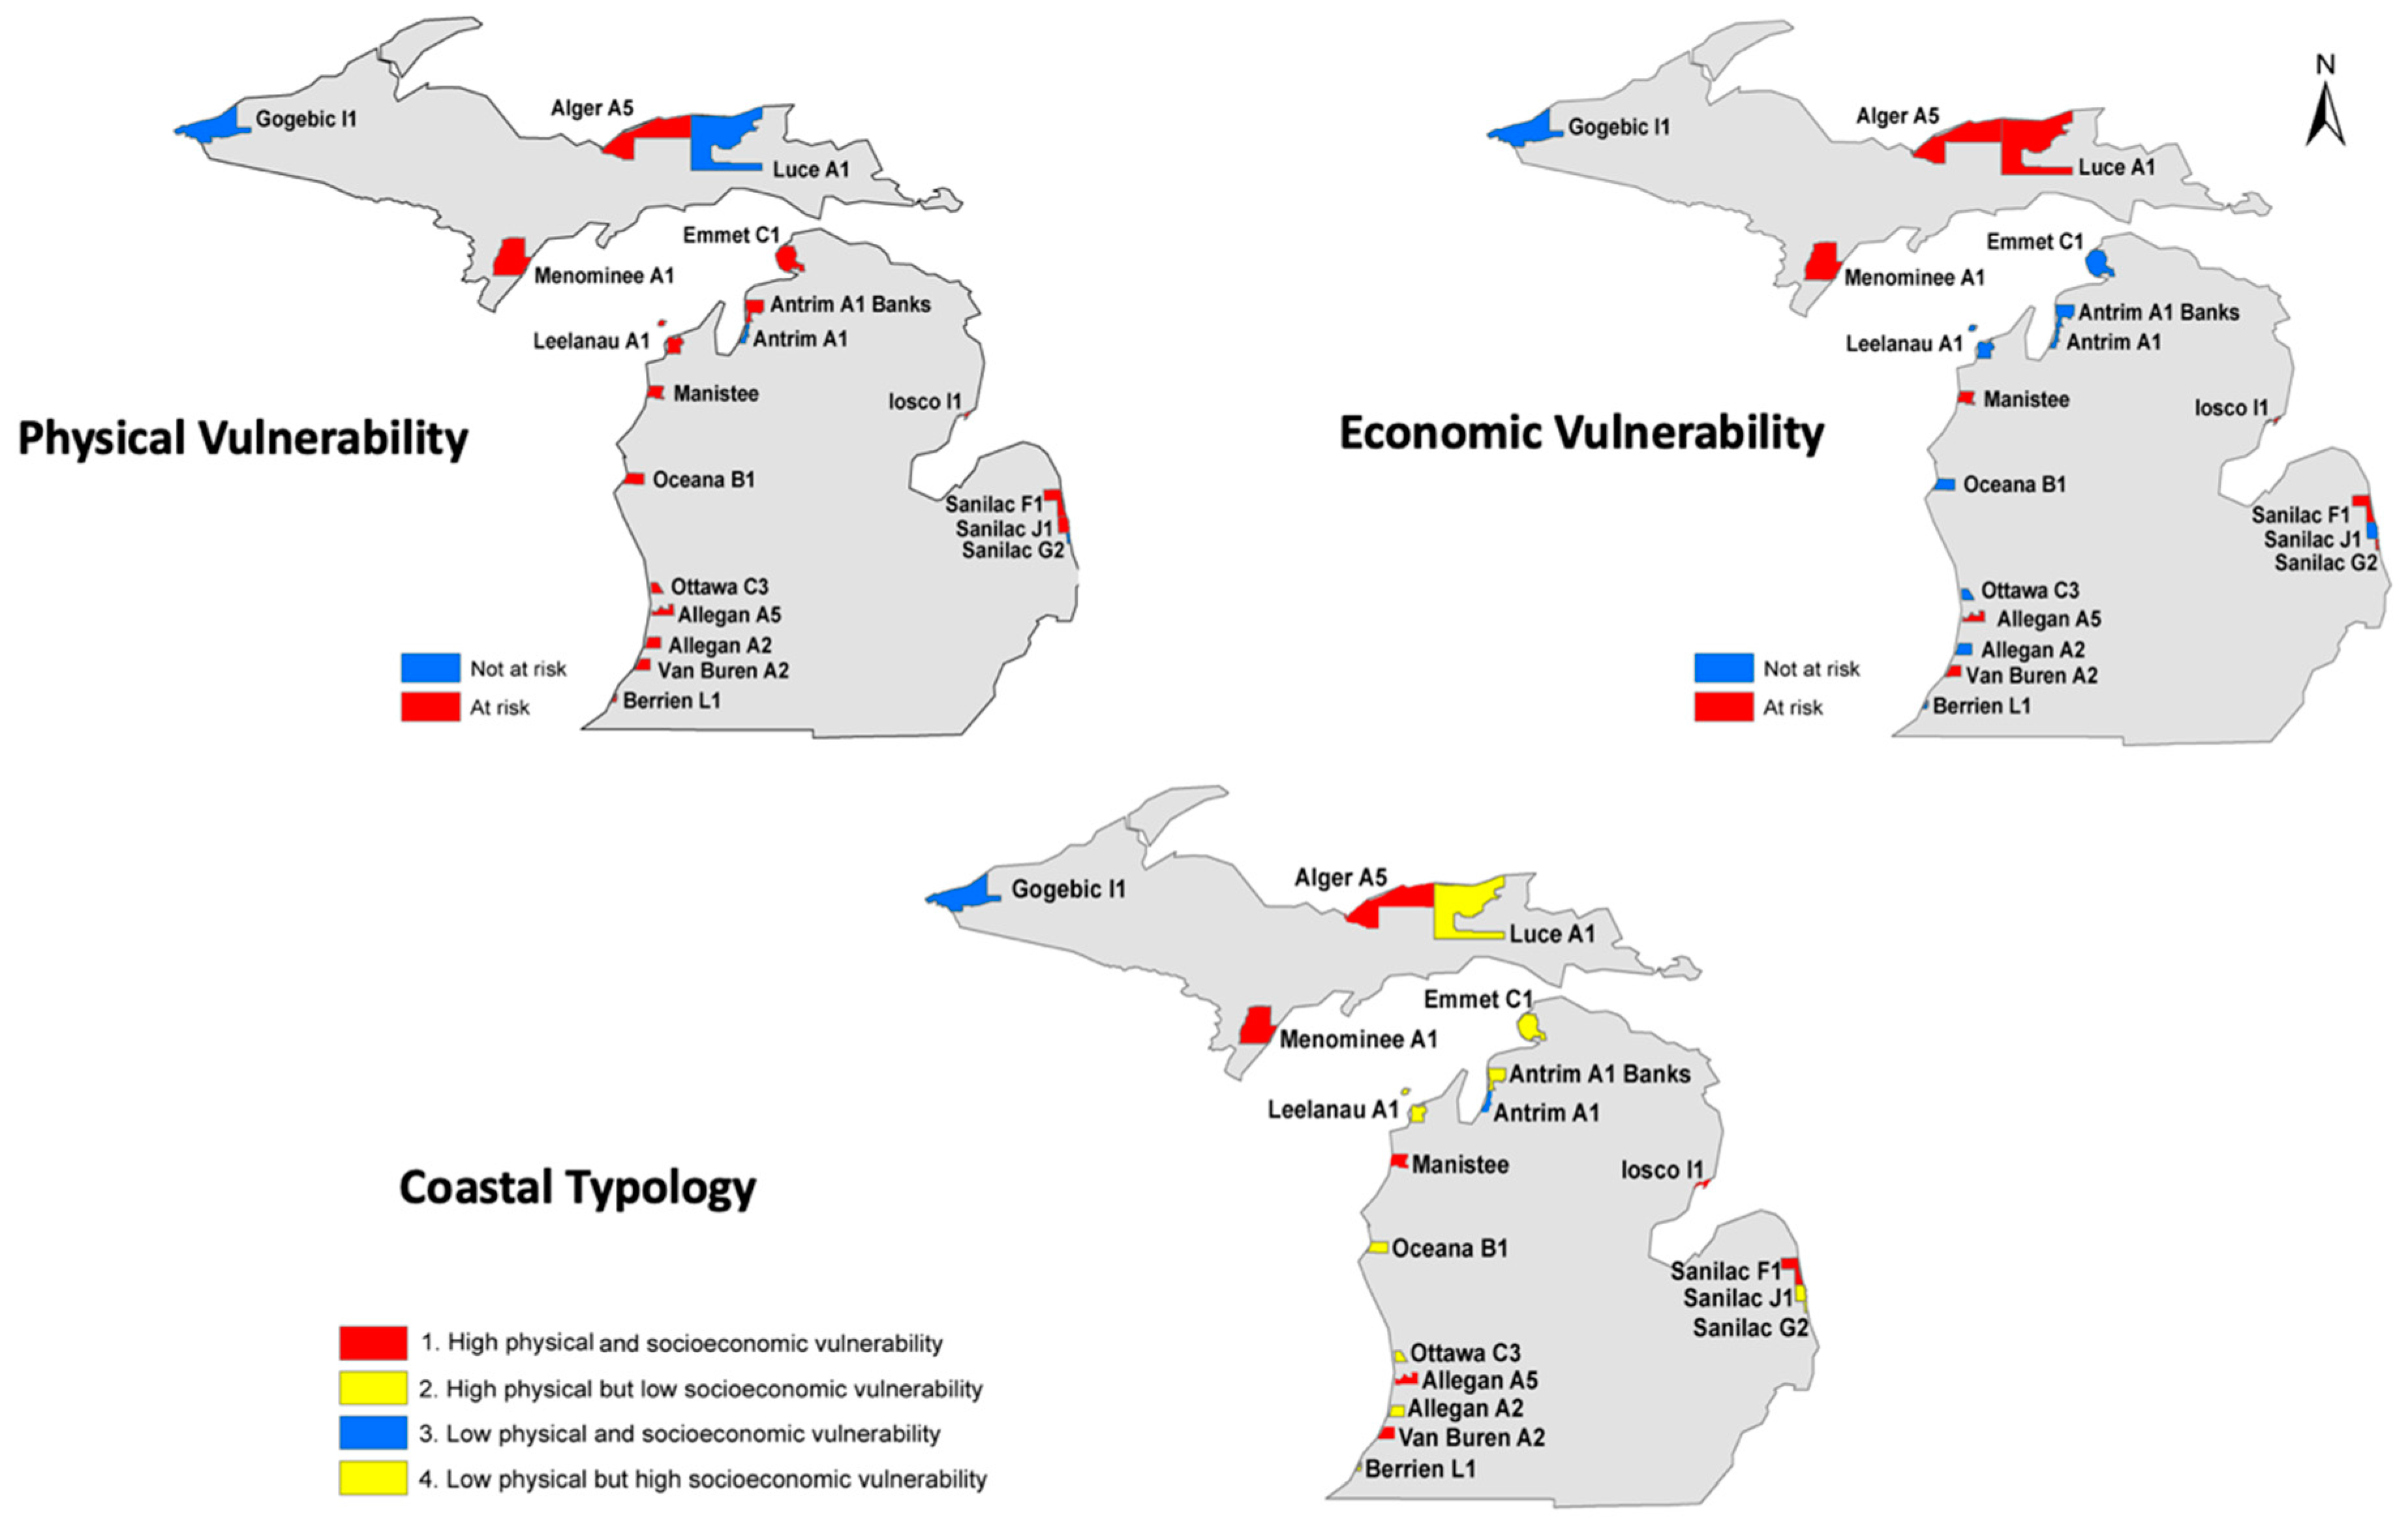
Figure 6 displays three maps for the period 2014–2018. The top left contains a choropleth map of erosion vulnerability. The number of high erosion vulnerability sites jumps from eight in the previous time period to fifteen sites during the 2014–2018 time period. Allegan A5, Antrim A1 Banks, Emmet C1, Leelanau A1, Manistee C1 and C2, Oceana B1, Ottawa C3, Sanilac F1, Sanilac J1, and Van Buren A1 all became vulnerable during this period. That said, three of the sites (Antrim A1, Gogebic I1, and Luce A1) that were vulnerable to erosion in the 2010-2014 period switched to low vulnerability between 2014 and 2018. Interestingly, Sanilac G2 was never vulnerable to erosion during any of the time steps examined in this study.
The top right contains a choropleth map of per capita income. This map highlights the nine communities classified as economically vulnerable. Three of these tracts are located in the Upper Peninsula in the communities of Luce, Alger, and Menominee. Three of these tracts are located along the coast of Lake Michigan in the communities of Manistee, Allegan, and Van Buren. The final three tracts are located along the coast of Lake Huron in the communities of Iosco and Sanilac.
The bottom left contains a map depicting the typology results for this time period. It highlights that seven tracts were classified into typology category one indicating high physical and economic vulnerability. Two of these tracts are located in the Upper Peninsula near the communities of Alger (along Lake Superior) and Menominee (along Green Bay). Three of these tracts are located on the coast of Lake Michigan near the communities of Van Buren, Allegan, and Manistee. Two tracts are located on the Lake Huron coast near the communities of Iosco and Sanilac. Finally, only two tracts were classified into typology category four. One tract is in the Upper Peninsula along the coast of Lake Superior in Luce County which is due north of Mackinac County. The other tract lies in the Lower Peninsula off the coast of Lake Huron in Sanilac County, Michigan.
One of the interesting aspects of these typologies is the ability to examine how a given tract’s typology classification changes over time. 
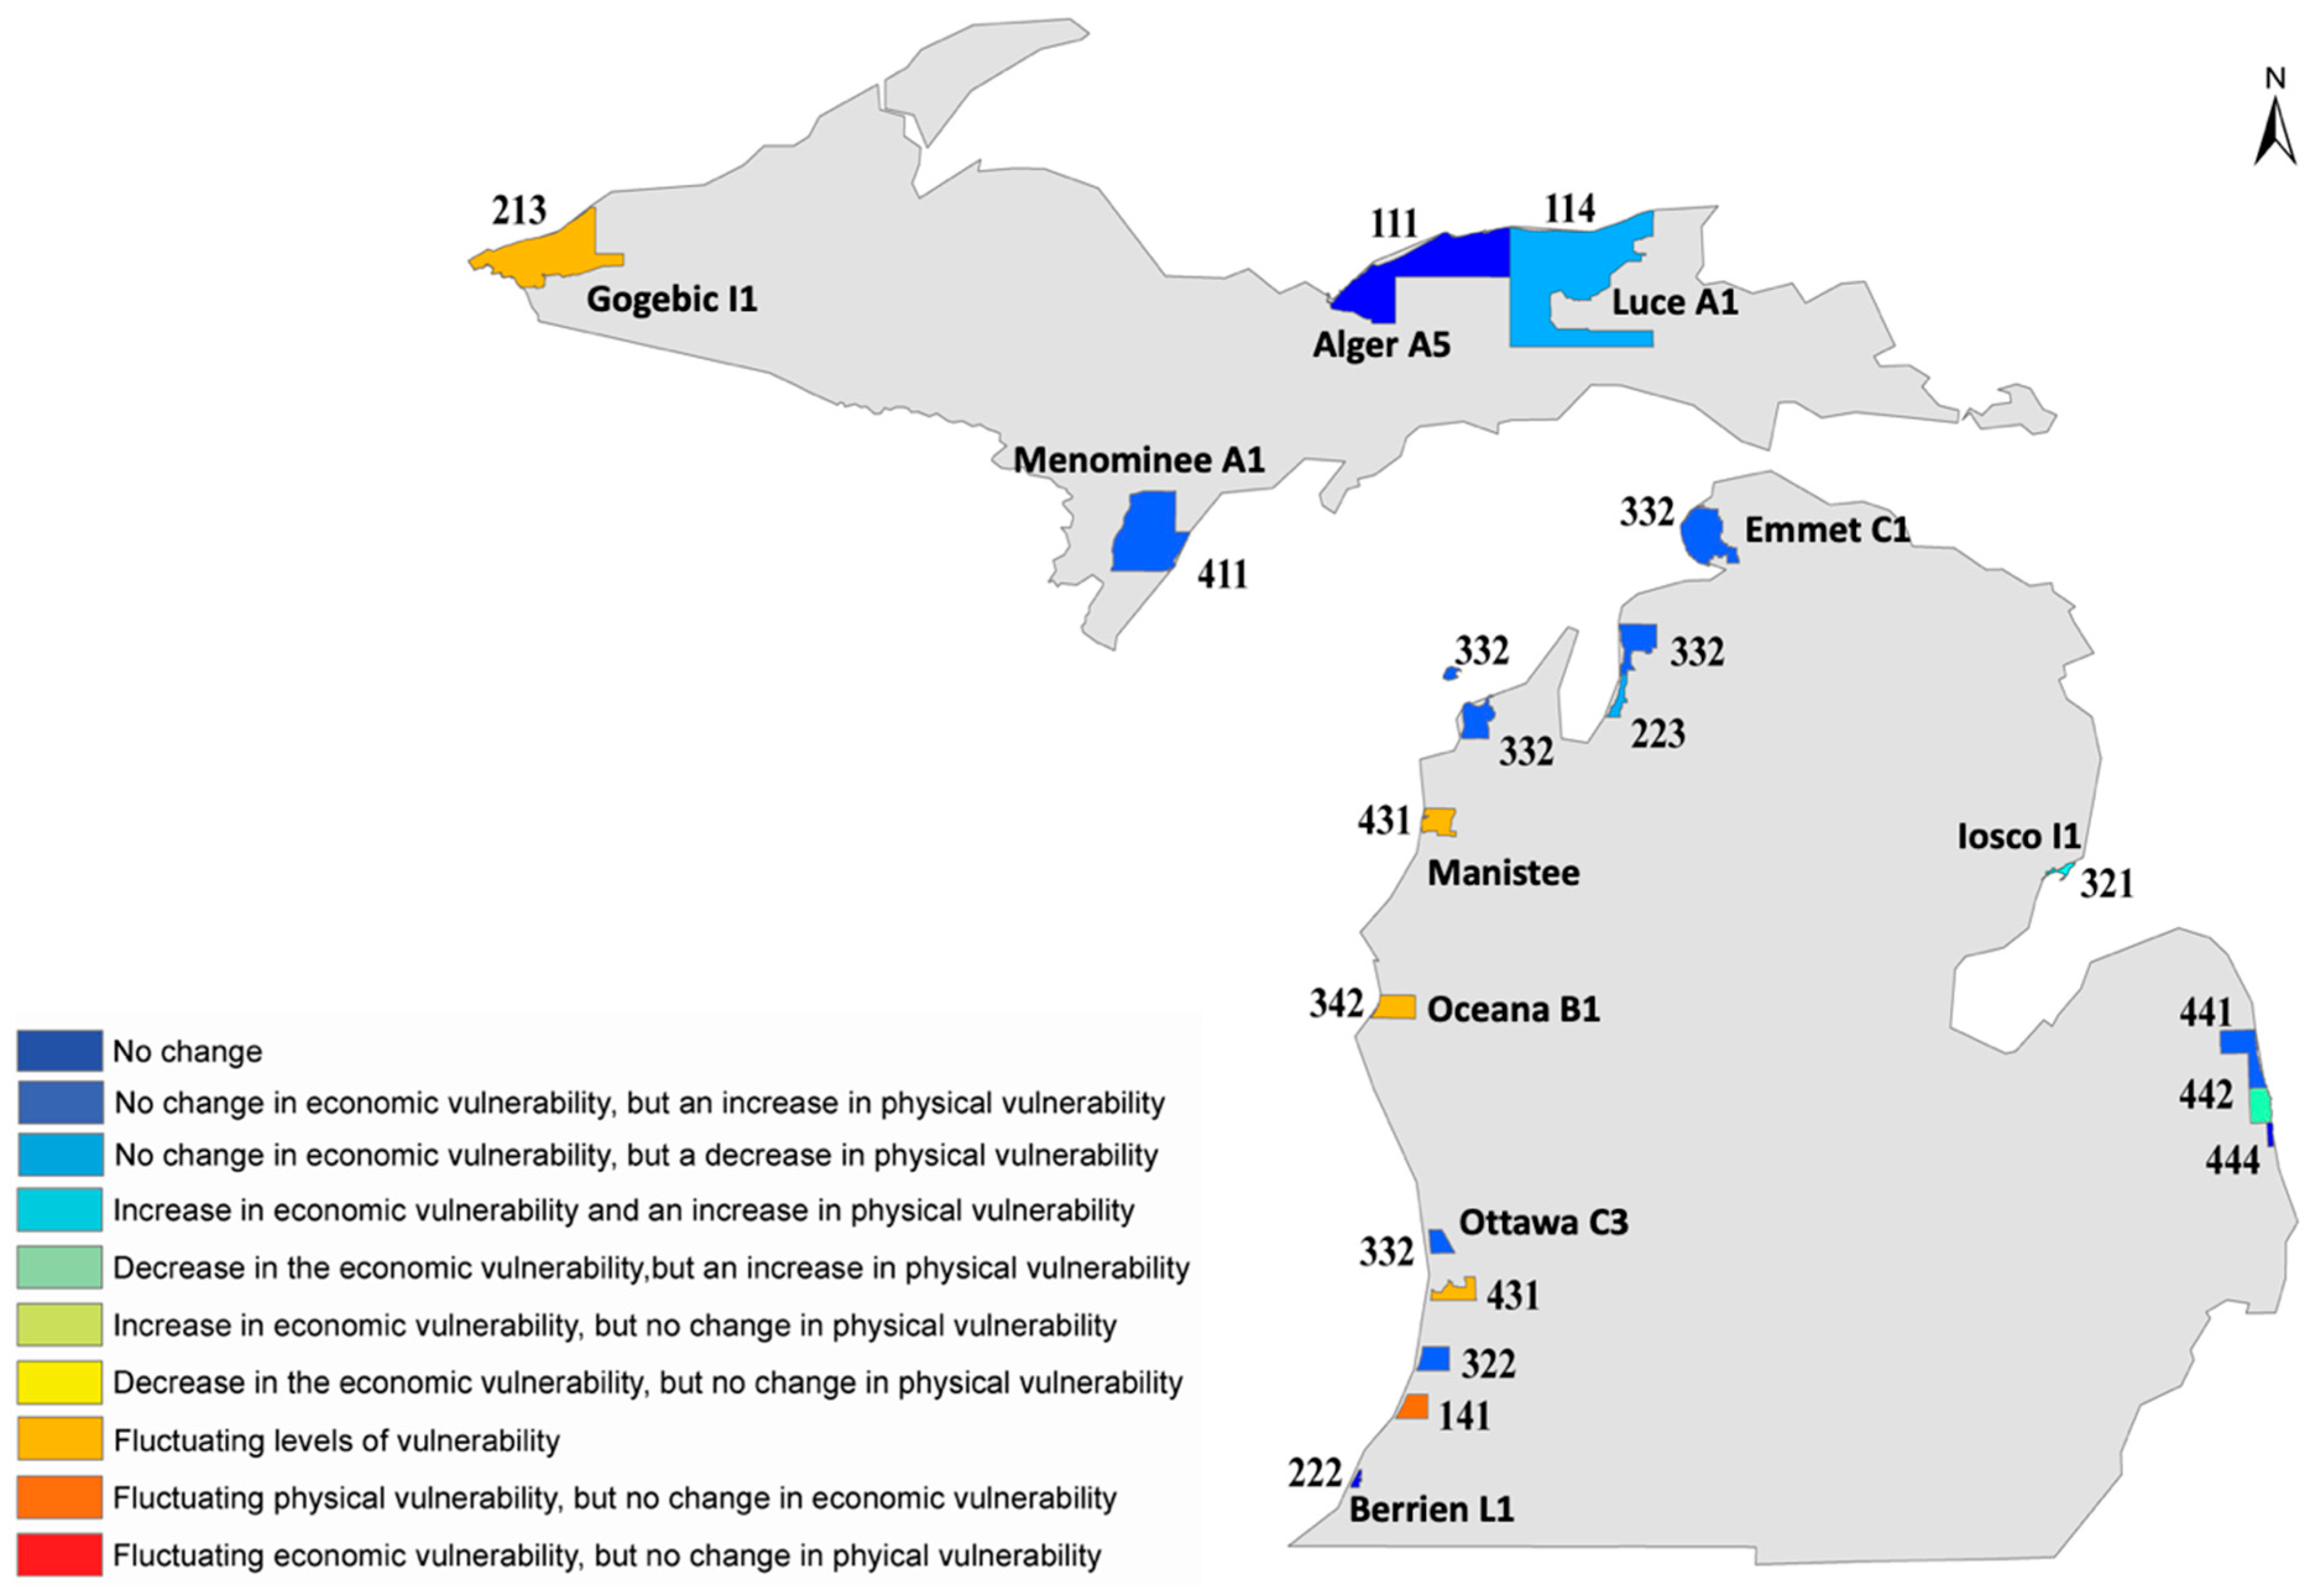
Table 2 presents a change trajectory analysis for the 19 study sites analyzed in this study. Each time period is assigned a change trajectory that is summarized in the second column from the right of the table. The number of digits in the change trajectory represents the number of time periods. In this study, there are three time periods so there are three digits in the change trajectory. A different number for some of the digits represents a change in typology classification in at least one of the three time periods. For example, Allegan A5’s change trajectory is 431 which means it belonged to three different typology categories in each of the three time periods. Alger A5’s change trajectory is 111 which means it belonged to the same typology category in all three time periods.
Figure 7 depicts the location of the study sites with their associated change trajectories. This type of analysis is useful because it helps detect patterns of change over time, which can help identify the drivers of coastal risk whether they be physical, economic or a combination of both. Table 2 and Figure 7 reveal four communities that changed typology classifications due to a combination of physical and economic changes (Allegan A5, Gogebic I1, Manistee, and Oceana B1, (change trajectory code H). For these communities in particular, change trajectories help visualize the complex movements of these locales over time. The Gogebic tract is a bluff shoreline along Lake Superior and is a good example of these changes. In the 2005–2010 time period it was classified in typology category two because it had erosion rates above the HREA designation but was not economically vulnerable. At this time, the area experienced high magnitude bluff erosion, which could have been generated by a storm event on Lake Superior. In the 2010–2014 period, erosion rates slowed but were still above the HREA threshold, so this site remained vulnerable to erosion. At this time, the tract also experienced an increase in economic vulnerability perhaps due to the impacts of the 2008 recession. In the last time period however, this situation changed completely, and the community was classified in typology category three indicating it was neither physically nor economically vulnerable to shoreline change. At this time, bluff retreat ceased and the community recovered economically after the 2008 recession.
The changes of greatest concern are communities that experienced both an increase in erosion rates and an increase in economic vulnerability (change trajectory code D). Tracts with this change trajectory are of concern because their vulnerability to erosion increased but their economic capacity to deal with this enhanced vulnerability declined as well. Only one community, Iosco A1, belongs to this change trajectory. In the 2005–2010 time period, Iosco was classified in typology category three indicating low physical and economic vulnerability. An increase in the erosion rate between 2010 and 2014 moved the site to typology category two. By 2014–2018, the site changed classification categories again and was now classified as highly vulnerable from both a physical and economic perspective.
The change trajectory codes in Table 2 reveal that increasing erosion rates in one or more of the three time periods was a primary driver of typology changes while the economic vulnerability of the community remained unchanged. For example, seven communities changed their location because of a change in erosion rates and no change in economic vulnerability (change trajectory code B). These tracts include Allegan A2, Antrim A1 Banks, Emmet C1, Leelanau A1, Menominee A1, Ottawa C3, and Sanilac F1. The timing of these changes also yields insight into the potential drivers of erosion rate changes. Allegan A2 and Menominee A1 were not vulnerable from 2005–2010 but became vulnerable during the 2010–2014 time period and remained vulnerable through 2014–2018. This could indicate that these 2 sites either responded rapidly to rising water levels in 2014, were impacted by a storm event during that period, or a combination of both. The other sites (Sanilac F1, Ottawa C3, Antrim A1 Banks, Emmet C1, and Leelanau A1) were not vulnerable until 2014 and then became vulnerable in the 2014–2018 period, presumably due to high lake levels in Lakes Michigan and Huron.
A somewhat different series of events are responsible for the change trajectory of the Van Buren A2 tract (change trajectory code I). In the 2005–2010 time period, this tract was classified in typology category one and was highly vulnerable to erosion. This vulnerability changed in the 2010–2014 time period however as erosion rates dropped, moving the tract to typology category four. At this time, the community was economically but not physically vulnerable. In the last time period (2014–2018) however its status changed a third time as erosion rates increased moving the tract from typology category four to typology category one. The high physical vulnerability during the 2005–2010 time period appears to be related to erosion of the foredune that was forming during the low Lake Michigan water levels of the early 2000s. No anomalously large storms occurred during this period; thus, this erosion is likely the result of the typical fall and spring extratropical storms that occur along Lake Michigan. The decline in erosion rates during the 2010–2014 period is likely a reflection of the record low water levels experienced during this period. As water levels jumped from record lows in 2013 to near record highs in 2018, the rate of erosion increased at Van Buren.
Perhaps the most interesting change trajectories among the study sites are those related to changes in typology classification because of declining erosion rates (change trajectory C). There were two of these communities in our sample of tracts, Antrim A1 and Luce A1. Both of these sites were vulnerable to erosion from 2005 to 2014, but then switched to low erosional vulnerability from 2014–2018. This is likely due to patterns of erosion, accretion, and sediment transport at both sites. Antrim A1 is located along a sand spit in Grand Traverse Bay and the decrease in erosion rate appears to be related to migration of a sand spit. This migration is likely fueled by updrift erosion that is providing a sediment source for accretion at this site. A similar scenario occurred at Luce A1 in response to the dominantly eastward-directed alongshore current. The aerial photographs reveal a sand wave that migrates eastward towards the site during the course of our study. This sand wave sources sand to the Luce A1 site during the period from 2014 to 2018, which results in the decrease in erosion rate. Given the migratory nature of the features at Antrim A1 and Luce A1 it is likely that the decrease in erosional vulnerability is only ephemeral and the sites will return to being vulnerable once the sand moves away from the site if high water levels are sustained.

4. Discussion

The results of our analysis highlight the utility of the typology in analyzing change over time. Further, this analytical framework can be applied to all types of coastal communities. To apply the tool only two types of data are needed: erosion rates and income data. From there, it is relatively straightforward to categorize communities into low or high vulnerability based on the methodology outlined in Section 2. This relative ease of calculation, and the focus on the Great Lakes, make this study’s effort at characterizing vulnerability different from prior work. Other studies have used computable general equilibrium (CGE) models to estimate the socio-economic impacts of sea level rise on European Union (EU) member countries. Work in California [44], Israel [45] and the England, Scotland, and Wales [46] have incorporated property value information into their impact or vulnerability assessments. While valuable, the methodologies of these studies are somewhat complex and therefore less accessible to communities.
That said, there were important decisions about the development of this analytical tool that merit additional discussion. One decision about the variables used in the typology was with respect to the economic measure of vulnerability. The discussion of vulnerability to this point has emphasized economic vulnerability based on per capita income. The other relevant economic variable considered was median home value. Both variables were not used because it left some tracts uncategorized. Therefore, to understand changes in vulnerability that may relate to the specification of economic vulnerability, we conducted a sensitivity analysis of results to this aspect of the typology (Table S1). This analysis revealed the choice of economic metric did not alter analytical results.
Another potential source of variation in typology classification results pertains to the definition of erosion rates. In many coastal regions long-term retreat rates are used to define highly vulnerable areas (e.g., Michigan’s High Risk Erosion Areas). While these long-term rates give a sense of the average behavior of a coastal area, they minimize short-term variability introduced by fluctuating lake levels and changes in storm patterns. In the Great Lakes region, quasi-periodic fluctuations in lake level move the position of the shoreline landward or basinward, which concomitantly shifts the zone of storm wave influence [18]. During high lake level phases, this can result in retreat rates that are above the long-term rates, and conversely, during low lake level phases retreat rates can be below long-term rates.
In our study, the random sample of sites documented numerous areas with time-varying shifts in coastal retreat rates related to increases in lake level that started around 2014 (Figure S1). For example, the long-term retreat rate at the Manistee site is −0.65 m/year, however, from 2005–2010 and 2010–2014 the rates were 0.97 m/year and 0.93 m/year, respectively. These positive rates reflect low lake levels and minimal erosion given the basinward position of the shoreline. As Lake Michigan water levels rose, the retreat rate at this site soared to −1.72 m/year for the time period from 2014–2018. This retreat rate during a high lake level phase is more than double the long-term retreat rate, which reflects the increased vulnerability to erosion when water levels are high. Simply using long-term retreat rates as the metric for coastal vulnerability will over or underestimate the true vulnerability of a community by not accounting for short-term changes in erosion rates as well as the influence of socio-economic factors in defining the capacity of a community to address coastal hazard risks.
Given this complexity, it can be difficult for managers and decision-makers to decide where to direct limited resources for protection. Our coastal typology puts forth a proactive analytical tool for addressing this challenge by identifying the most vulnerable coastal communities from a state or regional perspective. Sites that have both high erosion and high economic vulnerability (i.e., typology category one) should be a management priority and take precedence for receiving assistance and resources. Alternatively, sites with high erosion risk, but no socio-economic risk should not be a state or federal funding and management priority as they are likely to have the financial capacity to address their own erosion issues.
These assessments should be made more frequently than on a decadal basis given the movement of many communities within this typology. Annual or biannual assessments of risk using our typology framework would allow coastal managers to adaptively prioritize the allocation of shore protection resources should a community move from one vulnerability level to another. For example, communities in typology two and four could move into category one in future years with a change in lake levels or economic situation. These communities should be monitored closely to evaluate changes in their vulnerability and to determine whether a change in management strategy should be considered.

5. Conclusions

Proactive management and planning along all coastline communities in the Great Lakes is critical now and into the future as fluctuating lake levels, enhanced storm frequency and intensity, and increased development impact the region [47,48]. Planning will encompass understanding spatiotemporal changes in coastal water levels, climate change adaptation approaches, and socioeconomic development [3]. The framework outlined in this paper advances existing work on coastal change and associated vulnerability by providing an analytical tool that may be applied to all types of coastal communities. The application of this framework highlighted the variability in both physical and economic vulnerability of communities along the Great Lakes. Therefore, ongoing assessments of vulnerability are needed to truly understand the needs of these communities as lake levels and economic conditions change over time.

Supplementary Materials

The following are available online at https://www.mdpi.com/2073-445X/9/7/218/s1, Figure S1: Erosion rate over time compared to the long-term mean.; Table S1: Sensitivity Analysis of Typology Construction to the Specification of Economic Vulnerability.

Author Contributions

All authors made substantial contributions to this study. Conceptualization, E.A.M. and E.T.; methodology, E.A.M. and E.T.; formal analysis, E.A.M. and E.T.; data curation E.A.M. and E.T.; writing—original draft preparation, E.A.M., E.T. and E.B.; writing—review and editing, E.A.M., E.T. and E.B.; visualization, E.A.M., E.T. and E.B.; supervision, E.A.M. and E.T.; project administration, E.B.; funding acquisition, E.B. All authors have read and agreed to the published version of the manuscript.

Funding

This research was funded by the National Science Foundation (Award Number: 1939979) project entitled: CoPe EAGER: Development of a Drone-Based Coastal Change Monitoring Program through Citizen Science Partnership and Capacity Building.

Acknowledgments

This research was funded thanks to a grant from the National Science Foundation associated with the Coastlines and People program. There are multiple people and organizations that made this publication possible and the authors wish to express their gratitude, especially to Robert Goodwin and Joseph Welsh from Remote Sensing and GIS Research and Outreach Services (RS&GIS) at Michigan State University for helping to collect the historic imagery and census data. Additionally, we thank the reviewers for their time and effort put into the manuscript review.

Conflicts of Interest

The authors declare no conflict of interest.

References

  1. Chang, S.E.; Yip, J.Z.; Conger, T.; Oulahen, G.; Marteleira, M. Community vulnerability to coastal hazards: Developing a typology for disaster risk reduction. Appl. Geogr. 2018, 91, 81–88. [Google Scholar] [CrossRef]
  2. US EPA. Facts and Figures about the Great Lakes. Available online: https://www.epa.gov/greatlakes/facts-and-figures-about-great-lakes (accessed on 15 April 2020).
  3. Gronewold, A.D.; Fortin, V.; Lofgren, B.; Clites, A.; Stow, C.A.; Quinn, F. Coasts, water levels, and climate change: A Great Lakes perspective. Clim. Chang. 2013, 120, 697–711. [Google Scholar] [CrossRef]
  4. Great Lakes Coastal Resilience Planning Guide Coastal Hazards & Risks. Available online: http://greatlakesresilience.org/climate-environment/coastal-hazards-risks (accessed on 15 April 2020).
  5. Scott, F. Great Lakes Resource at Risk. Environ. Health Perspect. 2005, 113, A164–A173. [Google Scholar] [CrossRef]
  6. Campbell, M.; Cooper, M.J.; Friedman, K.; Anderson, W.P. The economy as a driver of change in the Great Lakes–St. Lawrence River basin. J. Gt. Lakes Res. 2015, 41, 69–83. [Google Scholar] [CrossRef]
  7. Gardner, P. Senate proposes $300 million loan fund for cities battling Great Lakes flooding—mlive.com. mLIVE, 12 March 2020. [Google Scholar]
  8. US Army Corps of Engineers Monthly Bulletin of Great Lakes Water Levels. Available online: https://www.lre.usace.army.mil/Missions/Great-Lakes-Information/Great-Lakes-Water-Levels/Water-Level-Forecast/Monthly-Bulletin-of-Great-Lakes-Water-Levels/ (accessed on 16 April 2020).
  9. Ailworth, E. On Rising Great Lakes, Backyards Are Disappearing Overnight. The Wall Street Journal, 20 February 2020. [Google Scholar]
  10. Gardner, P. Wreckage from shoreline erosion creates hazard on Michigan beaches—mlive.com. mLIVE, 25 February 2020. [Google Scholar]
  11. Reynolds, D. Great Lakes Erosion Destroying Beachfront Homes—CBS News. CBS News. 2020. Available online: https://www.cbsnews.com/news/rising-great-lakes-water-levels-threatening-homes-2020-02-06/ (accessed on 26 February 2020).
  12. Ellison, G. As the Great Lakes surge to record heights, coastal areas face a time of reckoning. mLIVE, 26 March 2020. [Google Scholar]
  13. Dorr, J.A.; Eschman, D.F. Geology of the Great Lakes; University of Michigan Press: Ann Arbor, MI, USA, 1970. [Google Scholar]
  14. Rovey, C.W. Bluff formation and long-term recession rates, southwestern Lake Michigan. In Proceedings of the Geological Society of America, Abstracts with Programs; Geological Society of America, Cincinnati, OH, USA, 26–29 October 1992. [Google Scholar]
  15. Norton, R.K.; Meadows, L.A.; Meadows, G.A. What if (Inland) Sea Levels are Falling... Then Rising... Then Falling…? Climate Change and Shoreland Management on the Laurentian Great Lakes. Geogr. Res. Forum 2014, 34, 59–73. [Google Scholar]
  16. Angel, J.R. Large-Scale Storm Damage on the U.S. Shores of the Great Lakes. J. Gt. Lakes Res. 1995, 21, 287–293. [Google Scholar] [CrossRef]
  17. Komar, P.D. Beach Processes and Sedimentation; Prentice Hall: Kent, OH, USA, 1997; ISBN 0-13-754938-5. [Google Scholar]
  18. Meadows, G.A.; Meadows, L.A.; Wood, W.L.; Hubertz, J.M.; Perlin, M. The relationship between Great Lakes water levels, wave energies, and shoreline damage. Bull. Am. Meteorol. Soc. 1997, 78, 675–684. [Google Scholar] [CrossRef] [Green Version]
  19. Thompson, T.A.; Baedke, S.J. Strand-plain evidence for late Holocene lake-level variations in Lake Michigan. Geol. Soc. Am. Bull. 1997, 109, 18. [Google Scholar] [CrossRef]
  20. Theuerkauf, E.J.; Braun, K.N.; Nelson, D.M.; Kaplan, M.; Vivirito, S.; Williams, J.D. Coastal geomorphic response to seasonal water-level rise in the Laurentian Great Lakes: An example from Illinois Beach State Park, USA. J. Gt. Lakes Res. 2019, 45, 1055–1068. [Google Scholar] [CrossRef]
  21. EGLE. High Risk Erosion Areas: Program and Maps. Available online: https://www.michigan.gov/egle/0,9429,7-135-3311_4114-344443--,00.html (accessed on 16 April 2020).
  22. Martinich, J.; Neumann, J.; Ludwig, L.; Jantarasami, L. Risks of sea level rise to disadvantaged communities in the United States. Mitig. Adapt. Strateg. Glob. Chang. 2013, 18, 169–185. [Google Scholar] [CrossRef] [Green Version]
  23. Revi, A.; Satterthwaite, D.E.; Aragón-Durand, F.; Corfee-Morlot, J.; Kiunsi, R.B.R.; Pelling, M.; Roberts, D.C.; Solecki, W. Urban Areas. In Climate Change 2014: Impacts, Adaptation, and Vulnerability. Part A: Global and Sectoral Aspects. Contribution of Working Group II to the Fifth Assessment Report of the Intergovernmental Panel on Climate Change; Cambridge University Press: Cambridge, UK, 2014; pp. 535–612. [Google Scholar]
  24. Cutter, S.L.; Emrich, C.T.; Webb, J.J.; Morath, D. Social Vulnerability to Climate Variability Hazards: A Review of the Literature; Oxfam America: Washington, DC, USA, 2009; pp. 1–44. [Google Scholar]
  25. Camfield, F.E.; Morang, A. Defining and interpreting shoreline change. Ocean Coast. Manag. 1996, 32, 129–151. [Google Scholar] [CrossRef]
  26. Paterson, S.K.; O’Donnell, A.; Loomis, D.K.; Hom, P. The Social and Economic Effects of Shoreline Change: North Atlantic, South Atlantic, Gulf of Mexico, and Great Lakes Regional Overview; Eastern Research Group Inc.: Lexington, MA, USA, 2010. [Google Scholar]
  27. Buckman, S.; de Alarcon, M.A.; Maigret, J. Tracing shoreline flooding: Using visualization approaches to inform resilience planning for small Great Lakes communities. Appl. Geogr. 2019, 113, 102097. [Google Scholar] [CrossRef]
  28. McLaughlin, S.; McKenna, J.; Cooper, J.A.G. Socio-economic data in coastal vulnerability indices: Constraints and opportunities. J. Coast. Res. 2002, 36, 487–497. [Google Scholar] [CrossRef]
  29. Boruff, B.J.; Emrich, C.; Cutter, S.L. Erosion Hazard Vulnerability of US Coastal Counties. J. Coast. Res. 2005, 932–942. [Google Scholar] [CrossRef] [Green Version]
  30. Beatley, T. Planning for Coastal Resilience: Best Practices for Calamitous Times; Island Press: Washington, DC, USA, 2012. [Google Scholar]
  31. Thomalla, F.; Downing, T.; Spanger-Siegfried, E.; Han, G.; Rockström, J. Reducing hazard vulnerability: Towards a common approach between disaster risk reduction and climate adaptation. Disasters 2006, 30, 39–48. [Google Scholar] [CrossRef]
  32. Dolan, A.H.; Walker, I.J. Understanding vulnerability of coastal communities to climate change related risks. J. Coast. Res. 2006, 1316–1323. [Google Scholar]
  33. Norton, R.K.; Meadows, G.A. Land and water governance on the shores of the Laurentian Great Lakes. Water Int. 2014, 39, 901–920. [Google Scholar] [CrossRef]
  34. Moore, L.J. Shoreline Mapping Techniques. J. Coast. Res. 2000, 16, 111–124. [Google Scholar]
  35. Gronewold, A.D.; Bruxer, J.; Durnford, D.; Smith, J.P.; Clites, A.H.; Seglenieks, F.; Qian, S.S.; Hunter, T.S.; Fortin, V. Hydrological drivers of record-setting water level rise on Earth’s largest lake system. Water Resour. Res. 2016, 52, 4026–4042. [Google Scholar] [CrossRef] [Green Version]
  36. Smith, J.P.; Hunter, T.S.; Clites, A.H.; Stow, C.A.; Slawecki, T.; Muhr, G.C.; Gronewold, A.D. An expandable web-based platform for visually analyzing basin-scale hydro-climate time series data. Environ. Model. Softw. 2016, 78, 97–105. [Google Scholar] [CrossRef] [Green Version]
  37. Gronewold, A.D.; Rood, R.B. Recent water level changes across Earth’s largest lake system and implications for future variability. J. Gt. Lakes Res. 2019, 45, 1–3. [Google Scholar] [CrossRef]
  38. Crowell, M.; Leatherman, S.P.; Buckley, M.K. Historical Shoreline Change: Error Analysis and Mapping Accuracy. Coast. Res. 1991, 7, 839–852. [Google Scholar]
  39. Boak, E.H.; Turner, I.L. Shoreline Definition and Detection: A Review. J. Coast. Res. 2005, 21, 688–703. [Google Scholar] [CrossRef] [Green Version]
  40. Himmelstoss, E.A.; Henderson, R.E.; Kratzmann, M.G.; Farris, A.S. Digital Shoreline Analysis System (DSAS) Version 5.0 User Guide; U.S. Geological Survey: Reston, VA, USA, 2018; p. 110.
  41. Cutter, S.L. The vulnerability of science and the science of vulnerability. Ann. Assoc. Am. Geogr. 2003, 93, 1–12. [Google Scholar] [CrossRef]
  42. Shellenbarger, P. Shifting Middle-Class Fortunes Transform Michigan’s ‘Cottage on the Lake’ Lifestyle|Bridge Magazine. Bridge, 16 July 2013. Available online: https://www.bridgemi.com/economy/shifting-middle-class-fortunes-transform-michigans-cottage-lake-lifestyle(accessed on 17 April 2020).
  43. Krupa, G. Crumbling Great Lakes Shorelines Have Residents Moving Homes to Safety. Available online: https://www.detroitnews.com/story/news/local/michigan/2020/01/23/crumbling-great-lakes-shorelines-have-residents-moving-homes-safety/4466621002/ (accessed on 17 April 2020).
  44. Erikson, L.; Barnard, P.; O’Neill, A.; Wood, N.; Jones, J.; Finzi Hart, J.; Vitousek, S.; Limber, P.; Hayden, M.; Fitzgibbon, M. Projected 21st century coastal flooding in the southern california bight. part 2: Tools for assessing climate change-driven coastal hazards and socio-economic impacts. J. Mar. Sci. Eng. 2018, 6, 76. [Google Scholar] [CrossRef] [Green Version]
  45. Felsenstein, D.; Lichter, M. Social and economic vulnerability of coastal communities to sea-level rise and extreme flooding. Nat. Hazards 2014, 71, 463–491. [Google Scholar] [CrossRef]
  46. Kantamaneni, K.; Phillips, M.; Thomas, T.; Jenkins, R. Assessing coastal vulnerability: Development of a combined physical and economic index. Ocean Coast. Manag. 2018, 158, 164–175. [Google Scholar] [CrossRef]
  47. Climate Change in the Great Lakes Region Fact Sheet. Available online: http://glisa.umich.edu/media/files/GLISA%202%20Pager%202019.pdf (accessed on 15 April 2020).
  48. Wuebbles, D.; Cardinale, B.; Cherkauer, K.; Davidson-Arnott, R.; Hellmann, J.J.; Infante, D.; Johnson, L.; de Loë, R.; Lofgren, B.; Packman, A.; et al. An Assessment of the Impacts of Climate Change on the Great Lakes; Environmental Law & Policy Center: Chicago, OH, USA, 2019. [Google Scholar]
Figure 1. Study Area.
Land 09 00218 g001
Figure 2. Example of method for erosion line mapping from Van Buren A2. The background aerial image is from 2018 and was downloaded from the United States Geological Survey (USGS) Earth Explorer.
Land 09 00218 g002
Figure 3. Typology for Assessing Vulnerability.
Land 09 00218 g003
Figure 4. Physical and Socioeconomic Vulnerability from 2005–2010. Note: The colors are designed to match the typology in Figure 3.
Land 09 00218 g004
Figure 5. Physical and Socioeconomic Vulnerability from 2010–2014. Note: The colors are designed to match the typology in Figure 3.
Land 09 00218 g005
Figure 6. Physical and Socioeconomic Vulnerability from 2014–2018. Note: The colors are designed to match the typology in Figure 3.
Land 09 00218 g006
Figure 7. Typology Change Trajectories.
Land 09 00218 g007
Table 1. Data Description and Sources.
DescriptionSource
Retreat RateRate of coastal erosion (−0.305 m/year) as measured by change in the position of the erosion hazard line through timeErosion hazard line manually digitized from U.S. Department of Agriculture National Agriculture Imagery Program aerial photography.
Per Capita Income (2006–2010)Per Capita Income in the Past 12 Months (in 2010 Inflation-Adjusted Dollars)2006–2010 American Community Survey Data from the U.S. Census
Per Capita Income (2010–2014)Per Capita Income in the Past 12 Months (in 2014 Inflation-Adjusted Dollars)2010–2014 American Community Survey Data from the U.S. Census
Per Capita Income (2014–2018)Per Capita Income in the Past 12 Months (in 2018 Inflation-Adjusted Dollars)2014–2018 American Community Survey Data from the U.S. Census
Median Building AgeMedian Year Structure Built: All Housing Units2006–2010; 2010–2014; 2014–2018 American Community Survey Data from the U.S. Census
Median Home ValueMedian Value (Dollars) Owner-occupied Housing Units2006–2010; 2010–2014; 2014–2018 American Community Survey Data from the U.S. Census
Race/EthnicityRace/Ethnicity for the Total Population2006–2010; 2010–2014; 2014–2018 American Community Survey Data from the U.S. Census
AgeSex by Age (Total population)2006–2010; 2010–2014; 2014–2018 American Community Survey Data from the U.S. Census
Owner and renter occupiedTenure for Occupied Housing Units2006–2010; 2010–2014; 2014–2018 American Community Survey Data from the U.S. Census
Table 2. Change Trajectory of Typology.
2005–2010 Time Period2010–2014 Time Period2014–2018 Time PeriodChange Trajectory Classification
Typology Change Trajectory Code Typology Change Trajectory CodeTypology Change Trajectory CodeChange Trajectory Code *
Alger A5110011011111A
Allegan A2330022022322B
Allegan A5440033011431H
Antrim A1220022033223C
Antrim A1 Banks330033022332B
Berrien L1220022022222A
Emmet C1330033022332B
Gogebic I1220011033213H
Iosco I1330022011321D
Leelanau A1330033022332B
Luce A1110011044114C
Manistee C1 and C2440033011431H
Menominee A1440011011411B
Oceana B1330044022342H
Ottawa C3330033022332B
Sanilac F1440044011441B
Sanilac G2440044044444A
Sanilac J1440044022442E
Van Buren A2110044011141I
*: The meaning code may be interpreted as follows: A = No change; B = No change in economic vulnerability, but an increase in physical vulnerability; C = No change in economic vulnerability, but a decrease in physical vulnerability; D = Increase in economic vulnerability and an increase in physical vulnerability; E = Decrease in economic vulnerability and an increase in physical vulnerability; F = Increase in economic vulnerability, but no change in physical vulnerability; G = Decrease in economic vulnerability, but no change in physical vulnerability; H = Fluctuating level of vulnerability; I = Fluctuating physical vulnerability, but no change in economic vulnerability; I = Fluctuating economic vulnerability, but no change in physical vulnerability.

