Article

Spatial Variation in Environmental Impacts of Sugarcane Expansion in Brazil

Group Energy & Resources, Copernicus Institute of Sustainable Development, Utrecht University, Princetonlaan 8a, 3584 CB Utrecht, The Netherlands
*
Author to whom correspondence should be addressed.
Land 2020, 9(10), 397; https://doi.org/10.3390/land9100397
Submission received: 23 September 2020 / Revised: 15 October 2020 / Accepted: 16 October 2020 / Published: 20 October 2020
(This article belongs to the Special Issue Bioenergy and Land)

Abstract

:
In the past decades, sugarcane production in Brazil has expanded rapidly to meet increasing ethanol demand. The large majority of this expansion occurred in Sao Paulo state. We used an integrated approach considering location-specific biophysical characteristics to determine the environmental impacts of sugarcane expansion and their spatial variation in Sao Paulo state (2004–2015). The included environmental impacts are greenhouse gas (GHG) emissions, biodiversity, soil erosion, and water quantity. All impacts were integrated into a single environmental performance index to determine trade-offs between impacts. Our results show a strong spatial variation in environmental impacts and trade-offs between them. The magnitude and direction of these impacts are mostly driven by the type of land use change and by the heterogeneity of the biophysical conditions. Areas where expansion of sugar cane has resulted in mostly negative environmental impacts are located in the center and east of the state (related to the change of shrublands, eucalyptus, and forest), while areas where sugar cane expansion has resulted in positive impacts are located in the center-west and north (related to the change of annual crops). Identifying areas with mainly positive and negative impacts enables the development of strategies to mitigate negative effects and enhance positive ones for future sugarcane expansion.

1. Introduction

The use of biomass for energy purposes is recognized as a key pillar for the reduction of greenhouse gas emissions (GHG) and meeting worldwide climate change mitigation targets [1,2,3]. In the past years, global biofuel production has increased from 37.5 thousand tons of oil equivalents (ktoe) in 2007 to 84.1 ktoe in 2017, and this trend is expected to continue [2]. Ethanol accounts for the largest share of biofuel production, with Brazil positioned as the world’s second largest producer after the USA [4,5]. Brazil produces ethanol primarily from sugarcane and has developed an efficient model to produce sugar and ethanol in an integrated manner [6]. This development has led to an increase in sugarcane production and triggered more than 5.2 million hectares of land to be converted at the country level between 2000 and 2018 [7].
The sustainability of the Brazilian ethanol sector has been the object of political and societal debate. Despite the potential social, economic, and environmental benefits [5] associated with biofuel production, there are also major concerns about the sector’s sustainability performance [8]. Many of the concerns are related to the environmental impacts of land use change (LUC) directly or indirectly caused by sugarcane expansion, and include, e.g., deforestation, habitat loss, soil erosion, GHG emissions, and impacts on water availability and quality [8,9,10]. Therefore, in recent years, major attention has been given to monitor and assess the impacts of sugarcane expansion on biodiversity, soil, water, and GHG emissions [8,9,11].
Several studies have assessed the GHG balance of land conversion to sugarcane plantations. Some studies found a net decrease in soil carbon stocks when land, such as forest and pasture, is converted to sugarcane [12,13,14,15,16]. However, sugarcane expansion can also result in a net increase of soil carbon stocks, e.g., when sugarcane expands in (former) cropland area [17,18]. Additionally, for biomass carbon stocks, both losses and accumulation have been reported depending on the prior land uses [13,19,20].
LUC is recognized as one of the main causes of biodiversity loss [21]. In Brazil, habitat loss [22], ecosystem fragmentation [23], and deterioration of ecosystem services [24] are some of the main biodiversity impacts of sugarcane expansion. Sugarcane expansion has reduced the extent of important ecosystems, such as the Brazilian Atlantic forest [25] and the Cerrado [23]. Considering that Brazilian sugarcane plantations are generally homogeneous and with low species abundance [26], expansion of sugarcane plantations can result in biodiversity loss [27]. However, sugarcane expansion on degraded pasturelands has shown no negative impacts on biodiversity [28].
Soil degradation is identified as one of the major threats for the sustainability of the sugarcane sector [9,29]. The expansion of sugarcane cultivation has been reported to result in soil compaction, increases in soil erosion risk, and land degradation [12,30,31,32]. However, a slight increase in soil quality was reported when sugarcane expanded in degraded pasturelands [33].
Effects on water availability have been a significant concern for sugarcane [34]. A decline of water availability at the regional level can be prompted by the expansion of sugarcane plantations, particularly in water-stressed areas [30,35]. Sugarcane expansion can also alter the hydrological cycle [9]. For example, the precipitation regime in the Brazilian Cerrado was disrupted as consequence of changes in evapotranspiration rates from sugarcane expansion [36]. There are suggestions that impacts on the water balance from sugar expansion are more acute on a local level than on a regional level [37,38].
So far, the assessments of environmental impacts of sugarcane expansion have focused on single impact categories. In addition, the effect of location-specific biophysical conditions, which steer the magnitude and direction of LUC-related environmental impacts, is not commonly considered. Moreover, although there are likely trade-offs between the various environmental impacts, these have not been assessed up until now. It is expected that sugarcane expansion will increase, driven by ethanol demand. Brazil’s annual ethanol production is projected to increase from 36.5 billion liters in 2019 [39] to 43–54 billion liters by 2030 [40,41]. Therefore, an integrated assessment of sugarcane LUC-related environmental impacts (and trade-offs between impacts) while considering location-specific biophysical conditions from historical sugarcane land use dynamics is necessary to mitigate future negative effects of sugarcane expansion, and enhance positive ones.
The objective of this study was to assess the spatial variation in environmental impacts of sugarcane expansion. Four key environmental impacts (i.e., CO2 emissions, soil erosion, water shortage, and biodiversity) were taken into consideration. In addition, these indicators were integrated into one environmental performance index to identify sugarcane expansion areas that result in mainly positive or negative impacts. This assessment is demonstrated for sugarcane expansion in Sao Paulo state between 2004 and 2015. Sao Paulo state, located in the southeast of Brazil, was selected as a case study since it is responsible for the majority of sugarcane production in the country [7]. Sao Paulo state has experienced an expansion of approximately 1.8 million hectares of sugarcane in the last decade [7], and it is responsible for 64% and 48% of the country sugar and ethanol production, respectively [39]. This study can support the understanding of the direction, magnitude, and trade-offs between environmental impacts of sugarcane expansion, and thereby contribute to developing and improving sound land use planning policies for sustainable sugarcane expansion in the future.

2. Materials and Methods

The environmental impacts from sugarcane expansion in comparison to the land use/cover prior to conversion were assessed for each year within the time period 2004–2015 and then presented as cumulative results for the entire time period. The assessment was carried out considering the heterogeneity of biophysical conditions at a spatial resolution of 1 km2 and was limited to sugarcane expansion areas. The spatial approach applied in this study was developed within a geographical information system (GIS). LUC-related CO2 emissions were assessed following the 2006 IPCC Guidelines for National Greenhouse Gas Inventories (IPCC 2006) [42], given the changes in the above and belowground biomass (AGB and BGB) and soil organic carbon (SOC). Impacts on biodiversity were assessed by estimating the difference in the mean species abundance (MSA) index of each land use/cover category [43]. Impacts on soil erosion were quantified with the revised universal soil loss equation (RUSLE) [44]. Impacts on water quantity were quantified using a water balance approach (difference between evapotranspiration rates and effective precipitation) [45]. These four environmental impacts were integrated by standardizing the results of each impact and combining the standardized scores with equal weights into an environmental performance index.

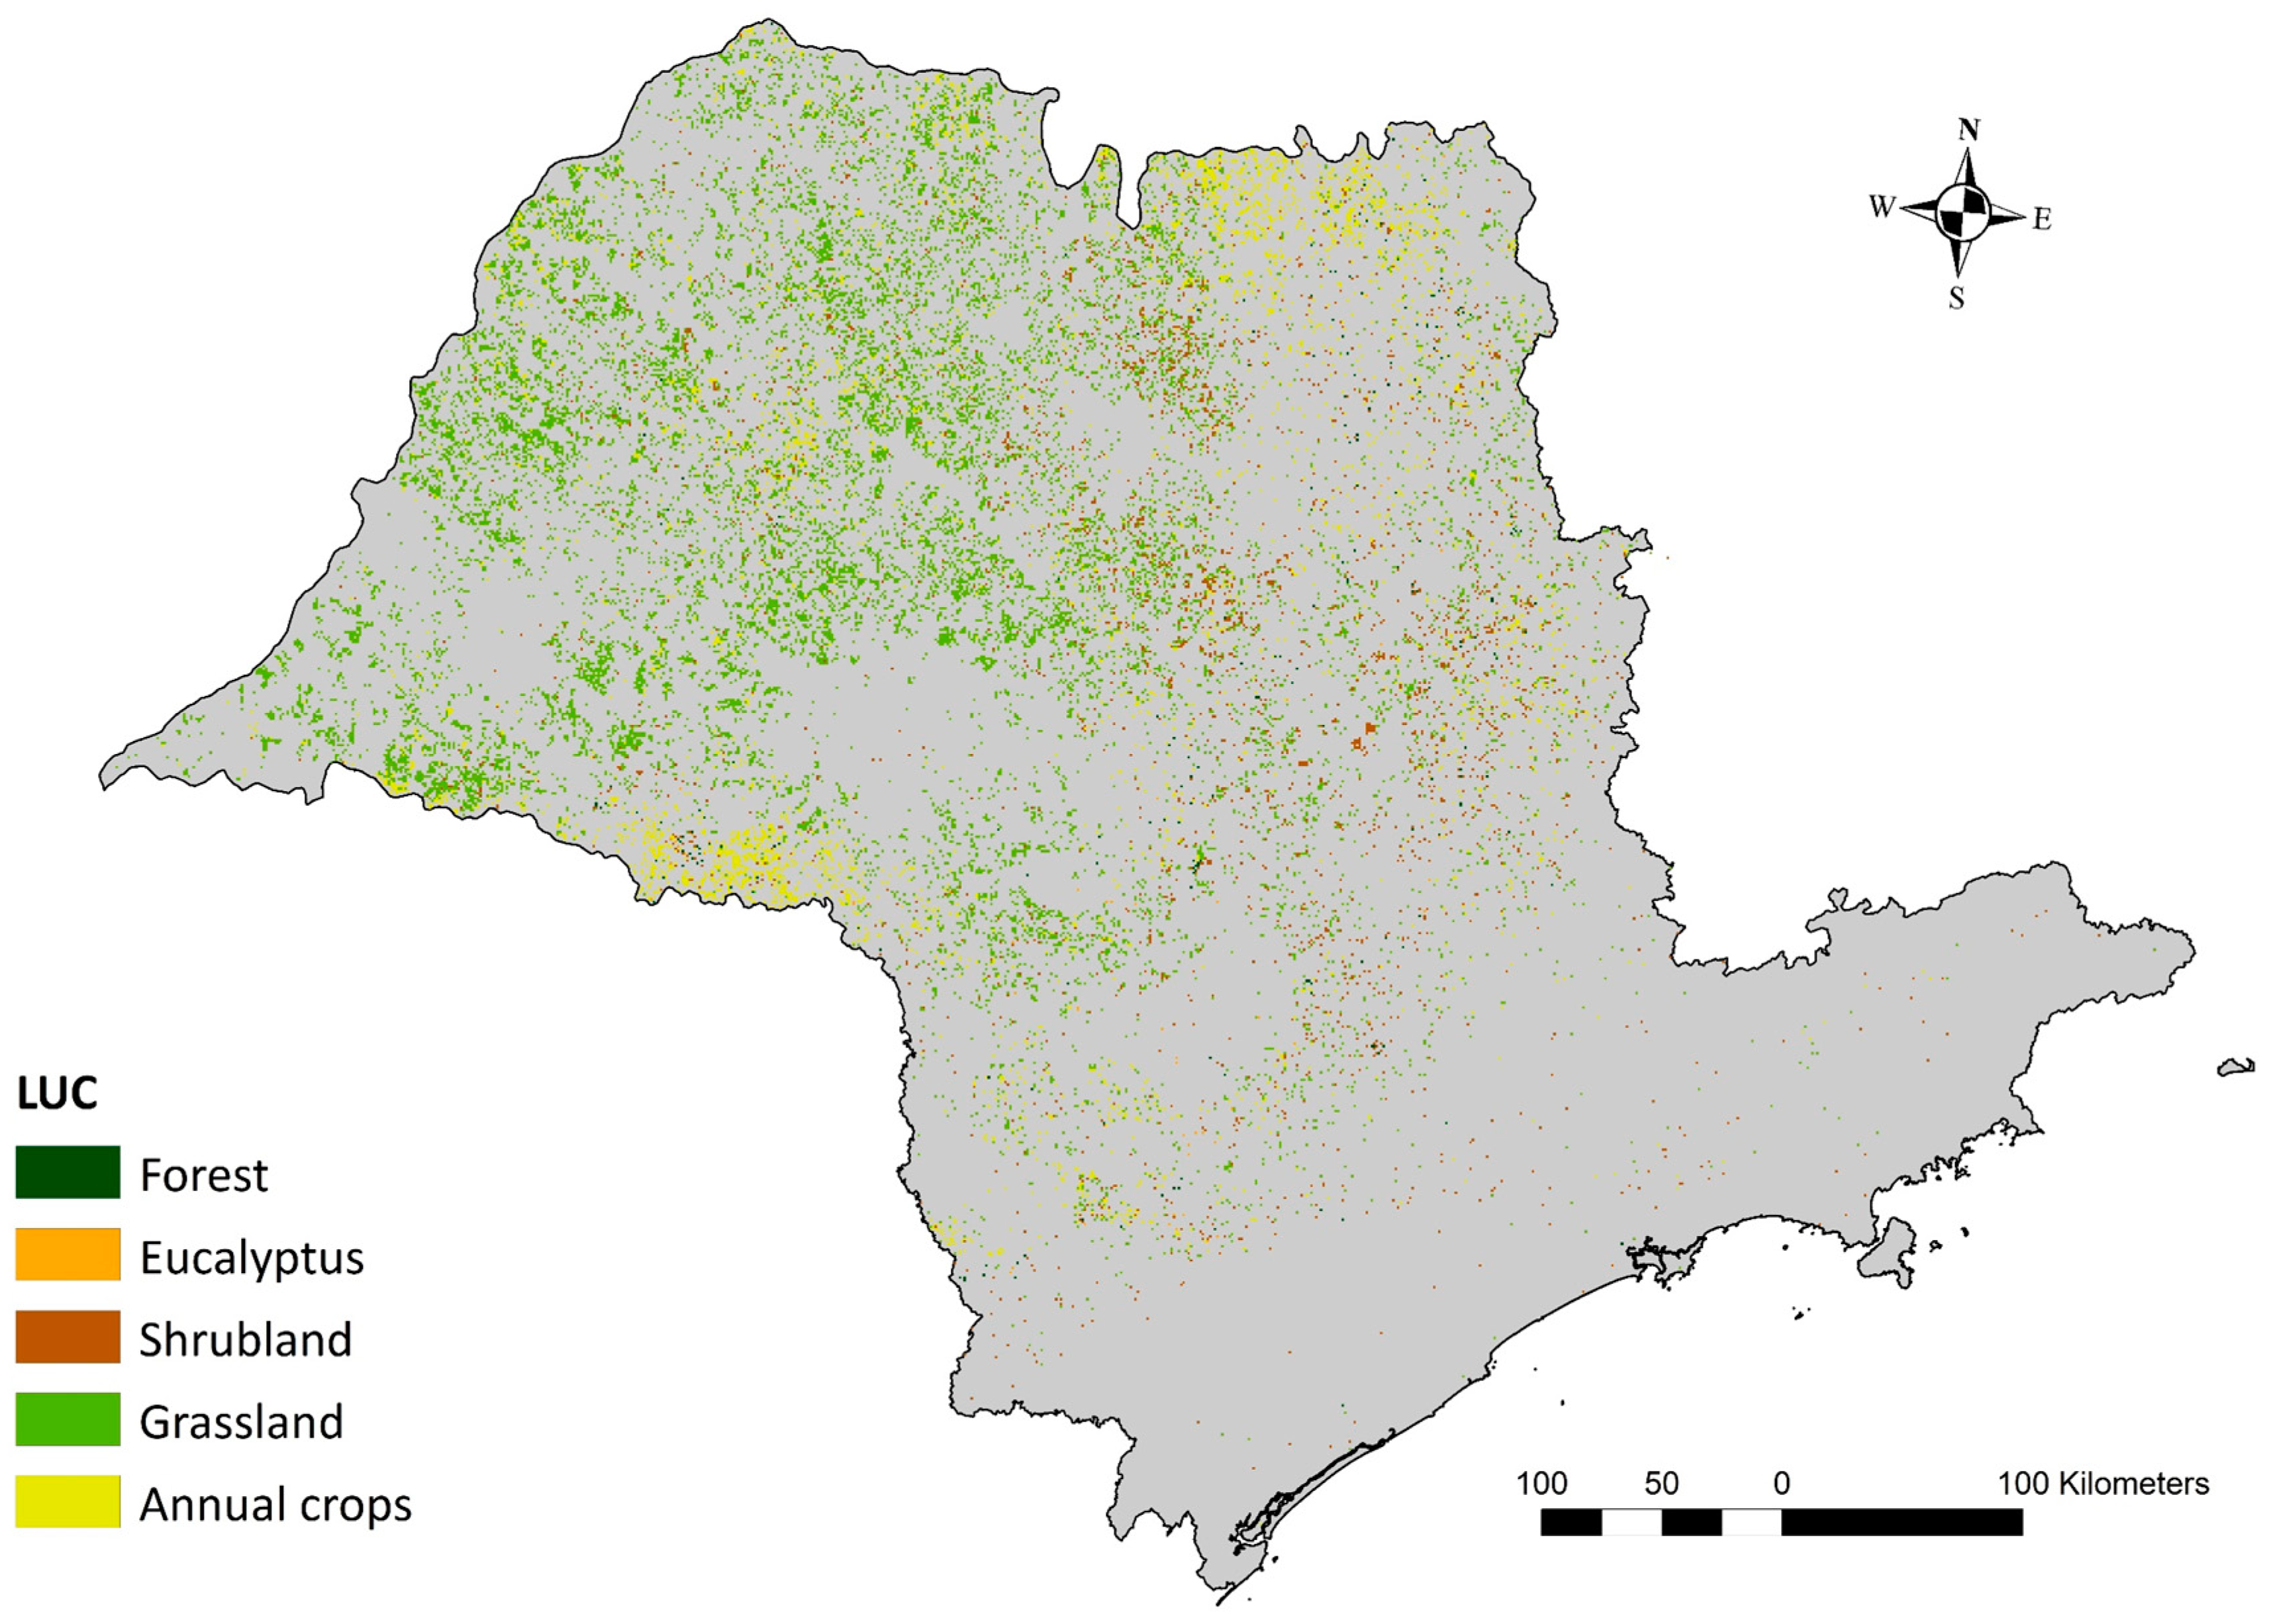
2.1. Land Use Change Dynamics

Assessing the annual changes in land use/cover enables identification for each year of the location, the amount, and type of land use/cover that changes to sugarcane. This is a prerequisite to determine the LUC-related environmental impacts. The annual expansion of sugarcane was determined spatially explicitly for each year by identifying the areas that changed from any type of land use/cover in one year to sugarcane cultivation in the subsequent year. Land use/cover data was obtained from TUDelft [46]. The data set distinguishes 10 land use/cover categories: Urban, water, forest, mid vegetation, low vegetation, annual crops, sugarcane, sugarcane under renovation, eucalyptus, and harvested eucalyptus. The accuracy ranges between 70% and 90%, depending on the land use/cover type [46]. “Low vegetation” refers to mostly unmanaged grasslands and rangeland with predominant grass cover while “mid vegetation “refers to dense shrubland and woodland with low crown cover, including dense foliage/mid biomass rangeland but also fruit crops, such as citrus [46]. For the purpose of this study, the categories “low vegetation” and “mid vegetation” were considered as grasslands and shrublands, respectively. The “forest” category corresponds to dense foliage/high biomass species with high crown cover, with native forest being the most occurring case [46]. “Harvested eucalyptus” refers to eucalyptus plantations that are harvested but remain in use as eucalyptus plantations. In this study, “eucalyptus” and “harvested eucalyptus” were combined to a single land use/cover category. Sugarcane under renovation relates to the ratoon cycle of sugarcane and refers to the sugarcane areas that are replanted. “Sugarcane” and “sugarcane under renovation” were also combined into one land use/cover category.

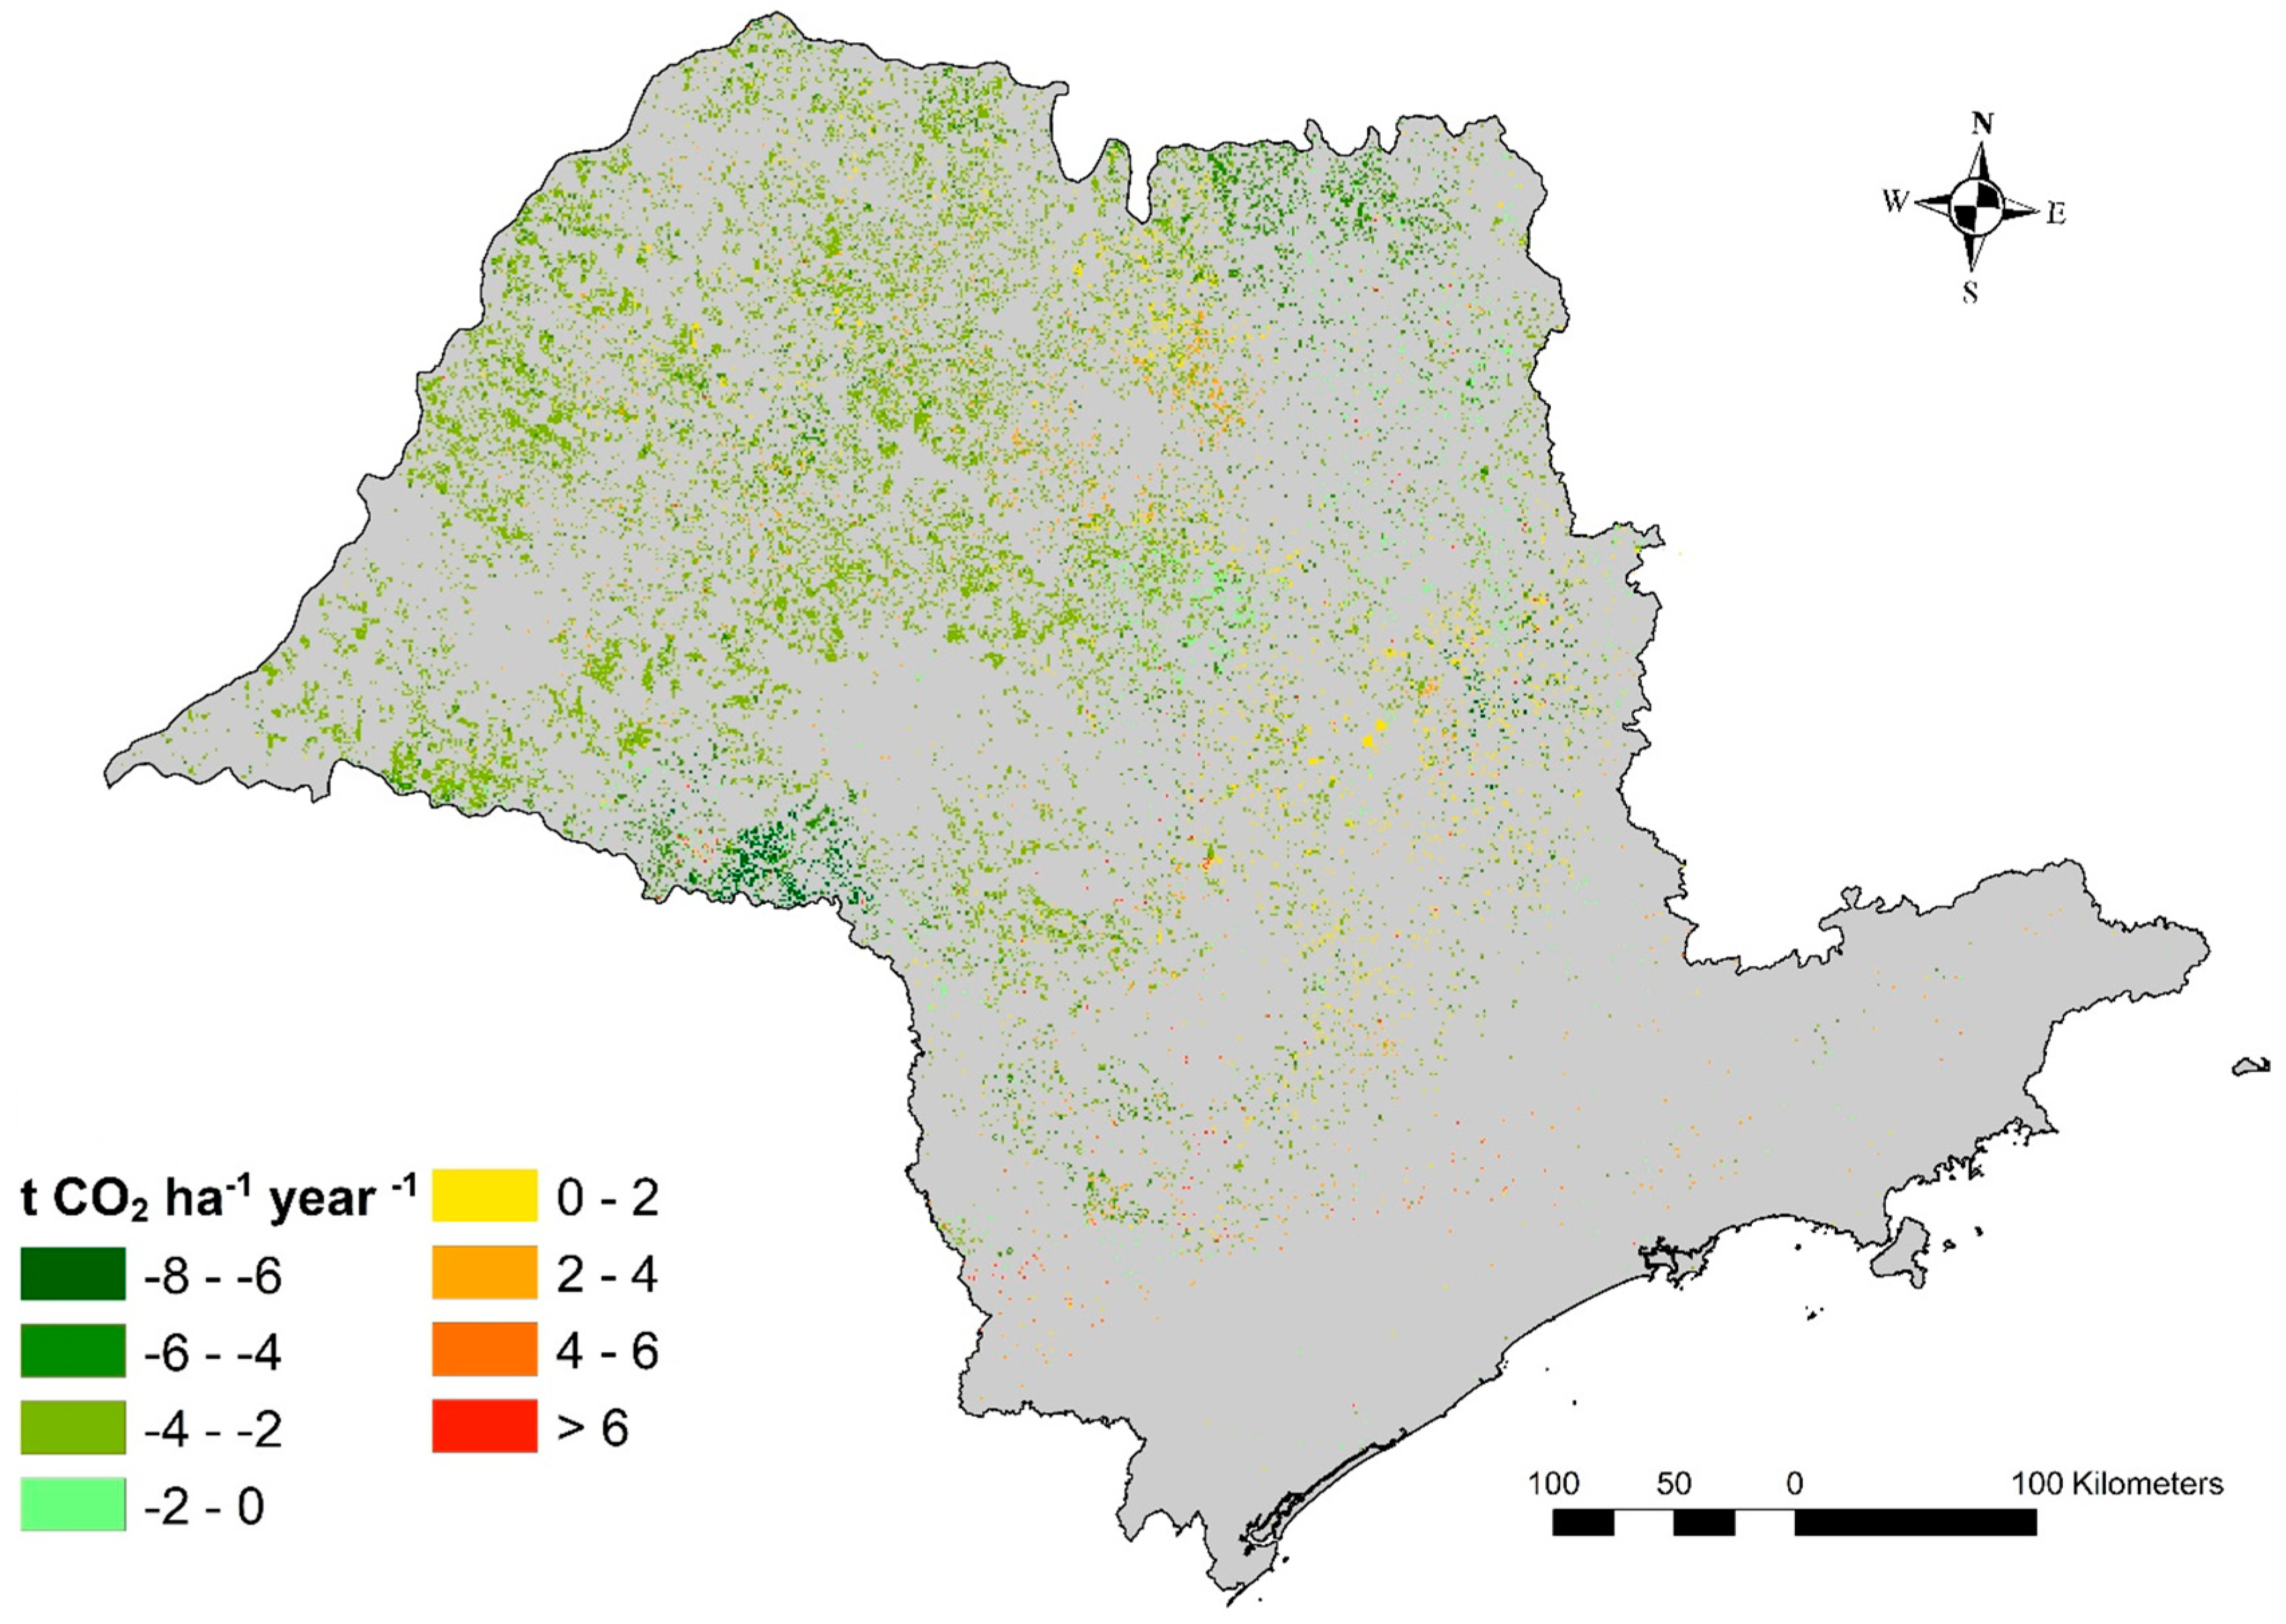
2.2. LUC-Related CO2 Emissions

LUC-related CO2 emissions result from carbon stock changes in biomass (above and below ground), dead organic matter, litter, harvested wood products, and soils (SOC) [42]. These carbon stock changes are mainly driven by the conversion from one land use/cover to another and can lead to carbon accumulation or loss. To quantify the LUC-related CO2 emissions from sugarcane expansion, the IPCC 2006 guidelines [42] were applied spatially explicitly. The stock difference method with a combined tier 1 and tier 2 approach was used to assess inter-annual carbon stock changes. Under tier 1, dead organic matter and litter stocks are assumed to be zero, and the carbon stock of harvested wood products is not relevant given the scope of this study. Therefore, only the biomass and SOC pools were considered in this assessment. The tier 2 approach was used only for the biomass carbon pool given the availability of specific biomass data. Equation (1) represents the stock difference method. For each year, the difference in carbon stock was calculated for all areas converted to sugarcane. Consistent with IPCC guidelines, an amortization period of 20 years was assumed for carbon pools. Therefore, effects on the carbon pools from LUC were calculated over a 20-year time horizon and are presented in t CO2 ha−1year−1:
C O 2   L U C = C t 2 C t 1 T ( 44 12 )
where:
  • CO2LUC = LUC-related CO2 emissions from sugarcane expansion, t CO2 ha−1year−1;
  • Ct1 = Carbon stock in land use prior to conversion, t ha−1;
  • Ct2 = Carbon stock in sugarcane land use after conversion, t ha−1;
  • T = Amortization period, years;
  • 44/12 = Conversion factor to convert C to CO2.

2.2.1. Biomass Carbon Stocks

To determine the CO2 emissions from changes in the biomass carbon pool, the biomass carbon stock was quantified spatially explicitly for each land use/cover category. The AGB was estimated for sugarcane, grasslands, and shrublands land use/cover categories making use of agroecological suitability maps [47,48] and pan-tropical biomass maps for forest [49]. BGB was derived as a function of the above ground biomass for every land use/cover category using IPCC climate-zone-dependent root-to-shoot ratios (R) [42]. Vegetation type-specific carbon fraction (CF) coefficients were employed to obtain biomass carbon stocks. For eucalyptus, no agro-ecological suitability or pan-tropical biomass maps were available to quantify biomass spatially explicitly. Therefore, the spatial variation in biomass carbon in eucalyptus was solely based on the IPCC default values for the four climate regions in Sao Palo State (i.e., tropical wet, tropical moist, tropical montane, and temperate). For annual crops, 4.7 t ha−1 of carbon were assumed in the biomass carbon stock [42]. The employed parameters are summarized in Table S1 from the Supplementary Material.

2.2.2. Soil Organic Carbon Stocks

Changes in soil organic carbon were assessed by comparing the SOC levels of the land use/cover prior to conversion with the SOC levels of sugarcane after conversion. The IPCC 2006 default values for SOC were assigned to each land use/cover based on the stratification of climate regions and soil types. IPCC soil stock change factors were used to account for the effect of land use, management regime, and organic amendment (see Equation (2)). The soil stock change factors were assigned considering Brazil’s land use and management conditions. Table S2 in the Supplementary Material summarizes the assigned stock change factors for each land use/cover category:
S O C x   = S O C r e f F L U ,   x F M G ,   x F I ,   x
where:
  • SOCx = Soil organic carbon stock for land under land use/cover type x, t C ha−1;
  • SOCref = The reference carbon stock, t C ha−1;
  • FLU = Stock change factor for land use system x, unitless;
  • FMG = Stock change factor for management regime for land use/cover x, unitless;
  • FI = Stock change factor for input of organic matter for land use/cover x, unitless.

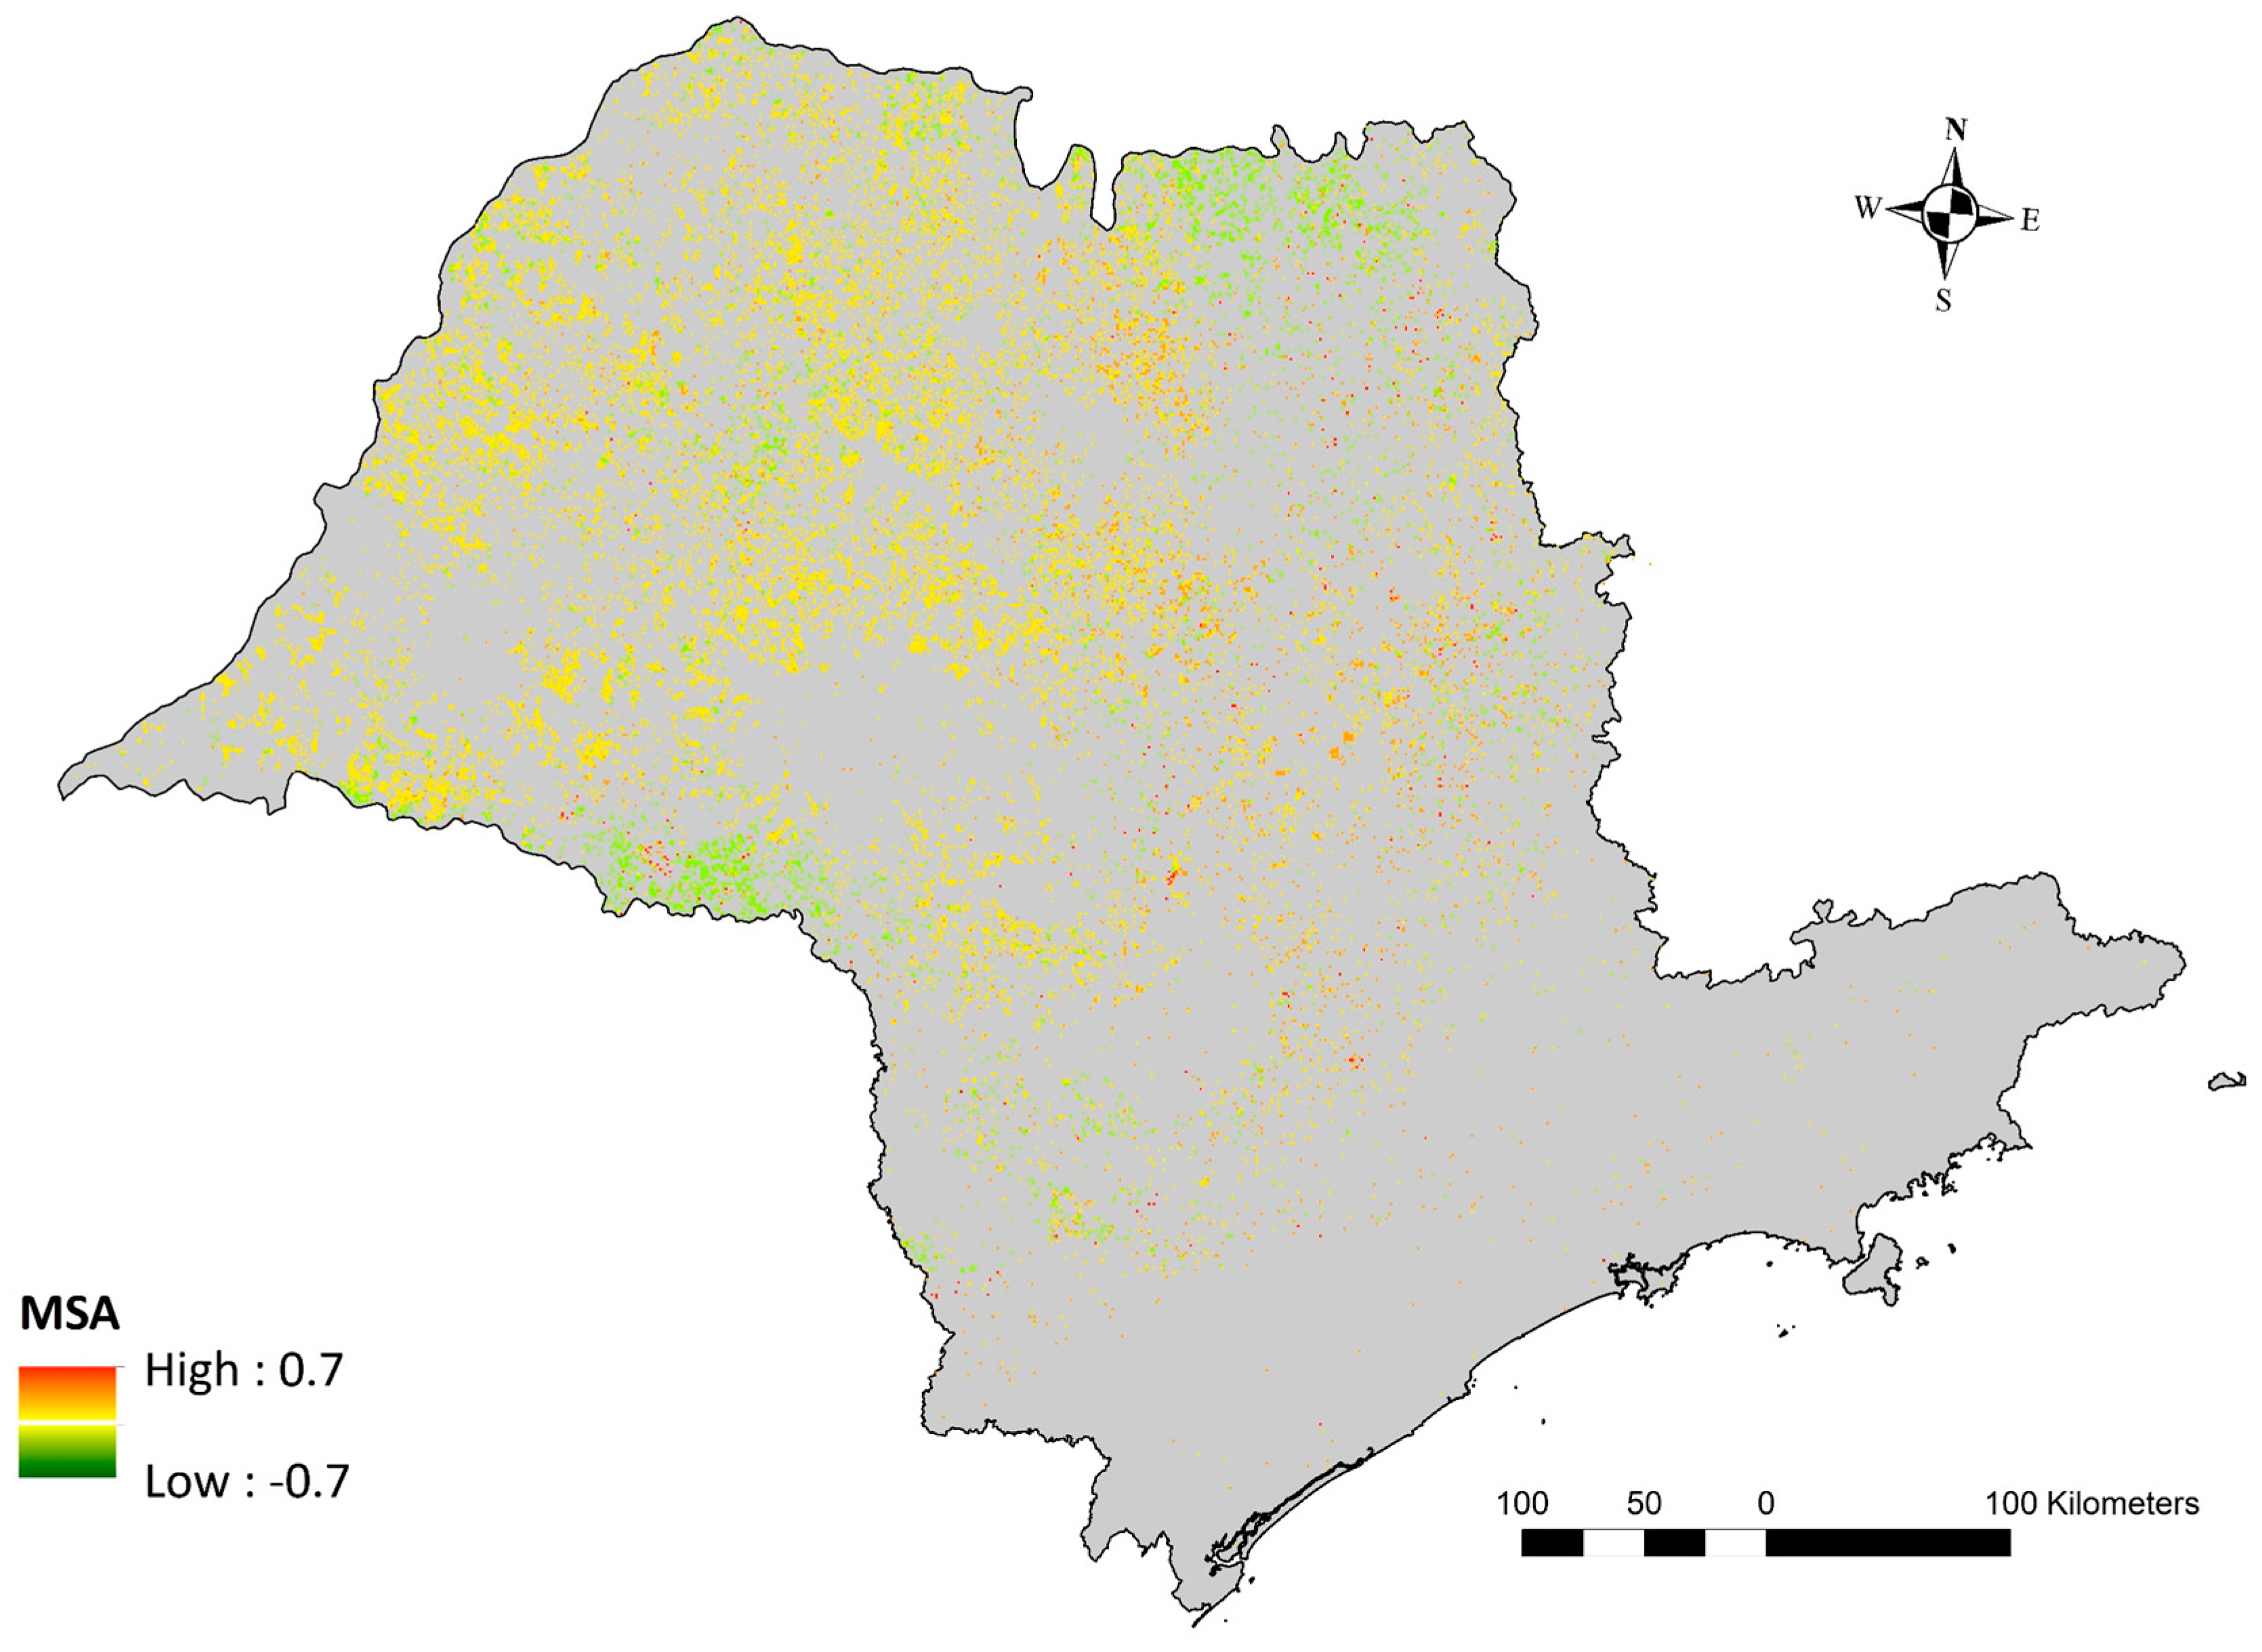
2.3. Mean Species Abundance
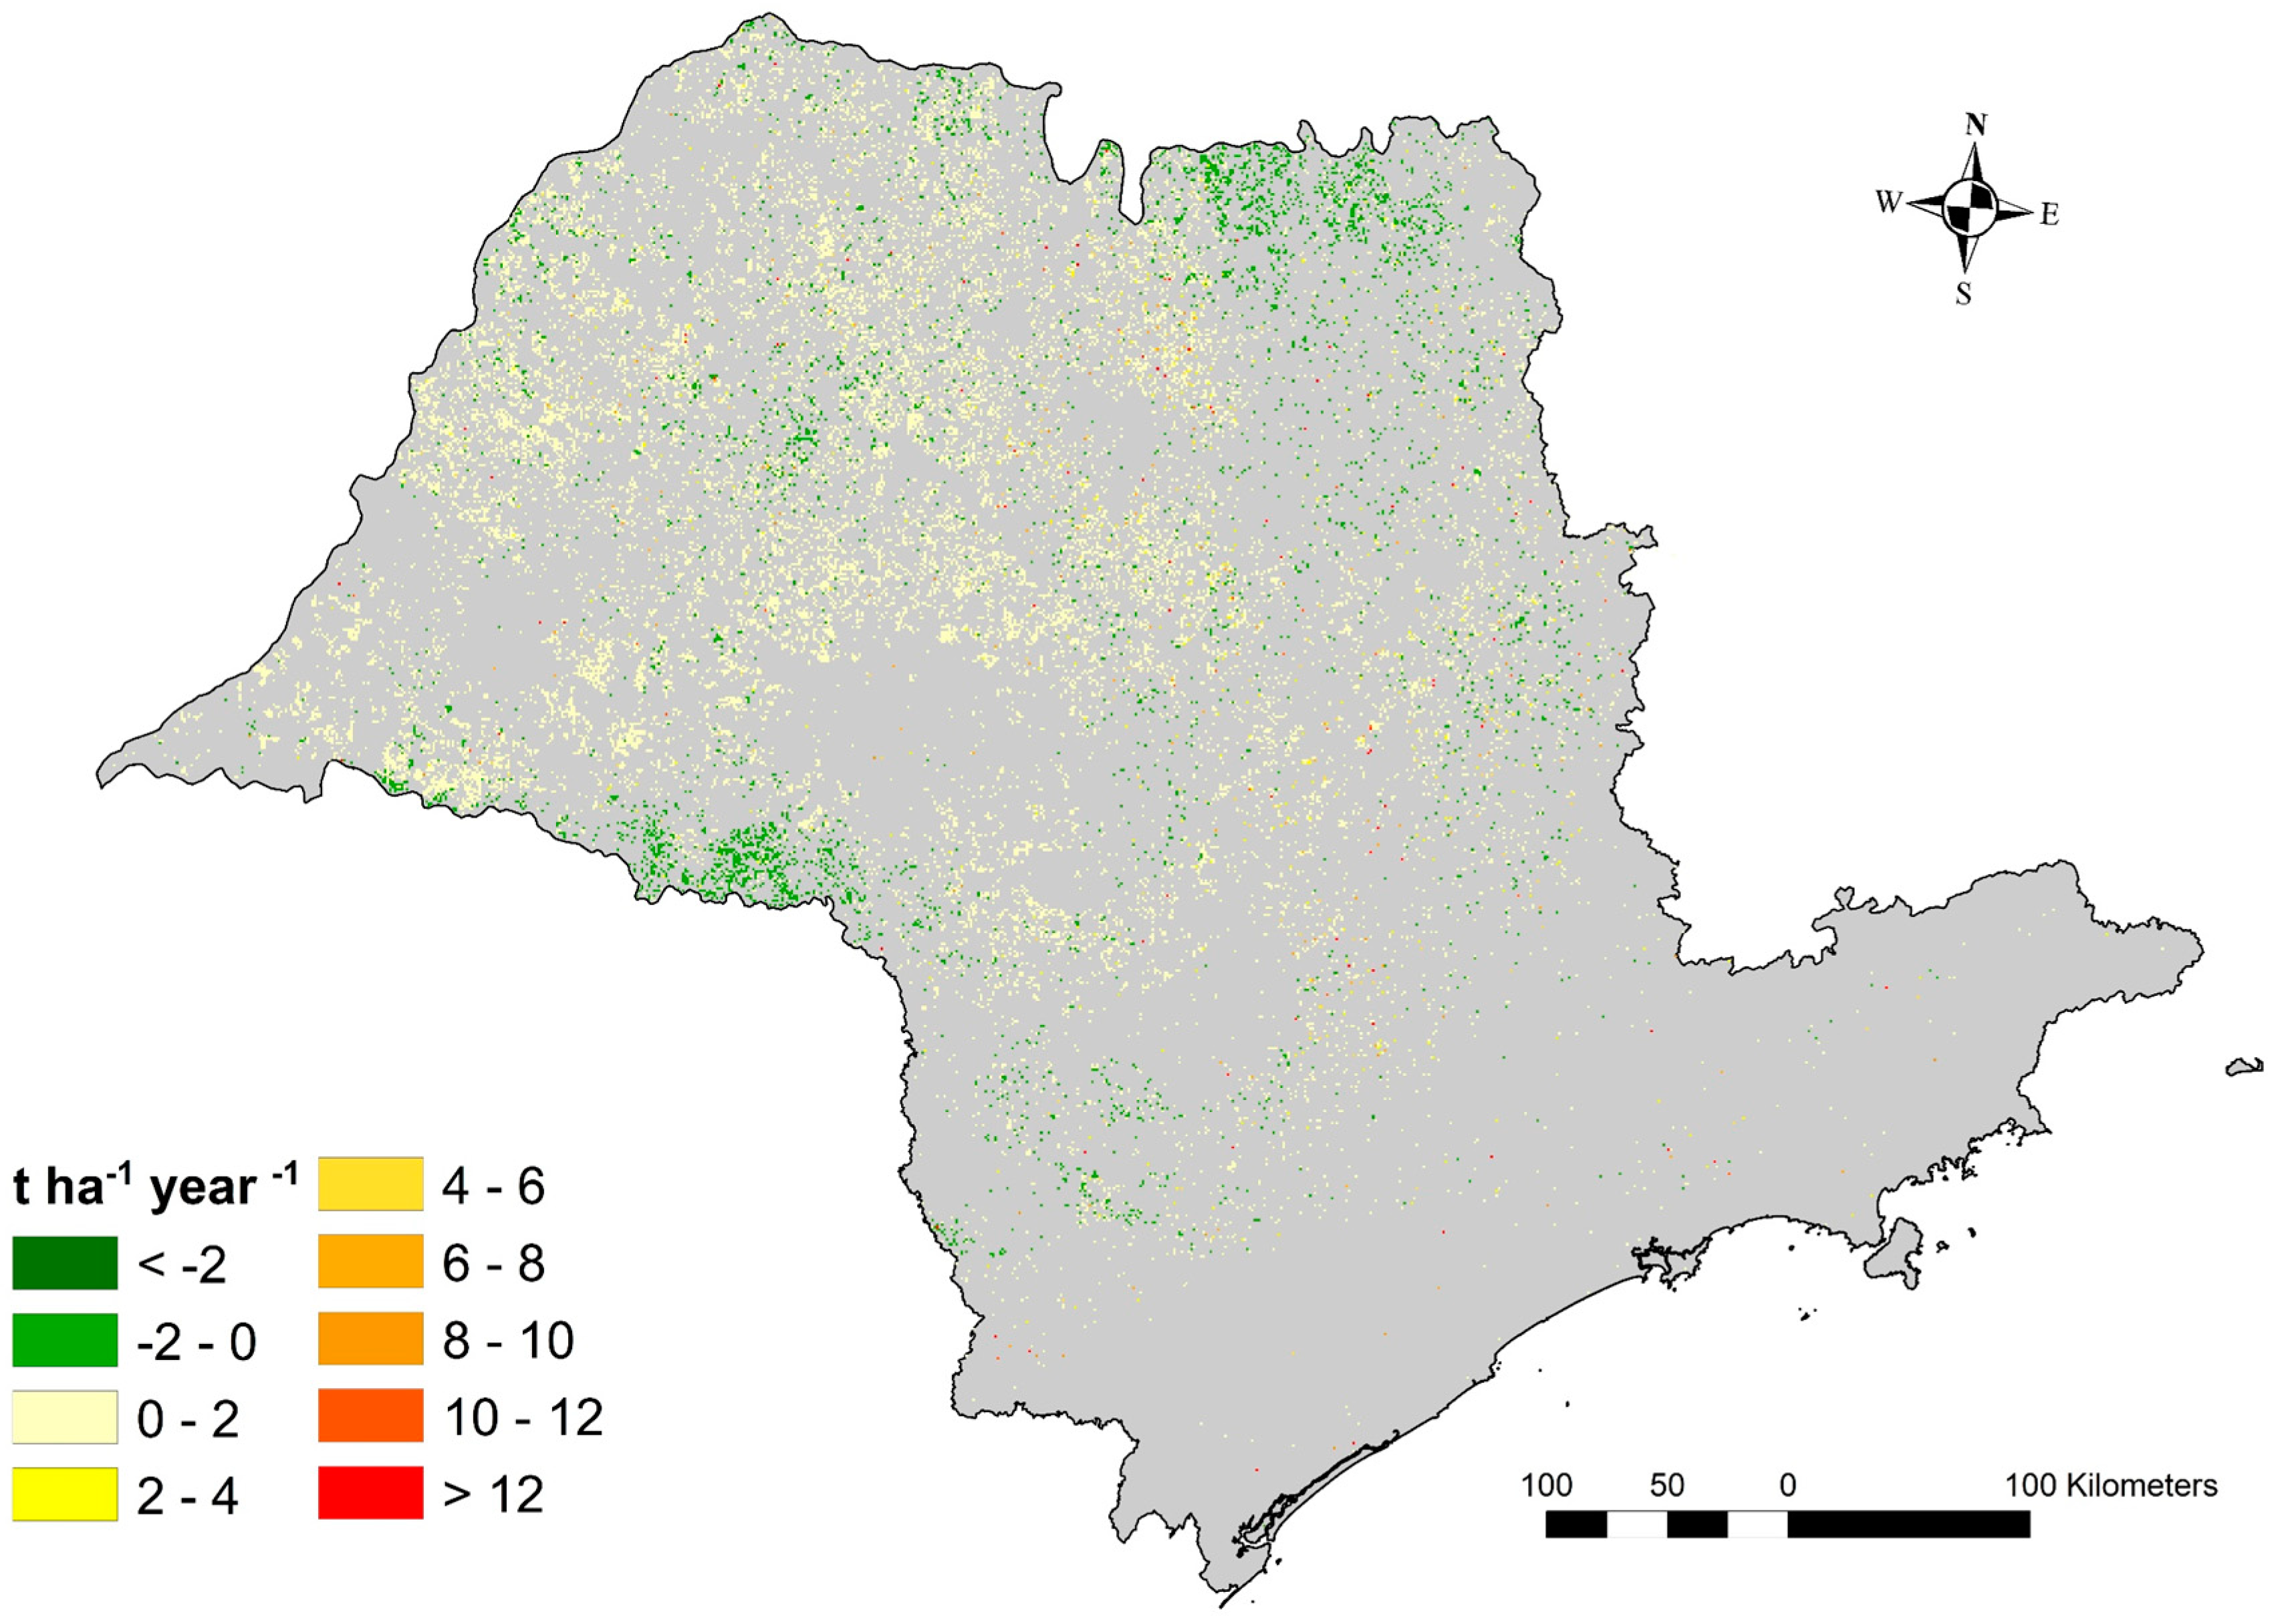
The expansion of agricultural land in natural areas can lead to habitat loss/fragmentation and consequently reduces the biodiversity in a region [50]. This is especially true for homogenous agricultural systems with low species diversity, such as most sugarcane plantations [26]. To estimate the impact of sugarcane expansion on species abundance, the mean species abundance (MSA) index was applied. The MSA index is defined as “the remaining mean species abundance of original species, relative to their abundance in pristine or primary vegetation, which are assumed to be not disturbed by human activities for a prolonged period” [43]. This index has been applied in previous studies to determine LUC-related impacts on species abundance [51,52]. The MSA index overlooks any species abundance distribution information; instead, it assumes a causal–effect relationship between environmental drivers and biodiversity impacts. Five environmental drivers (LUC, atmospheric nitrogen deposition, infrastructure, fragmentation, and climate change) are generally considered in the MSA index. However, the relative change in the MSA index can also be applied while considering only one environmental driver (LUC), as executed in this study. The MSA index of a specific land use/cover varies from 0 to 1. A land use/cover with the value of 1 refers to a pristine original ecosystem with species abundance not affected by human activities and 0 refers to the opposite [43]. MSA values were assigned to each land use/cover category based on previous studies (see Table S3 from the Supplementary Material) [43,53]. The impact on species abundance was assessed spatially explicitly for each year by comparing the MSA value of sugarcane plantations with the MSA value of the land use/cover prior to conversion.

2.4. Soil Erosion

Soil erosion is identified as the main form of soil degradation and it is enhanced by LUC dynamics [54]. Soil degradation induced by soil erosion can limit root growth in sugarcane plantations, which in turn decreases yields [55]. Soil erosion is mainly determined by soil characteristics, terrain, land use, weather conditions, and management practices [56]. In Brazil, soil erosion is attributed to high-intensity rainfall and erosion-prone soils [57]. The revised universal soil loss equation (RUSLE) is the most frequently used and accepted method to estimate soil erosion [58]. Therefore, the RUSLE equation was applied to estimate the change in potential soil loss when land is converted to sugarcane [44].
The RUSLE equation includes 5 factors (Equation (3)). The rainfall erosivity factor (R) considers the aggressiveness of the rain to provoke erosion [56]. The soil erodibility factor (K) is associated with the soil potential to erode in relation to its physical characteristics [59]. Topography factors are included by slope length (L) and slope gradient (S) on erosion [56]. The cover management factor (C) represents the effect of land use/cover on soil loss, and the support practice factor (P) represents erosion prevention practices [60]. For each year, the potential soil loss from sugarcane cultivation was compared to the potential soil loss of the reference land use/cover prior to conversion. The change in potential soil loss is expressed in t ha−1 year−1. The methods to estimate each of the relevant factors from RUSLE are presented in the Supplementary Material (Section 4 soil erosion), including the C factor (see Table S4 from the Supplementary Material) and P factor (see Table S5 from the Supplementary Material) from each land use/cover:
A = R K L S C P
where:
  • A = Soil loss for sugarcane, t ha−1 h−1 year−1;
  • R = Rainfall-runoff erosivity factor, MJ mm ha−1year−1;
  • K = Soil erodibility factor t ha h ha−1 MJ−1 mm−1
  • L = Slope-length factor, unitless;
  • S = Slope steepness factor, unitless;
  • C = Cover management factor, unitless;
  • P = Conservation support practice factor, unitless.

2.5. Water Shortage

The hydrological cycle is strongly affected by LUC. LUC affects the water balance in an area mainly through changes in evapotranspiration and percolation rates [61]. The amount of water that sugarcane plantations take up and release can lead to major changes in the water balance of a watershed and can potentially lead to local water depletion [35]. The evapotranspiration and percolation rates depend on biophysical conditions, such as soil characteristics, hydro-climatic regime, and plant growth stage [34]. To estimate the effect of sugarcane expansion on the local water balance, the approach from Brouwer and Heibloem was applied (Equation (4)) [45]. The water shortage (WS) was determined on a monthly basis by comparing each land use/cover category’s evapotranspiration rates during the length of the growing season with the effective precipitation over the same period. Then, the WS from sugarcane was compared to the WS of the land use/cover prior to conversion to determine the difference in WS between land uses/covers. Land use/cover evapotranspiration rates were determined by multiplying the reference evapotranspiration (ET0) with land use/cover category-specific and growth stage-specific evapotranspiration coefficients (Kc, see Table S6 from the Supplementary Material). The methods to estimate each of the relevant factors from the WS approach are presented in the Supplementary Material (Section 5 water shortage):
W S x =   i = 1 12 E T 0 , i K c i , x   i = 1 12 E P i
where:
WS = Water shortage for land under land use/cover type x, mm year−1;
i = Month of the year;
ET0 = Monthly reference evapotranspiration in month i, mm month−1;
Kc = Crop coefficient in month i for land under land use/cover type x, unitless;
EP = Effective precipitation in month i, mm month−1.

2.6. Environmental Performance Index

To assess the trade-offs between LUC-related CO2 emissions, soil erosion, species abundance, and water shortage, the results of each impact were integrated into one environmental performance index. The performance index allows a holistic identification of the areas where sugarcane expansion resulted mainly in negative impacts and areas where it resulted in mainly positive effects. Standardization was applied to homogenize the units and scale from all impacts into a common measure. For each impact result, maximum standardization was applied in which all positive effects from sugarcane expansion were converted into a −1 to 0 scale and all negative effects into a 0 to 1 scale. Positive effects are presented on a negative scale to be consistent with other environmental impact results, given that a positive LUC-related environmental impact is generally displayed by a negative score on each impact scale (e.g., carbon accumulation translates into negative CO2 emissions). To avoid a skewed distribution, the maxima were set on two times the standard deviation from the average. All environmental impacts were assumed to have the same weighting factor, i.e., they were considered equally important. However, decision makers may prioritize certain impact categories over others, and alternative weighting factors could be applied.

3. Results

3.1. Land Use Change Dynamics

Between 2004 and 2015, approximately 23.6 thousand km2 of land was converted to sugarcane cultivation in Sao Paulo state (See Figure 1). The largest share of replaced land use/cover corresponds to grassland (69%), followed by annual crops (17.5%) and shrubland (12.2%) (see Supplementary Material, Figure S1). Most of the sugarcane expansion at the expense of grasslands occurred in the central and north-western part of the state. The conversion of annual crops is concentrated in the north and center-west part, while the conversion of shrubland occurred mostly in the eastern part. The conversion of forest and eucalyptus areas occurred sporadically, both accounting for less than 1% of the total converted area. The strong difference in sugarcane expansion between the north and the south of the state is associated with location-specific logistical and biophysical conditions. Most of the sugarcane mills are located in the center and northern part of the state. In addition, the south of the state is characterized by a hilly terrain with remnants of the Atlantic forest that pose slope-related natural constrains for sugarcane expansion.

3.2. LUC-Related CO2 Emissions

LUC-related CO2 emissions from sugarcane expansion vary considerably over space in Sao Paulo state; they are calculated to be between −8 t CO2 ha−1 year−1 and >6 t CO2 ha−1 year−1 (see Figure 2). The CO2 emissions are mostly driven by changes in the biomass carbon stock and to a lesser extent by changes in SOC. The conversion of grasslands and especially of annual crops to sugarcane in the center and northern part of the state results in carbon accumulation (i.e., negative emissions). When grasslands are converted to sugarcane, the carbon accumulation is mainly determined by the yield difference between both land uses/covers, in which sugarcane delivers higher yields in comparison to grassland. The biophysical conditions in the center-north part of the state are more suitable for sugarcane production than in the center part. Therefore, more carbon accumulation is achieved in the center-north part of the state. The conversion from annual crops to sugarcane results in the highest carbon accumulation. The negative CO2 emissions are caused by the strong differences in biomass carbon, while there are almost no changes in the SOC pool. Generally, the conversion from shrublands to sugarcane results in carbon stock changes varying between 0 and 4 t CO2 ha−1 year−1. Still, there are some regions (mainly in the east and south) where the loss of shrublands generates CO2 emissions between 4 and 6 t CO2 ha−1 year−1. These high CO2 emissions are attributed to the biophysical conditions in the vicinity of the Atlantic forest, which are suitable for the development of dense shrublands. The conversion of forest and eucalyptus results in large losses in the biomass carbon stock and to a lesser extent in the SOC stock. The conversion of these two types of land uses to sugarcane shows the highest LUC-related CO2 emissions. The loss of forest from sugarcane expansion generates CO2 emissions between 4 and 10 t CO2 ha−1 year−1. However, at some locations, the loss of forest can induce emissions of up to 12–14 t CO2 ha−1 year−1.
On average, the expansion of sugarcane in Sao Paulo state resulted in −2.8 t CO2 ha−1 year−1 (see Supplementary Material, Figure S2). Most of the carbon uptake occurs in the sugarcane above ground biomass; approximately 70% of this carbon is accumulated in the harvestable section of the plant. However, little carbon is accumulated in below ground biomass or SOC. The annual variation (see Supplementary Material, Figure S2) in emissions is mainly caused by the location and type of land use change.

3.3. Mean Species Abundance

The change in the MSA index when land is converted to sugarcane in Sao Paulo state varies from −0.2 to 0.7 (see Figure 3). The abundance of original species declines for all land use types, except annual crops, when converted to sugarcane. When annual crops are converted to sugarcane, a relative increase in species abundance (−0.2) is reported. This occurs mainly in the north and in the center-west part of Sao Paulo state. The strongest decrease in species abundance (0.7) occurs when forest areas are converted to sugarcane plantations. Despite that the conversion of forest areas induces the strongest decline in species abundance, the overall impact is small when compared to other land use categories given the relatively little sugarcane expansion that occurs at the expense of forest. The conversion of shrubland to sugarcane also results in a strong decrease (0.45) in species abundance. The conversion of grassland to sugarcane reduces the species abundance by 0.3. The impacts on biodiversity from the loss of grassland areas are concentrated in the center, north, and north-west parts of the state. The lowest decrease in species abundance is found when eucalyptus is converted to sugarcane (0.2). On average, sugarcane expansion resulted in a decrease of species abundance (0.23 year−1) driven mostly by the conversion of grasslands to sugarcane (see Supplementary Material, Figure S3). However, the decrease in species abundance for the whole state is offset to some extent by the conversion of annual crops to sugarcane.

3.4. Soil Erosion

As shown in Figure 4, the change in soil loss resulting from land conversion to sugarcane varies from <−2 to >12 t ha−1 year−1. For all land uses, except for annual crops, conversion to sugarcane resulted in an increase in soil loss. The variation in soil loss is attributed to the differences in the cover effect of the various land uses and to a lesser extent to the spatial heterogeneity in biophysical conditions (mainly terrain conditions). For example, the change from annual crops to sugarcane results in a decrease in soil loss given that annual crops provide less cover against rain impact (mainly at the north and center-west part of Sao Paulo state). A large increase in soil loss occurs when forest and shrubland are converted to sugarcane, as both forest and shrubland provide better soil cover. Given that the soil cover of grasslands is slightly better than the cover effect of sugarcane, soil losses increased to some extent when grasslands were converted to sugarcane. The expansion of sugarcane at the expense of eucalyptus resulted in soil losses between 2 and 6 t ha−1 year−1. Soil losses increase in areas with a higher rainfall intensity, such as in the western part of the state. In addition, as seen in the south of the state, steep slopes enhance soil loss when land is converted to sugarcane.
On average, the sugarcane expansion in Sao Paulo state resulted in soil loss of 0.5 t ha−1 year−1 (see Supplementary Material, Figure S4). The variation in annual soil loss is mainly driven by the LUC dynamics, which are dominated by the conversion of grassland and annual crops. Both land use/cover categories provide a similar soil cover as sugarcane; grassland provides a slightly better cover and annual crops a slightly worse cover. Therefore, average soil losses are low. Average soil loss increased for the years 2009–2010, 2010–2011, and 2014–2015, in which the LUC dynamics were less dominated by the conversion of grasslands and the ratio of land use conversion was spread more equally among other land use/cover categories. In the same years, the conversion from forest to sugarcane resulted in some areas in a soil loss of 12 t ha−1 year−1. For all years, the conversion of sugarcane resulted in an increase in soil loss except for 2012–2013; in this year, the expansion occurred only at the expense of annual crops.

3.5. Water Shortage

Figure 5 showed the spatial variation in the difference in water shortage between sugarcane and the land use/cover prior to conversion. The difference in water shortage is reported to vary between −180 and 300 mm year−1. The high evapotranspiration rates of sugarcane in comparison to other land types determine that the change of almost all land use/cover categories, with the exception of forest and eucalyptus, to sugarcane results in an increase in water shortage. When eucalyptus and forest areas are converted to sugarcane, the change in water deficit is negative (i.e., there is less water deficit); forests and eucalyptus areas use more water in comparison to sugarcane as a consequence of their high evapotranspiration rates. There is a strong increase in water deficit when sugarcane displaces annual crops. The growing season of sugarcane lasts 12 months while the growing season of annual crops is much shorter. Therefore, the average annual evapotranspiration of annual crops is lower. The strong difference in water use between both land use/covers is illustrated in the years 2012–2013 (see Supplementary Material, Figure S5) when sugarcane expanded only in annual crops and the water shortage reported to be the highest.The smallest increase in water deficits occurs in the center-south part of the state, when grasslands and shrublands are converted to sugarcane. The largest increases in deficits are found in the north when annual crops are converted. The strong variations in changes in the water balance over the state are mainly caused by varying climatic conditions, particularly the precipitation regimes, and by the land use/cover prior to conversion. For example, the north of the state is characterized as a dry area with less precipitation than in any other part of the state. These conditions in conjunction with the conversion of annual crops result, in some areas, in an increase in water shortage of up to 300 mm year−1.

3.6. Environmental Performance Index

There is a strong spatial variation in the environmental performance of sugarcane expansion, with the environmental performance index varying between −2.5 and 2.5 at a scale from −4 to 4 (see Figure 6). Areas characterized by a net positive effect of sugarcane expansion (negative scores) occur mostly in the northeast and central west part of the state. However, there are also areas of poor performance that show medium to strong negative effects of sugarcane expansion, such as the northwest and central east parts of the state. Positive effects of sugarcane expansion generally occur when annual crops are converted to sugarcane. Two distinct clusters located in the center-west and north, related to the conversion of annual crops, show the highest positive effects of sugarcane expansion.
The magnitude of net positive or net negative effects is influenced by the trade-offs between the various environmental impacts; these tend to balance each other out at some locations. The expansion of sugarcane into annual crops generally results in carbon accumulation, increases species abundance, and decreases soil loss. However, all these positive effects are balanced out to some extent by an increase in the water deficit. The conversion of grasslands to sugarcane generally results in a large carbon sink; this positive effect is balanced out by the increase in soil loss, increase in water shortage, and a decrease in species abundance. Nevertheless, for some areas, the increase in soil loss and water shortage is minimal. Still, the overall effect is negative. The highest negative overall effects are reported when forest, shrublands, and eucalyptus are converted to sugarcane. The overall negative effect when forest is converted is mainly due to high CO2 emissions, a large loss in mean species abundance, and a considerable increase in soil loss. However, the overall negative effect is counter-balanced to some extent by a decrease in water deficit. For eucalyptus, the negative environmental performance index is dominated by high CO2 emissions. Similar to forests, the high CO2 emissions are balanced out to some extent by the decrease in water deficit. Most of the worst-performing areas (orange and red) are characterized by high woody biomass volumes prior to conversion. These areas generally store more carbon, provide better cover to reduce the risk of soil erosion, and are more suitable for species abundance.
There are no sugarcane expansion areas characterized by only positive impacts as there are always trade-offs between positive and negative impacts for all categories. Moreover, sugarcane expansion in shrublands is characterized by only negative impacts, including an increase in soil loss, increase in water shortage, reduction in species abundance, and increase in LUC-related CO2 emissions.

4. Discussion

A strong spatial variation in magnitude and direction was found for all LUC-related environmental impacts of sugarcane expansion. These impacts are steered to a large extent by local biophysical conditions and by the type of land use transition. Generally, the direction of the impact is attributed to the land use transition and the magnitude of impacts is largely due to the local biophysical conditions. The observed land use dynamics of sugarcane expansion in our study follow the same trend as observed in other studies [10,15,19], with most of the sugarcane expansion occurring at the expense of grasslands and arable crops.
In general, the conversion of grasslands and annual crops to sugarcane leads to net carbon sequestration while the change from forest, eucalyptus, and shrubland leads to LUC-related CO2 emissions. Similar results are described in other studies [13,16,17]. On average, sugarcane expansion sequestered 2.8 t CO2 ha−1 year−1 in biomass and soils from 2004 to 2015. Another study reported higher LUC-related carbon sequestration from sugarcane expansion [13]. However, in this study, above or below ground biomass was not considered for the land use prior to conversion. Our assessment of LUC-related CO2 emissions was based on a broad range of input parameters. As a result, the output is sensitive to the assumptions made on yields, land suitability maps, and soil stock change factors. For example, applying a different sugarcane yield could strongly steer the results in carbon sequestration or carbon loss in the biomass pool when land is converted. However, the assumptions were consistently applied while considering Sao Paulo state’s heterogeneous biophysical conditions and management practices.
The conventional life cycle GHG emissions from the Brazilian sugarcane ethanol supply chain (including transportation and distribution in the EU) is estimated at 28.6 g CO2-eq MJethanol−1 [62] of which 17.1 g CO2-eq MJethanol−1 is from the cultivation phase (including the use of machinery, fertilizer, and pesticide application). The average annual 2.8 t CO2 ha−1 year−1 savings from sugarcane expansion estimated in this study, which is equivalent to 20.1 g CO2-eq MJethanol−1, offsets these life cycle emissions to a large extent. When considering the LUC-related CO2 emissions from sugarcane expansion in shrublands and forests, total GHG emissions from sugarcane ethanol increase considerably from 43.1 to 57.5 g CO2-eq MJethanol−1 for shrublands and from 57.5 to 100.7 g CO2-eq MJethanol−1 for forests. The total GHG emissions from sugarcane ethanol, including LUC-related CO2 emissions from the conversion of shrubland or forest, fail to comply with the 65% GHG emission reduction requirement of the new European Commission Renewable Energy Directive REDII [63] or the requirements for advanced fuels of the United States Renewable Fuels Standard. Nevertheless, most of the expansion occurs on grassland and annual crops. The expansion of sugarcane on annual crops resulted in only negative LUC-related CO2 emissions, ranging from −49.1 to −0.7 g CO2-eq MJethanol−1, while in grassland, emissions ranged from −35.8 to 10.7 g CO2-eq MJethanol−1. The total GHG emissions of sugarcane ethanol produced on land converted from annual crops and grassland not only comply with international regulations, but for several locations, it results in overall negative GHG emissions. The effects of indirect land use change are outside the scope of our study and could increase CO2 emissions.
The mean species abundance declined due to sugarcane expansion except from the conversion of annual crops. In line with [25,64,65], the strongest decrease in biodiversity was found when forest was converted. The MSA indicator omits information, such as species distribution, threatened species, or connectivity. Despite the changes in MSA from sugarcane expansion being assigned based on constant values that neglect the heterogeneity in spatial biophysical conditions, it is a good proxy indicator to estimate the relative impact on species abundance from LUCs. For example, the expansion of sugarcane in natural land uses/covers, such as forest, can potentially reduce species abundance by the loss of (connectivity) species habitats.
The conversion of land to sugarcane increased soil loss, and this is in line with other studies [8,66]. The conversion of any land use/cover, except for annual crops, increases soil losses in comparison to the conditions prior to conversion. Soil loss under sugarcane is slightly less than under annual crops. In Brazil, an average soil loss tolerance threshold of approximately 3 t ha−1 year has been established for soils with unfavorable conditions (e.g., shallow non-permeable soils) and 12.5 t ha−1 year for soils with favorable ones (e.g., deep well-drained soils) [66]. When considering the annual soil loss from sugarcane plantations, several locations surpassed these soil loss tolerance limits. Sugarcane land is relatively susceptible to erosion processes [67]. In this study, the change in soil loss is driven by the cover effect (C factor) of the different land uses/covers. Despite sugarcane C factors ranging significantly between 0.0012 and 0.58 depending on the growth stage and plant characteristics [68], 0.17 was used as it is generally applied for sugarcane in Brazil [69].
The impact on water shortage was assessed as the difference in the annual water deficit between sugarcane and the land use/cover category prior to conversion. Despite including important biophysical parameters, such as temperature and precipitation, it neglects others, such as soil characteristics and watershed dynamics, that can be relevant to determine direct water impacts from sugarcane expansion. Therefore, it describes particularly whether more or less water is used for sugarcane production than for the land use/cover prior to conversion. In addition, it neglects temporal shortages that can potentially lead to a decrease in crop productivity [70,71] and affect other environmental impacts.
Maximum standardization while considering the same weight for each impact was the selected approach to spatially integrate all environmental impacts into a single environmental performance index. This allowed comprehensive assessment of the environmental impacts from sugarcane expansion and identification of the trade-offs between impacts. However, the integration of results should be interpreted with care. The integration of distinctive scales from different impacts can lead to misinterpretations. A score in one specific indicator can signify a stronger/weaker actual effect in the environment than the same score for a different indicator. In addition, individual scores can balance out or enhance each other in the overall score. Thus, a detrimental effect in one category can be masked by a positive effect in a different category and vice-versa. For example, in the environmental performance index, a high carbon sink can offset a reduction in species abundance. However, in reality, these impacts fail to compensate each other. Therefore, additional expertise is required to estimate the actual environmental impact from a score in each specific indicator and to what extent these impacts interact with each other.
The applied methods allow negative performing areas to be flagged but fall short to some extent in indicating the key biophysical conditions that characterize areas of concern. For example, regardless of a precipitation regime (either wet or dry), a change in use from annual crops to sugarcane will result in an increase in water shortage. Despite the increase in water shortage (negative effect), the biophysical conditions can still be adequate to provide sugarcane plantations with enough water without generating negative impacts in the watershed.
Additional standardization methods can be applied. The integration and weights assigned to the environmental impacts could be established in line with policy objectives and based on engagement with relevant stakeholders. For example, if GHG emissions are prioritized, a higher weight can be assigned to this impact category than to others. However, this should be done with care. The prioritization of one impact can lead to neglecting other impacts and thereby induce higher negative effects in other environmental areas.
The assessment of environmental impacts required a wide range of input data and assumptions that steered the results and could lead to an under- or overestimation of environmental impacts. Some parameters lack a temporal and spatial attribute and were assumed to be constant over space and/or time. This is the case for parameters such as the MSA scores and the cover management (C) component from the soil erosion equation; it is suggested that soil erosion rates can vary considerably when considering the temporal variation of C [72] while the distribution of species abundance can vary in space and time as consequence of different drivers besides LUC [43]. A higher resolution and accuracy of land use/cover data (ranging between 70% and 90% depending on category), suitability maps, and other input data could potentially be more adequate to avoid the loss of details when estimating LUC-related environmental impacts. The land use/cover data set accuracy could result in an under/overestimation of impacts for some locations. However, a land use/cover data set with a higher accuracy degree was not available for the relevant period. Several input parameters, such as precipitation, that were available on a monthly basis were averaged for the studied period; this was done to avoid extreme results.
Retrospectively identifying areas with good and bad environmental performance from sugarcane expansion is a first step to define suitable locations for future expansion and avoid negative impacts. However, in this study, only the environmental impacts related to direct LUC were included. The expansion of sugarcane areas is very likely to result in indirect land use changes when cropland and pastures are converted [22,41,73,74]. The indirect land use changes will result in environmental impacts elsewhere, for example, if pasture area expands outside Sao Paulo state at the expense of forest, it will negatively affect carbon and biodiversity. Therefore, to identify environmentally sound sugarcane expansion strategies, indirect impacts should also be considered in conjunction with schemes that target the reduction of negative and/or enhancement of positive direct LUC-related environmental impacts. In addition, in order to assess all three pillars of sustainability, socioeconomic impacts should also be included in an integrated sustainability assessment.

5. Conclusions

This study provided a detailed assessment of the spatial variation of environmental impacts of sugarcane expansion in Sao Paulo state in the period 2004–2015. The results show where positive and negative LUC-related impacts from sugarcane expansion occurred. The direction and magnitude of LUC-related environmental impacts are highly affected by the type of LUC transitions and the local biophysical conditions. In addition, there are trade-offs between impacts that need to be considered for sustainable development of the sugarcane sector. Ignoring the trade-offs between impacts from sugarcane expansion could result in improving the environmental performance in one dimension but simultaneously worsen the performance in the other dimensions and therefore fail to integrally maximize the environmental performance of the sector. The conversion from annual crops to sugarcane resulted in positive environmental impacts in all dimensions with the exception of water; for all the other land use conversion, there are trade-offs between impacts but the overall effect is negative. The latter suggests that annual crops is the most suitable land for future sugarcane expansion. However, such conversion can result in indirect land use change and related environmental impacts elsewhere and potentially diminish the overall positive effects. In order to assess the sustainability of sugar cane expansion, this assessment highlights the importance of performing integrated environmental impact assessments while considering the heterogeneity in biophysical conditions and LUC dynamics. It is an important step forward in the development of sound land use planning for sustainable sugarcane expansion.

Supplementary Materials

The following are available online at https://www.mdpi.com/2073-445X/9/10/397/s1, Figure S1: Share of land that was converted to sugarcane from 2004 to 2015; Figure S2: Average LUC-related CO2 emissions with 2 standard deviations from the expansion of sugarcane from 2004 to 2015; Figure S3: Average annual difference in mean species abundance with 2 standard deviations from the expansion of sugarcane from 2004 to 2015; Figure S4: Average annual difference in soil loss with 2 standard deviations from the expansion of sugarcane from 2004 to 2015; Figure S5: Average annual water shortage with 2 standard deviations from the expansion of sugarcane from 2004 to 2015; Table S1: Parameters to estimate spatially explicit biomass carbon stock for each land use/cover category; Table S2: Soil organic carbon (SOC) stock change factors valid for each land use/cover category, derived from IPCC 2006 guidelines; Table S3: Mean species abundance (MSA) index assigned to each land use/cover; Table S4: Cover management (C) factor for the relevant land use/cover categories; Table S5: Conservation support practice factor according to slope thresholds; Table S6: Evapotranspiration coefficients (Kc). References [75,76,77,78,79,80,81,82,83,84,85,86,87,88,89,90,91,92,93,94,95,96,97,98,99,100] are cite cited in the supplementary materials.

Author Contributions

Formal analysis, I.V.; Methodology, I.V.; Supervision, F.v.d.H.; Writing—original draft, I.V.; Writing—review & editing, I.V., B.W. and F.v.d.H. All authors have read and agreed to the published version of the manuscript.

Funding

This work was carried out within the BE-Basic R&D Program, which was granted a FES subsidy from the Dutch Ministry of Economic Aairs, Agriculture and Innovation (EL & I).

Acknowledgments

The authors would like to thank TU delft for providing Sao Paulo state land use/cover data, Walter Cervi for providing context about sugarcane cultivation in Brazil and Maria J. Santos for her support with spatial modelling.

Conflicts of Interest

The authors declare no conflict of interest.

References

  1. Rogelj, J.; Shindell, D.; Jiang, K.; Fifita, S.; Forster, P.; Ginzburg, V.; Handa, C.; Kheshgi, H.; Kobayashi, S.; Kriegler, E. Mitigation Pathways Compatible with 1.5 C in the Context of Sustainable Development. An IPCC Special Report on the Impacts og Global Warming of 1.5 C above Pre-Industrials Levels and Related Global Greenhouse Gas Emission Pathaways, in the Context of Strengthening the Global Response to the Threat of Climate Change. Sustainable Development, and Efforts to Erradicate Poverty, Geneva. 2018. Available online: https://pure.iiasa.ac.at/id/eprint/15515/ (accessed on 30 March 2019).
  2. IEA. World Energy Outlook 2018; IEA: Paris, France, 2018. [Google Scholar]
  3. Souza, G.M.; Ballester, M.V.R.; de Brito Cruz, C.H.; Chum, H.; Dale, B.; Dale, V.H.; Fernandes, E.C.M.; Foust, T.; Karp, A.; Lynd, L.; et al. The role of bioenergy in a climate-changing world. Environ. Dev. 2017, 23, 57–64. [Google Scholar]
  4. Renewable Fuel Association. RFA Industry Statistics. Available online: https://ethanolrfa.org/resources/industry/statistics/#1454098996479-8715d404-e546 (accessed on 16 October 2018).
  5. REN21. Renewables 2018 Global Status Report; UN Environment: Paris, France, 2018; Available online: http://www.ren21.net/wp-content/uploads/2018/06/17-8652_GSR2018_FullReport_web_final_.pdf (accessed on 10 June 2019).
  6. de Dias, M.O.S.; Maciel Filho, R.; Mantelatto, P.E.; Cavalett, O.; Rossell, C.E.V.; Bonomi, A.; Leal, M.R.L.V. Sugarcane processing for ethanol and sugar in Brazil. Environ. Dev. 2015, 15, 35–51. [Google Scholar] [CrossRef]
  7. UNICA. Sugarcane Planted Area, UNICADATA. 2018. Available online: http://www.unicadata.com.br/historico-de-area-ibge.php?idMn=33&tipoHistorico=5&acao=visualizar&idTabela=1972&produto=Planted+area&anoIni=2006&anoFim=2016&estado=RS%252CSC%252CPR%252CSP%252CRJ%252CMG%252CES%252CMS%252CMT%252CGO%252CDF%252CBA%252CSE%252CAL%252CPE%252CPB%252CRN%252CCE%252CPI%252 (accessed on 16 October 2018).
  8. de Bordonal, R.O.; Carvalho, J.L.N.; Lal, R.; de Figueiredo, E.B.; de Oliveira, B.G.; La Scala, N. Sustainability of sugarcane production in Brazil. A review. Agron. Sustain. Dev. 2018, 38, 13. [Google Scholar]
  9. Filoso, S.; do Carmo, J.B.; Mardegan, S.F.; Lins, S.R.M.; Gomes, T.F.; Martinelli, L.A. Reassessing the environmental impacts of sugarcane ethanol production in Brazil to help meet sustainability goals. Renew. Sustain. Energy Rev. 2015, 52, 1847–1856. [Google Scholar] [CrossRef]
  10. Walter, A.; Dolzan, P.; Quilodrán, O.; de Oliveira, J.G.; da Silva, C.; Piacente, F.; Segerstedt, A. Sustainability assessment of bio-ethanol production in Brazil considering land use change, GHG emissions and socio-economic aspects. Energy Policy 2011, 39, 5703–5716. [Google Scholar]
  11. Turetta, A.P.D.; Kuyper, T.; Malheiros, T.F.; da Coutinho, H.L.C. A framework proposal for sustainability assessment of sugarcane in Brazil. Land Use Policy 2017, 68, 597–603. [Google Scholar]
  12. de Bordonal, R.O.; Lal, R.; Ronquim, C.C.; de Figueiredo, E.B.; Carvalho, J.L.N.; Maldonado, W.; Milori, D.M.B.P.; La Scala, N. Changes in quantity and quality of soil carbon due to the land-use conversion to sugarcane (Saccharum officinarum) plantation in southern Brazil. Agric. Ecosyst. Environ. 2017, 240, 54–65. [Google Scholar]
  13. de Oliveira Bordonal, R.; Lal, R.; Alves Aguiar, D.; de Figueiredo, E.B.; Ito Perillo, L.; Adami, M.; Theodor Rudorff, B.F.; La Scala, N. Greenhouse gas balance from cultivation and direct land use change of recently established sugarcane (Saccharum officinarum) plantation in south-central Brazil. Renew. Sustain. Energy Rev. 2015, 52, 547–556. [Google Scholar]
  14. Egeskog, A.; Freitas, F.; Berndes, G.; Sparovek, G.; Wirsenius, S. Greenhouse gas balances and land use changes associated with the planned expansion (to 2020) of the sugarcane ethanol industry in Sao Paulo, Brazil. Biomass Bioenergy 2014, 63, 280–290. [Google Scholar]
  15. da Oliveira, D.M.S.; Paustian, K.; Davies, C.A.; Cherubin, M.R.; Franco, A.L.C.; Cerri, C.C.; Cerri, C.E.P. Soil carbon changes in areas undergoing expansion of sugarcane into pastures in south-central Brazil. Agric. Ecosyst. Environ. 2016, 228, 38–48. [Google Scholar]
  16. Franco, A.L.C.; Cherubin, M.R.; Pavinato, P.S.; Cerri, C.E.P.; Six, J.; Davies, C.A.; Cerri, C.C. Soil carbon, nitrogen and phosphorus changes under sugarcane expansion in Brazil. Sci. Total Environ. 2015, 515–516, 30–38. [Google Scholar] [CrossRef] [PubMed]
  17. Mello, F.F.C.; Cerri, C.E.P.; Davies, C.A.; Holbrook, N.M.; Paustian, K.; Maia, S.M.F.; Galdos, M.V.; Bernoux, M.; Cerri, C.C. Payback time for soil carbon and sugar-cane ethanol. Nat. Clim. Chang. 2014, 4, 605–609. [Google Scholar] [CrossRef]
  18. Assad, E.D.; Pinto, H.S.; Martins, S.C.; Groppo, J.D.; Salgado, P.R.; Evangelista, B.; Vasconcellos, E.; Sano, E.E.; Pavão, E.; Luna, R. Changes in soil carbon stocks in Brazil due to land use: Paired site comparisons and a regional pasture soil survey. Biogeosciences 2013, 10, 6141–6160. [Google Scholar] [CrossRef] [Green Version]
  19. Alkimim, A.; Clarke, K.C. Land use change and the carbon debt for sugarcane ethanol production in Brazil. Land Use Policy 2018, 72, 65–73. [Google Scholar] [CrossRef] [Green Version]
  20. Silva-Olaya, A.M.; Davies, C.A.; Cerri, C.E.P.; Allen, D.J.; Mello, F.F.C.; Cerri, C.C. Quantifying above and belowground biomass carbon inputs for sugar-cane production in Brazil. Soil Res. 2017, 55, 640–648. [Google Scholar] [CrossRef]
  21. Newbold, T.; Hudson, L.N.; Hill, S.L.L.; Contu, S.; Lysenko, I.; Senior, R.A.; Börger, L.; Bennett, D.J.; Choimes, A.; Collen, B.; et al. Global effects of land use on local terrestrial biodiversity. Nature 2015, 520, 45. [Google Scholar] [CrossRef] [PubMed] [Green Version]
  22. Lapola, D.M.; Schaldach, R.; Alcamo, J.; Bondeau, A.; Koch, J.; Koelking, C.; Priess, J.A. Indirect land-use changes can overcome carbon savings from biofuels in Brazil. Proc. Natl. Acad. Sci. USA 2010, 107, 3388–3393. [Google Scholar] [CrossRef] [Green Version]
  23. Carvalho, F.M.V.; De Marco, P.; Ferreira, L.G. The Cerrado into-pieces: Habitat fragmentation as a function of landscape use in the savannas of central Brazil. Biol. Conserv. 2009, 142, 1392–1403. [Google Scholar] [CrossRef]
  24. Gasparatos, A.; Stromberg, P.; Takeuchi, K. Biofuels, ecosystem services and human wellbeing: Putting biofuels in the ecosystem services narrative. Agric. Ecosyst. Environ. 2011, 142, 111–128. [Google Scholar] [CrossRef]
  25. Ribeiro, M.C.; Martensen, A.C.; Metzger, J.P.; Tabarelli, M.; Scarano, F.; Fortin, M.-J. The Brazilian Atlantic Forest: A Shrinking Biodiversity Hotspot. In BT—Biodiversity Hotspots: Distribution and Protection of Conservation Priority Areas; Zachos, F.E., Habel, J.C., Eds.; Springer: Berlin/Heidelberg, Germany, 2011; pp. 405–434. ISBN 978-3-642-20992-5. [Google Scholar]
  26. Dalle Laste, K.C.; Durigan, G.; Andersen, A.N. Biodiversity responses to land-use and restoration in a global biodiversity hotspot: Ant communities in Brazilian Cerrado. Austral Ecol. 2019, 44, 313–326. [Google Scholar] [CrossRef]
  27. de Moraes, M.C.P.; de Mello, K.; Toppa, R.H. Protected areas and agricultural expansion: Biodiversity conservation versus economic growth in the Southeast of Brazil. J. Environ. Manag. 2017, 188, 73–84. [Google Scholar]
  28. Oliveira, D.M.S.; Cherubin, M.R.; Franco, A.L.C.; Santos, A.S.; Gelain, J.G.; Dias, N.M.S.; Diniz, T.R.; Almeida, A.N.; Feigl, B.J.; Davies, C.A.; et al. Is the expansion of sugarcane over pasturelands a sustainable strategy for Brazil’s bioenergy industry? Renew. Sustain. Energy Rev. 2019, 102, 346–355. [Google Scholar]
  29. Martinelli, L.A.; Filoso, S. Expansion of sugarcane ethanol production in Brazil: Environmental and social challenges. Ecol. Appl. 2008, 18, 885–898. [Google Scholar]
  30. Hunke, P.; Mueller, E.N.; Schröder, B.; Zeilhofer, P. The Brazilian Cerrado: Assessment of water and soil degradation in catchments under intensive agricultural use. Ecohydrology 2015, 8, 1154–1180. [Google Scholar]
  31. Youlton, C.; Wendland, E.; Anache, J.A.A.; Poblete-Echeverría, C.; Dabney, S. Changes in erosion and runoff due to replacement of pasture land with sugarcane crops. Sustainability 2016, 8, 685. [Google Scholar]
  32. Cherubin, M.R.; Franco, A.L.C.; Cerri, C.E.P.; da Oliveira, D.M.S.; Davies, C.A.; Cerri, C.C. Sugarcane expansion in Brazilian tropical soils—Effects of land use change on soil chemical attributes. Agric. Ecosyst. Environ. 2015, 211, 173–184. [Google Scholar]
  33. Cherubin, M.R.; Karlen, D.L.; Franco, A.L.C.; Cerri, C.E.P.; Tormena, C.A.; Cerri, C.C. A Soil Management Assessment Framework (SMAF) evaluation of Brazilian sugarcane expansion on soil quality. Soil Sci. Soc. Am. J. 2016, 80, 215–226. [Google Scholar]
  34. Watkins, D.W.; de Moraes, M.M.G.A.; Asbjornsen, H.; Mayer, A.S.; Licata, J.; Lopez, J.G.; Pypker, T.G.; Molina, V.G.; Marques, G.F.; Carneiro, A.C.G.; et al. Bioenergy Development Policy and Practice Must Recognize Potential Hydrologic Impacts: Lessons from the Americas. Environ. Manag. 2015, 56, 1295–1314. [Google Scholar]
  35. Fachinelli, N.P.; Pereira, A.O. Impacts of sugarcane ethanol production in the Paranaiba basin water resources. Biomass Bioenergy 2015, 83, 8–16. [Google Scholar]
  36. Spera, S.A.; Galford, G.L.; Coe, M.T.; Macedo, M.N.; Mustard, J.F. Land-use change affects water recycling in Brazil’s last agricultural frontier. Glob. Chang. Biol. 2016, 22, 3405–3413. [Google Scholar]
  37. Hernandes, T.A.D.; Bufon, V.B.; Seabra, J.E.A. Water footprint of biofuels in Brazil: Assessing regional differences. Biofuels Bioprod. Biorefin. 2013, 8, 241–252. [Google Scholar] [CrossRef] [Green Version]
  38. Georgescu, M.; Lobell, D.B.; Field, C.B.; Mahalov, A. Simulated hydroclimatic impacts of projected Brazilian sugarcane expansion. Geophys. Res. Lett. 2013, 40, 972–977. [Google Scholar] [CrossRef]
  39. UNICA. Ethanol Production Data, UNICADATA. 2020. Available online: http://www.unicadata.com.br/historico-de-producao-e-moagem.php?idMn=31&tipoHistorico=2&acao=visualizar&idTabela=1985&produto=etanol_total&safraIni=1980%252F1981&safraFim=2017%252F2018&estado=RS%252CSC%252CPR%252CSP%252CRJ%252CMG%252CES%252CMS%252CMT%252CG (accessed on 21 September 2018).
  40. MME. Programa RenovaBIO. 2017. Available online: http://www.mme.gov.br/web/guest/secretarias/petroleo-gas-natural-e-combustiveis-renovaveis/programas/renovabio/principal (accessed on 20 November 2019).
  41. van der Hilst, F.; Verstegen, J.A.; Woltjer, G.; Smeets, E.M.W.; Faaij, A.P.C. Mapping land use changes resulting from biofuel production and the effect of mitigation measures. GCB Bioenergy 2018, 10, 804–824. [Google Scholar] [CrossRef] [Green Version]
  42. IPCC. 2006 IPCC Guidelines for National Greenhouse Gas Inventories; Institute for Global Environmental Strategies: Kanagawa, Japan, 2006; Available online: https://www.ipcc-nggip.iges.or.jp/public/2006gl/ (accessed on 15 January 2018).
  43. Alkemade, R.; van Oorschot, M.; Miles, L.; Nellemann, C.; Bakkenes, M.; ten Brink, B. GLOBIO3: A Framework to Investigate Options for Reducing Global Terrestrial Biodiversity Loss. Ecosystems 2009, 12, 374–390. [Google Scholar] [CrossRef] [Green Version]
  44. Renard, K.G.; Foster, G.R.; Weesies, G.A.; McCool, D.K.; Yoder, D.C. Predicting Soil Erosion by Water: A Guide to Conservation Planning with the Revised Universal Soil Loss Equation (RUSLE); United States Department of Agriculture: Washington, DC, USA, 1997; Volume 703. [Google Scholar]
  45. Brouwer, C.; Heibloem, M. Irrigation water management: Irrigation water needs. Train. Man. 1986, 3, 1–102. [Google Scholar]
  46. TUDelft. Land Cover Maps from 2003 up to 2015 for São Paulo State–Brazil. 2016. Available online: http://be-basic.grs.tudelft.nl/maps/316#more (accessed on 26 May 2016).
  47. FAO and IIASA. Crop Suitability Index (Value) for Intermediate Input Level Rain-Fed Sugarcane. 2012. Available online: http://gaez.fao.org/Main.html# (accessed on 13 July 2018).
  48. FAO and IIASA. Crop Suitability Index (Value) for Intermediate Input Level Rain-Fed Alfalfa. 2012. Available online: http://gaez.fao.org/Main.html# (accessed on 13 July 2018).
  49. Avitabile, V.; Herold, M.; Heuvelink, G.B.M.; Lewis, S.L.; Phillips, O.L.; Asner, G.P.; Armston, J.; Ashton, P.S.; Banin, L.; Bayol, N.; et al. An integrated pan-tropical biomass map using multiple reference datasets. Glob. Chang. Biol. 2016, 22, 1406–1420. [Google Scholar] [CrossRef] [PubMed] [Green Version]
  50. IPBES. Global Assessment Report on Biodiversity and Ecosystem Services of the Intergovernmental Science-Policy Platform on Biodiversity and Ecosystem Services; IPBES: Bonn, Germany, 2019. [Google Scholar]
  51. Trisurat, Y.; Alkemade, R.; Verburg, P.H. Projecting Land-Use Change and Its Consequences for Biodiversity in Northern Thailand. Environ. Manag. 2010, 45, 626–639. [Google Scholar] [CrossRef] [Green Version]
  52. Petz, K.; Alkemade, R.; Bakkenes, M.; Schulp, C.J.E.; van der Velde, M.; Leemans, R. Mapping and modelling trade-offs and synergies between grazing intensity and ecosystem services in rangelands using global-scale datasets and models. Glob. Environ. Chang. 2014, 29, 223–234. [Google Scholar]
  53. van Rooij, W. Manual for Biodiversity Modelling on a National Scale Using GLOBIO3 and CLUE Methodology to Calculate Current and Future Status of Biodiversity; MNP: Bilthoven, The Netherlands, 2008. [Google Scholar]
  54. Smith, P.; House, J.I.; Bustamante, M.; Sobocká, J.; Harper, R.; Pan, G.; West, P.C.; Clark, J.M.; Adhya, T.; Rumpel, C.; et al. Global change pressures on soils from land use and management. Glob. Chang. Biol. 2016, 22, 1008–1028. [Google Scholar] [CrossRef]
  55. de Souza, G.S.; de Souza, Z.M.; da Silva, R.B.; Barbosa, R.S.; Araújo, F.S. Effects of traffic control on the soil physical quality and the cultivation of sugarcane. Rev. Bras. Ciênc. Solo 2014, 38, 135–146. [Google Scholar] [CrossRef] [Green Version]
  56. Wischmeier, W.H.; Smith, D.D. Predicting Rainfall Erosion Losses—A Guide to Conservation Planning; USDA, Science and Education Administration: Hyattsville, MD, USA, 1978. [Google Scholar]
  57. de Medeiros, G.O.R.; Giarolla, A.; Sampaio, G.; de Marinho, M.A. Estimates of Annual Soil Loss Rates in the State of São Paulo, Brazil. Rev. Bras. Ciênc. Solo 2016, 40. [Google Scholar] [CrossRef] [Green Version]
  58. Laflen, J.M.; Moldenhauer, W.C. The USLE story. Spec. Publ. WASWC 2003, 1, 1–54. [Google Scholar]
  59. Panagos, P.; Meusburger, K.; Ballabio, C.; Borrelli, P.; Alewell, C. Soil erodibility in Europe: A high-resolution dataset based on LUCAS. Sci. Total Environ. 2014, 479, 189–200. [Google Scholar] [CrossRef]
  60. Panagos, P.; Borrelli, P.; Meusburger, K.; van der Zanden, E.H.; Poesen, J.; Alewell, C. Modelling the effect of support practices (P-factor) on the reduction of soil erosion by water at European scale. Environ. Sci. Policy 2015, 51, 23–34. [Google Scholar] [CrossRef]
  61. Scanlon, B.R.; Reedy, R.C.; Stonestrom, D.A.; Prudic, D.E.; Dennehy, K.F. Impact of land use and land cover change on groundwater recharge and quality in the southwestern US. Glob. Chang. Biol. 2005, 11, 1577–1593. [Google Scholar] [CrossRef]
  62. Edwards, R.; O’Connell, A.; Padella, M.; Mulligan, D.; Giuntoli, J.; Agostini, A.; Koeble, R.; Moro, A.; Marelli, L. Definition of input data to assess GHG default emissions from biofuels in EU legislation. JRC Sci. Policy Rep. EUR 2016, 11, 1577–1593. [Google Scholar]
  63. European Parlament. Directive (EU) 2018/2001 of the European parliament and of the council of 11 December 2018 on the promotion of the use of energy from renewable sources. Off. J. Eur. Union 2018, 328, 1–128. Available online: https://eur-lex.europa.eu/legal-content/EN/TXT/PDF/?uri=CELEX:32018L2001&from=EN (accessed on 20 February 2019).
  64. Kennedy, C.M.; Hawthorne, P.L.; Sochi, K.; Miteva, D.A.; Baumgarten, L.; Uhlhorn, E.M.; Kiesecker, J.M. Biofuels Expansion and Environmental Quality in Brazil BT—Energy Sprawl Solutions: Balancing Global Development and Conservation; Kiesecker, J.M., Naugle, D.E., Eds.; Island Press/Center for Resource Economics: Washington, DC, USA, 2017; pp. 100–111. ISBN 978-1-61091-723-0. [Google Scholar]
  65. Merten, G.H.; Minella, J.P.G. The expansion of Brazilian agriculture: Soil erosion scenarios. Int. Soil Water Conserv. Res. 2013, 1, 37–48. [Google Scholar] [CrossRef] [Green Version]
  66. Bertoni, J.; Neto, F.L. Conservação do solo; Ícone: São Paulo, Brazil, 2005; ISBN 8527401436. [Google Scholar]
  67. Cherubin, M.R.; Karlen, D.L.; Franco, A.L.C.; Tormena, C.A.; Cerri, C.E.P.; Davies, C.A.; Cerri, C.C. Soil physical quality response to sugarcane expansion in Brazil. Geoderma 2016, 267, 156–168. [Google Scholar] [CrossRef]
  68. da Rocha, G.C. Conservação do solo e Cana-de-Açúcar: Aspectos Legais e Bibliométricos e uma Ferramenta de Determinação do Fator C; Universidade de São Paulo: São Paulo, Brazil, 2017. [Google Scholar]
  69. Cervi, W.R.; Lamparelli, R.A.C.; Seabra, J.E.A.; Junginger, M.; de Jong, S.; van der Hilst, F. Spatial modeling of techno-economic potential of biojet fuel production in Brazil. GCB Bioenergy 2020, 12, 136–157. [Google Scholar] [CrossRef] [Green Version]
  70. Wiedenfeld, B. Effects of irrigation water salinity and electrostatic water treatment for sugarcane production. Agric. Water Manag. 2008, 95, 85–88. [Google Scholar] [CrossRef]
  71. da Silva, V.D.; da Silva, B.B.; Albuquerque, W.G.; Borges, C.J.; de Sousa, I.F.; Neto, J.D. Crop coefficient, water requirements, yield and water use efficiency of sugarcane growth in Brazil. Agric. Water Manag. 2013, 128, 102–109. [Google Scholar]
  72. Taye, G.; Vanmaercke, M.; Poesen, J.; Van Wesemael, B.; Tesfaye, S.; Teka, D.; Nyssen, J.; Deckers, J.; Haregeweyn, N. Determining RUSLE P- and C-factors for stone bunds and trenches in rangeland and cropland, North Ethiopia. Land Degrad. Dev. 2018, 29, 812–824. [Google Scholar]
  73. Wicke, B.; Verweij, P.; Meijl, H.; Vuuren, D.P.; Faaij, A.P. Indirect land use change: Review of existing models and strategies for mitigation. Biofuels 2012, 3, 87–100. [Google Scholar]
  74. Verstegen, J.A.; van der Hilst, F.; Woltjer, G.; Karssenberg, D.; de Jong, S.M.; Faaij, A.P.C. What can and can’t we say about indirect land-use change in Brazil using an integrated economic–land-use change model? GCB Bioenergy 2016, 8, 561–578. [Google Scholar]
  75. de Miranda, S.D.C.; Bustamante, M.; Palace, M.; Hagen, S.; Keller, M.; Ferreira, L.G. Regional variations in biomass distribution in Brazilian savanna woodland. Biotropica 2014, 46, 125–138. [Google Scholar]
  76. Herrera, M.C. Cane, Sugar and the Environment; FAO: Cuba, Caribbean, 1999. [Google Scholar]
  77. UNICA. Sugarcane Production Data, UNICADATA. 2018. Available online: http://www.unicadata.com.br/historico-de-producao-e-moagem.php?idMn=31&tipoHistorico=2&acao=visualizar&idTabela=1985&produto=cana&safraIni=2003%2F2004&safraFim=2015%2F2016&estado=RS%2CSC%2CPR%2CSP%2CRJ%2CMG%2CES%2CMS%2CMT%2CGO%2CDF%2CBA%2CSE%2CAL%2CPE%2CP (accessed on 15 October 2018).
  78. Menandro, L.M.S.; Cantarella, H.; Franco, H.C.J.; Kölln, O.T.; Pimenta, M.T.B.; Sanches, G.M.; Rabelo, S.C.; Carvalho, J.L.N. Comprehensive assessment of sugarcane straw: Implications for biomass and bioenergy production. Biofuels Bioprod. Biorefining 2017, 11, 488–504. [Google Scholar]
  79. Zinn, Y.; Resck, D.V.; da Silva, J.E. Soil organic carbon as affected by afforestation with Eucalyptus and Pinus in the Cerrado region of Brazil. For. Ecol. Manag. 2002, 166, 285–294. [Google Scholar] [CrossRef]
  80. Macedo, I.C.; Seabra, J.E.A.; Silva, J.E.A.R. Green house gases emissions in the production and use of ethanol from sugarcane in Brazil: The 2005/2006 averages and a prediction for 2020. Biomass Bioenergy 2008, 32, 582–595. [Google Scholar]
  81. De Figueiredo, E.B.; La Scala, N. Greenhouse gas balance due to the conversion of sugarcane areas from burned to green harvest in Brazil. Agric. Ecosyst. Environ. 2011, 141, 77–85. [Google Scholar]
  82. de Freitas, P.L.; Landers, J.N. The Transformation of Agriculture in Brazil through Development and Adoption of Zero Tillage Conservation Agriculture. Int. Soil Water Conserv. Res. 2014, 2, 35–46. [Google Scholar] [CrossRef] [Green Version]
  83. da Silva, A.M. Rainfall erosivity map for Brazil. CATENA 2004, 57, 251–259. [Google Scholar] [CrossRef]
  84. IBGE. Mapa do Solos do Brail. 2001. Available online: https://mapas.ibge.gov.br/tematicos/solos (accessed on 3 June 2016).
  85. da Silva, A.M.; Alvares, C.A. Levantamento de informações e estruturação de um banco dados sobre a erodibilidade de classes de solos no estado de São Paulo. Geociências 2007, 24, 33–41. [Google Scholar]
  86. Zhang, H.; Yang, Q.; Li, R.; Liu, Q.; Moore, D.; He, P.; Ritsema, C.J.; Geissen, V. Extension of a GIS procedure for calculating the RUSLE equation LS factor. Comput. Geosci. 2013, 52, 177–188. [Google Scholar]
  87. Moore, I.D.; Burch, G.J. Physical basis of the length-slope factor in the universal soil loss equation 1. Soil Sci. Soc. Am. J. 1986, 50, 1294–1298. [Google Scholar]
  88. Moore, I.D.; Wilson, J.P. Length-slope factors for the Revised Universal Soil Loss Equation: Simplified method of estimation. J. Soil Water Conserv. 1992, 47, 423–428. [Google Scholar]
  89. Hrabalikova, M.; Janeček, M. Comparison of different approaches to LS factor calculations based on a measured soil loss under simulated rainfall. Soil Water Res. 2017, 12, 69–77. [Google Scholar] [CrossRef] [Green Version]
  90. Weber, E.; Hasenack, H.; Ferreira, C.J.S. Adaptação do Modelo Digital de Elevação do SRTM para o Sistema de Referência Oficial Brasileiro e Recorte por Unidade da Federação; UFRGS Centro de Ecologia: Porto Alegre, Brazil, 2004; Available online: https://www.ufrgs.br/labgeo/index.php/50-dados-espaciais/262-modelos-digitais-de-elevacao-dos-estados-brasileiros-obtidos-a-partir-do-srtm-shuttle-radar-topography-mission (accessed on 19 October 2020).
  91. Silva, B.P.C.; Silva, M.L.N.; Batista, P.V.G.; Pontes, L.M.; Araújo, E.F.; Curi, N. Soil and water losses in eucalyptus plantation and natural forest and determination of the USLE factors at a pilot sub-basin in Rio Grande do Sul, Brazil. Ciênc. Agrotecnol. 2016, 40, 432–442. [Google Scholar]
  92. da Silva, M.A.; Silva, M.L.N.; Curi, N.; Oliveira, A.H.; Avanzi, J.C.; Norton, L.D. Water erosion risk prediction in eucalyptus plantations. Ciênc. Agrotecnol. 2014, 38, 160–172. [Google Scholar]
  93. Panagos, P.; Borrelli, P.; Meusburger, K.; Alewell, C.; Lugato, E.; Montanarella, L. Estimating the soil erosion cover-management factor at the European scale. Land Use Policy 2015, 48, 38–50. [Google Scholar]
  94. da Silva, A.M.; Casatti, L.; Alvares, C.A.; Leite, A.M.; Martinelli, L.A.; Durrant, S.F. Soil loss risk and habitat quality in streams of a meso-scale river basin. Sci. Agric. 2007, 64, 336–343. [Google Scholar] [CrossRef]
  95. Turc, L. Estimation of irrigation water requirements, potential evapotranspiration: A simple climatic formula evolved up to date. Ann. Agron 1961, 12, 13–49. [Google Scholar]
  96. Rudorff, B.F.T.; Aguiar, D.A.; Silva, W.F.; Sugawara, L.M.; Adami, M.; Moreira, M.A. Studies on the rapid expansion of sugarcane for ethanol production in São Paulo State (Brazil) using Landsat data. Remote Sens. 2010, 2, 1057–1076. [Google Scholar] [CrossRef] [Green Version]
  97. Jantalia, C.P.; Resck, D.V.S.; Alves, B.J.R.; Zotarelli, L.; Urquiaga, S.; Boddey, R.M. Tillage effect on C stocks of a clayey Oxisol under a soybean-based crop rotation in the Brazilian Cerrado region. Soil Tillage Res. 2007, 95, 97–109. [Google Scholar] [CrossRef]
  98. De Oliveira Ferreira Silva, C.; Lilla Manzione, R.; Albuquerque Filho, J.L. Large-scale spatial modeling of crop coefficient and biomass production in agroecosystems in Southeast Brazil. Horticulturae 2018, 4, 44. [Google Scholar] [CrossRef] [Green Version]
  99. INMET. Dados Historicos. 2018. Available online: http://www.inmet.gov.br/portal/index.php?r=bdmep/bdmep (accessed on 26 May 2016).
  100. Allen, R.G.; Pereira, L.S.; Raes, D.; Smith, M. Guidelines for computing crop water requirements-FAO Irrigation and drainage paper 56, FAO-Food and Agriculture Organisation of the United Nations, Rome (http://www. fao. org/docrep) ARPAV (2000), La caratterizzazione climatica della Regione Veneto, Quade. Geophysics 1998, 156, 178. [Google Scholar]
Figure 1. Land use/cover types replaced by sugarcane between 2004 and 2015.
Land 09 00397 g001
Figure 2. Annual LUC-related CO2 emissions from sugarcane expansion between 2005 and 2015, considering an amortization period of 20 years. Negative values represent carbon accumulation.
Land 09 00397 g002
Figure 3. Difference in the mean species abundance between sugarcane and land use/cover prior to conversion for the period of 2005 to 2015. Positive values indicate a loss of mean species abundance.
Land 09 00397 g003
Figure 4. Difference in soil loss between sugarcane and land use/cover prior to conversion in the time period of 2005 to 2015.
Land 09 00397 g004
Figure 5. Difference in the annual water shortage between sugarcane and land use/cover prior to conversion in the time period of 2005 to 2015.
Land 09 00397 g005
Figure 6. Environmental performance index from sugarcane expansion in the period of 2005 to 2015. Negative values indicate reduced environmental impacts of sugarcane compared to the previous land use/cover.
Land 09 00397 g006
Publisher’s Note: MDPI stays neutral with regard to jurisdictional claims in published maps and institutional affiliations.

