Article

Uncovering Ecosystem Services of Expropriated Land: The Case of Urban Expansion in Bahir Dar, Northwest Ethiopia

by
Wubante Fetene Admasu
1,2,*,
Annelies Boerema
2,3,
Jan Nyssen
4,
Amare Sewnet Minale
5,
Enyew Adgo Tsegaye
6 and
Steven Van Passel
2
1
Department of Land and Real Property Valuation, Bahir Dar University, Yibab Campus, P.O. Box 5001, Bahir Dar, Ethiopia
2
Department of Engineering Management, University of Antwerp, Stadscampus, Prinsstraat 13, 2000 Antwerp, Belgium
3
Ecosystem Management Research Group (ECOBE), University of Antwerp, Universiteitsplein 1 C.131, 2610 Wilrijk, Belgium
4
Department of Geography, Ghent University, Krijgslaan 281, S8, 9000 Gent, Belgium
5
Department of Geography and Environmental Studies, Bahir Dar University, Wisdom Tower, P.O. Box 79, Bahir Dar, Ethiopia
6
Department of Natural Resource Management, Bahir Dar University, Wisdom Tower, P.O. Box 79, Bahir Dar, Ethiopia
*
Author to whom correspondence should be addressed.
Land 2020, 9(10), 395; https://doi.org/10.3390/land9100395
Submission received: 8 September 2020 / Revised: 16 October 2020 / Accepted: 16 October 2020 / Published: 19 October 2020
(This article belongs to the Special Issue Exploring the Relationships between Land Use and Ecosystem Services)

Abstract

:
In Ethiopia, urban expansion happens at high rates and results in land expropriations often at the cost of agriculture and forests. The process of urban expansion does not include assessment of ecosystem services (ES). This has been causing unintended environmental problems. This study aims to uncover ES of three most important land use types (cropland, agroforestry, and grassland) that are threatened by land expropriation for urban expansion in Bahir Dar City. The study applied a participatory approach using community perception and expert judgments (N = 108). Respondents were asked to locate their perceptions on the use of 35 different ES, and then to evaluate the potential of the land use. Respondents were shown to have the ability to differentiate between ES and land use in terms of their potential to deliver ES. The results show that agroforestry is expected to have a high relevant potential to deliver 31% of all ES, but cropland 20% and grassland 14%. Food, fodder, timber, firewood, fresh water, energy, compost, climate regulation, erosion prevention, and water purification and treatment were identified as the ten most important services. It is not only the provisioning services that are being supplied by the land use types which are expropriated for urbanization, but also regulating, supporting and cultural services. To ensure sustainable urban land development, we suggest the consideration of the use of ES and the potential of the land use to supply ES when making land use decisions, including land expropriation for urban expansion.

1. Introduction

An ecosystem is an ecological endowment that constitutes structures and processes [1,2], with ecosystem potential referring to the capacity to provide ES to human beings [3]. ES are considered to be the benefits people acquire from ecosystems [1,4]. ES link natural capital and the well-being of the society, and comprises an important foundation for achieving sustainable development and enhancing the well-being of the people [4,5]. Studies conducted at larger and smaller scales revealed that there is a decline in the ES supply over time [1,4,6]. The supply of ES depends on biophysical conditions and changes over space and time due to human-induced climate change [7]. Studies indicate that land use and land cover changes are considered to have major human-induced effects on ecosystems [7,8]. Land use land cover changes due to rapid urbanization through agricultural land conversion create environmental pressures that impact ES [4,9,10,11]. Urbanizing agricultural land uses is a global phenomenon that is increasing overtime. Globally the total urban land area was 213 million hectares in 2000, and projected to be increased to more than six hundred million hectares by 2040 [12]. Overtime, an increase in the pressure to have more urban land and concentration of people in the urban areas causes immense changes of the loss of ES. The process of urban expansion mainly affected the various types of peri-urban land use such as forest land, cropland, water bodies that supply ecosystem services. It transforms the semi-natural or natural land covers into urban built up, which affects the ecosystem function by changing the biogeochemical process and flow pattern and results in a loss of ES. Much research is conducted to assess the impact of urban expansion on ES, which tells us that continuous urban expansion causes a decline in ES [13,14,15].
In some countries (e.g., Ghana and China) the urbanization process used land expropriation as one way to urbanise agricultural land uses [16,17]. However, in Ethiopia, land expropriation is the only way of accessing rural land for urban expansion. This is because, according to the Ethiopian constitution, land is owned by the state and farmers only have a lifetime land use rights, they cannot sell and exchange their land [18]. According to proclamation no. 455/2005, it refers to the practice of compulsorily taking someone’s land without the permission of the landowner or user by the government or others for the interests of the public with the payment of compensation [18,19]. The farmers cannot object the land expropriation decision, but they can claim on the adequacy of compensation. The law is criticized as it does not clearly put the evaluation criteria for public interest, instead give the power for the municipalities and the districts to decide on it [20].
Though studies recommend the integration of ES into the urban expansion processes [21,22], including land expropriation [23], for the sustainable development of the land, they overlooked ES. Lack of proper consideration of ES in the process of land expropriation for urban expansion may have two effects: Ex ante, farmers will be reluctant to conserve their land, which would have a significant impact on ES. Studies argue that improper land expropriation processes can potentially be sources of tenure insecurity. In turn, tenure insecurity undermines incentives to manage land sustainably [24]. Ex post, when the ES are not properly assessed vis-à-vis the process of land expropriation for urbanization, it will cause unintended land cover changes that can lead to unexpected environmental degradation. A direct consequence of urban expansion is wide-ranging losses of some of the ES such as food and fiber production, freshwater, carbon storage etc. This is because of the loss of vegetations from the agricultural lands. Indirectly, it deters the provision of the regulating and supporting services such as water regulation, air and climate regulation and nutrient recycling [25,26,27,28].
Therefore, assessment of ES of agricultural land use prior to any land use decisions, which can induce land cover changes, is becoming crucial for sustainable land use development. In recent years, ES have gained great attention after the recommendation by Millennium Ecosystem Service Assessment (MEA) [4,29,30]. Many studies have been conducted to assess, map, and quantify ES in different parts of the globe. The ES assessments vary from simple [8] to intricate evaluations that assess the entire ES flows [31,32,33]. Most emphasized a specific ecosystem category (e.g., provisioning, regulating, support and cultural services) [3,34,35,36,37]. However, there are also studies that assessed all the ecosystem service bundles of a given landscape [38,39]. Previous studies have used participatory, biophysical and other types of assessment methods. For data-scarce regions, including the area where this study is conducted, participatory assessments are favored since they do not need large quantity of biophysical information [40]. The participatory assessment, which is also used in this study, is regarded as appropriate to assess the ES since it uses the long-term experiences of the direct users of the environmental benefits [37,41]. In addition, it is also argued that information from the local community is required for the proper selection of indicators as well as evaluation and validation of possible management options [39,42,43,44].
Although substantial efforts have been made to assess ES and recommend alternatives for areas with limited data, very few ES assessment studies were conducted in African countries due to limitations in having appropriate data and techniques [39,45,46]. It is even worse in terms of ES assessment studies in relation to land expropriations for urban expansion. Likewise, in Ethiopia, there are few ES assessments [47,48,49], but their focus were on a particular land use such as forest, wetlands, etc. In addition, there is research conducted on land expropriation, compensation, etc., but not in relation to ES. In Ethiopia, there is no consideration of ES during the land expropriation decisions to convert agricultural land into urban land use. The use of ES that the society is benefiting from the land use is not well understood while they are crucial in increasing consciousness of the consequences and enhanced land use decision making. Therefore, the objective of the study is to fill this gap by assessing the perceived value of ES and potentials of three most important land uses that are threatened by urban expansion in Bahir Dar, northwest Ethiopia by addressing the following questions: (1) Which of the ES are mostly used by the local communities? Is there a difference among cropland, agroforestry, and grassland in the uses of the ES? Is ES use different at the ‘kebele’ level (i.e., is the smallest administrative unit in Ethiopia)? (2) What is the potential of cropland, agroforestry, and grassland to deliver ES? Is there a difference in the potential to supply ES among the land use types? Is the potential to supply ES different at the ‘kebele’ level? (3) How households, committees, and experts rank the ES according to their use? Is there a difference among the stakeholders in ranking the ES? (4) How is the change in ES for the last 15 years? The paper uses community perceptions and expert opinions to answer these questions.

2. Materials and Methods
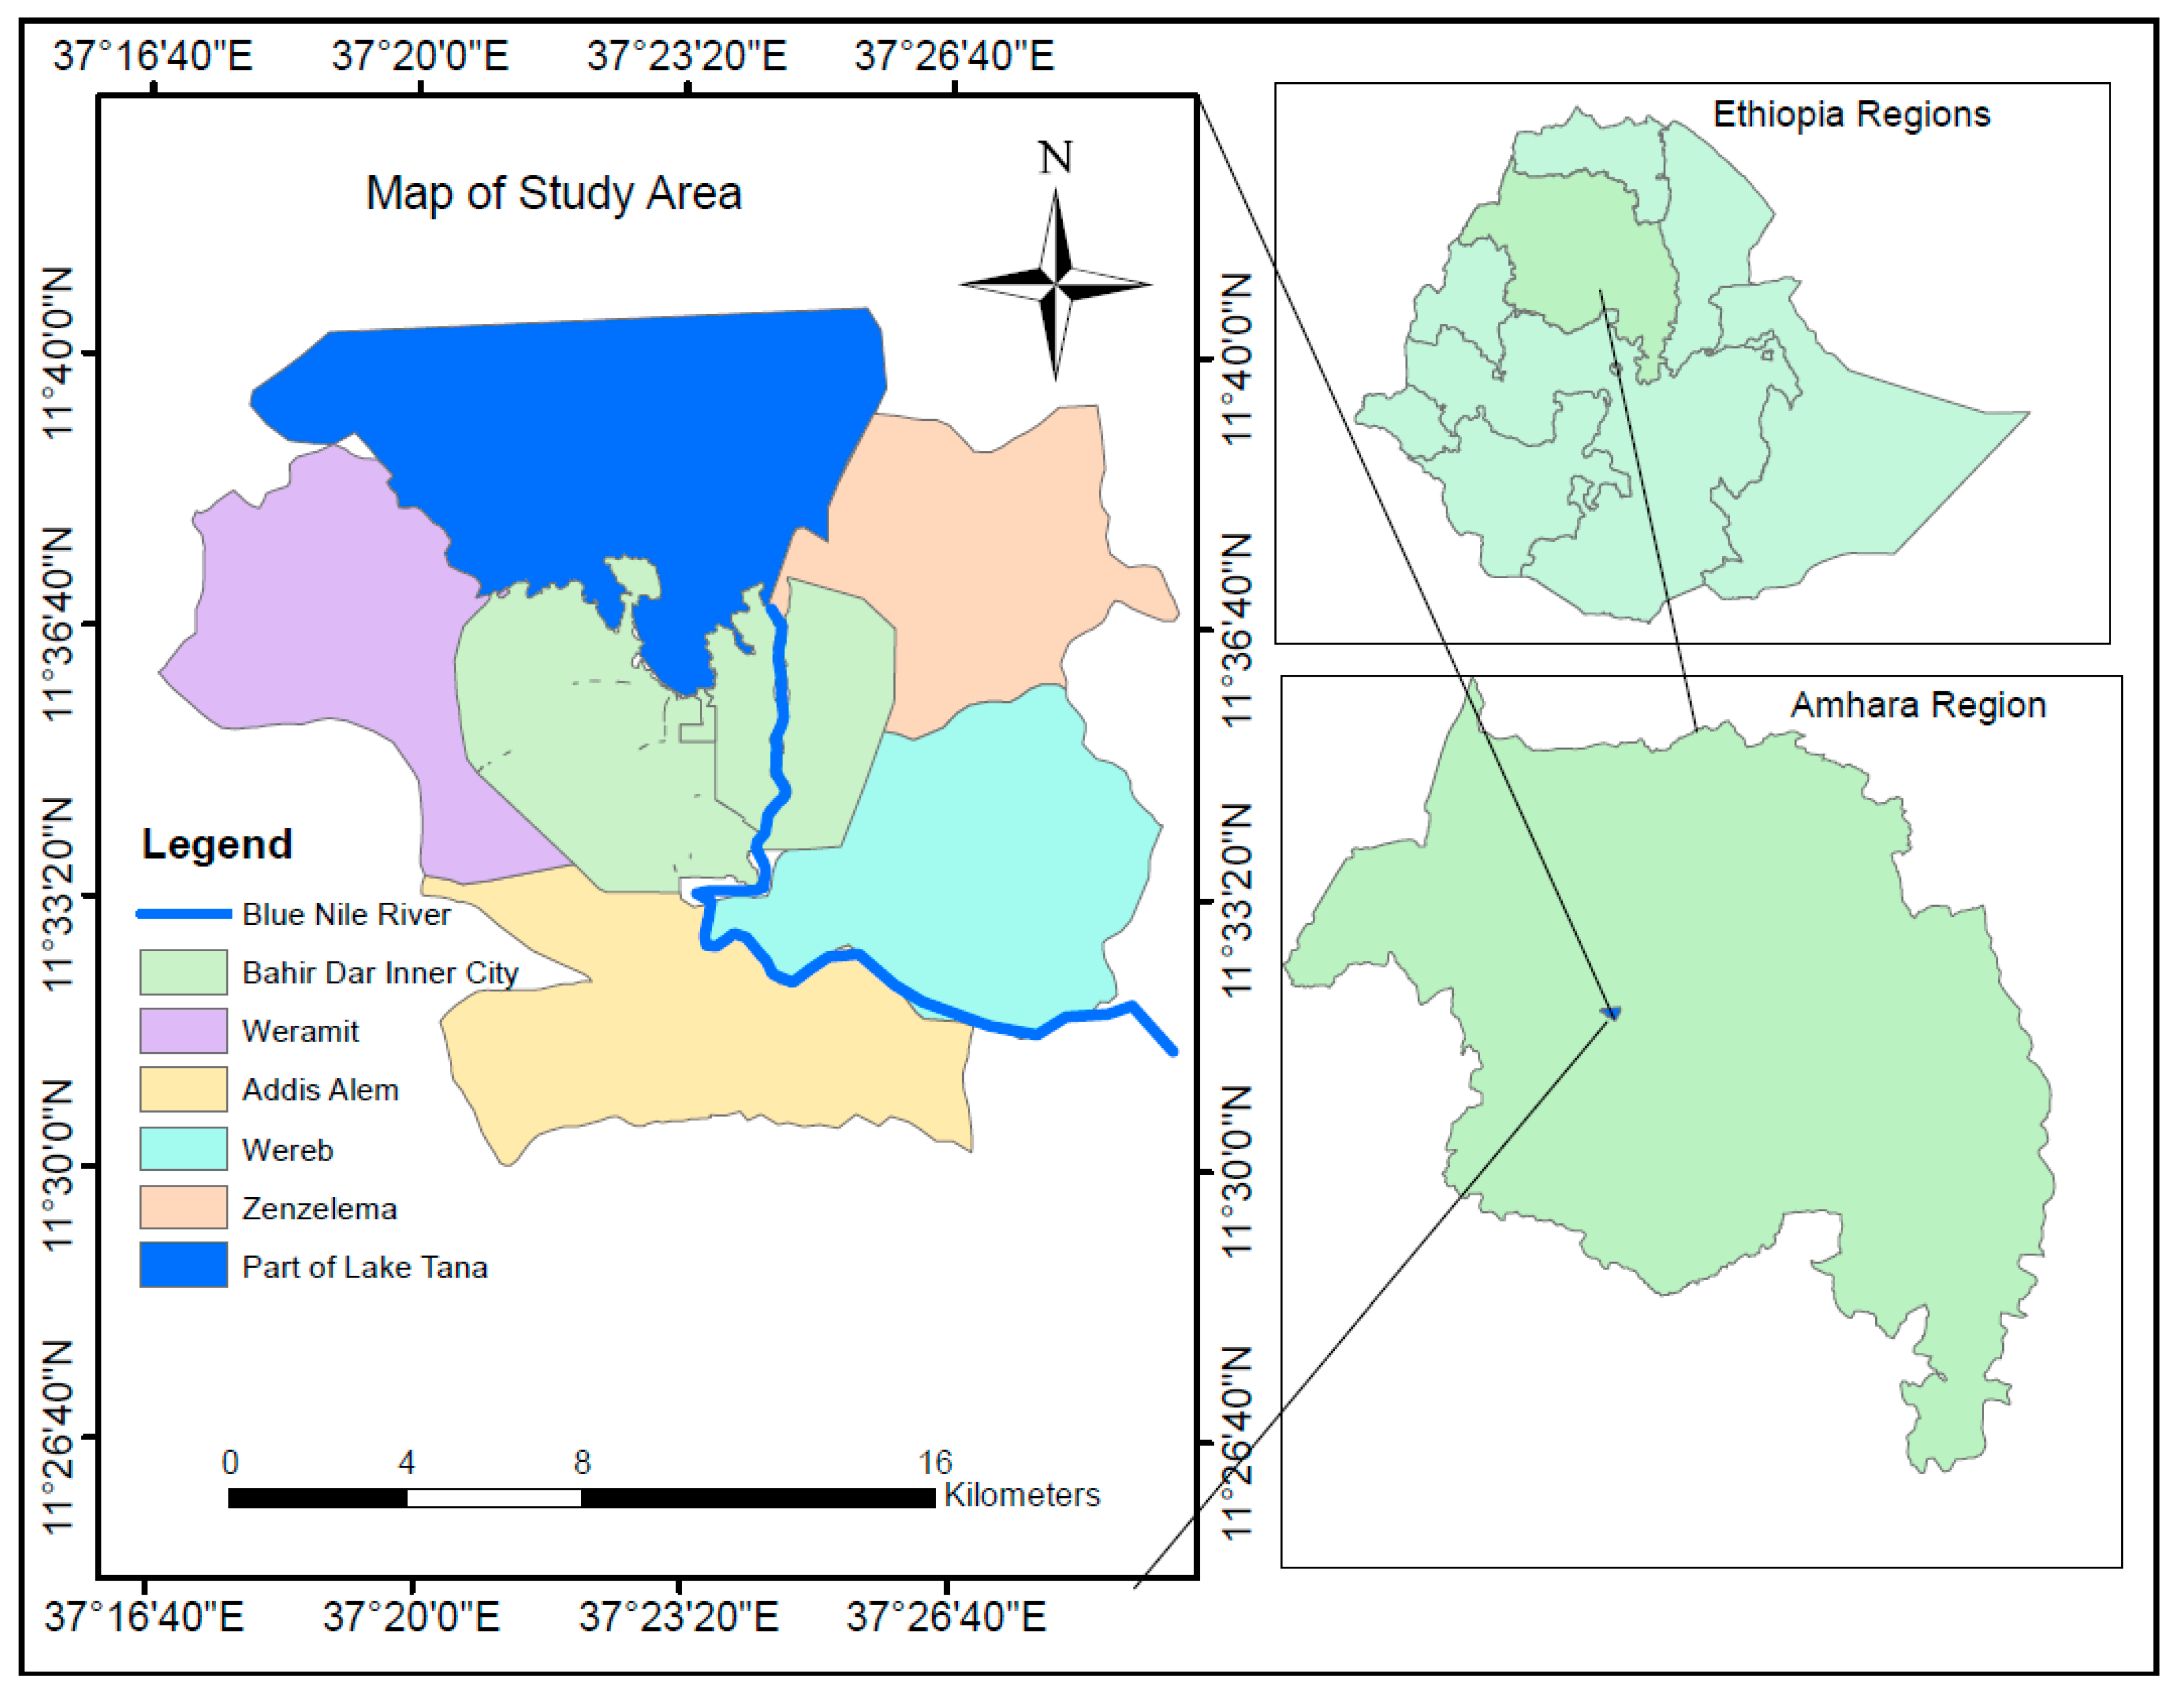
2.1. Study Area

Ethiopia, an East-African country with more than 100 million people, is the second largest populous country in the continent. In Ethiopia, most of the population resides in rural areas, but there is a speedy urbanization. The number of people living in urban areas was 8 million in 1995, and increased to 22 million by 2018 [50]. Bahir Dar is the business and political center of the Amhara National Regional State (ANRS), and the 3rd biggest city in the country. It is situated at 1800 meters above sea level and 578 km northwest of Addis Ababa, the country’s capital. The city has an annual rainfall ranging from 1000–1600 mm and 20 °C annual average temperature [51].
Bahir Dar was selected as a case study area for the following reasons: First, Bahir Dar is experiencing very fast demographic and spatial growth. The number of people living in Bahir Dar was estimated at 54,766 in 1984 [52] and 300,000 in 2016, and projected to increase more than four times by 2040 [53]. The existing masterplan of Bahir Dar includes four peri-urban kebeles, namely Weramit, Addis Alem, Wereb, and Zenzelima, situated immediately beyond the city boundaries. They are equivalent to villages and each of them has their own boundaries (Figure 1). The total area of Bahir Dar was 279 ha in 1957 [54] and increased to 5579 ha in 2015 in which 2739.6 ha was a built up area [55]. The built up area is also projected to be 5276 ha in 2045 [56] Second, the rapid growth in demography and area has resulted into a large number of land expropriation cases each year because the demand for urban land is mainly met by compulsorily acquiring land from the rural kebeles. Bahir Dar has annually incorporated, on average, 150 ha of agricultural land from the surrounding kebeles through expropriations between 2007–2017 [23]. Third, Bahir Dar is situated on the southern shore of Lake Tana, the largest lake in Ethiopia and the main source of the Blue Nile (Figure 1). In 2015, Lake Tana Biosphere Reserve was accepted as one of the UNESCO biosphere reserves [57]. There has been an increased pressure on its wetlands due to rapid land use land cover changes in the area, including rapid urbanization and industrialization. Fourth, most of the previous studies have focused on larger or megacities [58,59,60,61]. Hence, the study of a smaller city like Bahir Dar is important to understand and assist in guiding sustainable urban development in developing countries.

2.2. Methods of Data Collection and Analysis

2.2.1. Data Collection Instruments

The choice of the data collection instruments depends on the type of research and the accessibility and availability of information. Each of the instruments has its own strengths and weaknesses. For example, it is argued that interviews and focus group discussions can provide rapid assessment; however, the results may not be accurate and difficult to reproduce [62,63]. On the other hand, survey and land use and land cover data could be precise; however, they require longer time period and big finance. In this study, a combination of methods was employed to collect data. These include semi-structured interviews (SSIs), focus group discussions (FGDs), and direct field observations (DO). Three steps were followed in the process of data collection.
Step 1: Preparation of lists of ES
Lists of 35 ES (11 provisioning services, 8 regulating services, 5 supporting services and 10 cultural services) were prepared by the researchers based on the categories established by the Millennium Ecosystem Assessment [4] and The Economics of Ecosystem and Biodiversity [30].
Step 2: Conduct Focus Group Discussions (FGDs) with experts
FGDs were held with six experts (from the Bahir Dar city administration) to identify the main land use types and modify the classification and indicators of ES that were prepared in step one. The experts were selected based on their expertise and experience in the study areas. Three of them were natural resource management experts, two of them were environmentalists and one of them was an agriculturalist. All of them worked in the study areas for more than five years. During the FGDs, the research problem and the objectives of the study together with the lists of ES were presented to the experts. In the discussions, experts were asked to identify the land use that are mostly threatened by land expropriation for urban expansion and the most relevant ES in the study area based on their expertise, resulting in three main land use (crop land, agroforestry and grass land) and 35 ES from the four ES categories.
Step 3: Conduct Semi-Structured Interviews (SSIs)
SSIs were conducted with the local communities and kebele level natural resource management experts. Proportional quota sampling was used to select respondents. This method is used to make the sample representative of the target population in terms of gender, working status, membership in committee of natural resource management. [38]. A total of 102 people (98 community members1 and four kebele level experts) were interviewed. The one-to-one SSIs were conducted in two rounds between May 2018 and August 2018 using Qualtrics software. In the first round, the respondents were asked to give their opinion on: (i) the uses of the 35 ES on the scale of: 5 = very high usage, 4 = high usage, 3 = medium usage, 2 = low usage, 1 = very low usage, and 0 = not at all; (ii) the potentials of the cropland, agroforestry and grassland to provide each of the ES based on the scale of: 5 = very high potential, 4 = high potential, 3 = medium potential, 2 = low potential, 1 = very low potential, and 0=not at all; (iii) the ES changes over the last 15 years (i.e., the years in which the land expropriation for urban expansion has been increasing [23]) based on a scale of highly increasing, increasing, stable, decreasing, and highly decreasing. The interviewer made lots of effort to explain how the interviewees should select the scales and to have a common understanding. For instance, for the “highly decreasing”, the interviewees were informed to select it if they feel that it has been decreasing, but there is an upward change in the rate of decreasing. For each interviewee, the interviewer introduced the concepts and types of ES and the purpose of the study. In addition, photos and maps of the different land use types of the study areas were presented for the interviewees to help overcome limitations of the methods that can be caused by lack of awareness by the respondents [64].
The second round is devoted to the rankings of ES. To this end, we decided to limit the number of ES to be ranked to 15 to make it manageable for the respondents, and the first 15 ES were selected based on their aggregate mean points from the results of the first round. Then, 40 respondents were randomly selected from the participants of the first round, 37 of whom were interviewed and asked to rank among 15 ES by order of importance from their viewpoint on a scale from 1 = least important to 15 = most important. In addition, the four kebele level experts participated in the rankings. For the purpose of rankings, sequential most-least procedure was used, as it is appropriate to have a sequence of ES from the most relevant item to the least according to the importance level to the society. The respondents chose the first most and least items using the entire list of alternatives, the second items using the rest, and so on till the lists exhausted [65].

2.2.2. Data Analysis Techniques

The collected data were transferred from Qualtrics software to Excel. First, percentages and means for the demographic characteristics and the mean points of the farmers’ perceptions of the use of ES, the potential of land use to supply ES, the changes of ES and the rankings of ES were calculated using excel applications. Then, the matrix model has been used to analyse the scorings because it is flexible and applicable to both data scarcity and abundant situations. [8]. Based on the mean points, the matrix of the different land use capacities and use of ES were prepared. The scales were modified as 0.1 to 0.99 = very low, 1 to 1.99 = low, 2 to 2.99 = medium, 3 to 3.99 = high, and 4 to 5 = very high, as mean points are in decimal numbers. The land use types were placed on the X-axis and the ES were placed on the Y-axis; and the intersection points represent the mean points. At the intersections, different land use type potentials and uses of the individual ecosystem service were assessed. The mean points were compared between land use types, ecosystem service categories and individual ES. Information from the open-ended questions and field observations were used to justify and cross-check some results from the interviews. In the rankings, the mean points were taken to show the priority of each ecosystem service by different stakeholders. In addition, a comparative analysis of the ranking of the ES was made among different stakeholders. Moreover, standard deviation measures were applied to measure the variations.

3. Results

3.1. General Information about the Local Communities

The demographic information of the households is presented in Table 1. This study had both male (90%) and female (10%) headed households from the local community. According to the data obtained from Bahir Dar City Administration (2018), the share of female headed households is similar to their share from the from the target population (i.e., total number of households), which is 11%. The age of the majority of the respondents were between 41 and 52 (53%) years old. Most of the respondents (91%) were married, and 74% were illiterate. The average family size per household of the sample respondents was 6.03. The dominant agricultural activity in the study areas was crop and livestock production, accounting for 97 percent of the respondents. We noted that the major crops in the area included teff, maize, finger millet, beans, mangoes, avocadoes, coffee, chat, gesho, etc. The livestock included oxen, cattle (almost everyone has oxen and cattle), sheep, and goats. Respondents were also asked to roughly estimate the total annual income from all sources. Most of them (74%) were in the range of 20,000 and 40,000 Ethiopian Birr (ETB) per year (1 USD = 27.8743 or 1 EURO = 31.4534, on 29 November 2018). There were also some respondents (19%) who estimated their annual income to be more than 40,000 ETB. More than half of the respondents (59%) were affected by land expropriations. From these, 5 percent lost their entire land, 36 percent lost one quarter, 36 percent lost half, and 22 percent lost three-quarters of their landholdings.

3.2. Farmers’ Perceptions On the Use of ES

The mean rounded value of the use of each individual ES within each ecosystem/land use is shown in Table 2. In agroforestry about 29% of all considered ES are perceived as very high to high use, but in cropland and grassland this is only 15–17%. Regarding individual ES at a land use level, food (including crops, vegetables, livestock products) and fodder are perceived as very high usage in the crop land. Timber production, firewood production and climate regulations are valued as very high usage in the agroforestry. Erosion prevention, water purification and treatment, and nutrient recycling are recognized as very high usage in grassland.
In relative terms, the provisioning services have received a wide range of values across land use types. For example, food and fodder are very high in crop land, but very low in grass land. Similarly, timber and firewood are very high in agroforestry, but low in cropland and grassland. However, regulating services have similar ratings across land uses, except water purification and treatment, which is very high in agroforestry and grass land, but low in cropland. In the cultural section, there are no services within the high and very high category, and the services are rated similarly across the land uses.
Comparison of the use of ES categories by kebeles is shown in Figure 2. The ES have been assigned different perceived use values in the different kebeles. Zenzelima kebele is perceived as the area where all the ecosystem service categories received the highest mean points, followed by Weramit kebele. The lowest mean points of provisioning and cultural services are assigned to Addis Alem kebele, while Wereb kebele is perceived as the lowest in the use of supporting services (Figure 2).

3.3. Perceptions of the Farmers on Ecosystem’s Potentials

The results from the perceptions of the respondents about the future capacity of each of the ES are presented in mean rounded values for a land use per ecosystem service (Table 3). Respondents indicated that crop land has the highest relevant potential to provide food and fodder, while agroforestry to provide climate regulation and erosion prevention. In grass land, water regulation, erosion prevention, water purification and treatment and nutrient recycling were ranked highest. There was no service from the cultural category, for which any land use has a high capacity, while the spiritual and religious potential of crop land received the lowest ratings.
The likelihood of services being provided by different land use types has also been indicated. All land uses were assessed similarly (very high to high relevant potential) about their potential to provide climate regulation and erosion prevention. Similarly, sense of place has received similar ratings (medium relevant potential) from the three land uses. However, for most of the ES, the potential of the three land use types is perceived differently. Overall, local communities indicate that these land use types have only a high potential for a limited amount of ES. Agroforestry is expected to have a high relevant potential to deliver 31% of all ES, but crop land only 20% and grass land only 14%. Moreover, in comparing high and low potential proportions of the land use types, agroforestry has similar proportions of high (31%) and low potential (29%) ES. It has the greatest relevant potential to deliver the variety of ecosystem goods and services for human wellbeing. However, there is a big divergence between high and low potential in the case of crop land (20% and 77%) and in grass land (14% and 63%).
Comparing land use types in terms of average potential to provide ecosystem service categories (Figure 3), we noted a highest capacity in agroforestry to provide all the ecosystem service categories. Cropland received a moderate rating in provisioning services, but the lowest ratings in others, unlike grassland, which received a lowest potential in provisioning services and moderate ratings in the rest of ecosystem service bundles. Comparing study areas with their potential to provide ecosystem service bundles (Figure 3) we noted a highest capacity in Zenzelima kebele, followed by Weramit kebele. Addis Alem kebele has been perceived to have lowest potential in the supply of provisioning and cultural services, while Wereb kebele has been perceived to have lowest potential in the provision of regulating and supporting services.

3.4. Rankings of ES

Generally, Table 4 shows how the prioritization of the most usable ES varied across stakeholders, except in the case of food and wild fruit, for which all stakeholders have the same ranking (i.e., with the lowest standard deviations). Households and committees gave more priority for provisioning services than other ES categories; however, experts showed better priority for regulating services (see Table 4).

3.5. Changes in ES

In general, many of the respondents agreed that there is a decreasing trend in the supply of ecosystem goods and services (63% in provisioning services, 81% in regulation services, 82% in supporting services). Wild fruit, timber, fresh water, air quality regulation, climate regulation, water regulation and maintenance of soil fertility are considered to be decreasing by many of the respondents (more than 95%). In the provisioning services, there are some ES, such as food, fodder, and compost (manure) that are mentioned as increasing at least by some of the respondents (11%). However, in other ES categories, there are no services which are perceived as increasing (i.e., none of the participants stated an increasing trend). The participants’ justification for the increasing trend include the use of more chemical and natural fertilizers and conversion of grass lands and semi-forests to crop land. In the cultural section, most of the participants (59%) recognized the services as stable, though there are some (33%) who perceived a decreasing trend. In this category, spiritual and religious service is considered to be the most stable, while cultural diversity, inspiration, aesthetic values, sense of place, and social relations are the major ones within the decreasing trend.
The repeatedly cited reasons by participants for the decrease in the supply of ES in the study areas include: (i) incorporation of large amounts of land in the city’s boundary each year; (ii) the encroachment of investment projects, industries, manufacturing, etc.; (iii) illegal house building by the residents and others to get replacement urban land in case of evictions (if somebody is evicted from a house, the government will give him/her replacement urban land for housing)2; (iv) conversion of the crop land into plantations of eucalyptus trees, which are assumed to cause shortages of water in the area; (v) overuse of chemical fertilizers since the size of the remaining land is very small in most of the farmers3; (vi) cutting and mismanagement of natural trees which are situated in the crop land by farmers since there is no compensation paid for retaining them; and (vii) land tenure insecurity, which is caused by fear of land expropriations. This discourages farmers from practicing land management activities as the compensation does not depend on the productivity of the individual parcel. As a result, farmers do not worry about the reduction in the amount of compensation because of the mismanagement of their landholdings.

4. Discussion

4.1. Perceptions and Their Motivations

This study was aimed at uncovering the ES which are being supplied by the three land use types that are threatened by urban expansion, and to integrate them in the land use policy and decision making and management. Our assessment indicates that the stakeholders were shown to have the ability to distinguish ES in terms of their use, and ecosystems in terms of their potential to deliver services. Our result shows that most of the ES that are found in the provisioning services category (67%) have received high or very high perceived use value at least in one of the land use types. These include food, fodder, timber, firewood, fresh water, wild fruit, biomass, and compost. As compared to others, in aggregate terms, the highest perceived use value of ES were given to the provisioning services which is similar to the results of previous studies conducted on the participatory assessment of agricultural ES [48,66] and other studies [67,68]. Our results also show that there are some ES within regulating services category such as climate regulation, water regulation, erosion prevention and water purification and treatment that received high or very high perceived use values. This shows that the use of regulating services were also noticed, even though there are studies which indicated that the respondents do not often notice regulating services [69,70], and they are unfamiliar to the general public [71]. Nevertheless, there are studies which documented that regulating services were likely to be perceived by the participants [72]. Supporting services has been given the least perceived in all ecosystem categories, while cultural services are given moderate perceived use values in all ES categories. We believe that our explanation during the interview might have helped the participants to understand the services, but it would not be easy to understand all the ES bundles within the limited interview period and also the lack of previous knowledge.
The results of the study revealed that the perceived use value of ES has been found different among land use types. In the study area, from the three land use types, the perceived use value of ES (i.e., the aggregate mean points) from agroforestry is the highest in all ES categories, followed by cropland. This may be because agroforestry is an ecosystem that makes possible to have trees and crops together which can help to diversify and increase revenue and production while protecting ES. This result is consistent with a study by Temesgen and Wu [48]. Considering individual ES, agroforestry has been recognized for very high usage of timber production, firewood production and climate regulations, while cropland has received very high usage of food (including crops, vegetables, livestock products) and fodder. Erosion prevention, water purification and treatment, and nutrient recycling are perceived as very high usage in grassland. It has also been shown that the perceived use value of ES is different at kebele level. In this regard, Zenzelima kebele is perceived as the one which has ES with the highest perceived use values in all ES categories. According to information from Bahir Dar Zuria Wereda Agriculture Office (2019), this is because it has some characteristics such as the most productive and less stony soils, and highest water storage that ease plantations in the area as compared to other kebeles.
Regarding the potential of the land use types to deliver ES, the results are consistent with the outcomes of the assessments of ES’s use. This shows that frequent use aligns with an acknowledgment of a more capacity to supply what has been used [36]. It is observed that the farmers’ perception on the potential of the land use in supplying ES are different at land use level. Accordingly, in the study area, agroforestry is the dominant land use, which has been perceived to have the highest potential to provide ES in all ES categories. This result is consistent with a study by Temesgen and Wu [48]. When we see the potential of the land use to provide individual ES, agroforestry has very high potential in providing climate regulation and erosion prevention, while grassland has very high potential in supplying water regulation, erosion prevention, water purification and treatment and nutrient recycling. In view of the local people, cropland has very high potential in supplying food and fodder. This result is in line with the findings of other studies [36]. We also found that the potential of the land use to supply ES is different at kebele level. Land use types in Zenzelima kebele have been perceived to have the highest potential to supply ES for all ES categories, with the same reason mentioned above about the characteristics of this particular kebele. We also found the differences in ranking of the selected ES by experts and the local communities, which gave more value to benefits such as food, fodder, fresh water, timber, firewood, and erosion prevention, whereas climate regulation and water purification and treatment were relatively better ranked by the experts. This shows the local communities are better in recognizing the direct uses of ES than the indirect uses, which matches the results of other studies [48].
Cultural services are ranked low by the local communities. This result is consistent with the results of other studies [48]. This may be due to the fact that cultural services that represents the non-material benefits from the land uses that arise from human–ecosystems relationships [73], are less directly related to the well-being of the society than provisioning and regulating services [4]. In addition, the characterizations of most cultural services categories are imprecise which makes difficulties in establishing the relationship between ecosystem structures and functions and the satisfaction of societal needs [74]. However, it should be noted that their possibility for conciliation is low [4], i.e., it is not possible to replace the loses of cultural ecosystem services while it is possible to substitute the locally degraded provisioning and regulating services by other means. Thus, the implication for the peri-urbanization processes is higher in cultural services case than in other ecosystem service categories. As the peri-urban areas develop more, the people’s dependency on the provisioning and regulating services may decrease while their dependency on cultural services raises [75].
Respondents’ assessments were highly related with their interaction with the land use. The respondents’ perception of maximum use value in food and fodder may be due to their livelihood depending on crop and livestock production (97% of them). Timber and firewood production are also in the group of the highest perception, since the farmers’ source of energy is wood, and timber is used for housing construction and some house equipment. These result are in line with various assessments that found interaction with the land use [76], their farming activities [66] and livelihood dependency as factors which highly drive the favorable assessments of ES by stakeholders [77,78]. Moreover, the interviewees assigned highest mean values to climate regulation and erosion prevention. During the interview, for some of the respondents’ climate regulation coincided with the timing of rain. They are really concerned about the timing of rain as they practice rain-fed agriculture and are good at recognizing the role of ecosystems in providing climate regulations (they are also getting awareness training by the kebele’s natural resource experts). Regarding the importance of erosion prevention, stakeholders are more aware as the government has a 2-month campaign (January and February each year) on awareness creation and making terraces by the farmers on the land use.
According to our findings, generally there is a decreasing trend of supply of ES in the study areas over time, similar to previous studies at larger scales, which indicate a global tendency of decreasing ES supply [1,4,6]. In the study area, the process of urban expansion has been taken as one factor for the degradation of the supply of ES in the peri-urban area through the replacement of cropland, agroforestry, and grasslands by urban land use such as housing construction, industries and manufacturing, infrastructure developments, etc. This result is consistent with the results of other studies which assessed the impacts of urban expansion on agri-ecosystem services that reveals the fact that the urbanization process results in losses of ES [15,21,79]. The losses of ES of the peri-urban land due to urban expansion is irreversible. In the study area the rapid urbanization is projected to increase in the future [54], which is believed to cause further losses of identified ES and the potential of the land use.

4.2. Implications of the Research Process and Findings

The Bahir Dar city administration is incorporating significant amounts of land each year from the study kebeles. According to our earlier findings [23], the city administration has expropriated, on average, 150 hectares of land in each year between 2007 and 2017. This implies that the city has been expanding on average by 150 hectares of land each year; on the other hand, the sizes of the four rural kebeles (Addis Alem, Weramit, Wereb and Zenzelima) have been decreased by the same proportion. Our results confirmed that it is not only the provisioning services that are being lost in case of land expropriation for urban expansion, but also other ES categories. However, according to our earlier findings [23], at the time of land expropriations for urban expansion, the land use decision makers are not taking in to account the total values of ES.
Therefore, we believe that the research process and the findings of this study may have the following implications: First, the assessments of the use of ES and potential of the land use are thought to be vital for the planning and implementation of sustainable land use systems [3]. In this regard, the results of this study can provide a valuable input for land use policy and decision makers to make environmentally friendly land use decisions. That is: (i) to consider the importance of all ES categories in the process of land expropriation for urban expansion, (ii) to integrate it into urban land use planning to achieve sustainable development [80]. More specifically, to sustainably manage the lands using the information where a particular ES is very useful and which kebele and land use has more potential. For instance, part of the expropriated land can be used for urban green space which can provide ES that can moderate climate change and make the city sustainable [81]. Second, the research process itself has its own implications in awareness creation among the stakeholders about the benefits that nature is providing to the society. Many of the farmers (74%), who participated in this study are illiterate and might not have been aware of some of the ES benefits. Therefore, the data collection processes can potentially be taken as an awareness creation movement among the stakeholders [82,83]. There is a consensus that a well - informed community will be more willing to accept environmental protection measures [36].
Third, it can be taken as an additional case study to the literature on the use of long-time experiences of the community, and the knowledge and skill of experts to assess the values of ES in data poor regions. Our research investigated stakeholders’ perceptions about the use, potential and changes of an entire range of ES in the three land use types, which makes even more interesting since there are only a few ecosystem research assessments covering all the ES of a given area [37]. Lastly, the methods used, and the findings of this study, can serve as an incentive to conduct similar studies and help to initiate an additional environmental policy in Ethiopia related to land expropriations due to urban expansions.

4.3. Limitations and Future Research

Assessing the ES use and ecosystem potentials in land expropriation is rather new in Ethiopia. This study provides an initial baseline assessment of ES in the study area, with a limited number of land use. Though lots of efforts have been made to clarify the ES, still the difficulty in understanding some of the ES (e.g., some cultural ecosystem services) by the respondents and the limitations in fully explaining them by the interviewer may affect the assessment of some of the ES. The study is only a perception analysis that did not see the monetary values of ES in the study areas. However, it is argued that the decision makers may be more likely to sense the problems if they are expressed in monetary terms. Therefore, more research is necessary to further help decision makers (for example, by assessing the monetary value of the non-marketable ES).

5. Conclusions and Recommendations

We applied a participatory approach, where FGDs and interviews were conducted with community and experts, to assess the uses of ES, potentials of land use to deliver ES, and changes of ES. The assessment was conducted in the three land use types (cropland, agroforestry, and grassland) which have been threatened by urban expansion in Bahir Dar city, northwest Ethiopia. In general, it is observed that agricultural lands (with their diverse land use types) are providing various ecosystem goods and services, which are basic for the wellbeing of the societies and the sustainability of the environment. They are also perceived to have significant potential to provide ecosystem goods and services in the future.
In view of the farmers, ES such as food, fodder, timber, firewood, climate regulation, erosion prevention, water purification and treatment and nutrient recycling were recognized for very high usage. The farmers’ perceptions on the use of ES have been found to be different at land use level. In the study area, cropland is perceived to have very high usage in food and fodder, while agroforestry is perceived to have very high usage in timber, firewood, and climate regulation. Very high usage of erosion prevention, water purification and treatment and nutrient recycling is given to grassland. Similarly, the potential of the land use to supply ES is different among cropland, agroforestry, and grassland, which gives the aggregate highest potential to provide all categories of ES to agroforestry. Farmers pointed out that cropland has very high potential for the provision of food and fodder; agroforestry has very high potential to supply erosion prevention and climate regulation; and grassland has very high potential in erosion prevention, water regulation, water purification and treatment and nutrient recycling. A spatial difference was also observed, i.e., the kebeles in the study area are not the same in the use of ES and the potential of the land use to provide ES. From the farmers point of view, among the four kebeles, Zenzelima kebele is the highest in terms of use of ES and potential of land use to deliver ES. Participants’ perceptions were also compared in ranking ES that gives heterogeneous results. While local communities gave more priority for provisioning services, the experts gave more priority for regulation and supporting services. In general, our results revealed that in the study areas it is not only provisioning service that is contributing to the wellbeing of the community, but also other ES categories which indirectly supports the society. In the study areas the process of urban expansion is affecting the supply of ES (i.e., decreasing over time).
The land use decision makers and managers are not considering this reality when making land expropriations and other land use decisions, i.e., they are not considering the environmental impacts that may happen as a result of land expropriation for urban expansion. This may exacerbate the impacts of urban expansion on the uses and supply of ES. This information could help the land use policy and decision makers and managers in realizing the total environmental loses caused by the decision to convert agricultural ecosystems to urbanization. In addition, hence, make them aware and assess and incorporate assessment results in future land expropriation for urban expansion decisions and assure sustainable land development.
Based on our assessment results, we recommend land use policy makers: (i) to take into account the use of ES and potential of the land use to provide ES when making land use decisions, including land expropriation for urban expansion; (ii) to refer to the differences among land use types in supplying ES; (iii) initiate similar studies; (iv) involve the local people and use their knowledge in the management of ES; (iv) create continuous awareness-creation activities on ES for the different stakeholders; and (v) properly administer environmental impact assessments and mitigation plans provided by bigger urban construction projects.

Author Contributions

In this paper, W.F.A. designed the research, collected and analyzed the data, and drafted the manuscript. S.V.P. supervised the whole work and contributed to reviewing the manuscript. A.B., J.N., A.S.M. and E.A.T. contributed to reviewing the manuscript. All authors have read and agreed to the published version of the manuscript.

Funding

This research received no external funding.

Acknowledgments

This research was sponsored by the Institutional University Cooperation with Bahir Dar University (BDU-IUC), funded by the Belgian authorities, through the Flemish Interuniversity Council—University Development Cooperation. In addition, we would like to thank also the BDU-IUC staffs of Bahir Dar University for their continuous support in organizing logistics and other administrative supports. Moreover, we would like also to acknowledge the support of the natural resource management experts of the four study kebeles.

Conflicts of Interest

The authors declare no conflict of interest.

References

  1. Costanza, R.; d’Arge, R.; de Groot, R.; Farber, S.; Grasso, M.; Hannon, B.; Limburg, K.; Naeem, S.; O’Neill, R.; Paruelo, J.; et al. The value of the world’s ecosystem services and natural capital. Nature 1997, 387, 253–260. [Google Scholar] [CrossRef]
  2. Potschin, M.B.; Haines-Young, R.H. Improving the quality of environmental assessments using the concept of natural capital: A case study from southern Germany. Landsc. Urban Plan. 2003, 63, 93–108. [Google Scholar] [CrossRef]
  3. Bastian, O.; Haase, D.; Grunewald, K. Ecosystem properties, potentials and services—The EPPS conceptual framework and an urban application example. Ecol. Indic. 2012, 21, 7–16. [Google Scholar] [CrossRef]
  4. MEA. Ecosystems and Human Well-being: Biodiversity Synthesis; Millennium Ecosystem Assessment. World Resources Institute: Washington, DC, USA, 2005; Available online: https://www.millenniumassessment.org/documents/document.356.aspx.pdf (accessed on 19 January 2020).
  5. Wu, K.-Y.; Ye, X.-Y.; Qi, Z.-F.; Zhang, H. Impacts of land use/land cover change and socioeconomic development on regional ecosystem services: The case of fast-growing Hangzhou metropolitan area, China. Cities 2013, 31, 276–284. [Google Scholar] [CrossRef]
  6. de Groot, R.S.; Wilson, M.A.; Boumans, R.M.J. A typology for the classification, description and valuation of ecosystem functions, goods and services. Environ. Econ. 2002, 41, 393–408. [Google Scholar] [CrossRef] [Green Version]
  7. Burkhard, B.; Kroll, F.; Nedkov, S.; Müller, F. Mapping ecosystem service supply, demand and budgets. Ecol. Indic. 2012, 21 (Suppl. C), 17–29. [Google Scholar] [CrossRef]
  8. Burkhard, B.; Kroll, F.; Müller, F.; Windhorst, W. Landscapes’ capacities to provide ecosystem services-a concept for spatial planning. Landsc. Online 2009, 1, 1–30. [Google Scholar]
  9. Haase, D.; Nuissl, H. Assessing the impacts of land use change on transforming regions. J. Land Use Sci. 2010, 5, 67–72. [Google Scholar] [CrossRef]
  10. Estoque, R.C.; Murayama, Y. Landscape pattern and ecosystem service value changes: Implications for environmental sustainability planning for the rapidly urbanizing summer capital of the Philippines. Landsc. Urban Plan. 2013, 116 (Suppl. C), 60–72. [Google Scholar] [CrossRef]
  11. He, C.; Zhang, D.; Huang, Q.; Zhao, Y. Assessing the potential impacts of urban expansion on regional carbon storage by linking the LUSD-urban and InVEST models. Environ. Model. Softw. 2016, 75, 44–58. [Google Scholar] [CrossRef]
  12. Van Vliet, J.; Eitelberg, D.A.; Verburg, P.H. A global analysis of land take in cropland areas and production displacement from urbanization. Glob. Environ. Chang. 2017, 43, 107–115. [Google Scholar] [CrossRef]
  13. Alam, M.; Dupras, J.; Messier, C. A framework towards a composite indicator for urban ecosystem services. Ecol. Indic. 2016, 60, 38–44. [Google Scholar] [CrossRef]
  14. Wan, L.; Ye, X.; Lee, J.; Lu, X.; Zheng, L.; Wu, K. Effects of urbanization on ecosystem service values in a mineral resource-based city. Habitat Int. 2015, 46, 54–63. [Google Scholar] [CrossRef]
  15. Cabral, P.; Feger, C.; Levrel, H.; Chambolle, M.; Basque, D. Assessing the impact of land-cover changes on ecosystem services: A first step toward integrative planning in Bordeaux, France. Ecosyst. Serv. 2016, 22, 318–327. [Google Scholar] [CrossRef] [Green Version]
  16. Tura, H.A. Land rights and land grabbing in Oromia, Ethiopia. Land Use Policy 2018, 70, 247–255. [Google Scholar] [CrossRef]
  17. Šumrada, R.; Ferlan, M.; Lisec, A. Acquisition and expropriation of real property for the public benefit in Slovenia. Land Use Policy 2013, 32, 14–22. [Google Scholar] [CrossRef]
  18. FDRE. Constitution of the Federal Democratic Republic of Ethiopia; Proclamation No. 1/1995; Negarit Gazeta Addis Abeba: Addis Abeba, Ethiopia, 1995. [Google Scholar]
  19. FDRE. Expropriation of Landholdings for Public Purposes and Payment of Compensation Proclamation. Federal Democratic Republic of Ethiopia; Proclamation No.455/2005; Negarit Gazeta Addis Abeba: Addis Abeba, Ethiopia, 2005. [Google Scholar]
  20. Ambaye, D.W. Land rights and expropriation in Ethiopia. Ph.D. Thesis, Royal Institute of Technology (KTH), Stockholm, Sweden, 2013. [Google Scholar]
  21. Zhang, D.; Huang, Q.; He, C.; Wu, J. Impacts of urban expansion on ecosystem services in the Beijing-Tianjin-Hebei urban agglomeration, China: A scenario analysis based on the Shared Socioeconomic Pathways. Resour. Conserv. Recycl. 2017, 125, 115–130. [Google Scholar] [CrossRef]
  22. He, C.; Liu, Z.; Tian, J.; Ma, Q. Urban expansion dynamics and natural habitat loss in China: A multiscale landscape perspective. Glob. Chang. Biol. 2014, 20, 2886–2902. [Google Scholar] [CrossRef] [PubMed]
  23. Admasu, W.F.; Van Passel, S.; Minale, A.S.; Tsegaye, E.A.; Azadi, H.; Nyssen, J. Take out the farmer: An economic assessment of land expropriation for urban expansion in Bahir Dar, Northwest Ethiopia. Land Use Policy 2019, 87, 104038. [Google Scholar] [CrossRef]
  24. FAO. Compulsory Acquisition of Land and Compensation. FAO Land Tenure Studies 10; Food and Agriculture Organization of the United Nations: Rome, Italy, 2008; Available online: http://www.fao.org/3/i0506e/i0506e00.pdf (accessed on 20 January 2020).
  25. Schröter, D.; Cramer, W.; Leemans, R.; Prentice, I.C.; Araújo, M.B.; Arnell, N.W.; Bondeau, A.; Bugmann, H.; Carter, T.R.; Gracia, C.A.; et al. Ecosystem Service Supply and Vulnerability to Global Change in Europe. Science 2005, 310, 1333. [Google Scholar] [CrossRef] [Green Version]
  26. Wade, T.G.; Wickham, J.D.; Zacarelli, N.; Riitters, K.H. A multi-scale method of mapping urban influence. Environ. Model. Softw. 2009, 24, 1252–1256. [Google Scholar] [CrossRef]
  27. Wu, C.-F.; Lin, Y.-P.; Chiang, L.-C.; Huang, T. Assessing highway’s impacts on landscape patterns and ecosystem services: A case study in Puli Township, Taiwan. Landsc. Urban Plan. 2014, 128, 60–71. [Google Scholar] [CrossRef]
  28. Mckinney, M.L. Effects of urbanizations on species richness: A review of plants and animals. Urban Ecosystems 2008, 11, 161–176. [Google Scholar] [CrossRef]
  29. De Groot, R.; Brander, L.; Van Der Ploeg, S.; Costanza, R.; Bernard, F.; Braat, L.; Christie, M.; Crossman, N.; Ghermandi, A.; Hein, L.; et al. Global estimates of the value of ecosystems and their services in monetary units. Ecosyst. Serv. 2012, 1, 50–61. [Google Scholar] [CrossRef]
  30. TEEB. Mainstreaming the Economics of Nature: A Synthesis of the Approach, Conclusions and Recommendations of TEEB 2010. Available online: http://www.biodiversity.ru/programs/international/teeb/materials_teeb/TEEB_SynthReport_English.pdf (accessed on 21 January 2020).
  31. Bagstad, K.J.; Johnson, G.W.; Voigt, B.; Villa, F. Spatial dynamics of ecosystem service flows: A comprehensive approach to quantifying actual services. Ecosyst. Serv. 2013, 4, 117–125. [Google Scholar] [CrossRef]
  32. Yao, J.; He, X.; Chen, W.; Ye, Y.; Guo, R.; Yu, L. A local-scale spatial analysis of ecosystem services and ecosystem service bundles in the upper Hun River catchment, China. Ecosyst. Serv. 2016, 22, 104–110. [Google Scholar] [CrossRef]
  33. Yu, D.; Han, S. Ecosystem service status and changes of degraded natural reserves—A study from the Changbai Mountain Natural Reserve, China. Ecosyst. Serv. 2016, 20, 56–65. [Google Scholar] [CrossRef]
  34. Li, J.; Jiang, H.; Bai, Y.; Alatalo, J.M.; Li, X.; Jiang, H.; Liu, G.; Xu, J. Indicators for spatial–temporal comparisons of ecosystem service status between regions: A case study of the Taihu River Basin, China. Ecol. Indic. 2016, 60 (Suppl. C), 1008–1016. [Google Scholar] [CrossRef]
  35. Ma, F.; Eneji, A.; Liu, J. Assessment of ecosystem services and dis-services of an agro-ecosystem based on extended emergy framework: A case study of Luancheng county, North China. Ecol. Eng. 2015, 82 (Suppl. C), 241–251. [Google Scholar] [CrossRef]
  36. Affek, A.N.; Kowalska, A. Ecosystem potentials to provide services in the view of direct users. Ecosyst. Serv. 2017, 26, 183–196. [Google Scholar] [CrossRef]
  37. Plieninger, T.; Dijks, S.; Oteros-Rozas, E.; Bieling, C. Assessing, mapping, and quantifying cultural ecosystem services at community level. Land Use Policy 2013, 33, 118–129. [Google Scholar] [CrossRef] [Green Version]
  38. Raymond, C.M.; Bryan, B.A.; Macdonald, D.H.; Cast, A.; Strathearn, S.; Grandgirard, A.; Kalivas, T. Mapping community values for natural capital and ecosystem services. Ecol. Econ. 2009, 68, 1301–1315. [Google Scholar] [CrossRef]
  39. Bhandari, P.; Kc, M.; Shrestha, S.; Aryal, A.; Shrestha, U.B. Assessments of ecosystem service indicators and stakeholder’s willingness to pay for selected ecosystem services in the Chure region of Nep. Appl. Geogr. 2016, 69, 25–34. [Google Scholar] [CrossRef]
  40. Baral, H.; Guariguata, M.R.; Keenan, R.J. A proposed framework for assessing ecosystem goods and services from planted forests. Ecosyst. Serv. 2016, 22, 260–268. [Google Scholar] [CrossRef] [Green Version]
  41. García-Nieto, A.P.; Quintas-Soriano, C.; García-Llorente, M.; Palomo, I.; Montes, C.; Martín-López, B. Collaborative mapping of ecosystem services: The role of stakeholders’ profiles. Ecosyst. Serv. 2015, 13, 141–152. [Google Scholar] [CrossRef]
  42. Seppelt, R.; Fath, B.; Burkhard, B.; Fisher, J.L.; Grêt-Regamey, A.; Lautenbach, S.; Pert, P.L.; Hotes, S.; Spangenberg, J.; Verburg, P.H.; et al. Form follows function? Proposing a blueprint for ecosystem service assessments based on reviews and case studies. Ecol. Indic. 2012, 21, 145–154. [Google Scholar]
  43. Seppelt, R.; Dormann, C.F.; Eppink, F.V.; Lautenbach, S.; Schmidt, S. A quantitative review of ecosystem service studies: Approaches, shortcomings and the road ahead. J. Appl. Ecol. 2011, 48, 630–636. [Google Scholar] [CrossRef]
  44. Ananda, J.; Herath, G. A critical review of multi-criteria decision making methods with special reference to forest management and planning. Ecol. Econ. 2009, 68, 2535–2548. [Google Scholar] [CrossRef]
  45. Paudyal, K.; Baral, H.; Burkhard, B.; Bhandari, S.P.; Keenan, R. Participatory assessment and mapping of ecosystem services in a data-poor region: Case study of community-managed forests in central Nepal. Ecosyst. Serv. 2015, 13, 81–92. [Google Scholar] [CrossRef]
  46. Shrestha, U.B.; Bawa, K.S. Economic contribution of Chinese caterpillar fungus to the livelihoods of mountain communities in Nepal. Biol. Conserv. 2014, 177, 194–202. [Google Scholar] [CrossRef]
  47. Krause, M.S.; Nkonya, E.; Griess, V.C. An economic valuation of ecosystem services based on perceptions of rural Ethiopian communities. Ecosyst. Serv. 2017, 26, 37–44. [Google Scholar] [CrossRef]
  48. Temesgen, H.; Wu, W. Farmers’ Value Assessment of Sociocultural and Ecological Ecosystem Services in Agricultural Landscapes. Sustainability 2018, 10, 703. [Google Scholar] [CrossRef] [Green Version]
  49. Woldeyohannes, A.; Cotter, M.; Biru, W.D.; Kelboro, G. Assessing Changes in Ecosystem Service Values over 1985–2050 in Response to Land Use and Land Cover Dynamics in Abaya-Chamo Basin, Southern Ethiopia. Land 2020, 9, 37. [Google Scholar] [CrossRef] [Green Version]
  50. UN. World Urbanization Prospect: The 2018 Revision (ST/ESA/SER.A/420); United Nations, Department of Economic and Social Affairs, Population Division: New York, NY, USA, 2019; Available online: https://population.un.org/wup/Publications/Files/WUP2018-Report.pdf (accessed on 23 January 2020).
  51. Abebe, G. Long-term climate data description in Ethiopia. Data Brief 2017, 14, 371–392. [Google Scholar] [CrossRef]
  52. CSA. Statstical Abstract 2007; Central Statstical Authority: Addis Ababa, Ethiopia, 2008. [Google Scholar]
  53. UN-Habitat. The State of African Cities 2010: Governance, Inequality and Urban Land Markets 2010. Available online: https://www.zaragoza.es/contenidos/medioambiente/onu/535-eng-ed2010.pdf (accessed on 27 January 2020).
  54. Nigussie, H.; Genetu, F.; Atsushi, T.; Mitsuru, T.; Derege, T. The dynamics of urban expansion and its impacts on land use/land cover change and small-scale farmers living near the urban fringe: A case study of Bahir Dar, Ethiopa. Landsc. Urban Plan. 2012, 106, 149–157. [Google Scholar]
  55. Gashu, K.; Gebre-Egziabher, T. Spatiotemporal trends of urban land use/land cover and green infrastructure change in two Ethiopian cities: Bahir Dar and Hawassa. Environ. Syst. Res. 2018, 7, 8. [Google Scholar] [CrossRef] [Green Version]
  56. Fitawok, M.B.; Derudder, B.; Minale, A.S.; Van Passel, S.; Adgo, E.; Nyssen, J. Modeling the Impact of Urbanization on Land-Use Change in Bahir Dar City, Ethiopia: An Integrated Cellular Automata–Markov Chain Approach. Land 2020, 9, 115. [Google Scholar] [CrossRef] [Green Version]
  57. UNESCO. Ecological Sciences for Sustainable Development. Man and Biosphere Reserves. Biosphere reserves 2015. Available online: http://www.unesco.org/new/en/natural-sciences/environment/ecological-sciences/biosphere-reserves/africa/ethiopia/lake-tana/ (accessed on 25 January 2020).
  58. Amare, A. Corporate environmental responsibility in Ethiopia: A case study of the Akaki River Basin. Ecosyst. Heal. Sustain. 2019, 5, 57–66. [Google Scholar] [CrossRef] [Green Version]
  59. Folberth, G.A.; Butler, T.M.; Collins, W.J.; Rumbold, S.T. Megacities and climate change—A brief overview. Environ. Pollut. 2015, 203, 235–242. [Google Scholar] [CrossRef] [Green Version]
  60. Mohamed, A.; Worku, H. Quantification of the land use/land cover dynamics and the degree of urban growth goodness for sustainable urban land use planning in Addis Ababa and the surrounding Oromia special zone. J. Urban Manag. 2019, 8, 145–158. [Google Scholar] [CrossRef]
  61. Mohan, M.; Patan, S.K.; Narendrareddy, K.; Kandya, A.; Pandey, S. Dynamics of urbanization and its impact on land use land cover change: A case study of Megacity Delhi. J. Environ. Prot. 2011, 2, 1274–1283. [Google Scholar] [CrossRef] [Green Version]
  62. Jacobs, S.; Burkhard, B.; Van Daele, T.; Staes, J.; Schneiders, A. ‘The Matrix Reloaded’: A review of expert knowledge use for mapping ecosystem services. Ecol. Model. 2015, 295, 21–30. [Google Scholar] [CrossRef]
  63. Krueger, T.; Page, T.; Hubacek, K.; Smith, L.; Hiscock, K. The role of expert opinion in environmental modelling. Environ. Model. Softw. 2012, 36, 4–18. [Google Scholar] [CrossRef]
  64. Burkhard, B.; Marion, K.; Ying, H.; Felix, M. Ecosystem service potentials, flows and demands—Concepts for spatial localisation, indication and quantification. Landc. Online 2014, 34, 1–32. [Google Scholar] [CrossRef]
  65. Fabbris, L. Measurement scales for scoring or ranking sets of interrelated items. In Survey Data Collection and Integration; Springer: Berlin/Heidelberg, Germany, 2013; pp. 21–43. [Google Scholar]
  66. Lamarque, P.; Tappeiner, U.; Turner, C.; Steinbacher, M.; Bardgett, R.D.; Szukics, U.; Schermer, M.; Lavorel, S. Stakeholder perceptions of grassland ecosystem services in relation to knowledge on soil fertility and biodiversity. Reg. Environ. Chang. 2011, 11, 791–804. [Google Scholar] [CrossRef]
  67. Vilardy, S.; González, J.A.; Martín-López, B.; Montes, C. Relationships between hydrological regime and ecosystem services supply in a Caribbean coastal wetland: A social-ecological approach. Hydrol. Sci. J. 2011, 56, 1423–1435. [Google Scholar] [CrossRef] [Green Version]
  68. Hartter, J. Resource use and ecosystem services in a forest park landscape. Soc. Nat. Resour. 2010, 23, 207–223. [Google Scholar] [CrossRef]
  69. Agbenyega, O.; Burgess, P.J.; Cook, M.; Morris, J. Application of an ecosystem function framework to perceptions of community woodlands. Land Use Policy 2009, 26, 551–557. [Google Scholar] [CrossRef] [Green Version]
  70. Calvet-Mir, L.; Gómez-Baggethun, E.; Reyes-García, V. Beyond food production: Ecosystem services provided by home gardens. A case study in Vall Fosca, Catalan Pyrenees, Northeastern Spain. Ecol. Econ. 2012, 74, 153–160. [Google Scholar]
  71. Vihervaara, P.; Marjokorpi, A.; Kumpula, T.; Walls, M.; Kamppinen, M. Ecosystem services of fast-growing tree plantations: A case study on integrating social valuations with land-use changes in Uruguay. For. Policy Econ. 2012, 14, 58–68. [Google Scholar] [CrossRef]
  72. Castro, A.J.; Martín-López, B.; García-Llorente, M.; Aguilera, P.; López, E.; Cabello, J. Social preferences regarding the delivery of ecosystem services in a semiarid Mediterranean region. J. Arid. Environ. 2011, 75, 1201–1208. [Google Scholar] [CrossRef]
  73. Chan, K.M.; Satterfield, T.; Goldstein, J. Rethinking ecosystem services to better address and navigate cultural values. Ecol. Econ. 2012, 74, 8–18. [Google Scholar] [CrossRef] [Green Version]
  74. Daniel, T.C.; Muhar, A.; Arnberger, A.; Aznar, O.; Boyd, J.W.; Chan, K.M.A.; Costanza, R.; Elmqvist, T.; Flint, C.G.; Gobster, P.H.; et al. Contributions of cultural services to the ecosystem services agenda. Proc. Natl. Acad. Sci. USA 2012, 109, 8812–8819. [Google Scholar] [CrossRef] [PubMed] [Green Version]
  75. Guo, Z.; Zhang, L.; Li, Y. Increased Dependence of Humans on Ecosystem Services and Biodiversity. PLoS ONE 2010, 5, e13113. [Google Scholar]
  76. Garrard, R.; Kohler, T.; Wiesmann, U.; Price, M.F.; Byers, A.C.; Sherp, A.R. Depicting community perspectives: Repeat photography and participatory research as tools for assessing environmental services in Sagarmatha National Park, Nepal. Eco. Mont-J. Prot. Mountain Areas Res. 2012, 4, 21–31. [Google Scholar] [CrossRef] [Green Version]
  77. Birch, J.C.; Thapa, I.; Balmford, A.; Bradbury, R.B.; Brown, C.; Butchart, S.H.M.; Gurung, H.; Hughes, F.M.R.; Mulligan, M.; Pandeya, B.; et al. What benefits do community forests provide, and to whom? A rapid assessment of ecosystem services from a Himalayan forest, Nepal. Ecosyst. Serv. 2014, 8, 118–127. [Google Scholar]
  78. FAO. The State of Food and Agriculture 2013; The Food and Agriculture Organization of the United Nations: Rome, Italy, 2013; Available online: http://www.fao.org/publications/sofa/2013/en/ (accessed on 23 January 2020).
  79. Das, M.; Das, A. Dynamics of Urbanization and its impact on Urban Ecosyst. Serv. (UESs): A study of a medium size town of West Bengal, Eastern India. J. Urban Manag. 2019, 8, 420–434. [Google Scholar]
  80. Yu, L.; Lyu, Y.; Chen, C.; Choguill, C.L. Environmental deterioration in rapid urbanisation: Evidence from assessment of ecosystem service value in Wujiang, Suzhou. Environ. Dev. Sustain. 2020. [Google Scholar] [CrossRef] [Green Version]
  81. Revelli, R.; Porporato, A. Ecohydrological model for the quantification of ecosystem services provided by urban street trees. Urban Ecosyst. 2018, 21, 489–504. [Google Scholar] [CrossRef] [Green Version]
  82. Casado-Arzuaga, I.; Madariaga, I.; Onaindia, M. Perception, demand and user contribution to ecosystem services in the Bilbao Metropolitan Greenbelt. J. Environ. Manag. 2013, 129, 33–43. [Google Scholar] [CrossRef]
  83. Gundersen, V.; Stange, E.; Kaltenborn, B.; Vistad, O. Public visual preferences for dead wood in natural boreal forests: The effects of added information. Landsc. Urban Plan. 2017, 158, 12–24. [Google Scholar] [CrossRef]
1
Initially, we selected 100 interviewees from the local community based on their awareness and active participation in natural resource management activities. We could not manage to interview 2 respondents.
2
In addition to causing a reduction in food production, this also contributes to deforestation (the people are cutting the trees for housing construction.
3
This is because evictions are causing the farmers to possess less land. Our results show that 63 percent of the sample respondents lost more than half of their holdings. In addition, the redistribution of land by parents to their landless children is also another factor. Therefore, the farmers are encouraged to use chemical fertilisers to increase the yields.
Figure 1. Study area map (Source: Authors).
Land 09 00395 g001
Figure 2. Comparisons of relative use (using aggregate mean points) of ES by kebeles.
Land 09 00395 g002
Figure 3. Comparisons of relative potentials (mean points) of ecosystem service categories by (A) kebeles and (B) land uses; AA-Addis Alem kebele, ZZ-Zenzelima kebele, WT-Weramit kebele and WB-Wereb kebele.
Land 09 00395 g003
Table 1. Main demographic and socioeconomic characteristics of sample households.
CharacteristicsFrequency or Average% in the Sample (N = 98)CharacteristicsFrequency% in the Sample (N = 98)
Age Marital status
25–40 years2525.52Married8990.82
41–52 years5253.06Widowed22.04
Above 52 years2121.42Divorced33.06
Sex Separated44.08
Male8889.8Income (in ETB)
Female1010.20Below 10,00000
Family size6.03-10,001–20,00077.14
Education 20,001–30,0003434.69
Illiterate7374.4930,001–40,0003838.78
Elementary212.43More than 40,0001919.39
Secondary33.06
Diploma and above11.02
Table 2. Matrix for the assessment of the different land use types and their ES use. The assessment scale reaches from 0.1 to 0.99 = light green = very low usage, 1 to 1.99 = yellow green = low usage, 2 to 2.99 = green = medium usage, 3 to 3.99 = dark green = high usage and 4 to 5 = very dark green = very high usage.
Ecosystem Service Categories.Ecosystem ServicesCropland AgroforestryGrassland
Provisioning servicesFood (crops, vegetables, livestock)4.43.91.7
Wild fruit0.631
Fiber1.61.10.4
Fodder420.9
Timber0.541
Firewood1.64.50.1
Genetic resources1.61.70.6
Ornamental0.51.40.6
Medicinal0.52.70.6
Fresh water0.83.12.3
Energy (biomass)3.51.71
Compost (manure)3.61.92.3
Total23.23112.5
Regulation servicesAir quality regulation0.61.90.4
Climate regulation3.343.7
Water regulation0.13.13.8
Erosion prevention3.53.94.2
Water purification and treatment134.2
Regulation of human disease0.41.30.6
Biological control0.61.20.6
Pollination0.41.90.3
Total9.920.317.8
Supporting servicesMaintenance of soil0.12.51.5
Primary production12.11.4
Nutrient recycling0.92.44.1
Water recycling0.92.11.4
Photosynthesis0.23.10.3
Total3.112.28.7
Cultural servicesCultural diversity1.21.91.2
Spiritual0.20.51.2
Knowledge0.41.60.6
Education0.41.60.6
Inspiration0.81.31.1
Aesthetic0.61.11.9
Societal relations1.62.12.1
Sense of place2.32.52.5
Cultural heritage0.41.90.5
Recreation and ecotourism0.91.91.7
Total8.816.413.4
Table 3. Matrix for the assessment of the different land use types potential to provide selected ecosystem goods and services. The assessment scale reaches from 0.1 to 0.99 = light green = very low relevant potential, 1.0 to 1.99 = yellow green = low relevant potential, 2.0 to 2.99 = green = medium relevant potential, 3.0 to 3.99 = dark green = high relevant potential and 4.0 to 5.00 = very dark green = very high relevant potential.
Ecosystem Service CategoriesEcosystem ServicesCropland AgroforestryGrassland
Provisioning servicesFood4.332.010.89
Wild fruit0.330.06
Fiber3.112.21.41
Fodder4.232.11.08
Timber0.13.550.09
Firewood0.573.580.15
Genetic resources1.451.560.65
Ornamental0.612.270.68
Medicinal0.612.480.68
fresh water0.973.12.41
Energy3.432.031.07
Compost3.641.642.21
Total23.3529.5211.38
Regulation servicesAir quality1.72.622.52
Climate regulation3.444.013.76
Water regulation1.223.174.03
Erosion prevention3.394.014.22
Water purification and treatment1.113.064.06
Regulation of human disease0.611.20.7
Biological control0.681.160.58
Pollination0.392.080.09
Total12.5421.3119.96
Supporting servicesMaintenance of soil fertility1.133.322.53
Primary production1.011.961.38
Nutrient recycling1.023.14.3
Water recycling0.172.362.43
Photosynthesis1.043.060.06
Total4.3714.810.7
Cultural servicesCultural diversity1.191.721.17
Spiritual and religious0.380.571.25
Knowledge systems0.651.570.53
Education0.631.590.57
Inspiration1.852.212.08
Aesthetic1.792.031.82
Social relations1.862.022
Sense of place2.172.462.48
Cultural heritage1.621.841.42
Recreation and ecotourism1.181.851.71
Total13.3217.8615.03
Table 4. Rankings of the most important ES by households, committees and experts.
ESHouseholds Committees Experts
Mean PointsRankSt.dev.Mean PointsRankSt.devMean PointsRankSt.dev
Food1510.001510.0013.6712.31
Fodder1420.0013.9520.2310.6743.06
Timber8.1283.358.9562.585.33121.15
Firewood9.2962.268.7581.897.3395.51
Fresh water11.2432.0811.141.998.6765.51
Compost10.2452.331052.497.6783.79
Energy8.3572.67792.567.3390.58
Climate regulation7.8291.988.971.879.6751.15
Erosion prevention10.6541.6211.631.6512.3322.08
Water regulation5.59112.186.75112.631233.61
Wild fruit1.24150.561.1150.321140.00
Water purification and treatment7.76102.666.85102.60874.36
Nutrient recycling3.06140.904.37121.956.33115.13
Sense of place3.94121.983.3130.853131.00
Social relations3.47132.432.5141.077104.36
Publisher’s Note: MDPI stays neutral with regard to jurisdictional claims in published maps and institutional affiliations.

