Article

Impacts of Future Crop Tree Release Treatments on Forest Carbon as REDD+ Mitigation Benefits

World Forestry, University of Hamburg, D-21031 Hamburg, Germany
*
Author to whom correspondence should be addressed.
Land 2020, 9(10), 394; https://doi.org/10.3390/land9100394
Submission received: 4 September 2020 / Revised: 15 October 2020 / Accepted: 16 October 2020 / Published: 18 October 2020

Abstract

:
Sustainable forest management activities, such as future crop tree (FCT) release treatments, became part of the REDD+ strategy to avoid carbon emissions from forests. FCT release treatments are intended to achieve increased growth of FCTs by removing competitor trees. This initially leads to a reduction of the forest carbon pool and represents a carbon debt. We estimated that the time it takes for FCTs to offset the carbon debt through increased growth on experimental sites of 10 km² in Belize, Guyana, Suriname, and Trinidad and Tobago. We further investigated whether the costs of treatment can be compensated by the generated financial carbon benefits. An average of 2.3 FCT per hectare were released through the removal of an average of 3.3 competitors per hectare. This corresponds to an average above ground biomass (AGB) deficit of 2.3 Mg FCT−1. Assuming a 30% increase in growth, the FCT would need on average 130 years to offset the carbon loss. For carbon prices from US$ 5 to 100 Mg CO2e−1 an additional increment between 0.6 and 22.7 Mg tree−1 would be required to cover the treatment costs of US$ 4.2 to 8.4 FCT−1. Assuming a carbon price of US$ 10 Mg CO2e−1, the additional increment required would be between 5.8 and 11.4 Mg tree−1, thus exceeding the biological growth potential of most individual trees. The release of FCTs does not ensure an increase in forest carbon stocks, and refinancing of treatment costs is problematic.

1. Introduction

Forests are an important contributor to the global carbon cycle. They act both as a carbon storage and a carbon source. Worldwide, an estimated 662 Pg C are sequestered in forests [1], of which 306 to 324 Pg C are stored in tropical forests. Between 0.47 and 1.3 Pg C are annually sequestered by tropical forests [2].
In addition to their role as carbon storage [3,4,5], forests are also considered as a source of carbon [6,7,8]. Estimates presented by the FAO Forest Resources Assessment 2020 indicate that the total global forest carbon stock decreased from 668 Pg C in 1990 to 662 Pg C in 2020 [1]. Besides deforestation, a major cause of carbon emissions from forests is forest degradation due to poor management practices [7,8,9]. For example, Pearson et al. [7] reported 0.99 to 2.33 Mg C emissions per extracted cubic meter of harvested wood in tropical forests, with the main emissions coming from harvest damage to the remaining stand and from infrastructure development. In addition, according to Putz et al. [10] emissions of 100 Mg C per hectare are caused by conventional logging of tropical forests.
To reduce carbon emissions from forest degradation due to logging activities, the concept of reducing emissions from deforestation and forest degradation (REDD) was expanded to REDD+ to include sustainable forest management (SFM) practices. The positive effects of the implementation of SFM practices, such as reduced impact logging (RIL) or forest certification, on the carbon emissions of tropical forests has been confirmed by several studies [11,12,13,14,15]. For instance, Galante et al. [16] reported that applying RIL can potentially reduce carbon emissions by approximately 1 to 7 Mg CO2 ha−1 per year if conventional logging is taken as a baseline. West et al. [12] showed that the post-logging annual increment of above ground biomass was six times higher in RIL than in conventional logging (CL).
Silvicultural treatments are another SFM measure [17]. While the effect of silvicultural treatments on the commercial timber volume of tropical forests has been investigated in various studies [18,19,20,21,22], the effects of silvicultural practices on carbon dynamics in both commercial and non-commercial stands is not well understood.
One form of silvicultural treatment is future crop tree release (FCTR), which is an intermediate treatment that usually happens between cutting cycles. By removing neighboring trees from those individuals with future crop tree (FCT) features, the goal is to reduce crown area competition by increasing growing space for FCTs. By concentrating the available resources, the volume growth of the remaining trees is expected to increase over time [23,24,25]. FCTR can increase the average diameter increment of the remaining trees and the proportion of commercial timber by 37% in temperate forests [26,27,28,29,30]. Effects on the growth of released FCTs in tropical forests have been investigated, among others, by Wadsworth and Zweede [19], Villegas et al. [20], Peña-Claros et al. [21], Graaf et al. [31], David et al. [32], and Kuusipalo et al. [33,34]. Overall, FCTR can increase volume growth by 20 to 60% in tropical forests [19,20,21,34]. However, the main focus of these studies is on commercial volume, while carbon has not been investigated. The removal of competitors initially leads to a reduction of the carbon pool of the stand and represents a carbon loss. In this study we explore the time period needed to offset this carbon debt due to silvicultural treatments by the increased growth of FCTs in a set of tropical forest sites in Central and South America. Silvicultural treatments aim at a higher volume growth compared to untreated stands, but are associated with costs. From an economic point of view, the discounted investments in silvicultural treatments must be compensated by the financial value increase [35]. In the case of REDD, this additional financial gain is achieved through the generation of additional carbon credits. We investigate whether the costs of the treatment can be compensated by the carbon benefits that are generated.

2. Materials and Methods
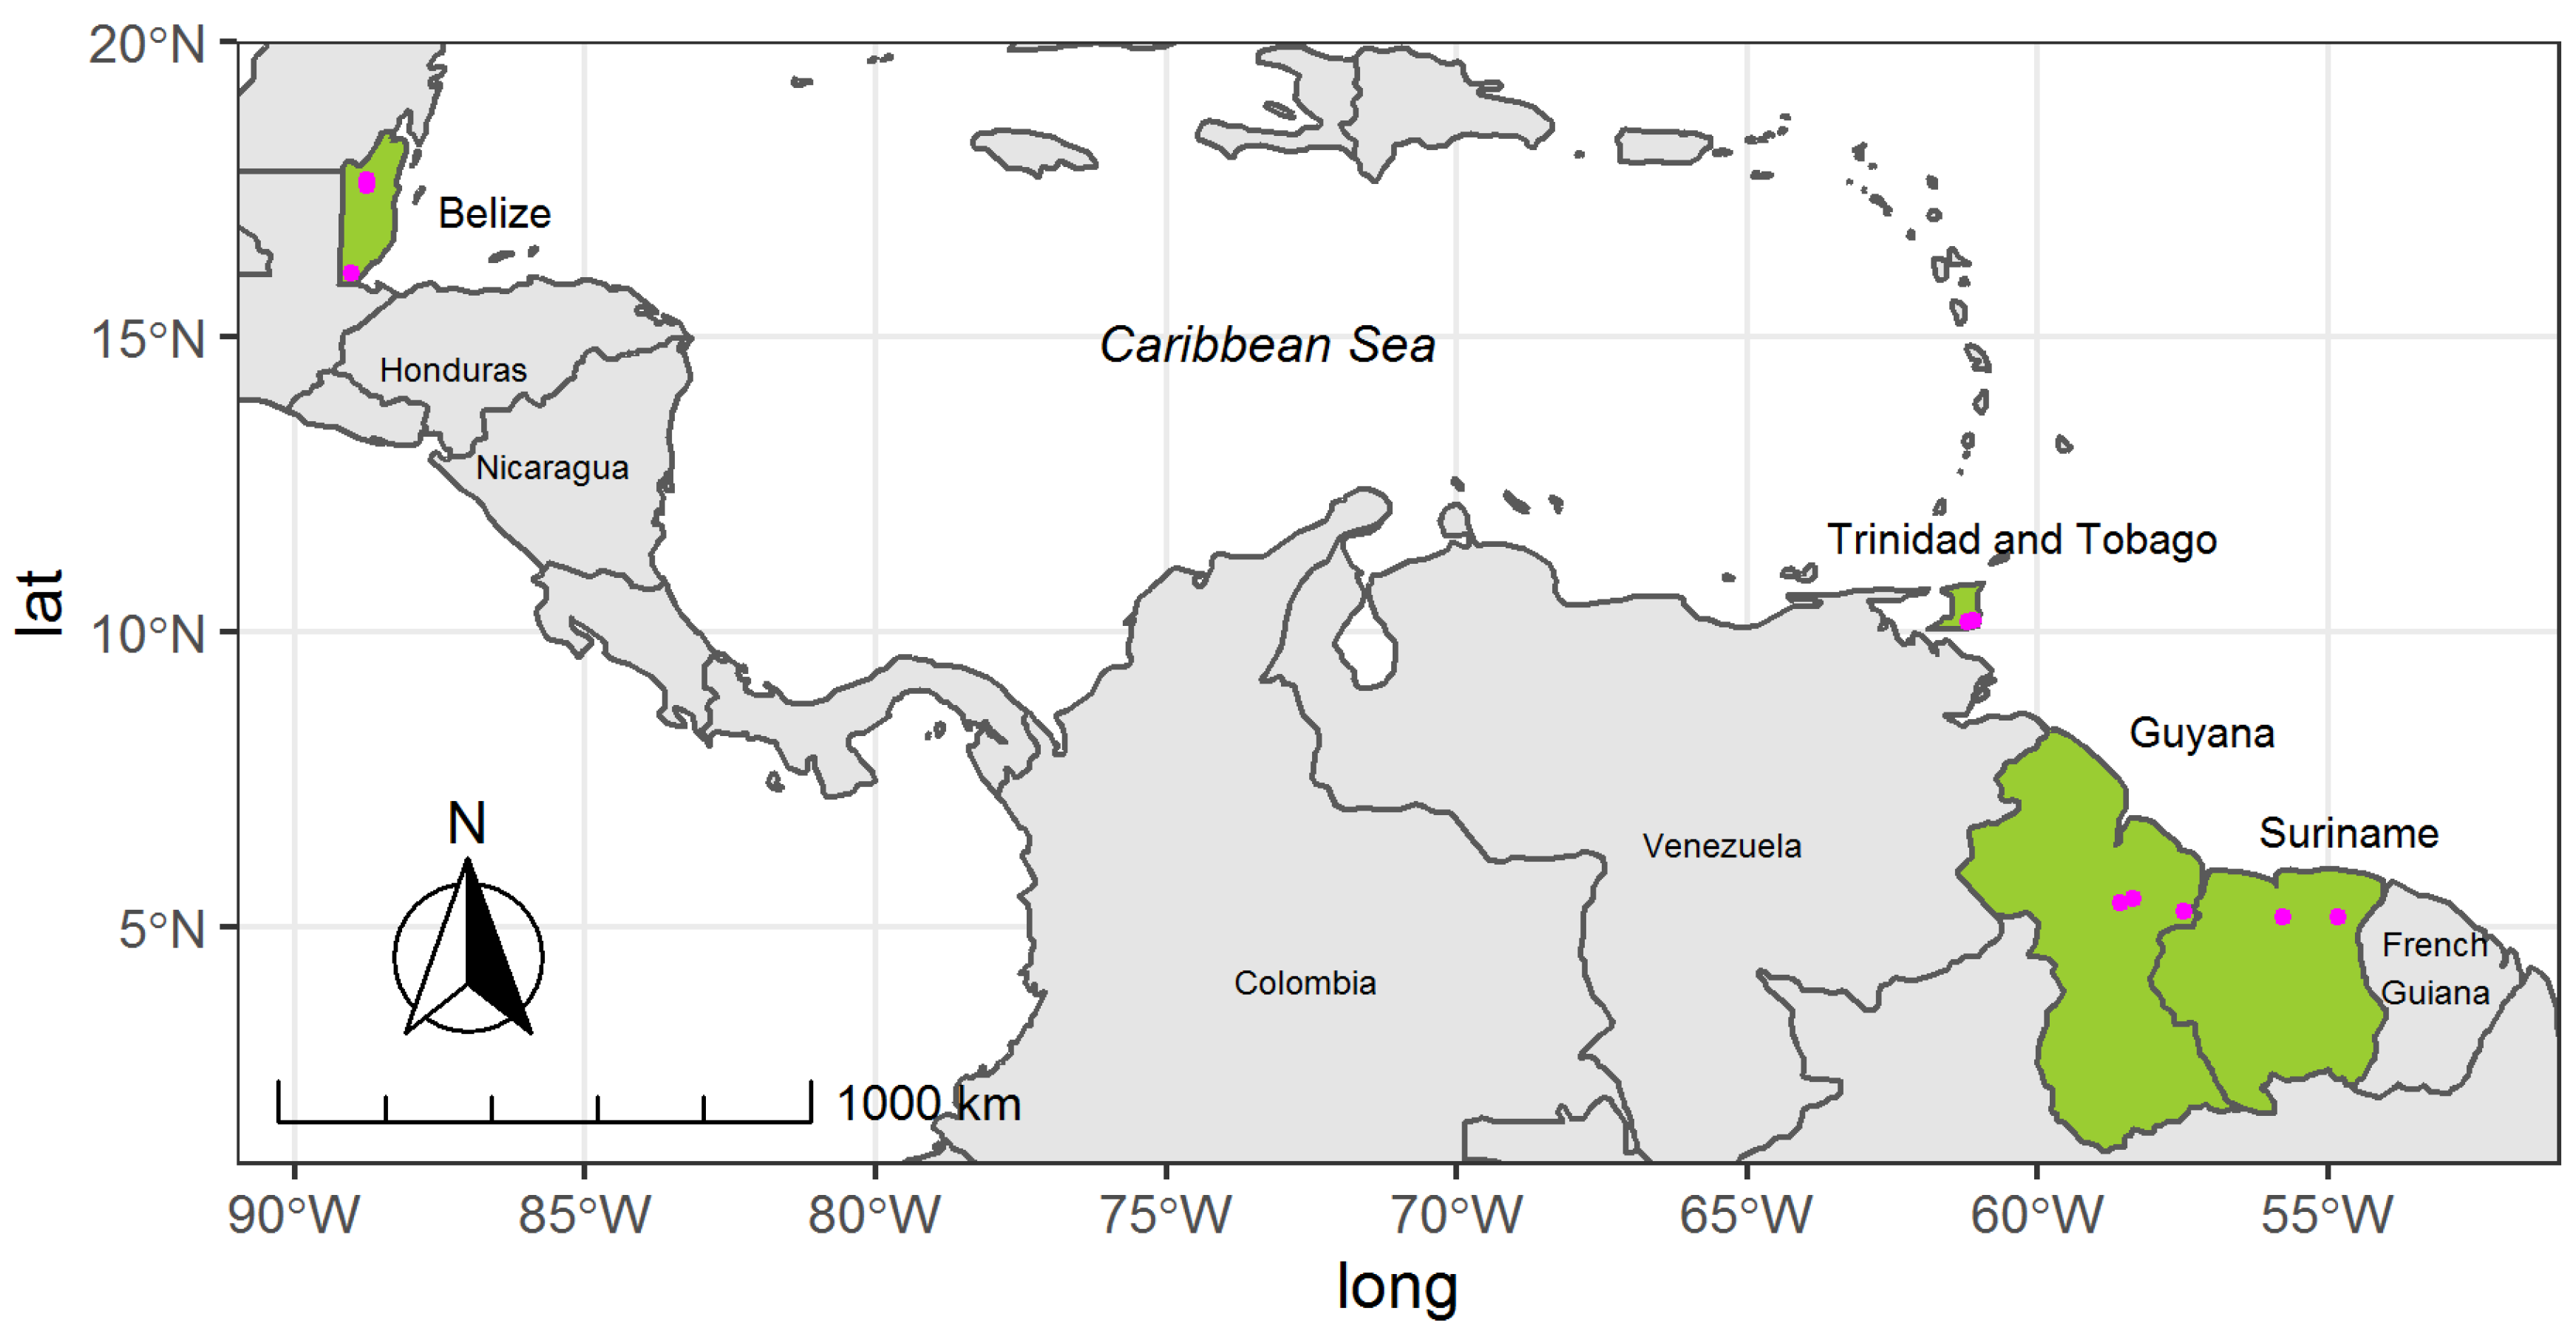
2.1. Study Sites

The data for this study were collected at 10 experimental sites in four Central and South American countries: Belize, Guyana, Suriname, and Trinidad and Tobago (Figure 1). Four forest tenure types were covered by the sites: (1) a privately owned forest and community managed forest in Belize, (2) a community managed forest in Guyana, (3) a large scale concession managed forest in Suriname, and (4) a periodic block system managed forest in Trinidad. The sites have been studied in previous research that includes a detailed description of the four forest tenure types, the management practices and the forest inventory [36]. The selected countries have a tropical climate with dry and rainy seasons. In Suriname and Guyana there are two rainy and two dry seasons, with dry seasons lasting from February to April and from August to November [37]. Belize and Trinidad and Tobago have one dry season lasting from January to May [38]. The mean annual precipitation is 2041 mm (Belize), 2375 mm (Guyana), 2390 mm (Suriname) and 1605 mm (Trinidad) [39]. Three experimental sites each were selected in Belize and Guyana, and two sites were selected in Suriname and Trinidad. Except for one site in Suriname, all sites cover an area of 100 ha (1 × 1 km). A randomized block design was chosen as the experimental design. At each site, four blocks composed of 32 plots of 0.5 ha (50 × 100 m) were installed. To avoid influences from neighboring stands, the individual blocks and the entire 1 × 1 km area were surrounded by a buffer zone. Due to the orientation of the impact areas specified by the concessionaire, a modified block design was required for one site in Suriname. In this site the size of the area was set at 0.8 × 1.25 km with two blocks, each consisting of 70 sample plots with a size of 0.5 ha each. Similar to the other blocks, these two blocks were also surrounded by a buffer zone. Silvicultural treatments were applied on half of the area in all sites, i.e. in one of the two blocks at the Surinam site and in two of the four blocks at the three sites in the other countries. The remaining area was used as control for future analysis of treatment effects and not included in the current study.

2.2. Pre-Harvest Iinventory

The planning of the silvicultural treatment was based on the information collected from a pre-harvest inventory [36] to characterize the overall structure of the forest stands. Log quality was assessed according to categories defined by the Food and Agriculture Organization of the United Nations [40]. The definition of social classes was based on the classification system cited by Nyland [41]. Furthermore, the tree species were recorded and classified into commercial and non-commercial species. All commercial tree species were assigned to four commercial species classes (CSC): (1) Class A comprises the species with the highest market value and the highest demand on the timber market, (2) Class B are the species with high acceptance on the timber market but with a lower market value, (3) Class C are marketable species but with low demand on the timber market, and (4) Class D are commercially exploited species but with a weaker marketability [36]. The classification of the species was based on local species classifications [42,43,44,45,46]. At each plot all trees with DBH ≥ 25 cm were measured and mapped. The threshold diameter was established in order to select an economically viable number of trees and to avoid including a high number of small trees that subsequently disappear from the stand due to natural mortality.

2.3. Silvicultural Treatment

The silvicultural treatment applied for this study is a future crop tree release (FCTR) treatment. FCTR is an intermediate silvicultural treatment designed to reduce competition for those individuals that are selected for future harvesting [47]. To be selected as a FCT, the trees were evaluated according to tree species, crown class, log grade, vitality, age, distribution and quantity (Table 1).
Some criteria such as species, log grade and DBH varied between countries according to local requirements and national regulations. The liberation of the FCTs was done by the selective felling of their competing trees. For this purpose, the individual growing space of a tree is to be expanded by reducing the direct competition in the crown region. To achieve this, trees whose crowns exceed or touch those of the FCTs are identified and felled as so-called competing trees. Trees whose crowns did not touch the crowns of the FCTs or whose crowns were below the crowns of the FCTs were not selected as competitors in order to avoid large canopy openings.
On all plots, the felling crew consisted of the chainsaw operator and an assistant. Among other duties, the assistant had the task of preparing the felling process, e.g., cleaning the escape route from vegetation or cutting off lianas and the bark of trees to be felled. After the assistant had finished the work, the chainsaw operator started the felling process. One team worked per experimental area. Each experimental area was assigned a different crew. The working skills of the chainsaw operators were comparable, as all had many years of logging experience in the respective forest types.

2.4. Time Study

We used time study data to quantify the cost of silvicultural treatments as a basis for an economic evaluation. The division of the entire work process into its operational elements, referred to below as work elements (Table 2), is an essential prerequisite for a time study. The time required for the execution of each work element was recorded. However, only the work elements “searching”, “preparation”, “felling” and “maintenance” were used for the cost calculation. The time study data used for this study were also subject of a previous research, that includes a detailed analysis [35].
The time study was conducted during the silvicultural work on the experimental sites from January to December 2018. To record the individual work elements, a camera was mounted on the helmet of the chainsaw operator. The video recordings were later used for the computer-aided evaluation of the time required for all work elements, using the open source software for event logging “BORIS” [48].

2.5. Descriptive Statistics

The necessary working elements of silvicultural treatments depend on specific local conditions, the number of FCTs selected and the amount of working days per site. Therefore, the magnitude of each work element recorded differs between the sites, which results in an unbalanced experimental design of the time study. We used the statistical computing environment R [49] and the R-package lme4 [50] to perform a linear mixed effects analysis. With a mixed effects model we were able to incorporate nested random-effects terms in a linear predictor expression. We fitted the model with AGB per hectare and trees per hectare as the response variables and the countries as the fixed effects. As random effects, we added the working days nested within the experimental sites. One of the advantages of the mixed model approach is its robustness to unbalanced data [51]. The residuals of the model are normally distributed.

2.6. Treatment Costs

2.6.1. Costs of Labor

The minimum monthly wages (Wmm) of Latin America and the Caribbean were used as the basis for calculating the labor costs [35]. The monthly minimum wage, corrected by purchasing power parity, ranged from US$ 253 to 883 [52]. The monthly minimum wage was used as the basis for the assistant’s salary. The salary of the chainsaw operator was taken from the assistant’s salary multiplied by a factor of 1.5. The level of the non-wage labor costs (Cnw) was assumed to be 49.5% of the wage costs [52]. The labor costs per hour (Clh) were calculated assuming 8 working hours per day (Twhd) and 20 working days per month (Nwdm) (Equation (1)).
C lh   =   W mm N wdm × T whd × ( 1 + C nw ) ,
where
Clh = hourly costs of labor (US$ hour−1)
Cnw = average non-wage labor costs amount (%)
Nwdm = working days per month
Twhd = working hours per day
Wmm = monthly minimum wage (US$ month−1)

2.6.2. Machinery Costs

The machine costs were calculated using the chain saw model "Stihl MS 880" equipped with a 90 cm long saw blade. This model and sword length is often used in logging operations in the Caribbean. The data from Whiteman [53,54], KWF et al. [55], and Richardson Saw and Lawnmower [56] served as the basis for the calculation of the operating hour costs (Table 3).
Prices for gasoline (Pgas) and oil (Poil) were estimated at US$ 0.776 per litre of gasoline and US$ 20 per litre of chainsaw chain and bar oil. Machine cost per hour (Cmh) was calculated using Equation (2) and includes depreciation cost per hour (Cdh) which is derived from Equation (3). The effective machine time (Temh) per FCT was derived from the work element “felling”.
Machine cost per hour:
C mh   =   C dh   +   ( K gas   ×   P gas ) + ( K oil   ×   P oil ) ,
where
C dh   =   C p T emh   ×   T el ,
Cdh = depreciation cost per hour (in US$)
Cmh = machine cost per hour (in US$)
Cp = purchase cost (in US$)
Kgas = fuel consumption (in litre hour−1)
Koil = oil consumption (in litre hour−1)
Pgas = gasoline price (in US$ litre−1)
Poil = oil price (in US$ litre−1)
Tel = expected life time (in years)
Temh = effective machine hours per year (in hours)

2.7. Carbon Analysis

2.7.1. Above Ground Biomass Growth Simulation

The above ground biomass (AGB) was estimated using a biomass–diameter regression model for moist forests according to Chave et al. [57].
AGB = exp [ 1.803 0.976 E + 0.976 ln ( ρ ) + 2.673 ln ( D B H ) 0.0299 [ ln ( D B H ) ] 2 ] ,
where
AGB = above ground biomass in kg,
DBH = diameter at breast height in cm,
E = environmental stress factor, and
ρ = wood specific density.
The wood specific density (ρ) was determined using the getWoodDensity function from the R-package BIOMASS [58]. The function assigns to each taxon a species- or genus-level average if at least one wood density value in the same genus as the focal taxon is available in the global wood density database [59]. For unidentified or unknown trees the stand-level mean wood density is assigned to the tree [58]. The environmental stress factor (E) was determined from a global gridded layer of E at 2.5 arc sec resolution [57] using the tree location coordinates.
Due to the lack of growth measurements at the experimental sites after previous interventions, we implemented growth rates from previous studies conducted in the region into a simple diameter growth approach to simulate the growth of the individual FCTs. Using the growth simulation, the time to reach initial AGB and the difference in biomass growth between released and non-released FCTs after this time can be estimated. The difference in biomass growth is a benchmark for the assessment of the required additional biomass growth (RAGagb).
In logged tropical forests, several studies have determined an average diameter growth per tree between 0.8 and 5.1 mm year−1 [60,61,62,63,64]. After release treatment, growth increases of 20 to 60% of the released trees were observed in several studies [19,20,21,34]. For this study we use a fixed mean diameter growth rate of 2.7 mm year−1 for unreleased FCTs and a 30% increased growth rate of 3.51 mm year−1 for released FCTs.

2.7.2. Carbon Prices

In 2019, carbon prices ranged from US$ 1 to 127 Mg CO2e−1 [65]. For our calculations we assumed prices (Pc) from US$ 5 to 100 Mg CO2−1.

2.7.3. Discount Rate

The costs and revenues of the treatment are incurred at different times. Future costs and returns are subjectively assessed differently than current costs and returns. Our analysis of the treatment was based on a variation of the net present value (NPV) method, which is a suitable method for assessing the profitability of an investment [66,67]. By using an annual discount rate, when applying the NPV method, costs and revenues can be calculated by discounting to the so-called (net) present value. The choice of the discount rate has a significant impact on the valuation of investments, especially for investments whose profitability is considered over a long time horizon. Revenues from investments in silvicultural treatments are usually only generated after relatively long periods of time, which is why the assumption of a high discount rate can lead to supposedly negative results in the profitability analysis [68,69]. We therefore chose a low discount rate (i) of 2.5% per annum for our calculations.

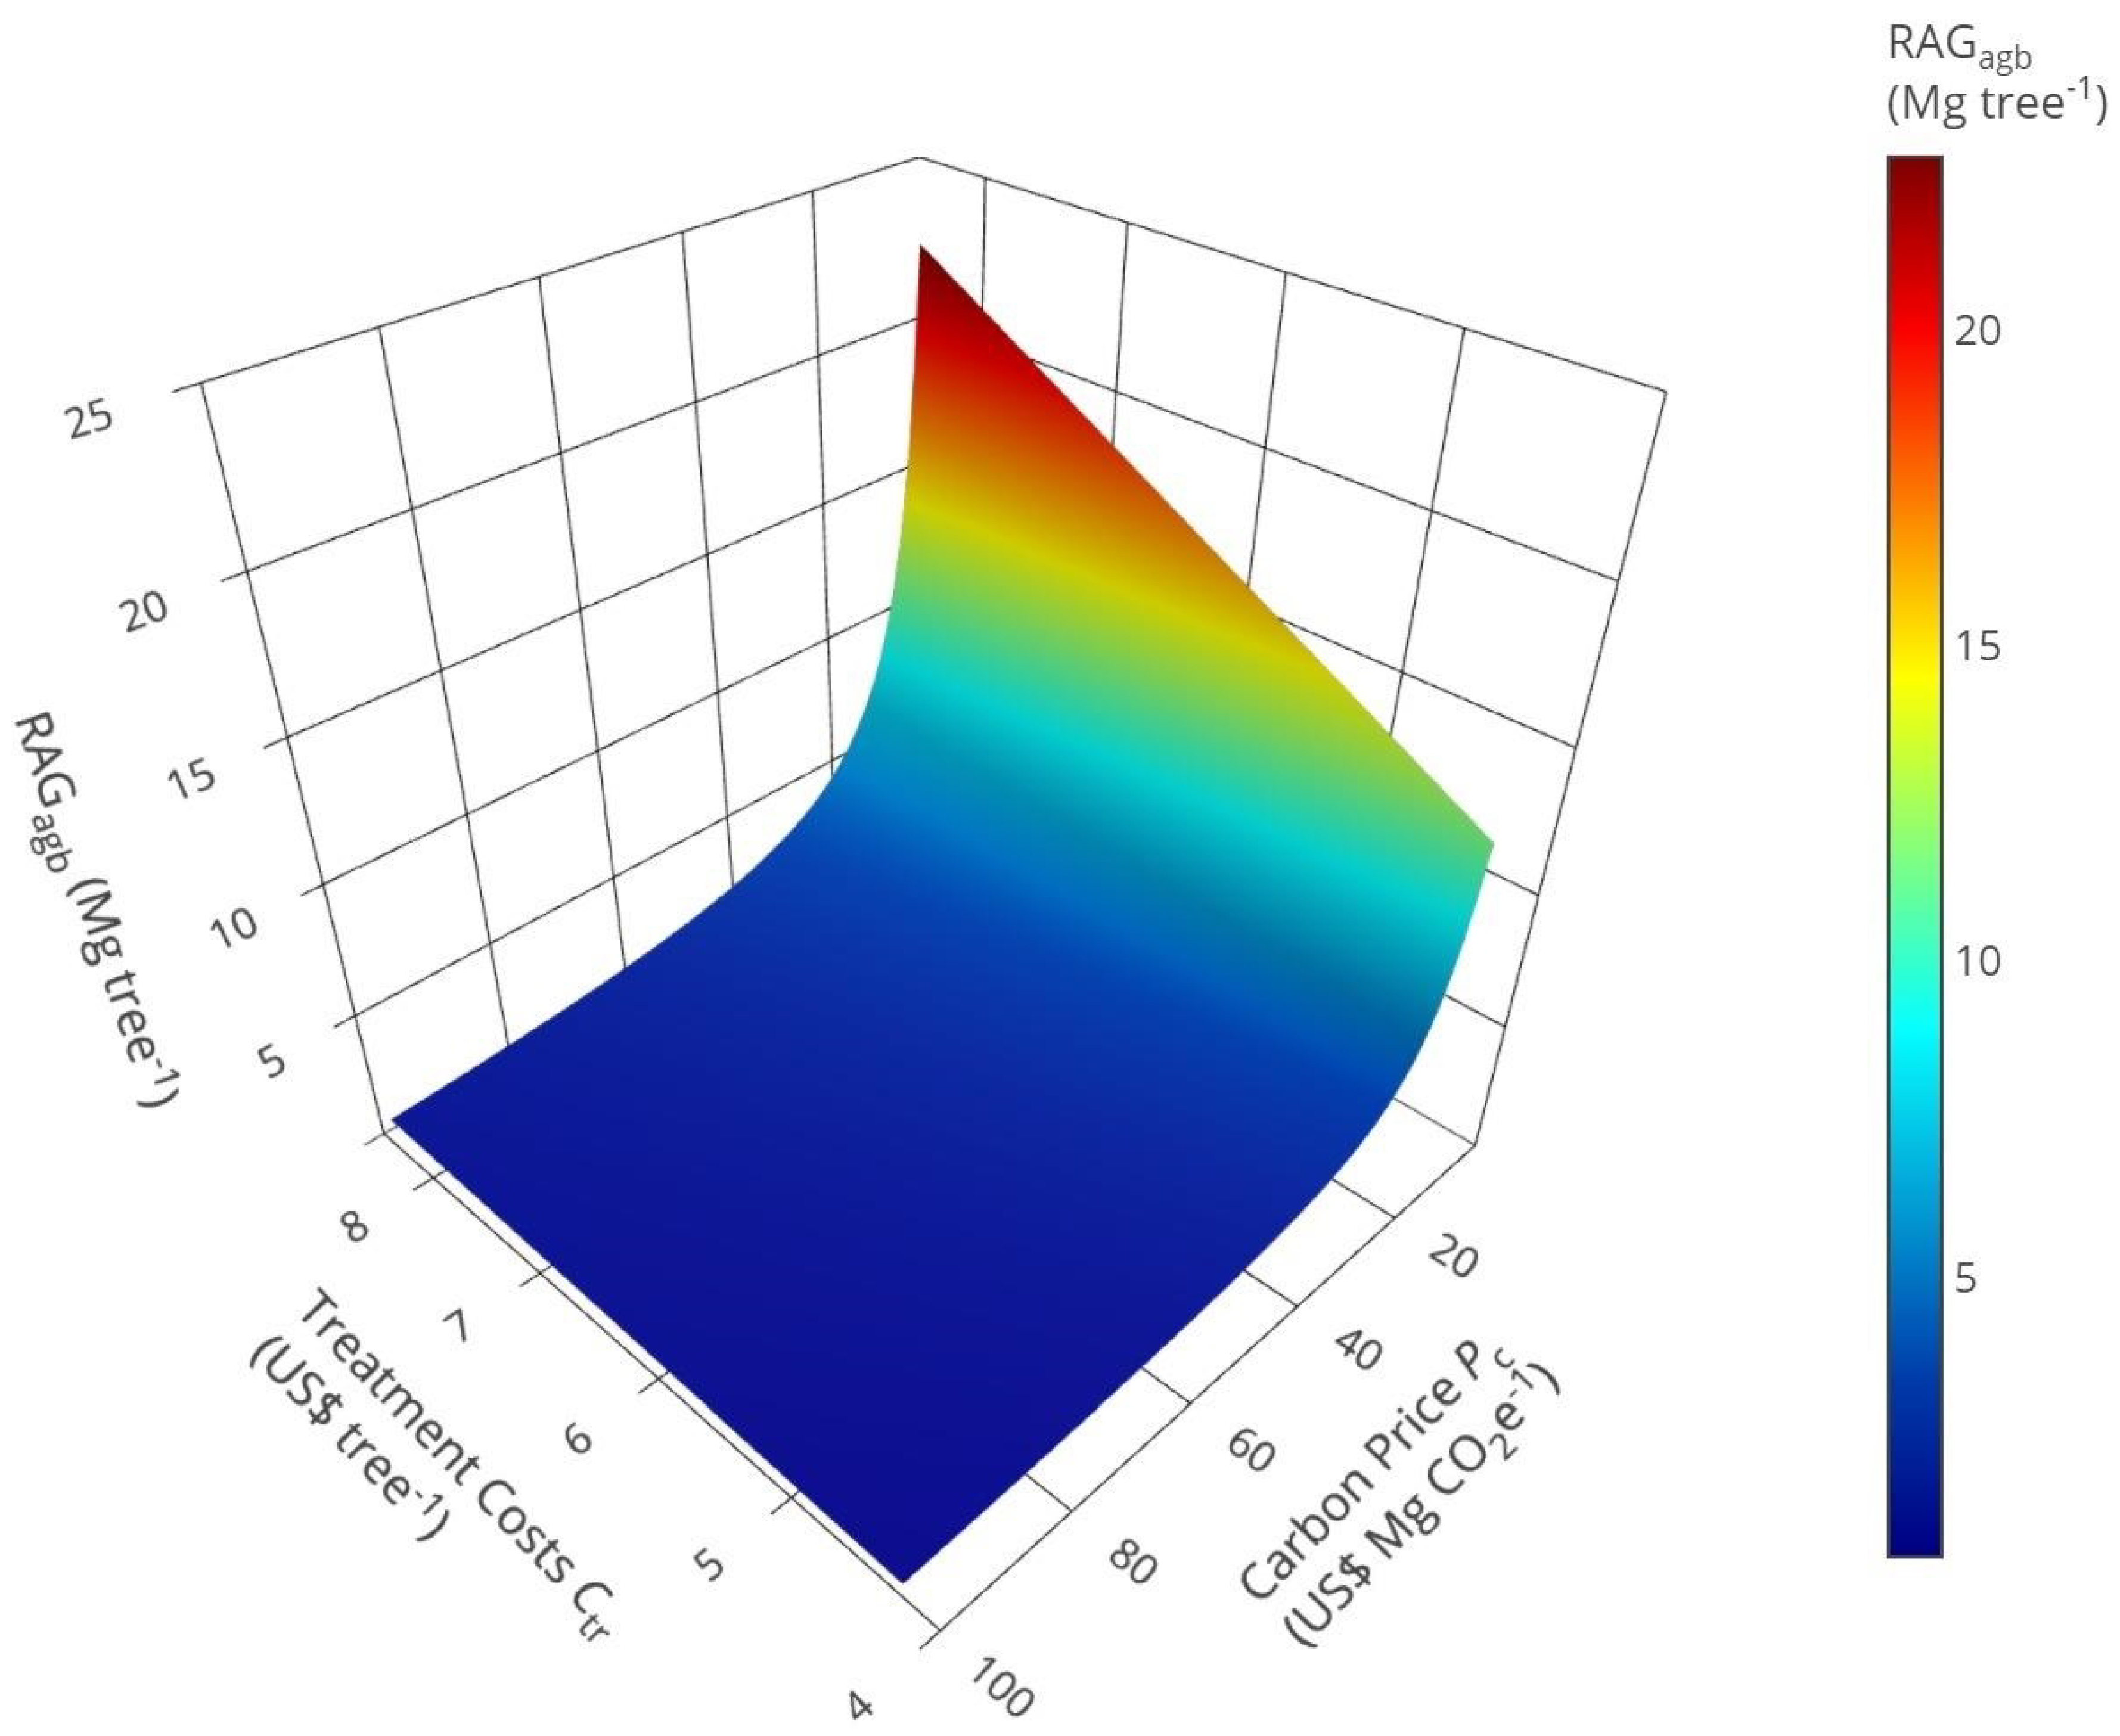
2.7.4. Required Additional Growth

For a FCT treatment to work properly in both economic and carbon balance terms, two conditions must be met: (1) the carbon losses caused by the treatment must at least be compensated for by the increased growth until harvest time; (2) the income generated by the additional growth until the time of harvest must at least cover the costs of the treatment.
The carbon analysis carried out here uses a recursive approach to determine the additional increases in biomass for which the treatment is financed assuming different carbon prices. By simulating the AGB growth of a released and a non-released FCT, we determined the point in time when the released FCTs reaches both, the AGB gain of the non-released FCT and in addition the AGB loss caused by felling competitors. The time (Tr) needed for the FCT to compensate for the biomass loss through the treatment was determined using the growth simulation presented above. A growth increase of 30% through the treatment was assumed. For the sake of simplicity, we assume that the entire C content of the felled competitors is released by decomposition processes.
If the net present value of an investment is greater than zero, the investment is considered profitable. In the recursive approach used here, the required additional biomass growth per tree (RAGagb) is a function of the carbon price (Pc) and treatment costs (Ctr). The carbon price is discounted to the current point in time and, together with the AGB of the removed competitors, gives the additional biomass increment required when the NPV is zero (Equations (5) and (6)).
RAG agb = C tr × ( 1 + i ) T r P c × 1 F agb × F c   ,
where
C tr   = [ ( C lh × T ewh ) + ( C mh × T emh ) ] × N c ,
Clh = hourly cost of labour (in US$)
Cmh = machinery cost per hour (in US$)
Ctr = treatment costs per FCT (in US$)
Fagb = AGB to C conversation factor = 0.5 [70,71,72]
Fc = C to CO2e conversion factor = 44/12 = 3.67 [73]
i = annual discount rate (in %)
Nc = number of removed competitors per released FCT
Pc = carbon price (US$ Mg CO2−1)
RAGagb = additional AGB growth per tree within the recovery time (in Mg tree−1)
Temh = effective machine time per tree (in hours)
Tewh = effective working time per tree
Tr = recovery time (in years)
The revenues are based on the carbon prices at the end of the recovery time. The growth necessary to cover treatment costs was calculated for carbon prices between US$ 5 and 100 Mg CO2−1 [65] and treatment costs of US$ 4.2 to 8.4 per tree, which are based on the results of the time study. The response area was next calculated; it represents the average AGB growth per FCT needed to cover the investment in silvicultural treatments depending on the discounted revenues and treatment costs, and to compensate for the carbon loss from the treatment.

3. Results

3.1. Effects of Selective Logging and FCTR Treatment

The mean of the total above ground biomass of all sites before the intervention was 186 Mg ha−1 (95% confidence interval (CI): 96.2, 276), with the highest AGB estimated for Trinidad (Mean: 237 Mg ha−1, CI: 141.7, 332) and the lowest for Belize (Mean: 124 Mg ha−1, CI: 46.7, 202). The most frequently occurring commercial tree species at the experimental sites are Bucida buceras L., Vitex gaumeri Greenm., Brosimum alicastrum Sw. and Swietenia macrophylla King in Belize, Catostemma commune Sandwith, Eperua falcata Aubl., Eperua grandiflora (Aubl.) Benth. and Humiria balsamifera Aubl. in Guyana, Mora excelsa Benth., Pentaclethra macroloba (Willd.) Kuntze, Clathrotropis brachypetala (Tul.) Kleinh. and Spondias mombin L. in Trinidad, and Dicorynia guianensis Amshoff, Qualea rosea Aubl., Tetragastris sp. Gaertn. and Casearia javitensis Kunth in Suriname. During commercial harvesting, an average of 20.9 Mg ha−1 (CI: 1.34, 40.5) were removed by harvesting an average of 5.2 (CI: 2.5, 7.8) trees per hectare (N). The harvest intensity (Table 4) was highest in Suriname (AGB: 35.4 Mg ha−1, N: 7.6 trees ha−1) and lowest in Guyana (AGB: 7.5 Mg ha−1, N: 3.7 trees ha−1). For the treatment, an average of 2.3 (CI: 0.03, 4.6) FCTs per hectare with a mean total AGB of 2.8 Mg ha−1 (CI: 0, 6) or 1.2 Mg per individual FCT were released. The highest number of FCTs per hectare were released in Trinidad (N: 3.4 trees ha−1) and the lowest number in Guyana (N: 0.4 trees ha−1). An average of 3.3 (CI: 0, 6.6) competitors were removed per hectare, with maximum numbers in Suriname (N: 4.8 trees ha−1) and minimum numbers in Guyana (N: 0.54 trees ha−1). This corresponds to an average for all countries of 1.4 competitors per FCT. Per hectare, the average AGB of the removed competitors was 5.4 Mg ha−1 (CI: 0, 11.7), with highest AGB removed in Suriname (AGB: 10.3 Mg ha−1) and lowest in Guyana (AGB: 0.9 Mg ha−1). The AGB of the residual trees, i.e. all trees not identified as harvest trees, FCTs or competitors was on average 149 Mg ha−1 (CI: 85.9, 213).

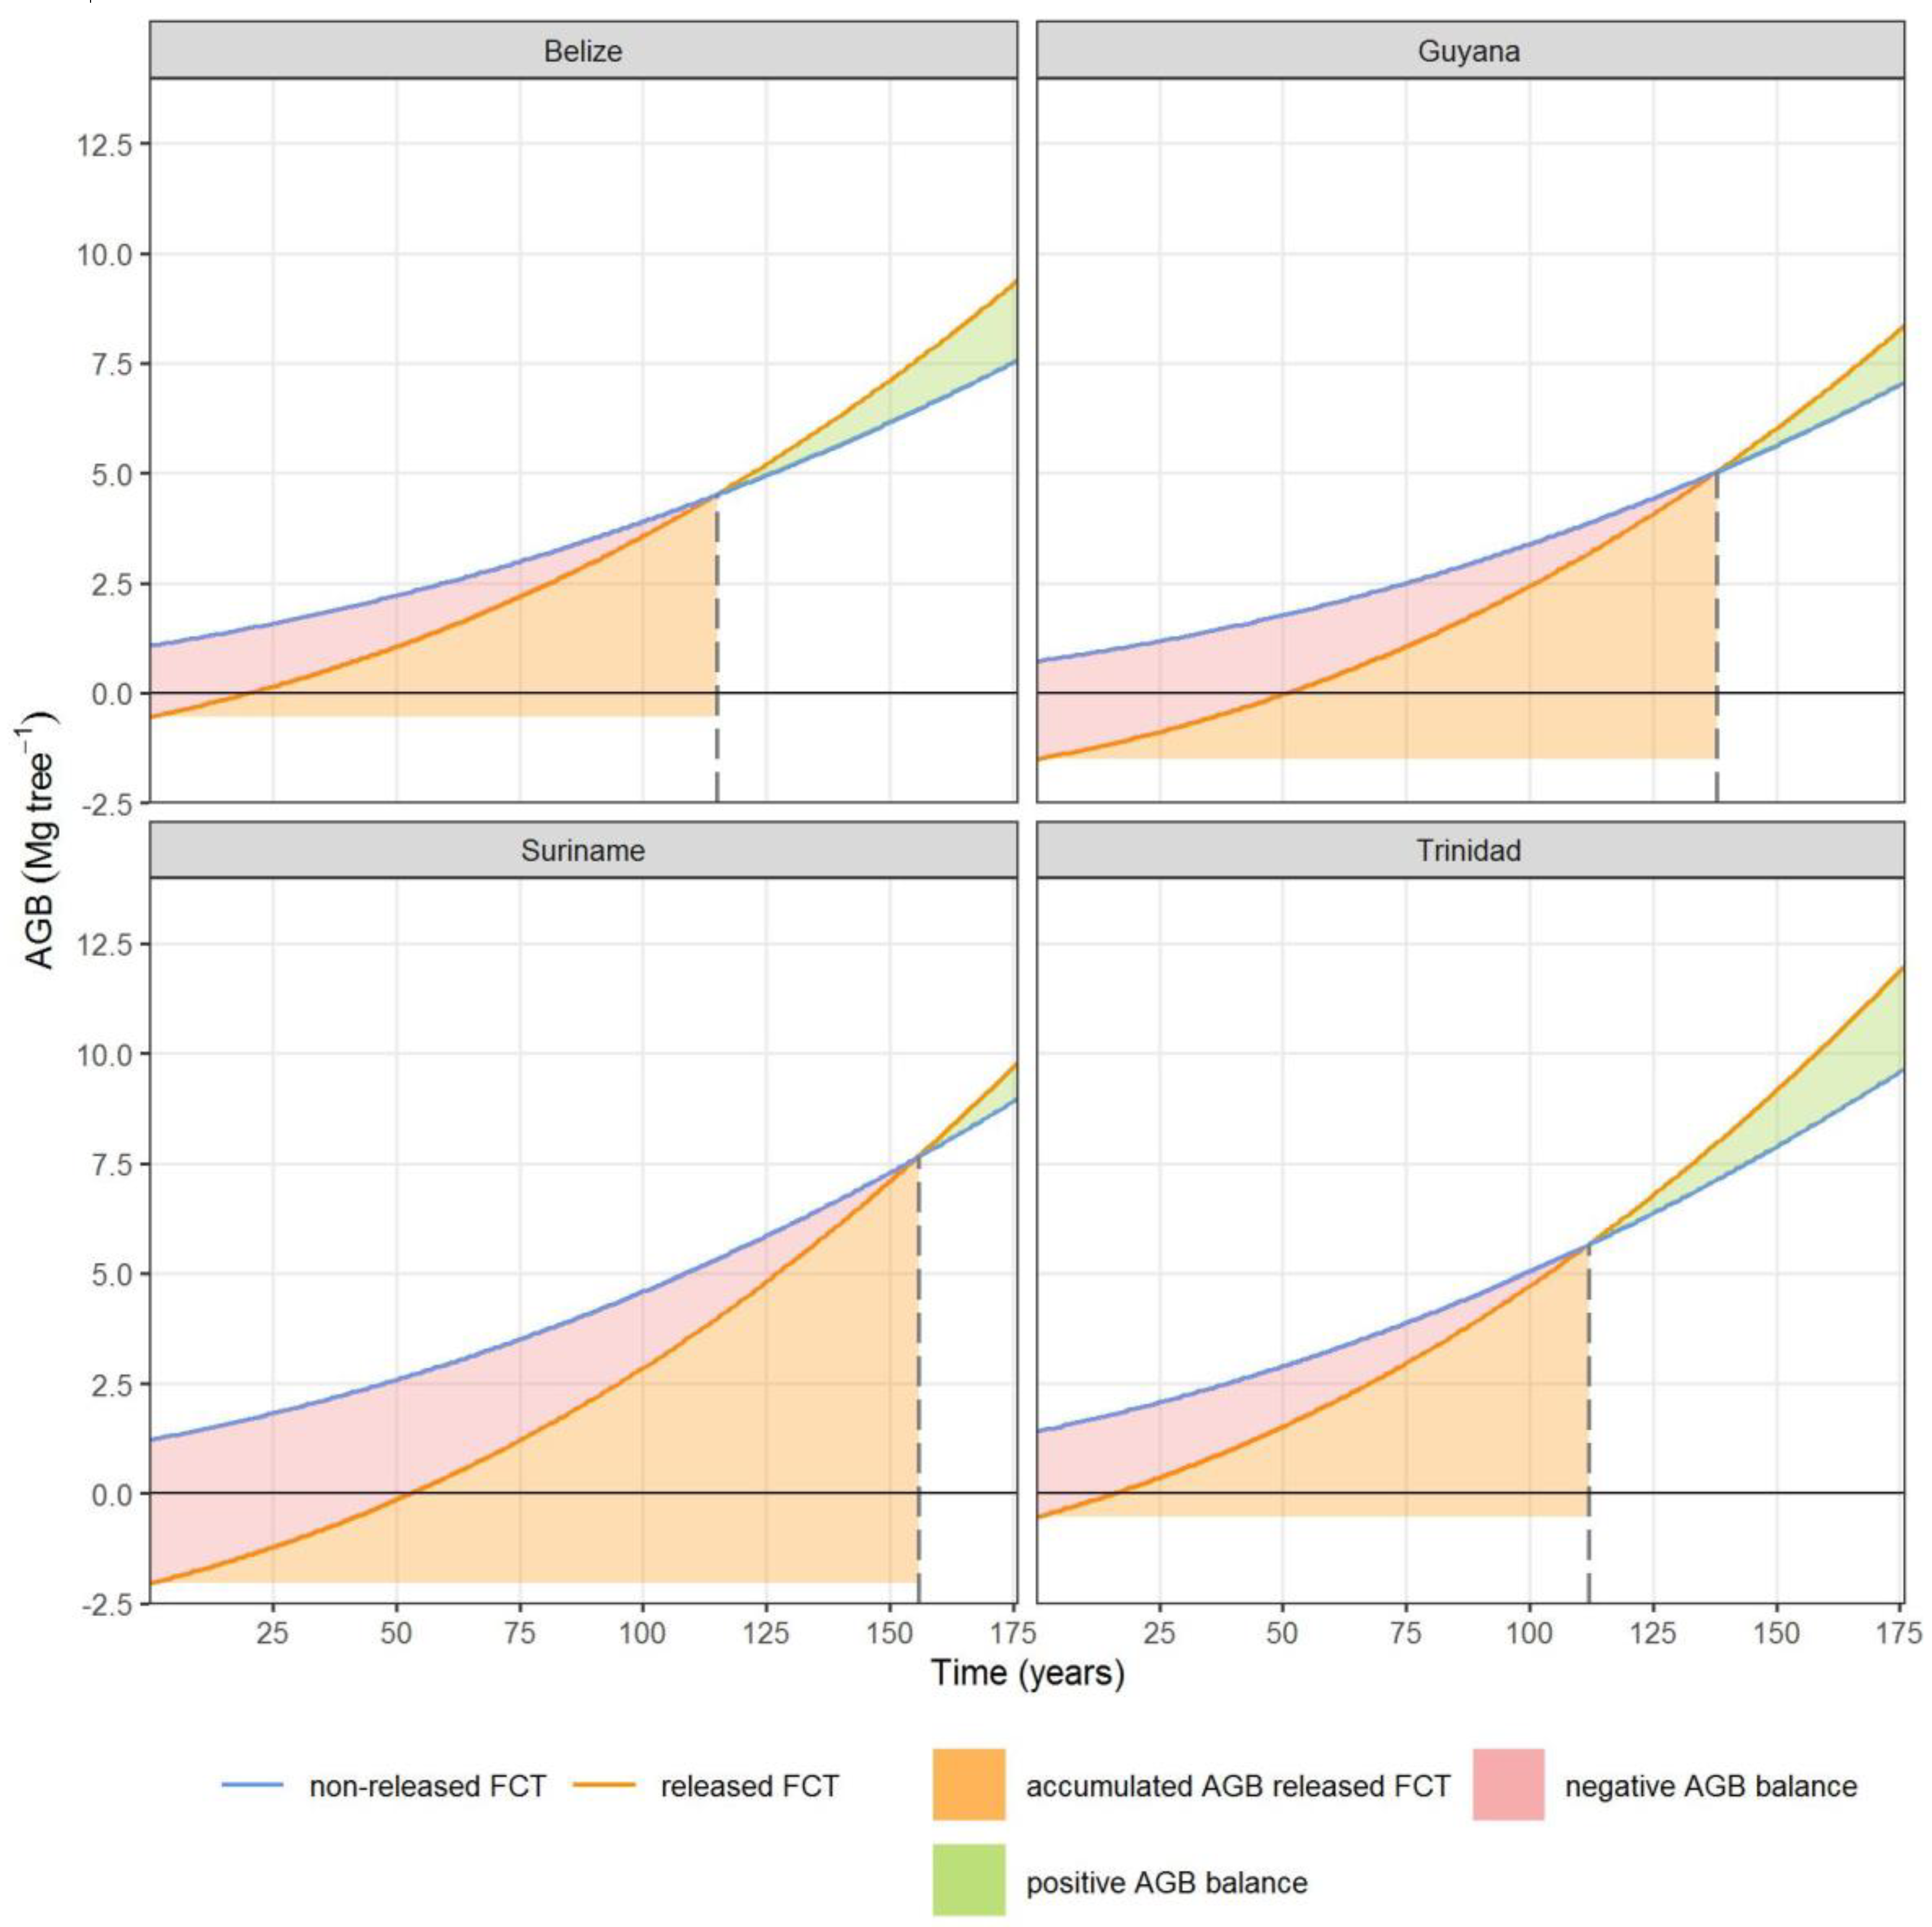
3.2. Carbon Analysis

For each FCT released, the mean initial AGB, which was calculated as the sum of the AGBs of the FCT and the removed competitors, was between 2.7 and 4.5 Mg, with the lowest initial AGB in Belize and highest in Suriname. The removal of the competitors reduced the mean initial AGB between 1.6 Mg in Belize and 3.3 Mg in Suriname, and only the FCT’s mean AGB which ranged from 0.7 Mg tree−1 in Guyana to 1.4 Mg tree−1 in Trinidad remained. Trees which were not released from competitors produce biomass, which can immediately be considered as C-pool gain. The released FCTs produce more biomass than non-released trees, but first have to compensate for the AGB of the removed competitors before a C-pool gain can be achieved.
The growth simulation showed that with an anticipated 30% increase in growth achieved by the release, the average recovery time (Tr) that an FCT would need to reach the AGB gain of a non-released FCT and additionally compensate for the biomass loss due to the removal of competitors would range from 112 years in Trinidad to 156 years in Suriname. Compared to a non-released tree, the AGB-loss resulting from the removal of competitors is decreasing over time due to the increased growth of the released FCT (red areas in Figure 2). At the end of the recovery time (Tr), a break-even point is reached where the AGB growth of a FCT compensates for the AGB losses of the removed competitors and the growth of a non-released tree. Only after this break-even point does the release of FCTs actually lead to a gain in AGB (green areas in Figure 2). At the break-even points, AGBs were estimated between 5.1 Mg tree−1 after 115 years in Belize and 9.7 Mg tree−1 after 156 years in Suriname for released and between 4.5 Mg tree−1 in Belize and 7.7 Mg tree−1 in Suriname for non-released trees.
Figure 3 shows the response area, which represents the financial break-even point of the required additional AGB growth as an average of all countries, as a function of treatment costs and revenues. The response area represents the point in time after an average of 130 years at which the biomass of a released FCT is equal to the sum of the AGB of a non-released tree and the AGB of felled competitors. Compared to a non-released tree the required additional AGB growth per FCT, RAGagb is between 0.6 and 22.7 Mg tree−1. With carbon prices of US$ 40 to 100 Mg CO2−1, the slope of the response surface indicating the required additional AGB growth is consistently flat. At carbon prices of less than US$ 40 Mg CO2−1 the slope of the response area becomes steeper and reaches a maximum at carbon prices of less than US$ 20 Mg CO2−1.

4. Discussion

By extending the REDD concept to REDD+, SFM has become part of the strategy for avoiding carbon emissions from forests. Since silvicultural treatments, such as FCTR, are often a critical component of SFM, we analyzed to what extent the loss of biomass due to the application of a liberation treatment can be compensated by the remaining stand and whether such treatment could be financed due to the possible increased biomass growth and the resulting carbon credits.
On average, about two FCTs per hectare were released under the treatment, with 1.4 competitors per FCT being felled. The removal of the competitors reduced the initial average biomass from 3.4 to 1.1 Mg per FCT released. Running a growth simulation, it was determined that the released FCT would need on average 130 years to compensate for the biomass loss of 2.3 Mg. This supports Rutishauser et al. [74], which found that the proportion of initial above-ground carbon stock lost at stand level best predicted the time to recover initial carbon stocks. However, the recovery times determined in our study are significantly higher than the harvesting cycles of 25 to 30 years which are common in Central and South America [75]. This confirms Zimmerman and Kormos [76], which propose an increase of the usual harvesting cycles by at least a factor of two. Under current harvesting cycles and harvesting intensities [75], which do not take site-specific conditions into account [77], the application of FCTR treatments may lead to carbon emissions. To avoid carbon emissions from FCTR treatments, felling cycles must be determined based on recovery times and site-specific conditions.
Even if a full balance on carbon stocks can be reached by extending the harvesting cycles, the question of economic viability must be addressed. REDD+ activities aim to achieve result-based payments. Therefore, the cost of releasing a FCT from competitors must be compared with the potential financial value of the C-gains achieved. The necessary increment gain is generated when the entire carbon loss from removed competitors is recovered and the additional C-gains correspond to the treatment costs. The revenues generated at the end of the recovery period are discounted carbon prices. The desired increment gain is thus the financial break-even point at which the expenditure for silvicultural treatments is exactly covered by the additional income generated by carbon credits. Only after the financial break-even point is reached, does the silvicultural treatment lead to a profit. We calculated the additional biomass growth that would be necessary to finance the treatment through the generation of carbon credits. We assumed treatment costs of US$ 4.2 to 8.4 per released FCT and carbon prices of US$ 5 to 100 per Mg CO2e−1. More than half of the carbon emissions covered by carbon price initiatives are priced at less than US$ 10 Mg CO2e−1 [65]. At a carbon price of US$ 10 Mg CO2e−1, the required additional biomass growth after 130 years would be between 5.8 and 11.4 Mg per FCT, depending on treatment costs. Köhl et al. [78] investigated biomass growth of 61 individual trees with ages ranging from 84 to 255 y and stem diameters ranging from 36.7 to 99.2 cm at the time of harvest. The accumulated biomass per tree at the end of their lifetime ranged between 0.3 and 7.3 Mg and thus only partially achieves the required biomass growth rates determined by this study.
The additional biomass growth of released FCTs required to be in balance with a non-released tree is in the range of 5.8 to 11.4 Mg. Even after a period of 130 years, such an increase is not guaranteed, as it exceeds the biological growth potential of most individual trees. From a forest-growth perspective, there is a substantial risk that FCTR treatments investigated in this study do not lead to a carbon gain.
Due to the lack of long-term observations of the tropical forest populations, we chose the simplified approach of constant growth rates for the growth simulation. Mortality, recruitment, diameter distributions, neighborhood relations or the social position of the single tree were not considered. This limited modelling the variability of tree specific growth differences, which exists especially in tropical forests (e.g., Newbery and Ridsdale [79], Köhl et al. [78]).

5. Conclusions

The five activities of REDD+ that contribute to mitigation actions in the forest sector include the enhancement of forest carbon stocks and sustainable management of forests [80]. The release of FCTs per se does not guarantee a substantial increase in forest carbon stocks or sustainability in terms of AGB. Particularly critical is the fact that FCTR treatments within the regular intervention cycles of use of a few decades may lead to a C-loss compared to unreleased trees.
The approach with regard to the generation of payments must also be reviewed critically. One of the basic ideas of REDD+ is to reward activities that lead to the maintenance or enhancement of the forest C-pool through incentive payments. Our study shows that refinancing the costs of the treatments is a problem. The time period required for refinancing clearly exceed a reasonable economic planning horizon. Even significantly higher CO2 prices do not really improve the economic appraisal. It should also be considered that incentive payments are subject to transaction costs, which further complicates the economic impact at the local level.
Our study reveals that no silvicultural treatments in which carbon losses are further increased are applied after selective logging takes place. The FCTR treatments investigated in this study are not recommended as an REDD+ activity, both from an economic point of view and with regard to the biological growth potential of trees. The avoidance of biomass losses during timber harvesting contributes substantially more to the conservation of the forest C-stock.
We present a first indication on the impact of FCTR treatments in tropical forests on carbon stocks and result-based payments. The variability of tree species compositions, stand structures and site factors in tropical forests shows that further studies on the long-term interactions between silvicultural measures and tree growth, natural regrowth after logging operations and differences in carbon recovery between different forest types and growth regions are urgently needed.

Author Contributions

Methodology, data curation, validation, formal analysis, investigation, writing—original draft preparation, visualization, S.G.; conceptualization, methodology, validation, writing—review and editing, supervision, project administration, funding acquisition, M.K. All authors have read and agreed to the published version of the manuscript.

Funding

This work was funded by the German Federal Ministry of Food and Agriculture (BMEL) through the project “Ensuring long-term productivity of lowland tropical forests in the Caribbean” (GCP/SLC/205/GER). The main objective of this research project was to develop guidelines for the management of logged-over natural forests in the Caribbean. The project was implemented as a regional government trust fund project conducted in partnership with the University of Hamburg and partner organizations in the participating countries.

Acknowledgments

We would like to express our gratitude to Claus-Martin Eckelmann, Food and Agriculture Organization of the United Nations, Edilberto Romero and Ramon Pacheco, Programme for Belize, the Belize Forest Department, Quacy Bremner, Forestry Training Centre Inc., Guyana, the Guyana Forestry Commission, Maureen Playfair, Centre for Agricultural Research in Suriname, the Foundation for Forest Management and Production Control, Suriname, Mike P. Oatham, the University of the West Indies, Trinidad and Tobago, the Forestry Division of Trinidad and Tobago, for contributing their valuable time and sharing their knowledge and insights to the realization of this research. We are thankful to Thomas Hausmann and Matthias Schwörer, German Federal Ministry of Food and Agriculture, for their support and rewarding discussions. Philip Mundhenk deserves thanks for his patient assistance in the application of R. Three unknown reviewers carefully read the first draft of the manuscript and gave valuable hints for revision. We are deeply indebted to them for their contribution to improve the quality of the manuscript.

Conflicts of Interest

The authors declare no conflict of interest. The funders had no role in the design of the study; in the collection, analyses, or interpretation of data; in the writing of the manuscript, or in the decision to publish the results.

References

  1. FAO. Global Forest Resources Assessment 2020; FAO: Rome, Italy, 2020; ISBN 978-92-5-132581-0. [Google Scholar]
  2. Mackey, B.; Kormos, C.F.; Keith, H.; Moomaw, W.R.; Houghton, R.A.; Mittermeier, R.A.; Hole, D.; Hugh, S. Understanding the importance of primary tropical forest protection as a mitigation strategy. Mitig Adapt. Strat. Glob. Chang. 2020, 25, 763–787. [Google Scholar] [CrossRef] [Green Version]
  3. Lugo, A.E.; Brown, S. Tropical forests as sinks of atmospheric carbon. For. Ecol. Manag. 1992, 54, 239–255. [Google Scholar] [CrossRef]
  4. Soepadmo, E. Tropical rain forests as carbon sinks. Chemosphere 1993, 27, 1025–1039. [Google Scholar] [CrossRef]
  5. Pan, Y.; Birdsey, R.A.; Fang, J.; Houghton, R.; Kauppi, P.E.; Kurz, W.A.; Phillips, O.L.; Shvidenko, A.; Lewis, S.L.; Canadell, J.G.; et al. A large and persistent carbon sink in the world’s forests. Science 2011, 333, 988–993. [Google Scholar] [CrossRef] [PubMed] [Green Version]
  6. Baccini, A.; Walker, W.; Carvalho, L.; Farina, M.; Sulla-Menashe, D.; Houghton, R.A. Tropical forests are a net carbon source based on aboveground measurements of gain and loss. Science 2017, 358, 230–234. [Google Scholar] [CrossRef] [PubMed] [Green Version]
  7. Pearson, T.R.H.; Brown, S.; Casarim, F.M. Carbon emissions from tropical forest degradation caused by logging. Environ. Res. Lett. 2014, 9, 34017. [Google Scholar] [CrossRef] [Green Version]
  8. Pearson, T.R.H.; Brown, S.; Murray, L.; Sidman, G. Greenhouse gas emissions from tropical forest degradation: An underestimated source. Carbon Balance Manag. 2017, 12, 1–11. [Google Scholar] [CrossRef] [PubMed] [Green Version]
  9. Asner, G.P.; Knapp, D.E.; Broadbent, E.N.; Oliveira, P.J.C.; Keller, M.; Silva, J.N. Selective logging in the Brazilian Amazon. Science 2005, 310, 480–482. [Google Scholar] [CrossRef]
  10. Putz, F.E.; Zuidema, P.A.; Pinard, M.A.; Boot, R.G.A.; Sayer, J.A.; Sheil, D.; Sist, P.; Vanclay, J.K. Improved tropical forest management for carbon retention. PLoS Biol. 2008, 6, e166. [Google Scholar] [CrossRef] [Green Version]
  11. Nasi, R.; Putz, F.; Pacheco, P.; Wunder, S.; Anta, S. Sustainable Forest Management and Carbon in Tropical Latin America: The Case for REDD+. Forests 2011, 2, 200–217. [Google Scholar] [CrossRef] [Green Version]
  12. West, T.A.; Vidal, E.; Putz, F.E. Forest biomass recovery after conventional and reduced-impact logging in Amazonian Brazil. For. Ecol. Manag. 2014, 314, 59–63. [Google Scholar] [CrossRef]
  13. Vidal, E.; West, T.A.P.; Putz, F.E. Recovery of biomass and merchantable timber volumes twenty years after conventional and reduced-impact logging in Amazonian Brazil. For. Ecol. Manag. 2016, 376, 1–8. [Google Scholar] [CrossRef]
  14. Neupane, P.R.; Wiati, C.B.; Angi, E.M.; Köhl, M.; Butarbutar, T.; Reonaldus Gauli, A. How REDD+ and FLEGT-VPA processes are contributing towards SFM in Indonesia–the specialists’ viewpoint. Int. For. Rev. 2019, 21, 460–485. [Google Scholar] [CrossRef]
  15. Sufo Kankeu, R.; Sonwa, D.J.; Eba’a Atyi, R.; Moankang Nkal, N.M. Quantifying post logging biomass loss using satellite images and ground measurements in Southeast Cameroon. J. Res. 2016, 27, 1415–1426. [Google Scholar] [CrossRef]
  16. Galante, M.V.; Dutschke, M.; Patenaude, G.; Vickers, B. Climate Change Mitigation through Reduced-Impact Logging and the Hierarchy of Production Forest Management. Forests 2012, 3, 59–74. [Google Scholar] [CrossRef] [Green Version]
  17. Lamprecht, H. Silviculture in the Tropics. Tropical Forest Ecosystems and Their Tree Species, Possibilities and Methods for Their Long-Term Utilization; Deutsche Gesellschaft für Technische Zusammenarbeit GmbH: Eschborn, Germany, 1989; ISBN 388085422X. [Google Scholar]
  18. Hu, J.; Herbohn, J.; Chazdon, R.L.; Baynes, J.; Vancley, J. Silvicultural treatment effects on commercial timber volume and functional composition of a selectively logged Australian tropical forest over 48 years. For. Ecol. Manag. 2020, 457, 117690. [Google Scholar] [CrossRef]
  19. Wadsworth, F.H.; Zweede, J.C. Liberation: Acceptable production of tropical forest timber. For. Ecol. Manag. 2006, 233, 45–51. [Google Scholar] [CrossRef]
  20. Villegas, Z.; Peña-Claros, M.; Mostacedo, B.; Alarcón, A.; Licona, J.C.; Leaño, C.; Pariona, W.; Choque, U. Silvicultural treatments enhance growth rates of future crop trees in a tropical dry forest. For. Ecol. Manag. 2009, 258, 971–977. [Google Scholar] [CrossRef]
  21. Peña-Claros, M.; Fredericksen, T.S.; Alarcón, A.; Blate, G.M.; Choque, U.; Leaño, C.; Licona, J.C.; Mostacedo, B.; Pariona, W.; Villegas, Z.; et al. Beyond reduced-impact logging: Silvicultural treatments to increase growth rates of tropical trees. For. Ecol. Manag. 2008, 256, 1458–1467. [Google Scholar] [CrossRef]
  22. Verwer, C.; Peña-Claros, M.; van der Staak, D.; Ohlson-Kiehn, K.; Sterck, F.J. Silviculture enhances the recovery of overexploited mahogany Swietenia macrophylla. J. Appl. Ecol. 2008, 45, 1770–1779. [Google Scholar] [CrossRef]
  23. Abetz, P. Müssen wir in der waldbaulichen Behandlung der Fichte wieder umdenken? Eur. J. For. Res. 1990, 109, 79–85. [Google Scholar] [CrossRef]
  24. Abetz, P.; Klädtke, J. The Target Tree Management System. Die Z-Baum-Kontrollmethode. Forstw. Cbl. 2002, 121, 73–82. [Google Scholar] [CrossRef]
  25. Burschel, P.; Huss, J. Grundriss des Waldbaus. Ein Leitfaden für Studium und Praxis: 207 Tabellen, 3., unveränd. Aufl.; Ulmer: Stuttgart, Germany, 2003; ISBN 3800145707. [Google Scholar]
  26. Hein, S.; Lenk, E.; Klädtke, J.; Kohnle, U. Z-Baum orientierte Auslesedurchforstung in Buche [Fagus sylvatica L.]: Auswirkungen auf Qualität, Sortenstruktur und Wertleistung. Allg. Forst Und Jagdztg. 2007, 179, 8–20. [Google Scholar]
  27. Hein, S.; Herbstritt, S.; Kohnle, U. Auswirkung der Z-Baum-Auslesedurchforstung auf Wachstum, Sortenertrag und Wertleistung im europäischen Fichten-Stammzahlversuch (Picea abies [L.] Karst.) in Südwestdeutschland. Allg. Forst Und Jagdztg. 2007, 179, 192–201. [Google Scholar]
  28. Hein, S.; Herbstritt, S.; Kohnle, U. The European Stem Number Experiment in Norway Spruce (Picea abies [L.] Karst.): Effect of Crop Tree Thinning on Growth, Timber Assortment and Economic Results. Allg. Forst Und Jagdztg. 2008, 179, 192–201. [Google Scholar]
  29. Herbstritt, S.; Kohnle, U.; Abetz, P.; Kenk, G. The European Stem Number Experiment in Norway Spruce (Picea abies (L.) Karst.). 3. Report; Berichte Freiburger Forstliche Forschung No. 66; Forstliche Versuchs- und Forschungsanstalt Baden-Württemberg: Freiburg, Germany, 2006. [Google Scholar]
  30. Mäkinen, H.; Isomäki, A. Thinning intensity and growth of Norway spruce stands in Finland. Forestry 2004, 77, 349–364. [Google Scholar] [CrossRef] [Green Version]
  31. Graaf, N.R.; Poels, R.L.H.; Van Rompaey, R.S.A.R. Effect of silvicultural treatment on growth and mortality of rainforest in Surinam over long periods. For. Ecol. Manag. 1999, 124, 123–135. [Google Scholar] [CrossRef]
  32. David, H.C.; Carvalho, J.O.; Pires, I.P.; Santos, L.S.; Barbosa, E.S.; Braga, N.S. A 20-year tree liberation experiment in the Amazon: Highlights for diameter growth rates and species-specific management. For. Ecol. Manag. 2019, 453, 117584. [Google Scholar] [CrossRef]
  33. Kuusipalo, J.; Jafarsidik, Y.; Ådjers, G.; Tuomela, K. Population dynamics of tree seedlings in a mixed dipterocarp rainforest before and after logging and crown liberation. For. Ecol. Manag. 1996, 81, 85–94. [Google Scholar] [CrossRef]
  34. Kuusipalo, J.; Hadengganan, S.; Ådjers, G.; Sagala, A.S. Effect of gap liberation on the performance and growth of dipterocarp trees in a logged-over rainforest. For. Ecol. Manag. 1997, 92, 209–219. [Google Scholar] [CrossRef]
  35. Gräfe, S.; Eckelmann, C.-M.; Playfair, M.; Oatham, M.P.; Pacheco, R.; Bremner, Q.; Köhl, M. Future crop tree release treatments in neotropical forests—An empirical study on the sensitivity of the economic profitability. For. Policy Econ. 2020, 121, 102329. [Google Scholar] [CrossRef]
  36. Gräfe, S.; Eckelmann, C.-M.; Playfair, M.; Oatham, M.P.; Pacheco, R.; Bremner, Q.; Köhl, M. Recovery Times and Sustainability in Logged-Over Natural Forests in the Caribbean. Forests 2020, 11, 256. [Google Scholar] [CrossRef] [Green Version]
  37. Nurmohamed, R.; Naipal, S.; Becker, C. Rainfall variability in Suriname and its relationship with the tropical Pacific ENSO SST anomalies and the Atlantic SST anomalies. Int. J. Clim. 2007, 27, 249–256. [Google Scholar] [CrossRef]
  38. Giannini, A.; Kushnir, Y.; Cane, M.A. Interannual Variability of Caribbean Rainfall, ENSO, and the Atlantic Ocean*. J. Clim. 2000, 13, 297–311. [Google Scholar] [CrossRef]
  39. Harris, I.; Osborn, T.J.; Jones, P.; Lister, D. Version 4 of the CRU TS monthly high-resolution gridded multivariate climate dataset. Sci. Data 2020, 7, 109. [Google Scholar] [CrossRef] [Green Version]
  40. Food and Agriculture Organization of the United Nations. National Forest Monitoring and Assessment. Manual for Integrated Field Data Collection; National Forest Monitoring and Assessment Working Paper NFMA 37/E; 2008; Available online: http://www.fao.org/forestry/14727-072b68bcfa49334202f1586889517ce24.pdf (accessed on 24 April 2020).
  41. Nyland, R.D. Silviculture: Concepts and Applications, 3rd ed.; WAVELAND Press: Long Grove, IL, USA, 2016; ISBN 978-1478627142. [Google Scholar]
  42. Alder, D. An Assessment of Broadleaf Forest Resources and Sustainable Yield in Belize; Belize Forest Planning and Management Project Consultancy Report No. 11; 1993; Available online: https://mayaforestbelize.files.wordpress.com/2016/11/alder-forest-resources-1993.pdf. (accessed on 9 December 2016).
  43. GFC. Forest Sector Information Report–Annual Review 2016; Guyana Forestry Commission: Georgetown, Guyana, 2016. [Google Scholar]
  44. SBB. Production, Export and Import of Timber and Timber Products in 2012; Foundation for Forest Management and Production Control: Paramaribo, Suriname, 2013. [Google Scholar]
  45. SBB. Suriname Forestry Sector 2013; Foundation for Forest Management and Production Control: Paramaribo, Suriname, 2014. [Google Scholar]
  46. Ramnarine, S.; Jhilmit, S.; John, K. Manual for the Establishment and Management of Periodic Blocks in Trinidad; Ministry of Public Utilities and the Environment: Port of Spain, Trinidad and Tobago, 2002. [Google Scholar]
  47. Abetz, P. Eine Entscheidungshilfe für die Durchforstung von Fichtenbeständen. Allg. Forstz. 1975, 666–667. [Google Scholar]
  48. Friard, O.; Gamba, M. BORIS: A free, versatile open-source event-logging software for video/audio coding and live observations. Methods Ecol. Evol. 2016, 7, 1325–1330. [Google Scholar] [CrossRef]
  49. R Core Team. R: A Language and Environment for Statistical Computing; R Foundation for Statistical Computing: Vienna, Austria, 2019; Available online: https://www.R-project.org (accessed on 3 December 2019).
  50. Bates, D.; Mächler, M.; Bolker, B.; Walker, S. Fitting Linear Mixed-Effects Models Using lme4. J. Stat. Softw. 2015, 67. [Google Scholar] [CrossRef]
  51. Nelder, J.A.; Wedderburn, R.W.M. Generalized Linear Models. J. R. Stat. Soc. Ser. A 1972, 135, 370. [Google Scholar] [CrossRef]
  52. Alaimo, V.; Bosch, M.; Gualavisí, M.; Villa, J.M. Measuring the Cost of Salaried Labor in Latin America and the Caribbean; IDB Technical Note No. 1291; Inter-American Development Bank: Washington, DC, USA, 2017. [Google Scholar]
  53. Whiteman, A. A Roundwood Production Cost Model. For. Suriname: Model. Description and User Guide. Project GCP/SUR/001/NET. Forestry Advisory Assistance to the Ministry of Natural Resources in Suriname; Ministry of Natural Resources Suriname; Food and Agriculture Organization of the United Nations: Rome, Italy, 1999; Available online: http://www.fao.org/3/X6826E/X6826E00.htm (accessed on 21 February 2020).
  54. Whiteman, A. Economic Data and Information About the Forest Sector in Suriname. Project GCP/SUR/001/NET.Forestry Advisory Assistance to the Ministry of Natural Resources in Suriname; Ministry of Natural Resources Suriname; Food and Agriculture Organization of the United Nations: Rome, Italy, 1999. [Google Scholar]
  55. KWF; DLG; ENTAM. Prüfbericht Motorsäge STIHL MS 880; Kuratorium für Waldarbeit und Forsttechnik (KWF); Deutsche Landwirtschafts Gesellschaft (DLG); European Network for Testing of Agricultural Machines (ENTAM): Groß-Umstadt, Germany, 2009. [Google Scholar]
  56. Richardson Saw & Lawnmower. Available online: https://www.richardsonsaw.com (accessed on 21 February 2020).
  57. Chave, J.; Réjou-Méchain, M.; Búrquez, A.; Chidumayo, E.; Colgan, M.S.; Delitti, W.B.C.; Duque, A.; Eid, T.; Fearnside, P.M.; Goodman, R.C.; et al. Improved allometric models to estimate the aboveground biomass of tropical trees. Glob. Chang. Biol. 2014, 20, 3177–3190. [Google Scholar] [CrossRef]
  58. Réjou-Méchain, M.; Tanguy, A.; Piponiot, C.; Chave, J.; Hérault, B. Biomass: An r package for estimating above-ground biomass and its uncertainty in tropical forests. Methods Ecol. Evol. 2017, 8, 1163–1167. [Google Scholar] [CrossRef]
  59. Zanne, A.E.; Lopez-Gonzalez, G.; Coomes, D.A.; Ilic, J.; Jansen, S.; Lewis, S.L.; Miller, R.B.; Swenson, N.G.; Wiemann, M.C.; Chave, J. Data from: Towards a Worldwide Wood Economics Spectrum. 2009. Available online: https://datadryad.org/stash/dataset/doi:10.5061/dryad.234 (accessed on 27 April 2020).
  60. Herault, B.; Ouallet, J.; Blanc, L.; Wagner, F.; Baraloto, C. Growth responses of neotropical trees to logging gaps. J. Appl. Ecol. 2010, 47, 821–831. [Google Scholar] [CrossRef]
  61. Jonkers, W.B.J.; Tjon, K.; Wirjosentono, J. Long-term effects of logging in a Neotropical rain forest in Suriname. In International Expert Meeting on the Development and Implementation of National Codes of Practice for Forest Harvesting: Issues and Options; International Forestry Cooperation Office, Ed.: Tokyo, Japan, 2003; pp. 157–166. [Google Scholar]
  62. Lieberman, D.; Lieberman, M.; Hartshorn, G.; Peralta, R. Growth rates and age-size relationships of tropical wet forest trees in Costa Rica. J. Trop. Ecol. 1985, 1, 97–109. [Google Scholar] [CrossRef]
  63. Vieira, S.; de Camargo, P.B.; Selhorst, D.; da Silva, R.; Hutyra, L.; Chambers, J.Q.; Brown, I.F.; Higuchi, N.; dos Santos, J.; Wofsy, S.C.; et al. Forest structure and carbon dynamics in Amazonian tropical rain forests. Oecologia 2004, 140, 468–479. [Google Scholar] [CrossRef] [Green Version]
  64. Werger, M.J.A. Sustainable Management of Tropical Rainforests. The CELOS Management System; Tropenbos International: Paramaribo, Suriname, 2011. [Google Scholar]
  65. Ramstein, C.; Dominioni, G.; Ettehad, S.; Lam, L.; Quant, M.; Zhang, J.; Mark, L.; Nierop, S.; Berg, T.; Leuschner, P.; et al. State and Trends of Carbon Pricing 2019; The World Bank: Washington, DC, USA, 2019; ISBN 978-1-4648-1435-8. [Google Scholar]
  66. Arnold, T. How Net Present Value Is Implemented. In A Pragmatic Guide to Real Options; Arnold, T., Ed.; Palgrave Macmillan: New York, NY, USA, 2014; pp. 1–13. ISBN 978-1-137-39116-2. [Google Scholar]
  67. Remer, D.S.; Nieto, A.P. A compendium and comparison of 25 project evaluation techniques. Part 1: Net present value and rate of return methods. Int. J. Prod. Econ. 1995, 42, 79–96. [Google Scholar] [CrossRef]
  68. Karsenty, A. Economic Instruments for Tropical Forests. The Congo Basin Case; International Institute for Environment and Development: London, UK, 2000; ISBN 2876143763. [Google Scholar]
  69. Cubbage, F.; Davis, R.; Frey, G.; Behr, D.C.; Sills, E. Financial and Economic Evaluation Guidelines for International Forestry Projects. In Tropical Forestry Handbook; Pancel, L., Köhl, M., Eds.; Springer: Berlin/Heidelberg, Germany, 2014; pp. 1–17. ISBN 978-3-642-41554-8. [Google Scholar]
  70. Clark, D.A.; Brown, S.; Kicklighter, D.W.; Chambers, J.Q.; Thomlinson, J.R.; Ni, J.; Holland, E.A. Net primary production in tropical forests: An evaluation and synthesis of existing field data. Ecol. Appl. 2001, 11, 371–384. [Google Scholar] [CrossRef]
  71. Salas Macías, C.A.; Alegre Orihuela, J.C.; Iglesias Abad, S. Estimation of above--ground live biomass and carbon stocks in different plant formations and in the soil of dry forests of the Ecuadorian coast. Food Energy Secur. 2017, 6. [Google Scholar] [CrossRef]
  72. Malhi, Y.; Baker, T.R.; Phillips, O.L.; Almeida, S.; Alvarez, E.; Arroyo, L.; Chave, J.; Czimczik, C.I.; Di Fiore, A.; Higuchi, N.; et al. The above-ground coarse wood productivity of 104 Neotropical forest plots. Glob. Chang. Biol. 2004, 10, 563–591. [Google Scholar] [CrossRef] [Green Version]
  73. Eggleston, S. IPCC Guidelines for National Greenhouse Gas Inventories; Institute for Global Environmental Strategies (IGES): Hayama, Japan, 2006; ISBN 4-88788-032-4. [Google Scholar]
  74. Rutishauser, E.; Hérault, B.; Baraloto, C.; Blanc, L.; Descroix, L.; Sotta, E.D.; Ferreira, J.; Kanashiro, M.; Mazzei, L.; d’Oliveira, M.V.N.; et al. Rapid tree carbon stock recovery in managed Amazonian forests. Curr. Biol. 2015, 25, R787–R788. [Google Scholar] [CrossRef] [Green Version]
  75. Keller, M.; Asner, G.P.; Blate, G.; McGlocklin, J.; Merry, F.; Peña-Claros, M.; Zweede, J. Timber production in selectively logged tropical forests in South America. Front. Ecol. Environ. 2007, 5, 213–216. [Google Scholar] [CrossRef] [Green Version]
  76. Zimmerman, B.L.; Kormos, C.F. Prospects for Sustainable Logging in Tropical Forests. BioScience 2012, 62, 479–487. [Google Scholar] [CrossRef] [Green Version]
  77. Piponiot, C.; Sist, P.; Mazzei, L.; Peña-Claros, M.; Putz, F.E.; Rutishauser, E.; Shenkin, A.; Ascarrunz, N.; de Azevedo, C.P.; Baraloto, C.; et al. Carbon recovery dynamics following disturbance by selective logging in Amazonian forests. Elife 2016, 5. [Google Scholar] [CrossRef] [PubMed]
  78. Köhl, M.; Neupane, P.R.; Lotfiomran, N.; Delzon, S. The impact of tree age on biomass growth and carbon accumulation capacity: A retrospective analysis using tree ring data of three tropical tree species grown in natural forests of Suriname. PLoS ONE 2017, 12, e0181187. [Google Scholar] [CrossRef]
  79. Newbery, D.M.; Ridsdale, C.E. Neighbourhood abundance and small--tree survival in a lowland Bornean rainforest. Ecol. Res. 2016, 31, 353–366. [Google Scholar] [CrossRef]
  80. UNFCC. Report of the Conference of the Parties on its 16th session, held in Cancun, 29 November–10 December 2010. Addendum. Part two: Action taken by the Conference of the Parties at its sixteenth session. FCCC/CP/2010/7/Add.1; UNFCC: Bonn, Germany, 2011; Available online: https://unfccc.int/documents/6527 (accessed on 29 September 2020).
Figure 1. Project countries (green) and study sites (magenta).
Land 09 00394 g001
Figure 2. Above ground biomass (AGB) growth simulation by country of released and non-released FCTs.
Land 09 00394 g002
Figure 3. Required additional above ground biomass growth per tree (response–surface) after 130 years (recovery time). RAGagb = required additional AGB growth per FCT, treatment costs Ctr = treatment costs per FCT, carbon price Pc = carbon price per Mg CO2e−1.
Land 09 00394 g003
Table 1. Characteristics of future crop trees (FCTs) ([35], modified).
CriteriaDescription
SpeciesThe species of FCTs should achieve a high commercial value in the relevant timber markets. All project countries applied a species classification system (see above). FCTs should have been listed within either the highest or higher value species class since they are the future value drivers of the stand.
Crown classFuture crop trees must be able to compete successfully after the release. So they were selected from trees whose canopies are already located in the dominant, co-dominant or strong intermediate crown class.
Log gradeFCTs should have log grades requiring straight logs free of defects or visible diseases (log grade 1).
VitalityFCTs should be of good health and vitality without low forks.
AgeTrees could qualify as FCTs at any age as long as they are expected to survive long enough to reach the next cutting cycle.
DistributionFCTs should not all be concentrated in the “good quality” area of the forest stand. FCTs should have been evenly distributed across the forest stand but their relative quality may differ, e.g., the “good quality” area of the stand may have FCTs with 10 m log length while the “poorer quality” area may have FCTs with 5 m log length.
QuantityThere was no defined number of trees to be identified as FCTs.
Table 2. Work elements for a time study during the FCT release ([35], modified).
No.Work ElementDefinitionCategory
1Searchingsearching and identification of the target tree, including walking to the next treeProduction
2Preparationfelling preparation, e.g., liana cutting, clean up, determination of felling direction and rescue ways
3Fellingtree felling starts from the chainsaw engine start until the tree lies on the ground
4Maintenancemaintenance of the chainsaw, e.g., sharpen the chain, refuel
5Breakresting breakNo production
6Otherother activities which do not fit into the work elements 1–6
Table 3. Machinery data ([35], modified).
Chainsaw typeStihl MS 880 + 90cm Bar
Purchase cost (Cp)US$ 1900
Fuel consumption (Kgas)4 L hr−1 (3.7–4.3 L hr−1)
Oil/grease consumption (Koil)0.99 L hr−1 (0.36–1.62 L hr−1)
Effective machine hours per year (Temh)241
Expected life time (Tel)5 y
Table 4. Estimates of the above ground biomass (AGB) and number of trees (N) during the application of selective logging and release of future crop trees (FCTs), in four study cases.
AGB (Mg ha−1)N (Trees ha−1)
MeanSE95% CIMeanSE95% CI
LowerUpper LowerUpper
Selective logging
Belize15.13.416.823.55.20.73.56.9
Guyana7.53.41015.83.70.725.4
Suriname35.44.1525.245.67.60.85.59.6
Trinidad26.34.1516.136.54.30.82.26.3
FCTs
Belize2.80.80.74.92.60.80.64.6
Guyana0.30.802.40.40.802.4
Suriname3.911.36.43.210.75.6
Trinidad4.812.27.33.4115.8
Competitors
Belize4.21.60.38.14.11.317.2
Guyana0.91.604.80.51.303.6
Suriname10.325.515.24.81.60.98.6
Trinidad6.621.811.44.31.60.48.1
Residual trees
Belize97.823.64015682.212.352.2112
Guyana151.523.693.7209106.812.376.7137
Suriname18128.9110.2252105.51568.8142
Trinidad176.328.9105.5247871550.3124
Total stand
Belize12431.846.720297.514.661.9133
Guyana16331.885.1241115.214.679.5151
Suriname23538.9140.2331124.817.881.1169
Trinidad23738.9141.7332117.917.974.2162
SE = standard error; CI = confidence interval
Publisher’s Note: MDPI stays neutral with regard to jurisdictional claims in published maps and institutional affiliations.

