Article

Effects of Agroforestry and Other Sustainable Practices in the Kenya Agricultural Carbon Project (KACP)

1
Department of Crop Production Ecology, Swedish University of Agricultural Sciences (SLU), P.O. Box 7043, SE-75007 Uppsala, Sweden
2
Vi Agroforestry, P.O. Box 2006, Kitale 30200, Kenya
3
Department of Ecology, SLU, P.O. Box 7044, SE-75007 Uppsala, Sweden
4
Department of Soil and Environment, SLU, P.O. Box 234, SE-53223 Skara, Sweden
5
World Agroforestry (ICRAF), UN Avenue, P.O. Box 30677-00100 Nairobi, Kenya
*
Author to whom correspondence should be addressed.
Land 2020, 9(10), 389; https://doi.org/10.3390/land9100389
Submission received: 22 September 2020 / Revised: 9 October 2020 / Accepted: 9 October 2020 / Published: 13 October 2020
(This article belongs to the Special Issue Agroforestry-Based Ecosystem Services)

Abstract

:
With growing global demand for food, unsustainable farming practices and large greenhouse gas emissions, farming systems need to sequester more carbon than they emit, while also increasing productivity and food production. The Kenya Agricultural Carbon Project (KACP) recruited farmer groups committed to more Sustainable Agricultural Land Management (SALM) practices and provided these groups with initial advisory services on SALM, farm enterprise development and village savings and loan associations. Recommended SALM practices included agroforestry, cover crops, mulching, composting manure, terracing, reduced tillage and water harvesting. The effects of the KACP on the uptake of SALM practices, maize yield, perceived food self-sufficiency and savings during the initial four years were assessed comparing control and project farmers using interviews, field visits and measurements. Farmers participating in the KACP seemed to have increased uptake of most SALM practices and decreased the use of practices to be avoided under the KACP recommendations. Agroforestry and terraces showed positive effects on maize yield. During all four years, the KACP farms had higher maize yield than control farms, but yield differences were similar in 2009 and 2012 and there was no overall significant effect of the KACP. In 2012, the KACP farms had higher food self-sufficiency and tended to have higher monetary savings than control farms.

1. Introduction

Managing the trade-off between short-term provision of human needs in terms of water, food, shelter and fibre for a growing population and maintaining the capacity of the planet to provide these services in the future is a growing global challenge [1,2,3]. World agriculture is currently both contributing to global environmental change [3,4] and being severely affected by it [5]. It is, therefore, necessary and urgent to transform farming systems from primarily focusing on productivity to instead having social, economic and environmental sustainability at the core of their development [6]. Most food production world-wide is currently unsustainable and needs modification [7,8,9,10]. For example, nutrients need to be recycled, external inputs reduced and farming systems diversified [7,10,11,12]. Simultaneously, anthropogenic CO2 emissions are changing the global climate and will continue to do so throughout the 21st century [13]. Crop production and carbon sequestration are ecosystem services with great potential for generating synergies in agricultural landscapes worldwide. Crop production can maintain higher levels of soil carbon through, for example, more perennial crops or returning more crop residues and organic material to fields, and this higher soil carbon level can increase yield [14,15].
The increasing concentration of atmospheric CO2 is largely attributable to emissions from fossil fuel combustion or land-use change, in the latter case mainly through soil organic carbon (SOC) depletion [13]. Conversion of natural land to agriculture and subsequent soil degradation from, for example, erosion have resulted in average losses of 50–70% of the original SOC pool in agricultural soils [16]. In some areas, this has led to declining yield. There is thus a need for sustainable intensification, where production can increase while the environmental footprint of agriculture decreases [17,18]. This is particularly relevant in developing countries, where most emissions are land-based and where carbon sources can be turned directly into sinks [19]. Sub-Saharan Africa is an area with considerable opportunities for sustainable intensification [17]. Kenya, as a fast-developing country in East Africa, has the potential to take the lead in reaching the Paris Agreement goals on climate change mitigation [20]. In Kenya, 70% of the rural population relies on agriculture for their employment and more than a quarter of the gross domestic product is derived from agriculture [21]. The Kenyan National Climate Change Action Plan 2018–2022 sets goals for agriculture where the main mitigation actions proposed for climate change are limited burning in croplands and more use of conservation tillage and agroforestry [21]. Kenya has the goal of converting 281,000 ha of existing arable and grazing land into agroforestry by 2030 as a climate change mitigation action, and of making climate change-related information and advice an integral part of the Kenyan agricultural advice system [22]. Kenyan smallholders are aware of agroforestry and other sustainable management practices [23] that could increase the soil carbon pool [15,24] and help increase production and income [22,25,26,27,28]. The Clean Development Mechanism, which allows countries with carbon emission reduction commitments to implement these reductions in developing countries, can create incentives for smallholders in developing countries to sell carbon sequestered in, for example, agroforestry systems to industrialised countries [29]. Similar incentives can be created within developing countries, through the nationally determined contributions [30]. Engel and Muller [31] identified climate-smart agriculture (e.g., agroforestry) as the most promising practice to be promoted by Payments for Ecosystem Services (PES) among smallholders with limited income. However, the use of carbon finance to incentivise this type of bio-carbon storage is still very low, due to the absence of institutional frameworks, reliable sources of carbon finance and involvement of public and private sector actors [19,32,33]. The number of smallholders needed to achieve an area of land large enough to compensate for project transaction costs also makes carbon finance projects practically unattainable at the current market price for carbon [34,35]. Low carbon prices mean that the incentive for farmers is not the carbon payment, but the benefits arising from emission-reducing farm management. Mbow et al. [36] question whether smallholder farmers can benefit from carbon payments at all and how advisory services can succeed in effectively promoting climate-smart agriculture. More research is needed to identify suitable types of climate-smart agrosystems for different user groups and their results and impacts [36].
The Kenya Agricultural Carbon Project (KACP), a soil and tree carbon project implemented by the non-government organisation (NGO) Vi Agroforestry within the Lake Victoria basin, is targeting small-holder farmers (with <2.5 ha). A majority of the farmers are aiming to be self-subsistent from their farming, largely depending on maize, beans and dairy production, while some are combining the agriculture with off-farm employment or casual jobs. The aim of the KACP is carbon sequestration through the uptake of Sustainable Agricultural Land Management (SALM) practices, enabling smallholder farmers to access the carbon market, as well as increasing yield and productivity and enhancing resilience to climate variability and change [37]. SALM practices include, for example, cover crops and agroforestry to increase biomass production, use of biomass for mulching and composting instead of burning, and avoiding soil erosion through, for example, terracing, reduced tillage and water harvesting [38] (Table A1). The project provided a dedicated advisory package to promote the use of SALM practices. It also included training in farm enterprise development and village savings and loan associations (VSLA), a microfinance intervention for the accumulation of regular savings within a group and rotating credit opportunities, following definitions by, for example, Bouman [39]. The VSLA system is based on trust among people who know each other and is run by the people themselves in one-year cycles with no outside support except for the initial training. A number of studies have reported on the KACP as a novel type of intervention [40,41,42,43,44,45,46]. However, no previous study has examined the effects of different SALM practices on maize yield or the actual maize yield response on farms taking part in the project.
The overall aim of this study was to assess the effects of the KACP on farm productivity and livelihoods during the initial four years (2009–2012) using the uptake of SALM practices, maize yield, food self-sufficiency and savings as indicators. Specific objectives were to (i) assess the level and type of SALM implementation among farmers participating in the KACP over time and compare it with that of neighbouring non-participating farms (control farms); (ii) determine the relationship between SALM practices and maize productivity, and compare the productivity over time and between the KACP farms and control farms; and (iii) quantify the level of food self-sufficiency and savings of the KACP farmers and control farmers. Mechanisms for the spread of knowledge and practices between neighbouring farmers were also discussed.

2. Materials and Methods

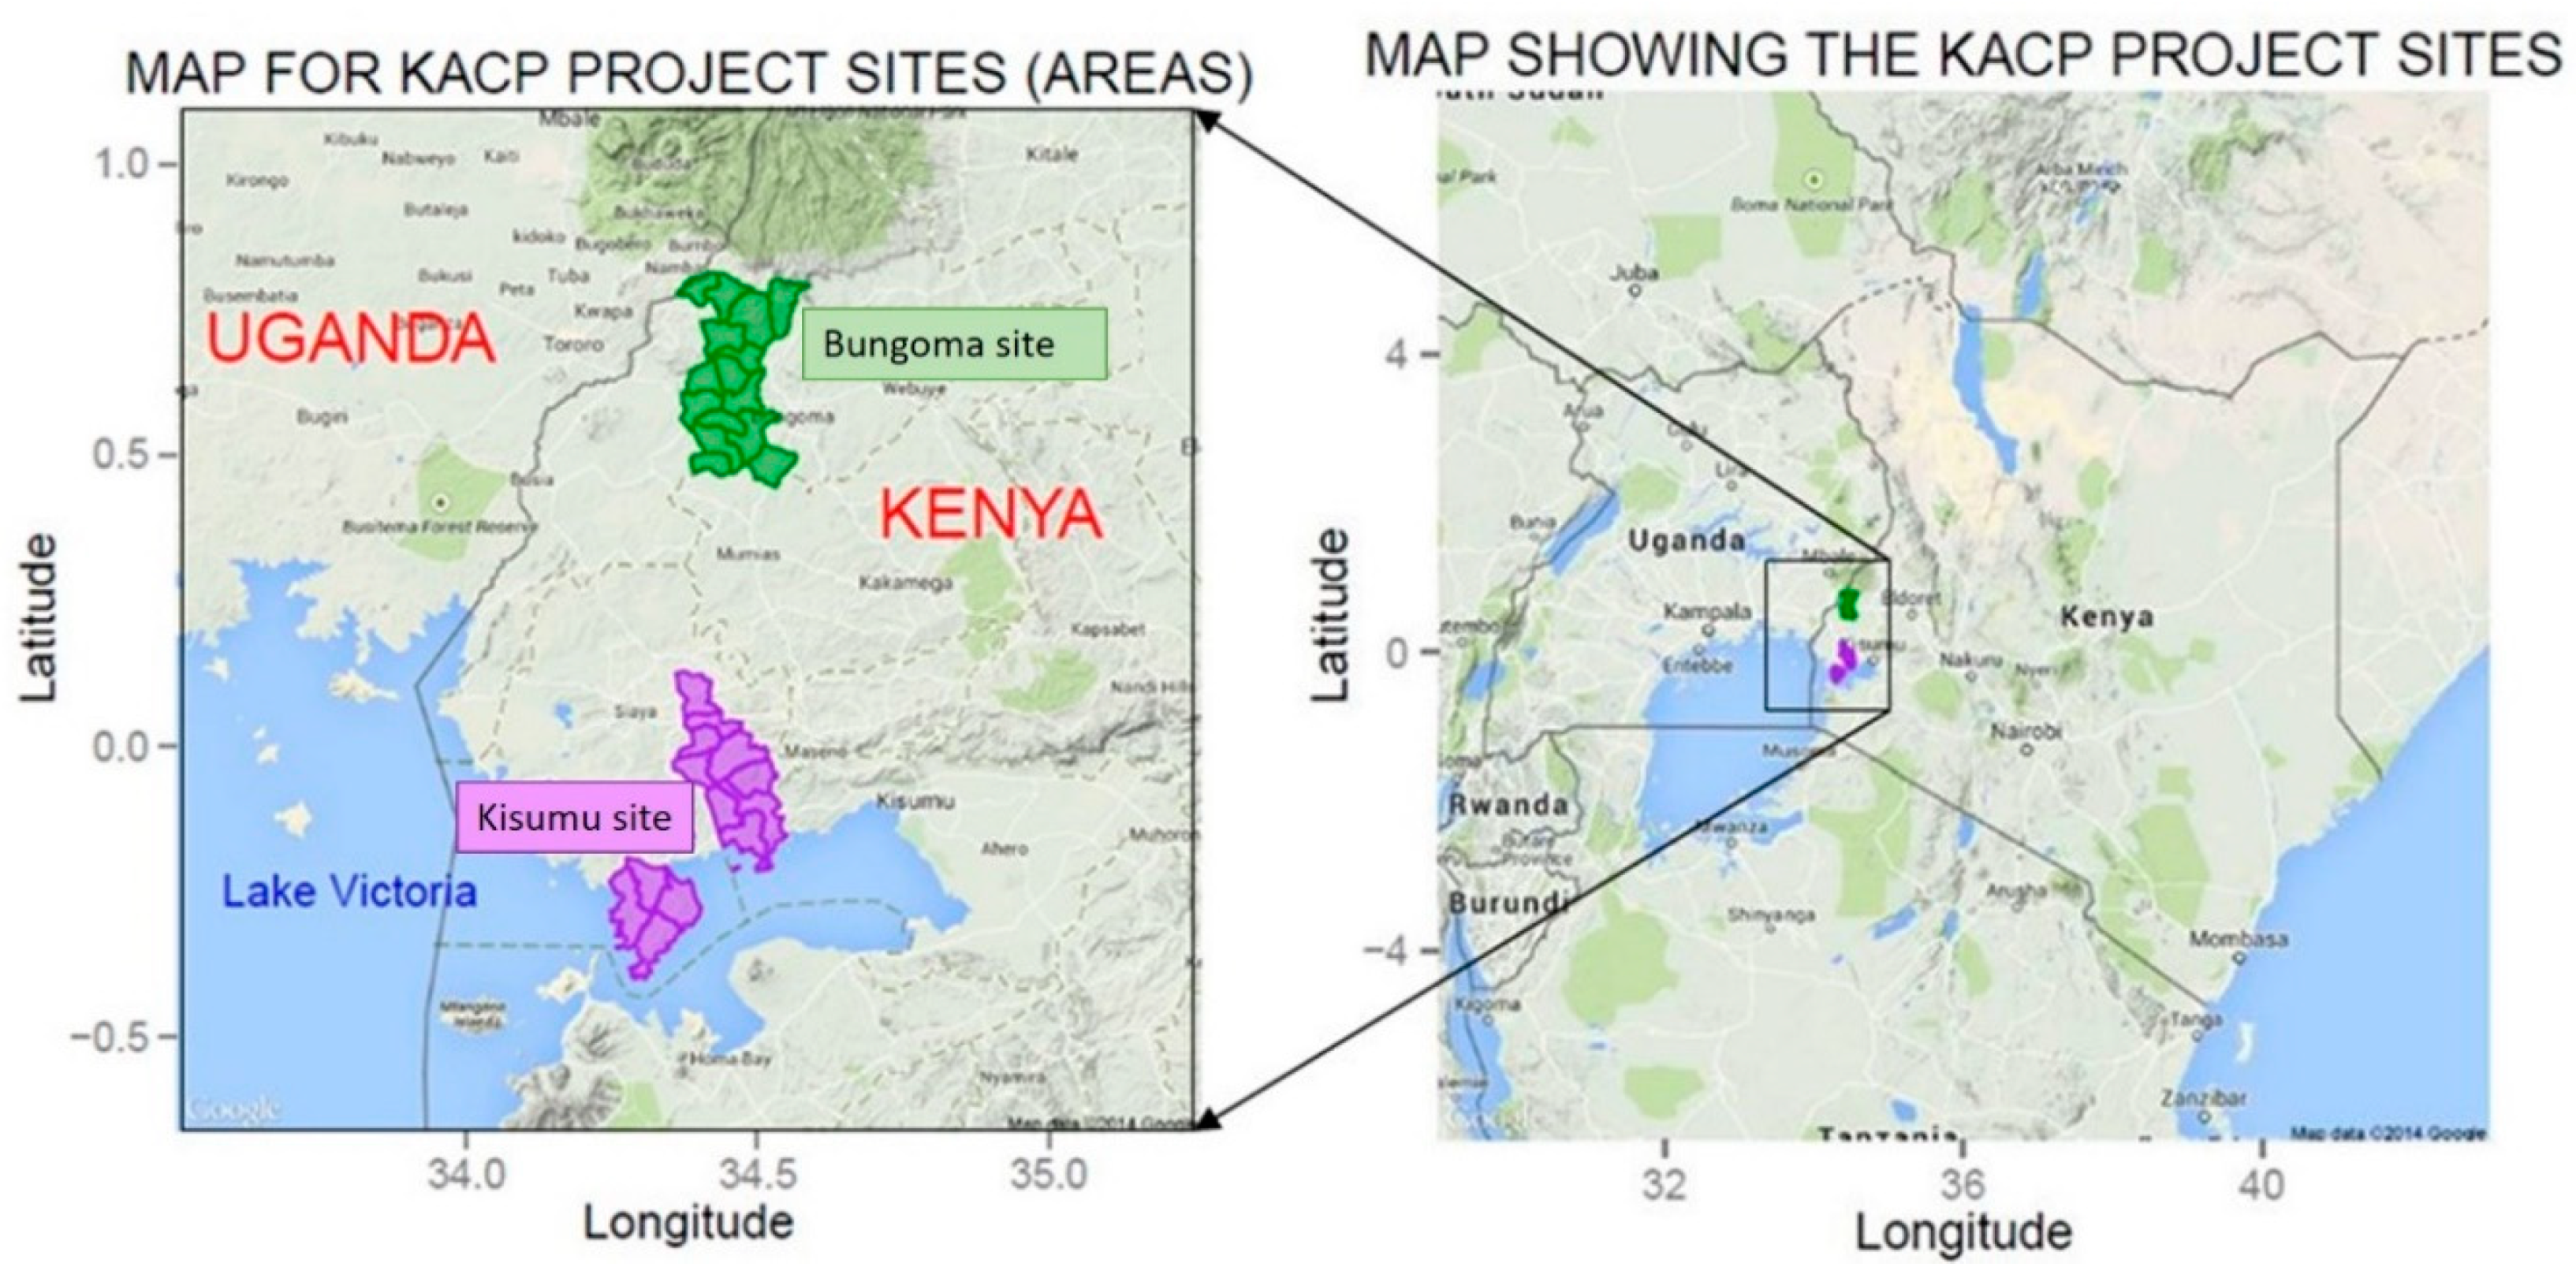
2.1. Characterisation of the Study Areas and Background to the KACP

The Kenya Agricultural Carbon Project started in 2009 and was implemented in two areas of Kenya, both with around 22,500 ha of potential project area (Figure 1). These were Kisumu (southern part including Kisumu and Siaya counties) and Bungoma (northern part including Bungoma county), with 28 administrative locations (Table A2). The region has a bimodal rainfall pattern with two cropping seasons, normally March–July and August–December (Figure A1). The KACP methodology was developed together with the BioCarbon Fund of the World Bank [37]. In the KACP, smallholder farmers receive carbon credits for soil carbon, which makes it unique since most other community and smallholder carbon projects only support carbon sequestration through tree planting [46]. However, the participating farmers were not given any financial support from the KACP during the study period (2009–2012) and the benefits of using SALM practices were instead emphasised, while the carbon revenue was small and presented to farmers as a co-benefit. Carbon credits were generated and claimed using the approved Verified Carbon Standard methodology, based on background data on soils and climate together with data on the management practices used by the farmers, instead of analysing carbon content in soil samples [47,48]. Carbon revenues were post-paid to farmers in 2014 for the years 2010–2014. Validation and verification were conducted periodically by external teams on emission reductions reported within the KACP [47].
From 2009 to 2012, the advisory system had a fixed number of 28 Vi Agroforestry field advisors, with one advisor in every administrative location, covering approximately 70 km2. These field advisors offered advisory services to farmers and facilitated monitoring. They identified registered farmer groups or facilitated group formation, and recruited, informed, trained and contracted smallholder farmers to implement a free choice of SALM practices on their farms. Regular interaction and monitoring of project activities by advisors proved important to avoid misunderstandings and identify risks and challenges in agricultural production as early as possible. No new farmer groups were recruited after 2013, so the number of advisors was reduced to four by 2017, to maintain the information flow. The monitoring data were consolidated in maps and tables at the farmer group level for internal monitoring by farmers. They were also collated at the end of each cropping season and entered in databases and ArcGIS for monitoring and evaluation by Vi Agroforestry.

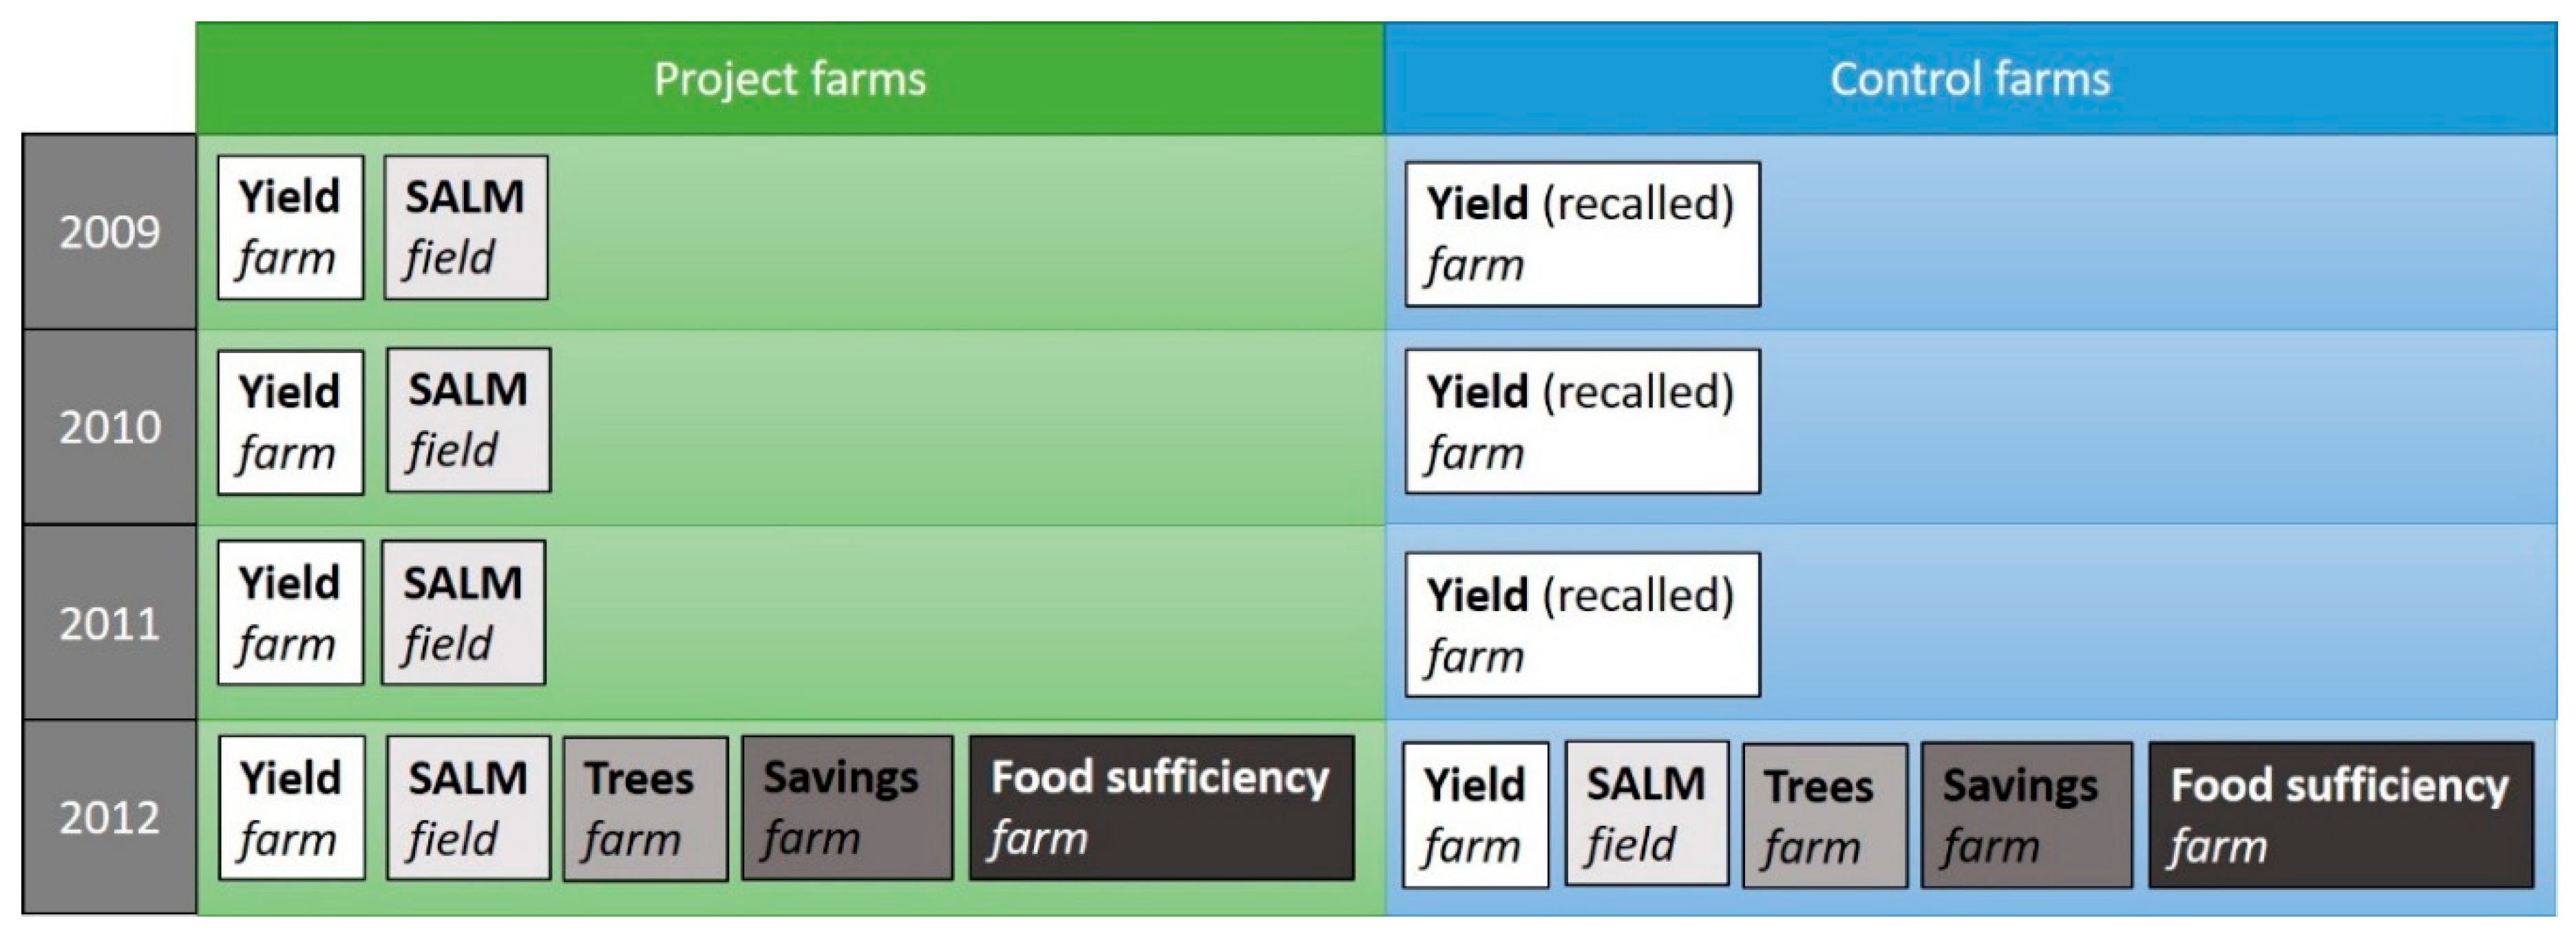
2.2. Farm Sampling and Data Collection

The project started with 660 farmer groups involving 10,873 voluntary farmers [49]. By the end of 2012, the KACP had recruited 1555 verified farmer groups with 26,535 farmers, who implemented SALM on 16,490 ha of eligible cropland or grazing land. Among the initial 10,873 project farms, 200 were selected and monitored more closely by the KACP field advisors, in permanent farm monitoring (PFM). To select the 200 PFM farms (100 in each of the project areas), the areas were stratified into agro-ecological zones (AEZ) and the number of farms in each zone was decided in relation to the zone size. A systematic grid of 1.5 × 1.5 km2 for unaligned systematic sampling was applied and the area was divided into clusters formed by the areas between four intersection points of the grid. PFM farms were randomly selected within the clusters according to the agro-ecological stratification [48].
In this study, the PFM (hereafter called “project”) data collected by Vi Agroforestry between 2009 and 2012 were used to determine the uptake rate and correlations of SALM practices to maize yield (Figure 2). In addition, in 2012 a set of 160 control farms (80 in each project area) was selected from the 28 locations of the KACP for the purposes of the present study. When selecting control farms, the project farms were used as reference points and the second farm to the north of the project farm was selected if the owners consented. If that farmer belonged to any group that had worked with Vi Agroforestry, it was skipped and the next farm to the north was asked instead, and so on. Thus, only farms that had not previously worked with Vi Agroforestry were selected as control farms. Data collected from all 360 farms (200 project and 160 control farms) included field size, yield and SALM methods used for all maize fields on the farms during two seasons and four years (2009–2012). However, for the control farms, SALM data were only collected for 2012 and maize yield data for 2009–2011 were obtained retrospectively through farmer recall interviews in 2012 (Figure 2). Data on species, numbers and sizes of farm trees were collected, and months of food self-sufficiency and amount and frequency of savings were ranked by the farmers themselves for 2012 only. All parameters were compared between project and control farms except the effects of individual SALM practices on maize yield, which was done across all farms. The project farmers were monitored for two more years (2013–2014) after this study and the project was then converted to a solely self-monitoring system by all farmers.

2.3. Data Analysis

All statistical analyses were conducted in R 3.4.2 [50]. Correlations between SALM practices and yield were analysed on the field level and for all available years (2009–2012 for project farms, 2012 for control farms). The effects of each SALM practice on maize yield were examined at the field level. For all nine management practices, a linear mixed effect model (the lme function in the nlme package in R) was created, with maize yield as the response variable, usage (or not) of the nine practices, area, year and season as fixed factors, and farm and pair of farms as random factors. The model included recommended SALM practices, such as (1) no tillage, (2) crop residues for direct mulch, (3) raw manure composting, (4) cover crops, (5) terracing and (6) water harvesting structures, and practices to be avoided due to higher carbon emissions, such as (7) removal of crop residues from fields, (8) applying raw manure to fields and (9) burning of residues. Interactions between different practices were not considered, due to large variations in the degree of implementation of each practice. A model simplification procedure was then used to compare and select the model that best explained the variation in the data. The model comparison was carried out using a step-wise Akaike information criterion (AIC) (allowing both forward and backward comparisons). The best-fit model was run using the lmer function in the lme4 package in R to identify potential significant effects of SALM practices.
The effects of agroforestry SALM practices, represented by the number and function/s of farm trees, on maize yield were analysed in a similar way as described above for the SALM practices. The only difference was that the maize yield data used were farm averages from 2012 for each of the two rainy seasons and study areas. For trees, the fixed factors included were area, season and the total number of trees, fodder trees, timber trees and fruit trees. Farm was included as a random factor.
For comparisons of mean seasonal maize yield per farm over time, a linear mixed effect model (lmer function in lme4 package) was used, with four fixed factors (treatment, area, year, season), which were tested as direct effects and with all two-way interactions included in the model. Only project and control farms forming pairs were included in that analysis, which resulted in 78 pairs of farms in Kisumu and 79 in Bungoma. Both individual farms and pairs of farms (project and control) were set as random factors in the model. The paired farms were analysed for four years (2009–2012), and two seasons per year. Contrasts were used to compare the differences in 2009 and 2012 between project and control farms.
The data on food self-sufficiency were categorised into four levels: <6 months food self-sufficiency, 6–7 months, 8–9 months and 10–12 months. A Chi-2 test was used to identify dependencies between food self-sufficiency and KACP participation. The significance level for all analyses was set to p < 0.05.

3. Results

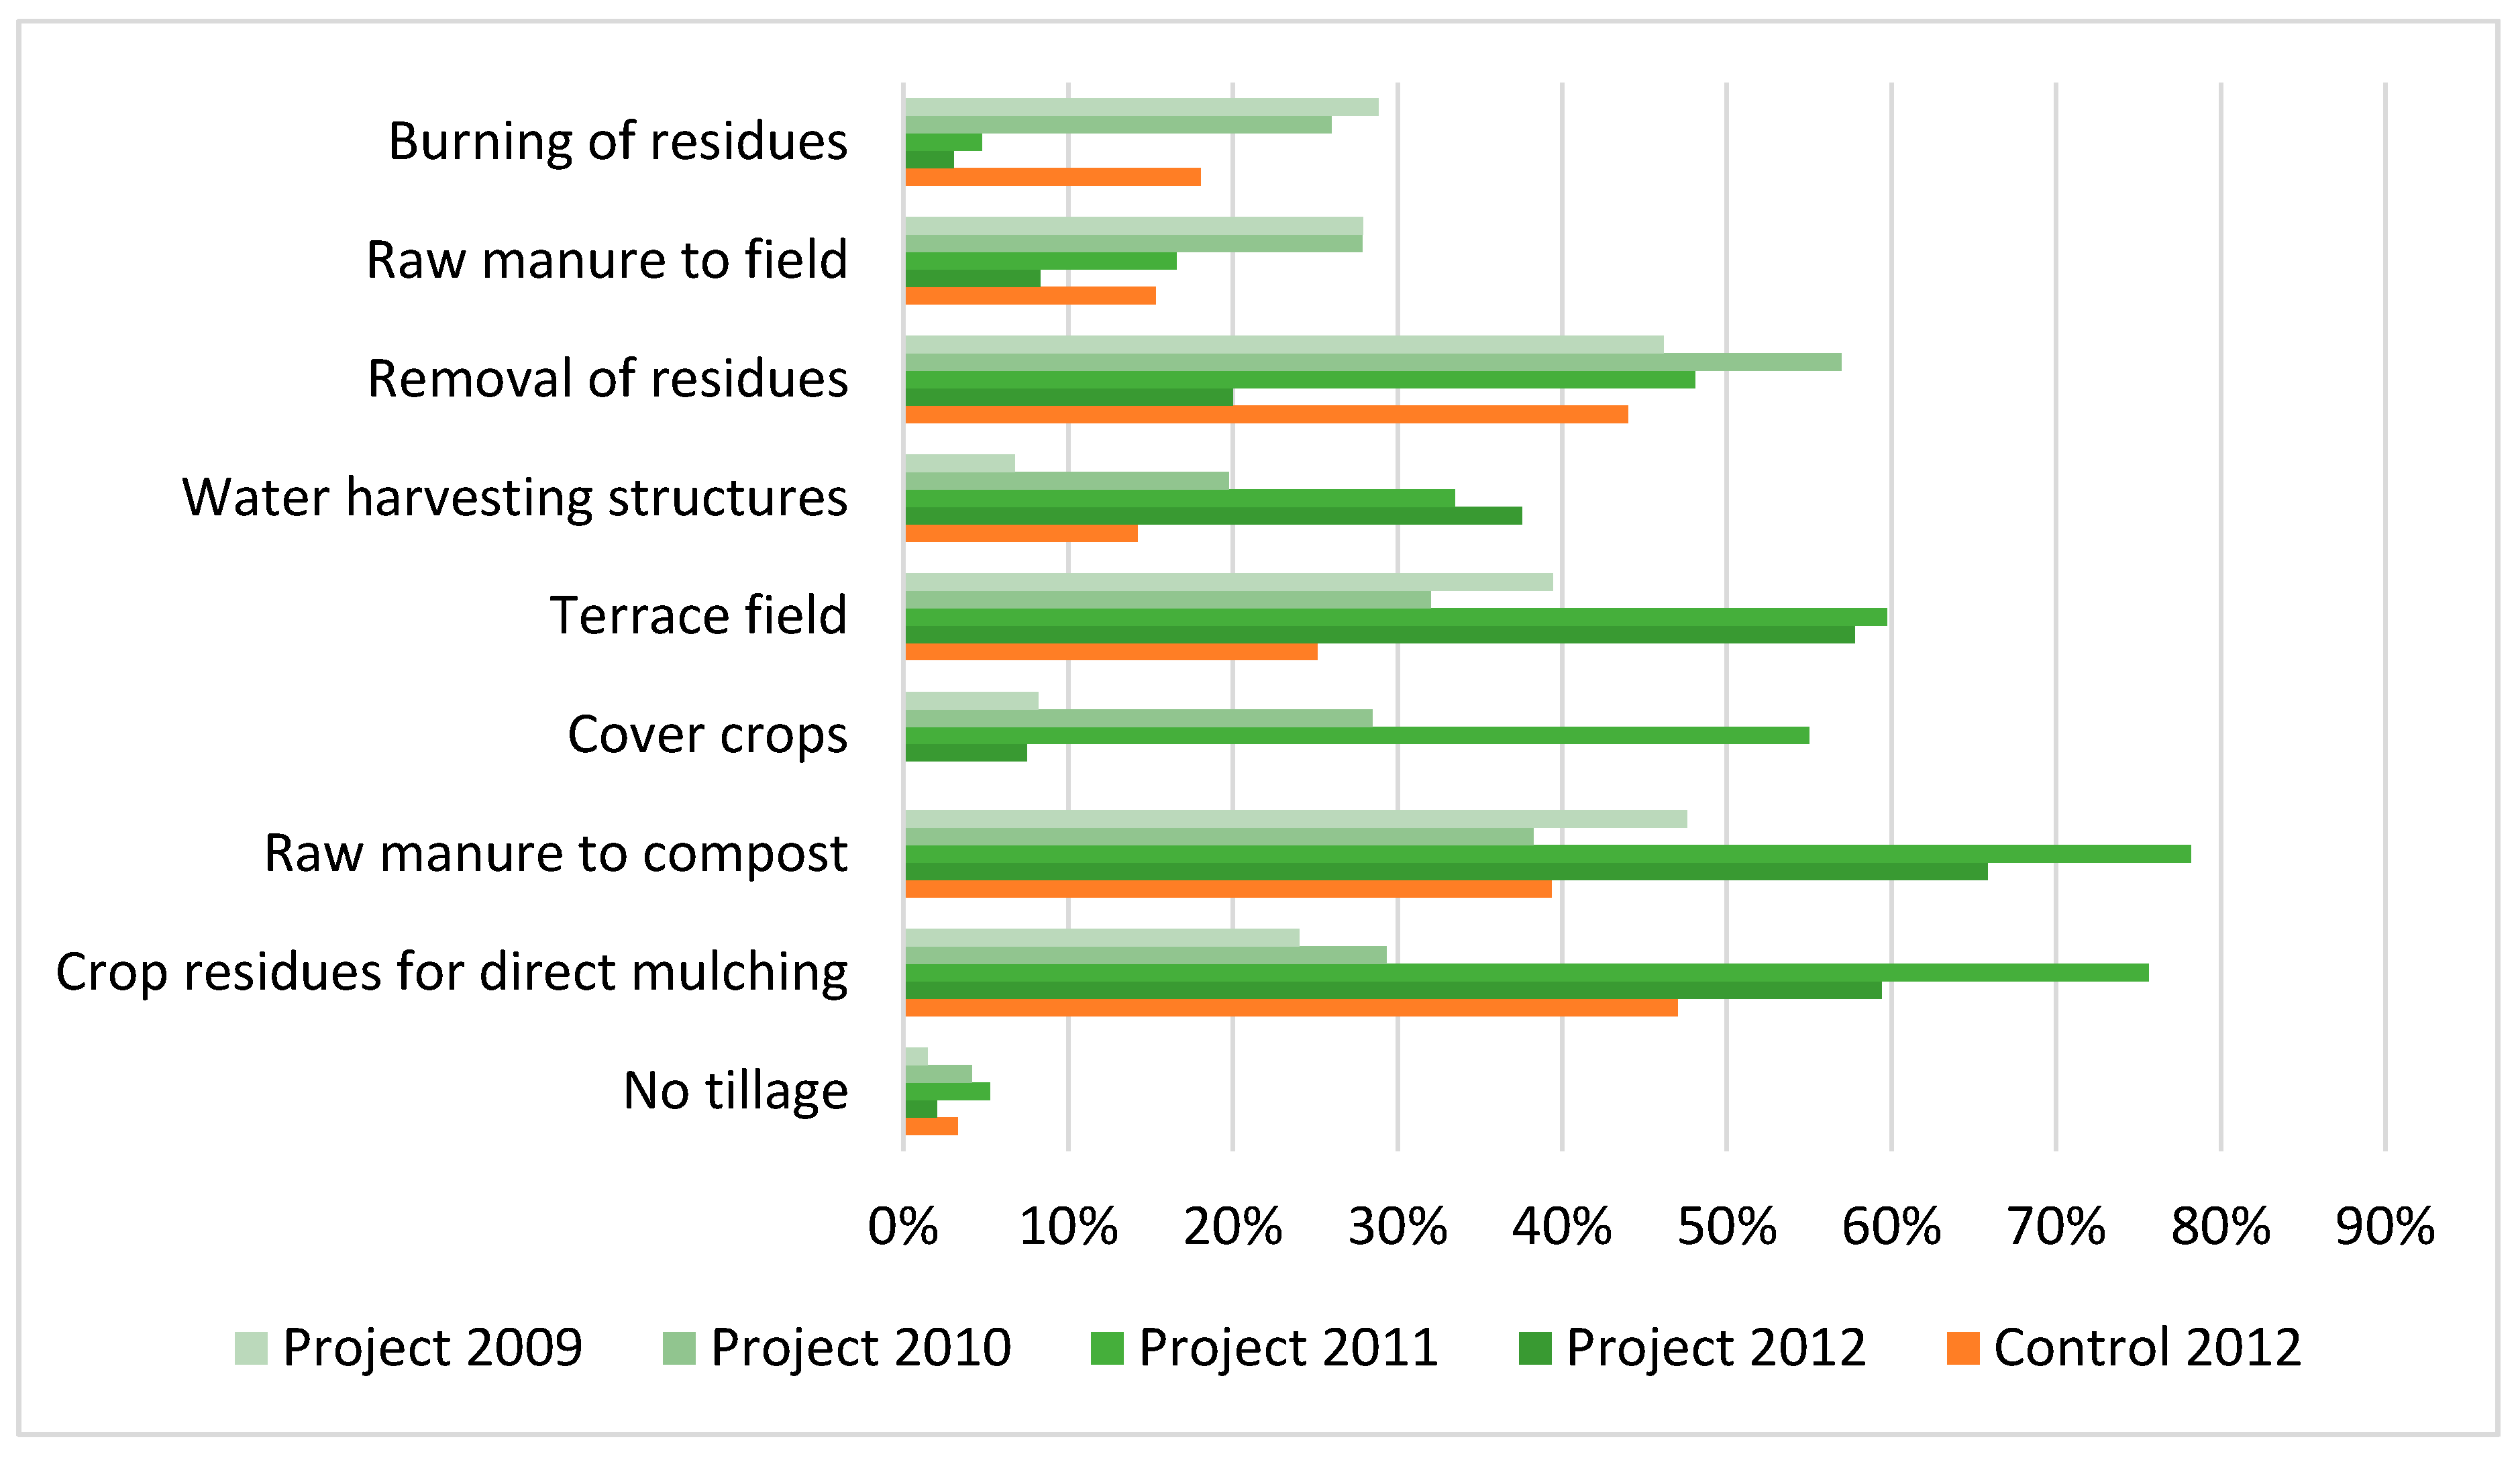
3.1. Uptake of SALM and Other Practices

Uptake of SALM was studied for all four years for project farms, but only for 2012 for control farms (Figure 2). Project farmers responded well to the advisory services within the KACP and started to implement several of the SALM practices (Figure 3). In 2012, about 60% of the fields were under mulch and terracing, compared with 25% and 40%, respectively, in 2009. Water harvesting increased from around 10% in 2009 to 40% in 2012 and composting of raw manure increased from 50% to 65% (Figure 3). The three most popular SALM practices among project farmers were using crop residues as mulch, composting raw manure before application and terracing fields (Figure 3).
Some measures never became commonly used, such as no tillage and cover crops. Cover crops increased from 10% in 2009 to 55% in 2011 but decreased again to 10% in 2012. Information on the use of SALM practices on control farms was only available for 2012, at which time crop residues were used for direct mulching on around 50% of control farmers’ fields, compared with 25% on project fields in 2009 and 60% in 2012. Raw manure composting was also quite common on control farms, while terracing, use of cover crops and creation of water harvesting structures were rare. The measures to be avoided according to the KACP recommendations were reduced on project farms. Removal of residues decreased from 50% to 20%, raw manure application from 30% to 10% and burning of residues from 30% to close to zero. On the control farms, removing residues from fields and burning of residues were still used to a relatively high degree. In general, by 2012, the project farms had on average more of the promoted practices and fewer practices to be avoided according to the KACP recommendations compared with both the start of the project in 2009 and with the control farms.
Tree planting, especially agroforestry, was another promoted practice taken up by farmers. The majority of trees (counted only in 2012) on the farms were young and planted within the project period. On average, farms in Bungoma had a higher number of trees (98 for project farms, 57 for control farms) than farms in Kisumu (74 for project farms, 40 for control farms) (Figure 4). Most trees on the farms were timber trees (64% on project farms, 75% on control farms). Apart from having on average more trees (86) per farm compared with control farms (48), project farms also had a larger average proportion (19%) of fodder trees than control farms (4%) (Figure 4). In terms of species, on average control farms had more Eucalyptus spp. and project farms had more N-fixing species like Sesbania sesban, Acacia spp. and Calliandra spp. The most common species overall were Grevillea robusta, Markhamia spp. and Albizia spp.

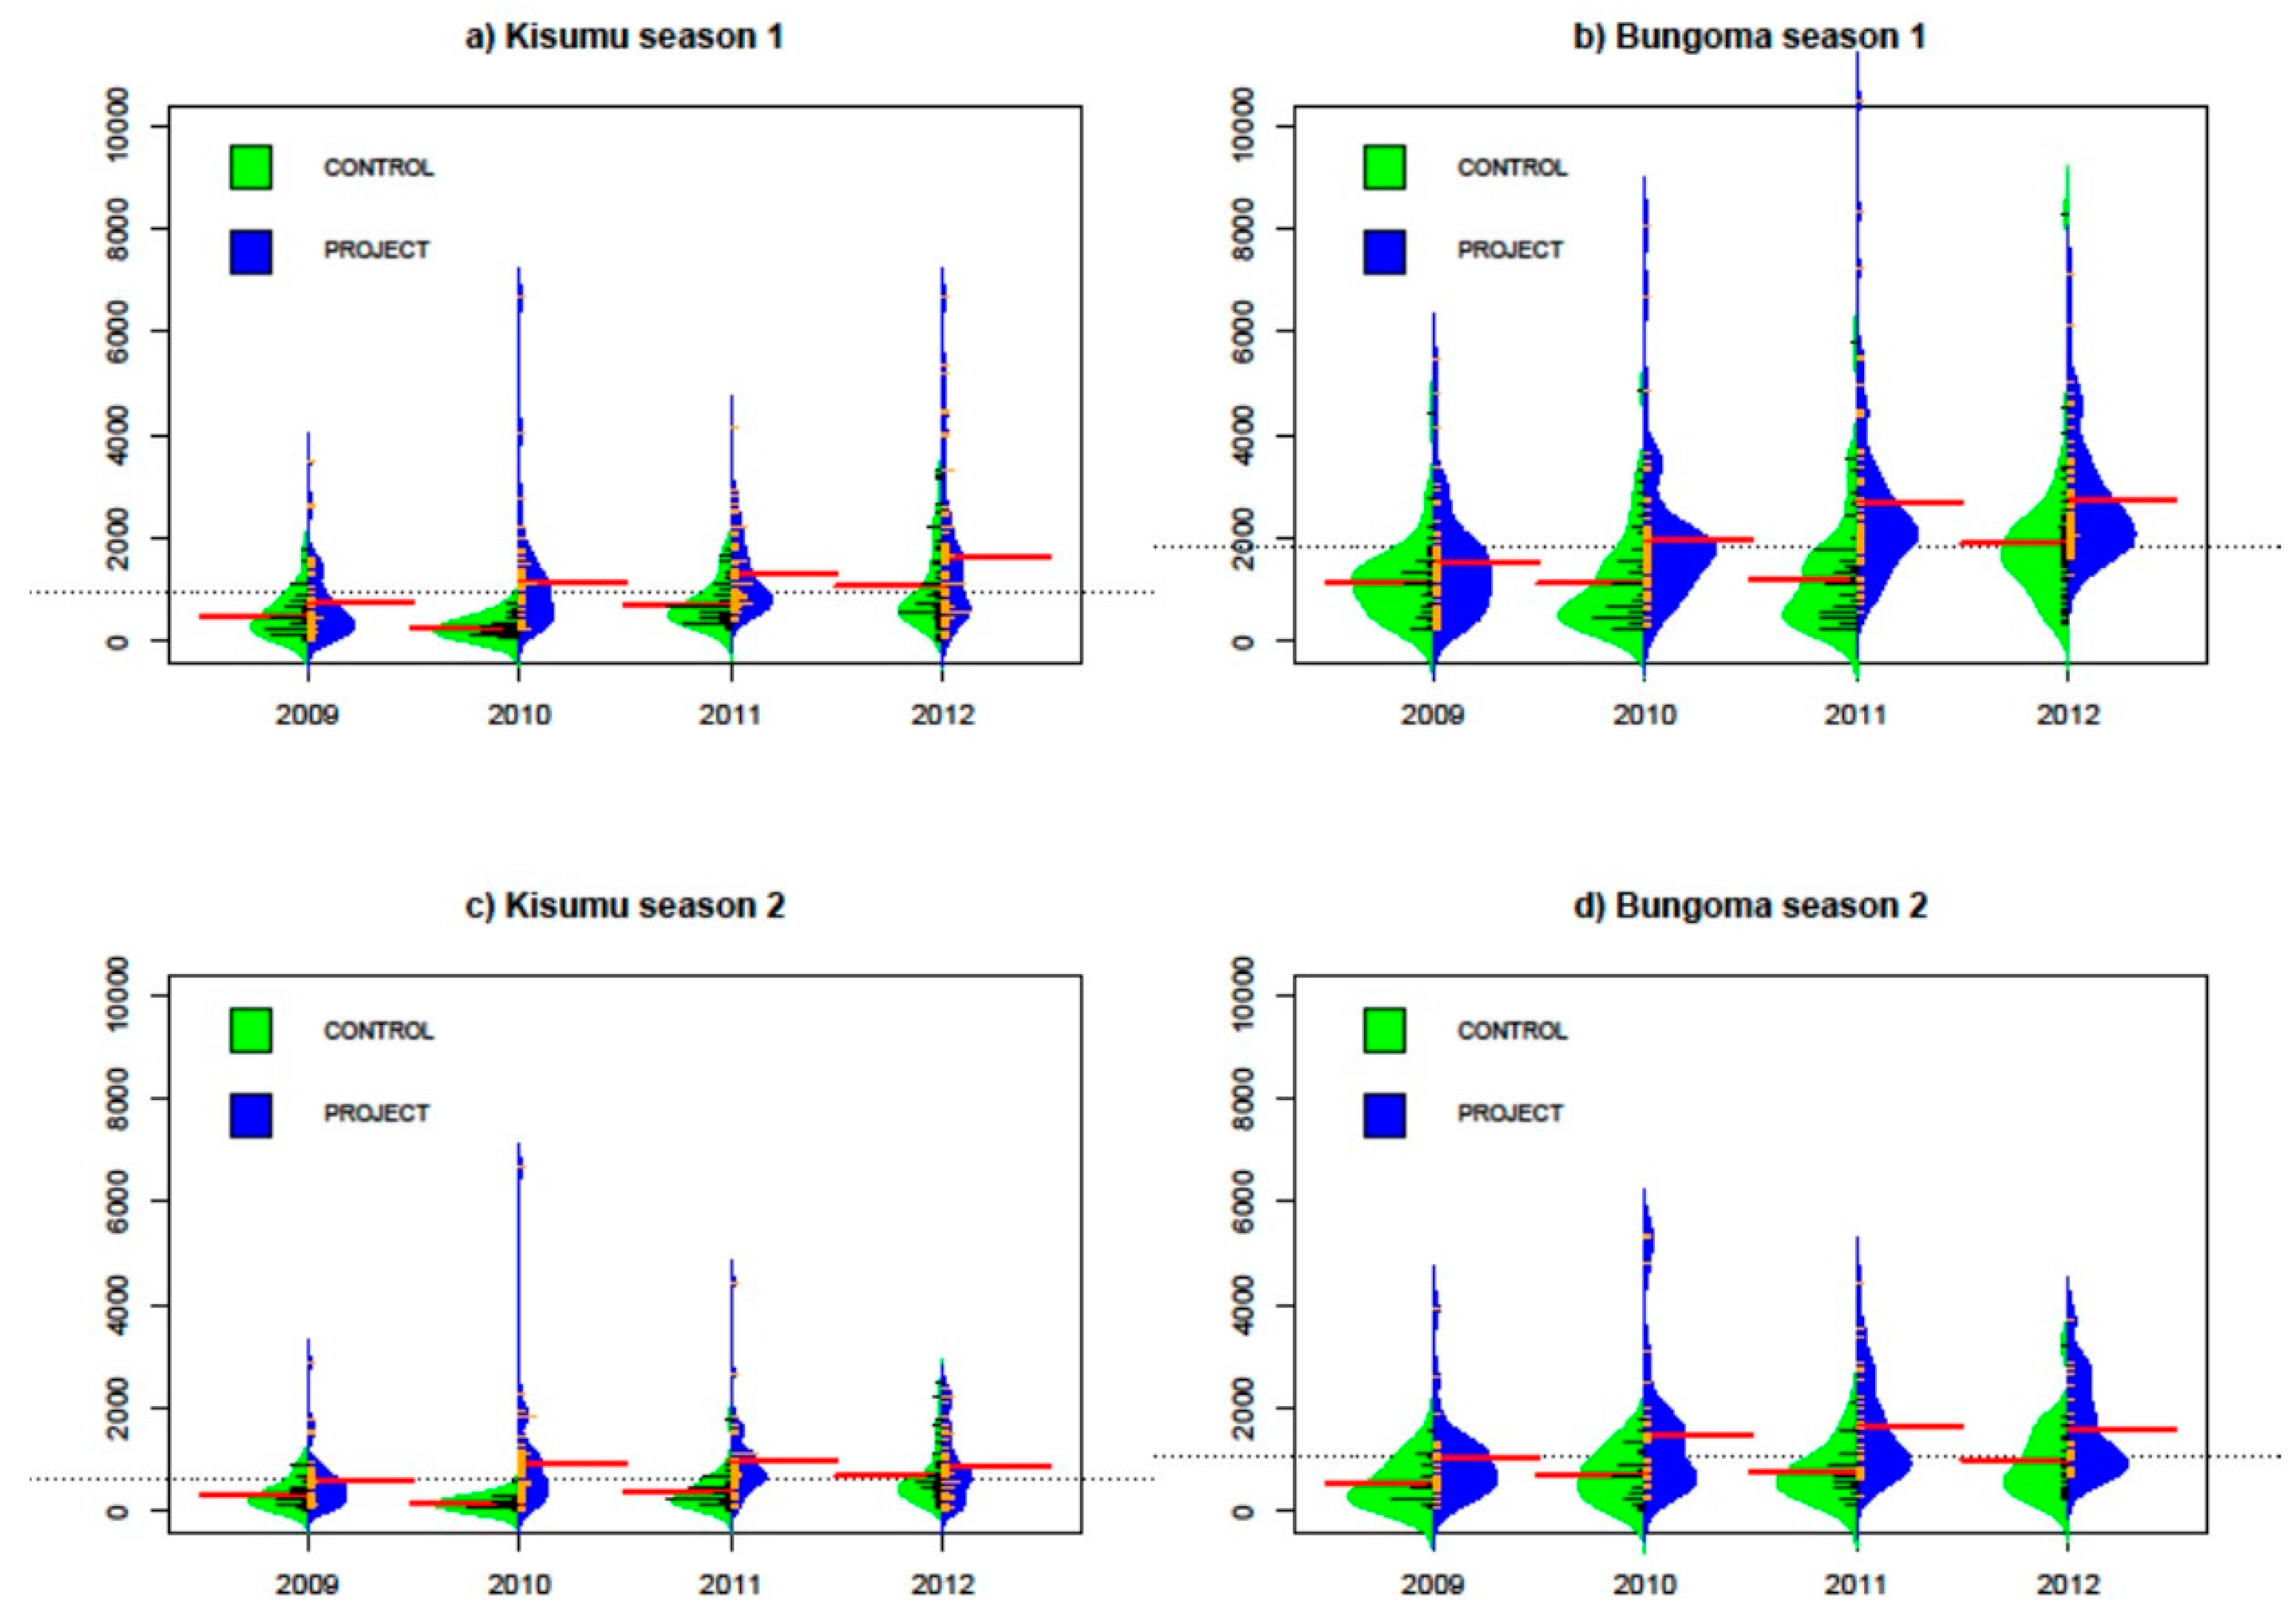
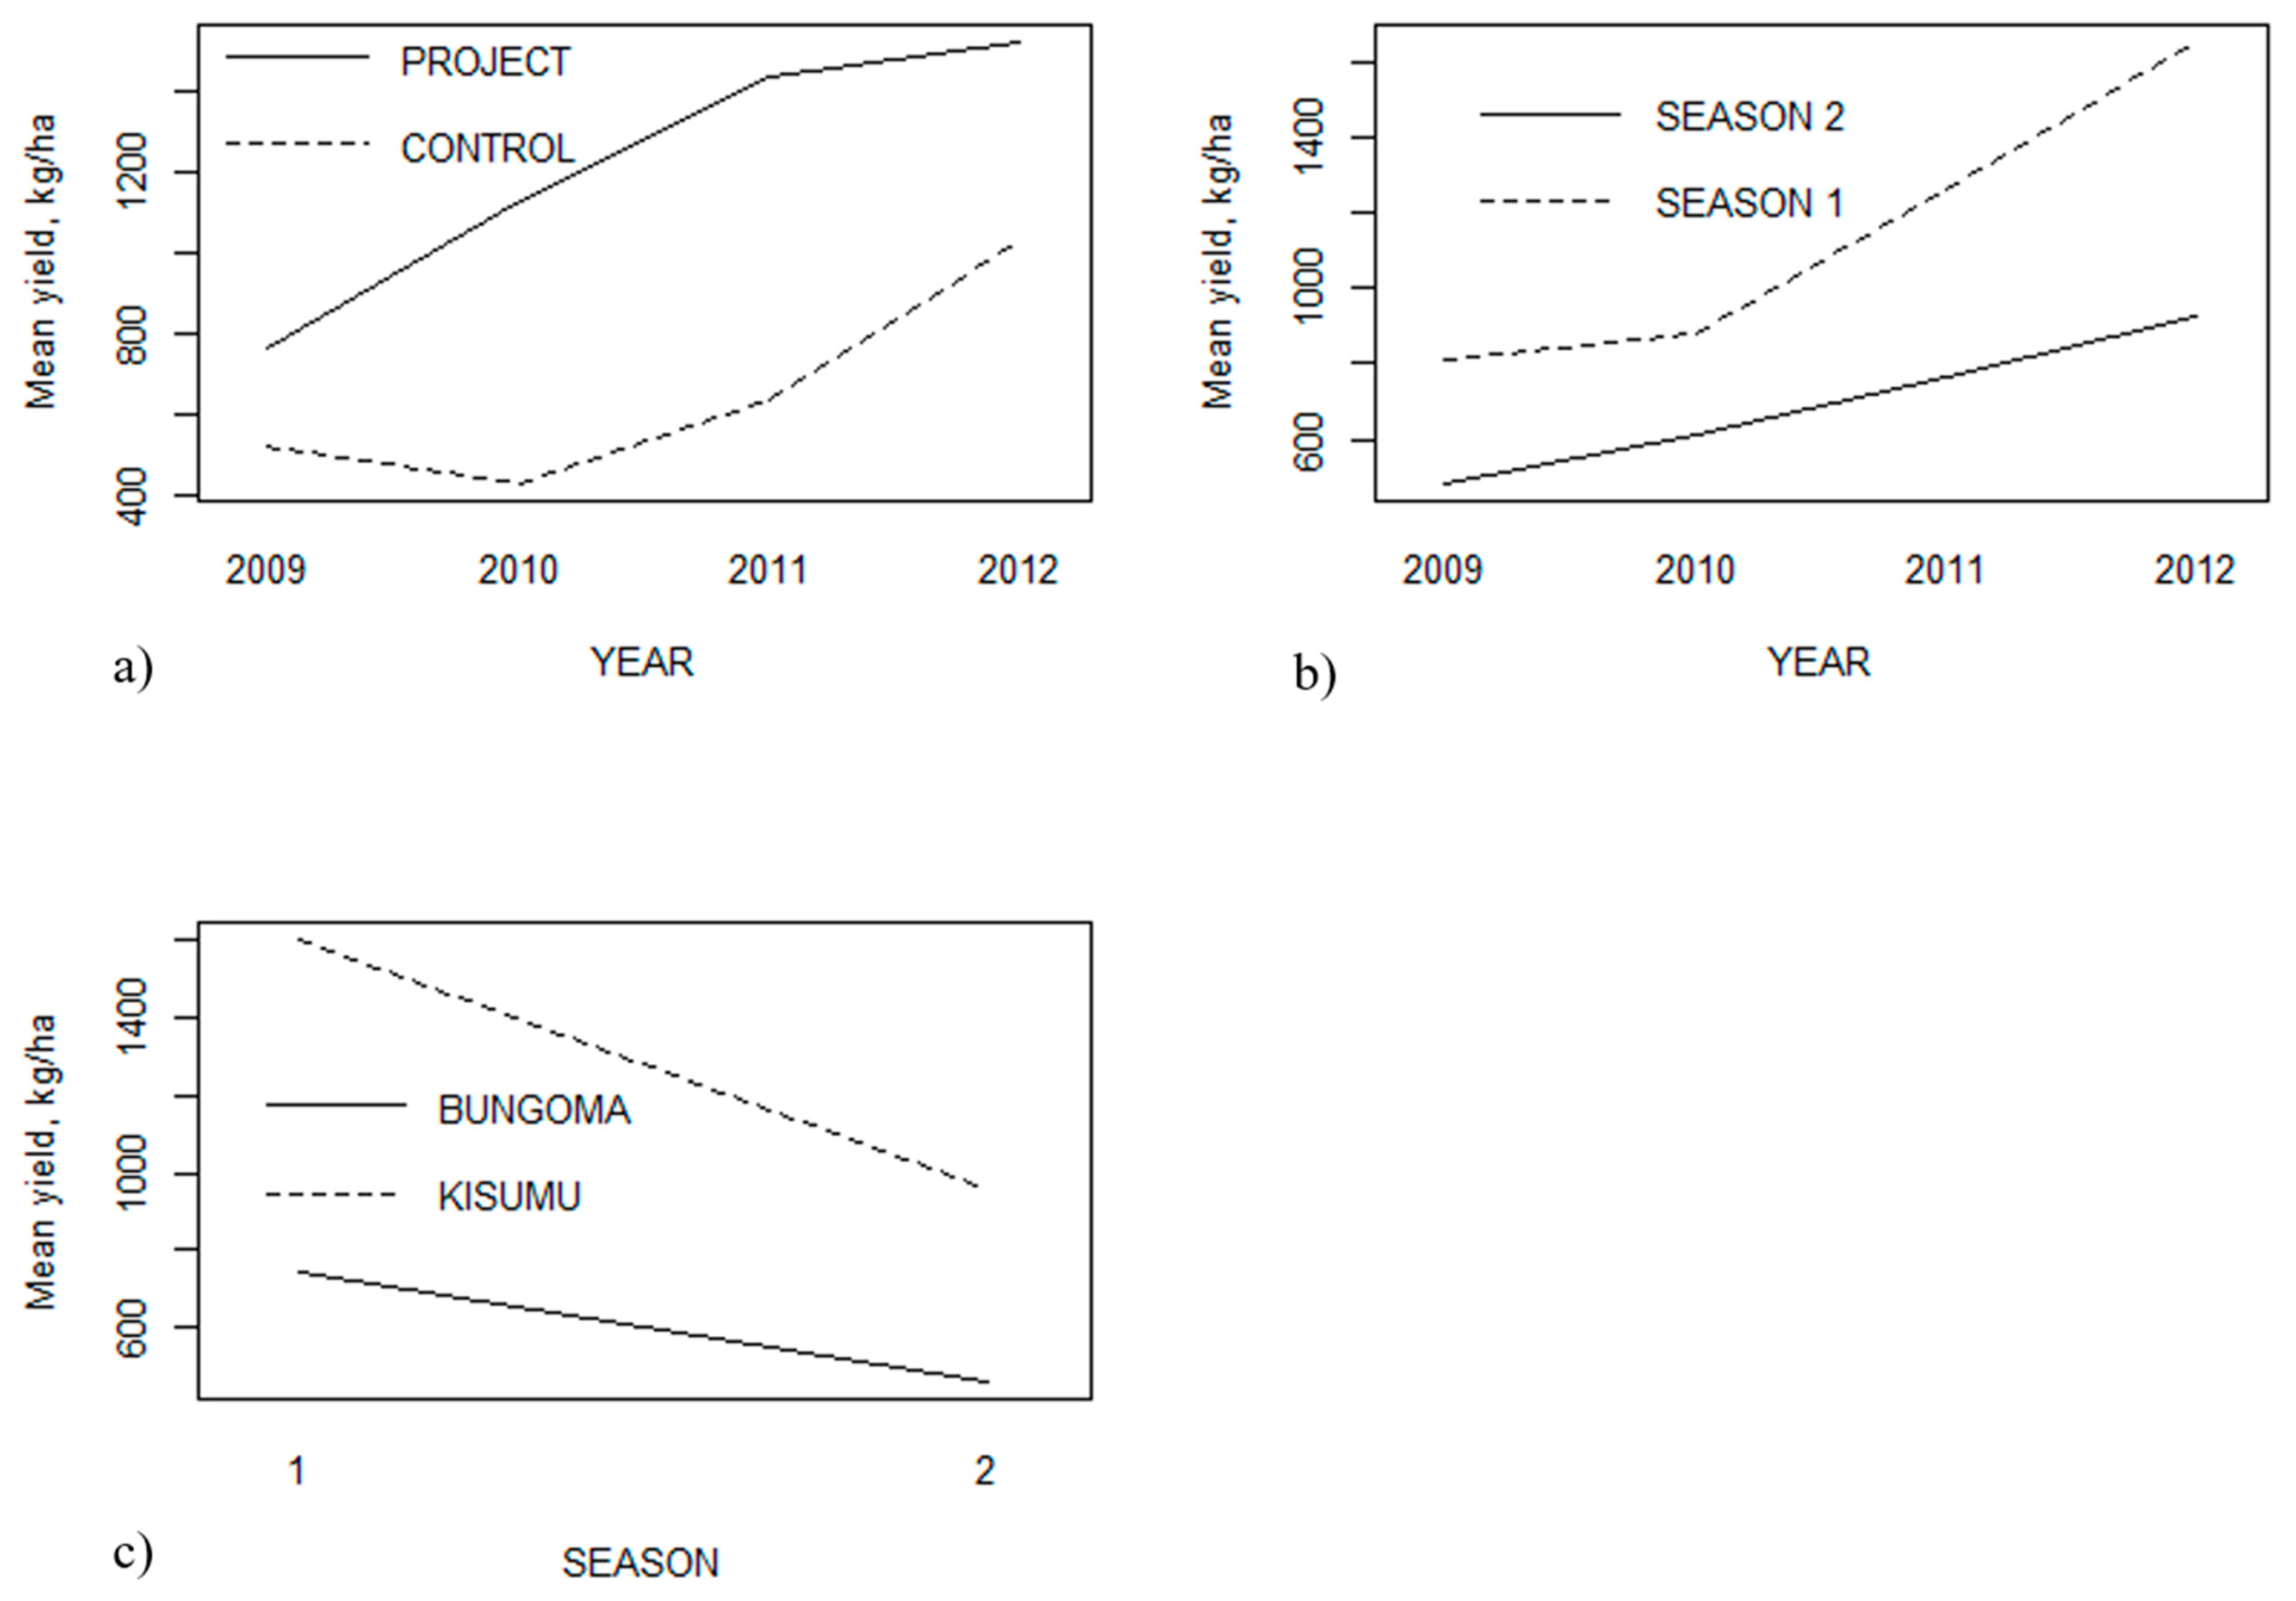
3.2. Effects of SALM Practices on Maize Yield

Among the recommended SALM practices, only terracing had a significant (p = 0.0004) positive effect on maize yield. However, the management effects were small compared with the highly significant differences (p < 0.0001) between years, seasons and regions. Terracing was the only practice that was part of the best explanatory model, together with area, season and year (Yield ~ Area + Year + Season + Terracing + (1|Place/Farm)). When analysing effects from trees, first-season maize yield was not affected by any factor other than region, with Bungoma having a higher yield. Second-season maize yield had the best-fit model that included region and the total number of trees per farm (Yield 2 ~ Region + Total trees + (1|Farm)). Second-season maize yield increased with the increasing total number of trees (p = 0.02).

3.3. Maize Productivity

Maize yield varied widely between the areas and was on average 1572–2675 kg ha−1 in Bungoma, compared with 725–1661 kg ha−1 in Kisumu, among project farms in the first season of the four years (Table 1). There was also a wide variation in second-season yield, which was 518–1054 kg ha−1 and 152–678 kg ha−1 for Bungoma and Kisumu control farms, respectively. Maize productivity analyses showed higher yield (p < 0.0001) for project farms than control farms, higher first-season than second-season yield (p < 0.0001) and higher yield (p < 0.0001) in Bungoma than Kisumu (Table 1, Figure 5). The four study years also differed (p < 0.0001) in terms of yield, with mostly increasing trends (Figure 5). Apart from the main effects, there were three significant interactions (Figure 6): (1) yield differences between project and control farms were larger (p < 0.0001) in 2010–2011 than in 2009 or 2012 (Figure 6a); (2) first-season yield increased more (p = 0.004) than second-season yield in 2012 (Figure 6b); and (3) there was a larger difference (p = 0.005) in the first-season yield compared with the second-season yield between the regions (Figure 6c). Project farms increased their yield mostly in 2010 when the first-season yield declined in control farms. The second-largest increase for project farms was in 2011, while control farms had a one-year lag with their largest increase in 2011 and second-largest in 2012 (although the yield was still lower than on project farms). However, in total, the difference in yield between project and control farms was similar in 2009 and 2012 (p = 0.15), and therefore the yield gap between project and control farms did not change significantly during the four initial years of the KACP.

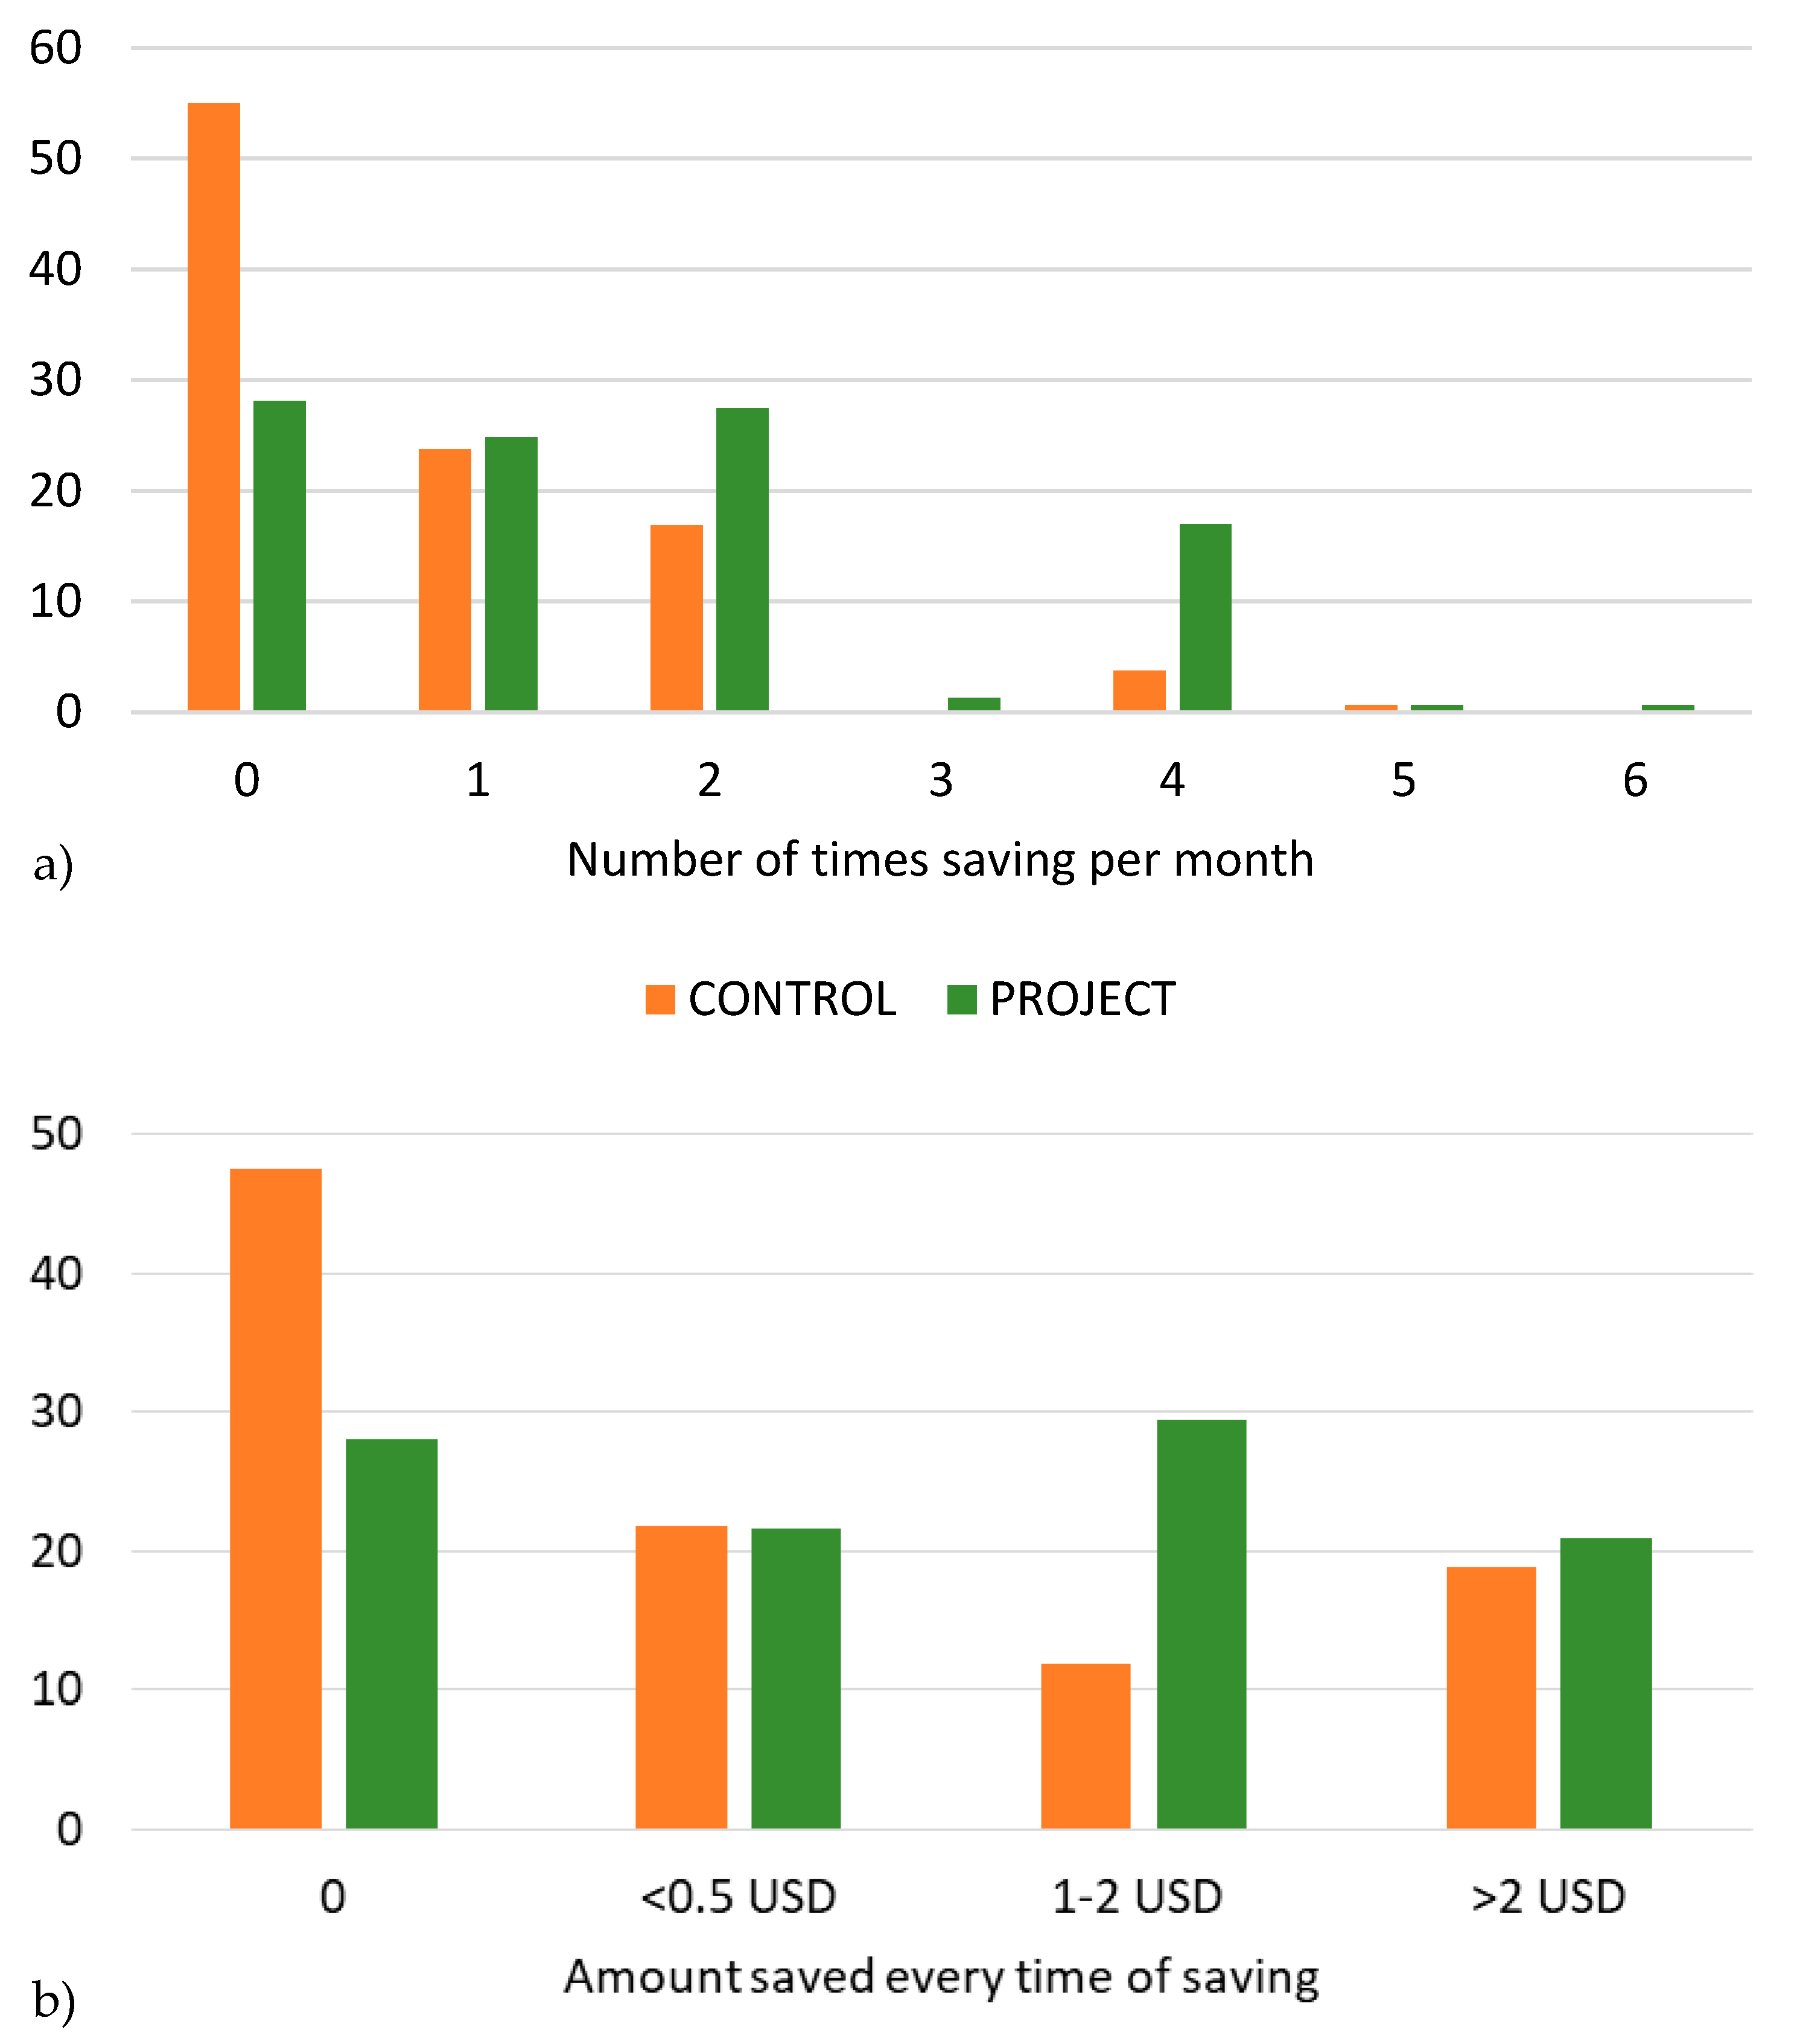
3.4. KACP Effects on Savings and Food Sufficiency

Project farmers added to their savings more often on average than control farmers (Figure 7a) and also added larger amounts per occasion (Figure 7b). More than 45% of project farmers added to savings two or more times per month, while the corresponding figure for control farmers was 21%. Project farmers saved to a larger extent (72%) than control farmers (52%) and Kisumu farmers saved on average more than Bungoma farmers. In the VSLAs within the KACP, farmers were able to borrow up to three times their savings to use for investments.
Among Bungoma farmers, 39% had farm inputs as their main expenditure, compared with just 14% for Kisumu farmers, 60% of whom had food as their main cost. In Bungoma, there was a difference between project and control farmers in that 51% of project farmers spent most on education for their children, while 25% of control farmers still had to spend most on food and thereby only 27% had education as their main expenditure. The majority of farmers in both Kisumu and Bungoma had their main source of income from agricultural products.
Only 4% of control farmers in Kisumu (31% in Bungoma) had enough food for 10–12 months, compared with 16% of project farmers in Kisumu (51% in Bungoma). Moreover, 46% of control farmers in Kisumu and 25% in Bungoma had enough food for less than six months, while the corresponding values for project farmers were 19% and 7%, respectively. In general, farmers in Bungoma had more months of food sufficiency than farmers in Kisumu. Chi-2 tests revealed that food sufficiency was significantly higher (p < 0.001) overall for project farmers than control farmers.

4. Discussion

4.1. Mulching, Terracing and Trees More Popular Than No Tillage

By 2012, there was a large difference in the use of terraces between project (60%) and control fields (25%) (Figure 3). Terraces can greatly enhance soil moisture recharge [51] but require major initial labour inputs [52]. Cover crop uptake among project farmers increased until 2011, but declined to the initial level in 2012, possibly due to crop rotation patterns or to dissatisfaction with the practice itself (Figure 3). Cover crops/green manure grown for six weeks (planted two weeks earlier than maize), and then incorporated into soil can significantly improve soil fertility by adding nitrogen, increasing maize yield in the same season [53]. However, convincing farmers to grow cover crops mainly for soil fertility reasons was apparently difficult in the KACP (Figure 3), as in other projects [54]. Different SALM practices had different degrees of uptake, for example, mulching and terracing became popular, while no tillage did not. Minimum tillage practices have varying and sometimes negative or contradictory outcomes for smallholders in the region [55,56] and the willingness to use minimum tillage is lower than, for example, mulching [57]. It is also debatable whether minimum tillage options can act as a carbon sink [58,59].
Advice on SALM practices to be used, and practices to be avoided, seemed to be adhered to more by project farmers in 2012 compared with the initial use in 2009, and also compared with control farmers and with the uptake of practices in a similar study [60]. Use of soil fertility management practices is generally low among smallholders in Western Kenya [60] but is influenced positively by, for example, plot size, market and labour access, off-farm earnings and knowledge [60,61]. This implies that the poorest farmers may have less possibility to use such practices.
Trees in the agricultural landscape, that is agroforestry, can have both positive and negative effects on production and other ecosystem services, but most studies show a net positive effect [62]. Fodder trees were promoted by the KACP advisors, which can explain why project farms had a larger share of leguminous fodder trees than control farms (Figure 4). A lack of fodder trees on control farms could also explain the lower use of crop residues for mulch, as more crop residues might be needed for livestock feed. The larger number of trees per farm in Bungoma than Kisumu may be because the farms were larger in Bungoma. It is also easier for tree seedlings to survive in Bungoma since most farmers control their grazing animals and prevent them from browsing on tree seedlings.

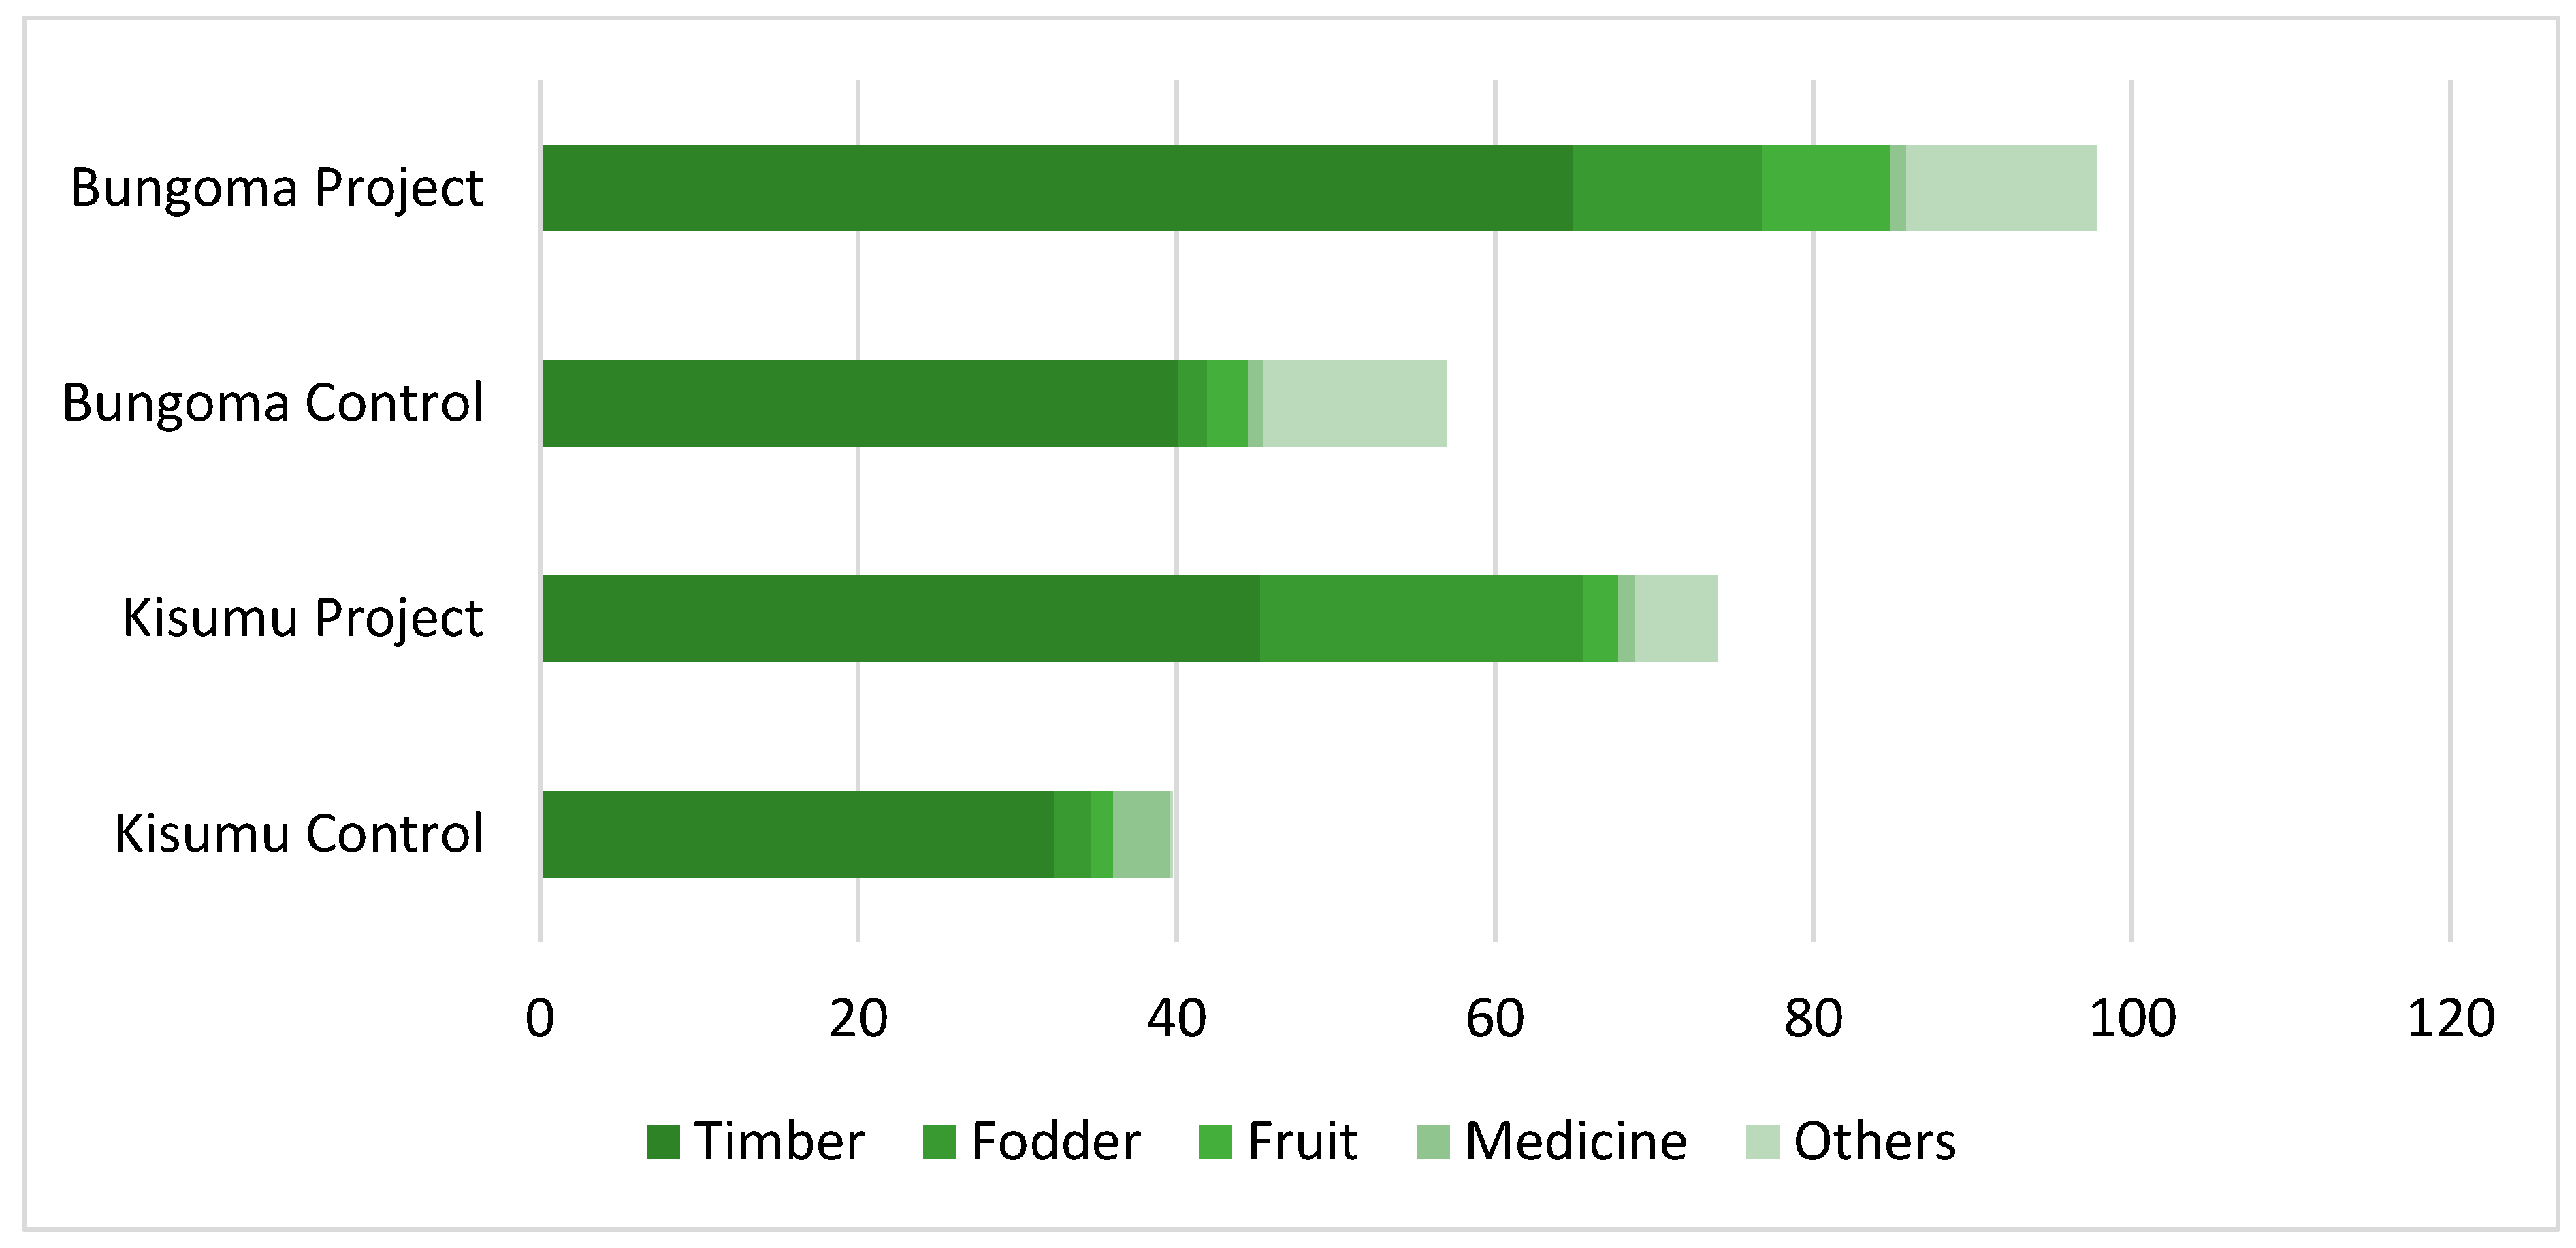
4.2. Terraces and Fodder Trees Increased Maize Productivity

Of the six SALM practices and three non-SALM practices analysed, only terraces had a significant positive effect on maize yield. The differences in SALM practices between 2009 and 2010 (when the yield increase was largest for project farms) were mainly the increased use of cover crops and water harvesting structures. However, neither practice showed any significant correlation with yield. The four-year study period can be expected to be sufficient to reveal the effects of most management practices [63]. While the main aim of SALM practices in the KACP is to reduce greenhouse gas emissions and sequester more carbon, they can also improve water availability for crops and soil fertility, both of which improve yield [17,64]. However, few SALM practices showed any significant effects on maize yield in this study. One drawback related to terraces is the relatively high labour demand needed upon establishment, which may restrict farmers from using the measure.
The intensity of the different SALM practices was not studied (since data was not available), but differences in intensity could have masked relationships between management and yield. Most recommended practices are dependent on the type, quantity and quality of, for example, mulch, compost, water harvesting or cover crops. Project farmers, for example, reduced burning and removal of residues (for fodder or fuel) in order to use more as mulch, but 40% of residues were still used for purposes other than mulching in 2012 (Figure 3), suggesting that much is used as fodder and could be returned as manure. Mulching is known to increase and stabilise maize yield [55,57]. However, practices related to crop residues (mulching, composting, green manure, etc.) require trade-offs between several uses, and the end-use often reflects more immediate concerns such as feeding livestock rather than improving soil fertility in the longer term [65,66]. With more fodder trees on the farm, feed and fuel could come from sources other than crop residues.
The use of agroforestry SALM practices was popular in project farms, which had on average around double the number of trees as control farms. A possible drawback with tree–maize intercropping is competition for light, water and nutrients unless the trees are adequately pruned above and below ground [67]. However, the number and type of trees did not have any effect on the first-season maize yield. Timber trees, which were the most common type used, are often planted in woodlots and therefore rarely interfere with crops, while fodder trees are more often intercropped within fields. In this study, second-season maize yield was positively affected by the total number of trees, possibly because farms with many trees had a larger share of fodder trees that are leguminous and can fix the nitrogen from the atmosphere, which has been found earlier [67,68]. Apart from increasing second-season maize yield, trees could provide other services (animal feed, fruits, timber and firewood) which were not considered in this study. Further, a combination of trees and grass is effective in holding and maintaining the soil on hillslopes and terraces [69]. Agroforestry is known to be both knowledge and labour intensive which can limit the uptake of the practice [70].

4.3. Maize Productivity Increased but SALM Practices Only Part of the Explanation

Average maize yield on small, subsistence-focused farms in western Kenya was 0.9 tonnes ha−1 during the study period [71]. Nation-wide, mean annual maize yield in Kenya in the four years 2009–2012 was 1294, 1725, 1584 and 1737 kg ha−1 [72], compared with 1707, 2139, 2669 and 2921 kg ha−1 for both seasons and all farmers in this study. The first cropping season usually has more rain days and larger amounts of rainfall (“long rains”) than the second season (“short rains”) in both study areas, which largely explains the higher productivity in first-season maize (Figure 5 and Figure A1). Farmers who composted their manure applied it to fields once per year at the beginning of the first season, which may be another factor in the yield differences between seasons. Overall, Bungoma had higher amounts of rainfall and a cooler climate (Table A2 and Figure A1), leaving more water available for crops instead of being lost through evapotranspiration. Therefore, productivity was significantly higher in Bungoma and the pattern was the same for all years and seasons (Figure 5).
Water is not the only limiting factor for maize growth in Western Kenya, as nitrogen and phosphorus are also main limiting factors [64]. Small-scale farms with subsistence-focused production tend to have resource flows showing net nutrient export and low values of carbon and nitrogen especially [71]. Smallholders in the KACP were encouraged to practise integrated soil fertility management, with careful use of inorganic fertiliser and more focus on organic fertilisers. This advice is debatable since many researchers view inorganic fertilisers as important in increasing yield and boosting biomass production for higher carbon cycling [73,74]. The use of inorganic fertilisers may partly explain the different yield patterns for project and control farms (Figure 6a). However, the use of inorganic fertilisers was not included in this study and therefore needs further studies for a better understanding of its effects with or without SALM practices.
The reason why the first-season yield increased more than second-season yield in 2012 (Figure 6b) was likely that yield actually decreased in 2010 for control farms, and also that SALM use was higher for first-season crops and high for both project and control farmers in 2012. The greater yield increase in Bungoma than Kisumu for first-season crops (Figure 6c) could be because Bungoma farmers concentrate on agriculture, while Kisumu farmers were traditionally fishermen and also have more off-farm job opportunities close by, making them less dependent on farming [66]. Farmers who are more focused on farming are likely to be more eager to invest in their farm and use new practices. The Bungoma area (known as “Kenya’s breadbasket”) also has more responsive soils and a more favourable climate than the Kisumu area.

4.4. Role of Control Farms in Interpreting Results

Immediate effects from SALM practices related to water-holding capacity [64,75] could explain the initial higher yield increases for project farms. Possible reasons why the control farms increased their yield more than project farms in 2011–2012 (Figure 6a) could be reductions in inorganic fertiliser use in project farms, control farms copying practices from project farms or project farmers paying more attention to their crops during the first years of the project, but then relaxing. Learning from neighbours and friends (farmer-to-farmer) is often the most common [76] and most effective [77] way of learning new practices in this region, which could explain both the relatively high SALM uptake in 2012 and delayed yield increases on control farms compared with project farms. Farmer-to-farmer uptake within the KACP areas was reported by Hughes et al. [42], who found significant uptake of certain practices within the project area (not only among the targeted farmer groups) than in neighbouring areas outside the project. However, this does not mean that advisory services were not worth the effort. Farmers generally want better access to advisory services [78], especially in the early stages of adoption [77].
The project and control farmers were all within the KACP areas and lived in the same villages. For control farms, the use of the different SALM practices was only studied in 2012 and by then their use of practices recommended by the KACP was on average higher than the initial (2009) use on project farms. Maize productivity at the start of the project (2009) was higher on project farms than control farms and, while maize yield increased over the years, the difference between project and control farms was similar in 2012. Thus, comparisons of maize yield initially and at the end of the monitoring period showed no overall difference between project and control farms. The value of having control farms in addition to the baseline production in 2009 was to ensure that the yield differences were not normal annual fluctuations due to weather patterns. Control farms were two or three farms away from their paired project farm, so soils and weather conditions were probably similar. However, there might be other differences between project and control farms.
Participation in the KACP was voluntary and participants were generally both asset-poor and income-poor. However, earlier research has found higher adoption of SALM practices among the less poor in the project [41]. This may indicate that it is not the poorest of the poor that risk venturing into such projects, as has been found elsewhere [79]. However, they can perhaps not be expected to participate unless they are specifically targeted with up-front financial support to overcome their risk aversion. In earlier studies, the main factors limiting uptake of SALM practices within the KACP were found to be lack of labour to implement SALM practices, knowledge on how to implement them and land availability [41,44]. In addition, women had problems finding the time to attend training [43,44].

4.5. KACP Farms Had Higher Savings and Food Sufficiency

Kisumu farmers were able to save on average more than Bungoma farmers. This was most likely partly due to more off-farm income opportunities in Kisumu and partly because the yield was lower in Kisumu, so farmers needed cash savings to buy food. On average, project farmers saved to a larger extent, more often and in larger amounts than control farmers, probably because the VSLA concept in the KACP provided opportunities to save (Figure 7a,b). The VSLA methodology has earlier shown positive results for several household indicators, such as the development of income-generating enterprises and access to education and food [80]. Preliminary data from a study in 2016 also indicated higher income from tree products, better fuelwood access and higher milk yield among the KACP farmers compared with neighbouring control areas [42]. All of these can increase the scope of cash savings by households.
Project farmers at both sites had significantly higher food sufficiency than control farmers. This can be directly related to differences in maize yield, but maize is just one of many food crops. The improved food sufficiency may also be attributable to other farm commodities such as sorghum, beans and cassava, yields of which probably also benefit from terracing and other SALM practices. Improved yields and better food sufficiency among the KACP farmers have been reported in an earlier study of women and men farmers [44]. The higher level of food sufficiency in Bungoma most likely reflects the greater farm size and higher average yields in this area than in Kisumu. Agroforestry practices could have added to food sufficiency through, for example, fruits. Earlier studies report maintained yields in combination with such additional benefits from agroforestry [81].

4.6. Limitations of the Study

It is a strength that control farms were included in the study, rather than just monitoring changes over time from the baseline on the project farms. However, the study has some limitations partly related to the control farms. A possibility of farmers participating in the KACP being different, perhaps better-off, than those who did not participate emerged early in the project, so an attempt was made to avoid potential self-selection bias by adding a control group of farmers in 2012. However, this meant that no control farms were monitored from the beginning of the project and there is uncertainty in the data on maize yield based on control farmer recall for the first three years (2009–2011). Moreover, uptake of SALM practices on control farms was only assessed in 2012 and thus data were lacking for 2009–2011. The identified control farms were also perhaps too close to project farms, which may have given a non-representative control group. Another limitation of this study was the “weak definitions” of uptake of practices. The uptake data were binary (practiced or not practiced) and the quantities of mulch, manure, etc. applied were not recorded, which created large variation in the effects of farmers’ uptake of practices.

4.7. Implications and Recommendations

Overall, the KACP had a tendency for positive effects regarding uptake and effect of certain SALM practices, development of maize yield, food sufficiency and savings. However, to obtain stronger evidence that the results are due to the intervention, large-scale projects like this would need to include control farms in the design from the beginning, together with clearly defined quantitative indicators of uptake of practices. This could be done jointly by development agencies and research institutions, in order to achieve an optimal design and reduce the costs of monitoring and evaluation. Some of the practices promoted in the KACP were also questionable (e.g., no tillage and careful use of inorganic fertiliser), especially considering the relatively poor target group. A primary aim of the advisory services in such projects should be yield and productivity increases and building resilience, while climate change mitigation objectives should be viewed as a secondary goal [41]. The target group should not be expected to take any risks. Of the SALM practices promoted, only terraces and trees showed positive (but relatively small) effects on yield. Thus, other parts of the advisory services, for example, micro-credit access [82], might have played a greater role in the increased maize yield and savings and need to be explored in future research.

5. Conclusions

This is the first research study on the yield effects of promoted practices in an agricultural soil carbon project for smallholders in sub-Saharan Africa. Advisory services provided to farmers participating in the KACP appeared to increase the uptake of some of the soil management and tree planting (especially fodder trees) practices and to lower the use of non-sustainable practices. Indications of some uptake through farmer-to-farmer horizontal learning were observed for control farmers.
Higher inclusion of trees (agroforestry) and the use of terraces were the only practices that correlated positively with higher maize yield. The lack of effect of practices was likely due to vague definitions of the practices within the project. Maize yield increased from the start of the KACP and continued over the four years studied and was higher among project farmers than control farmers during all years. The yield increase was similar for project and control farmers but the timing differed, since project farms achieved their main increase during the first years, while control farms obtained their main increase during later years.
Participants in the KACP had higher food self-sufficiency and the results indicated greater ability to save money, both more frequently and in greater amounts. Thus, apart from carbon revenues, the KACP farmers seemed to use more sustainable management practices, had higher maize yield, had better food self-sufficiency and tended to save more money than control farmers. This improved the preparedness of the smallholder farmers participating in the KACP and increased their resilience for future challenges. However, it was not possible to determine whether those farmers were already on this path to improvement before joining the KACP.

Author Contributions

Conceptualization, Y.N. and I.Ö.; methodology, I.Ö., Y.N., C.M. and E.W.; software, Y.N., C.M. and E.W.; validation, Y.N., C.M., E.W. and I.Ö.; formal analysis, Y.N.; investigation, C.M. and E.W.; resources, I.Ö.; data curation, Y.N.; writing—original draft preparation, Y.N.; writing—review and editing, Y.N., C.M., E.W., J.W., M.J. and I.Ö.; visualization, Y.N., E.W.; supervision, J.W., M.J. and I.Ö.; project administration, Y.N.; funding acquisition, I.Ö. All authors have read and agreed to the published version of the manuscript.

Funding

This research was funded by the Swedish Ministry for Foreign Affairs, as part of its special allocation on global food security; the Formas-Sida programme “Sustainable development in developing countries” (220-2009-2073); and the Swedish University of Agricultural Sciences (SLU).

Acknowledgments

Farmers and advisors around Kisumu and Bungoma are gratefully acknowledged for their comprehensive efforts. Special thanks to Bo Lager, Fred Marani, Wangu Mutua, Amos Wekesa, Peter Wachira and the rest of the Vi Agroforestry team. Thanks also to Johannes Forkman, who assisted in statistical analyses.

Conflicts of Interest

The authors declare no conflict of interest. All procedures performed in the study involving human participants were in accordance with the ethical standards of the institutional and/or national research committee and with the 1964 Helsinki Declaration and its later amendments, or comparable ethical standards. Informed consent was obtained from all individual participants in the study. The funders had no role in the design of the study; in the collection, analyses, or interpretation of data; in the writing of the manuscript; or in the decision to publish the results.

Appendix A

Table A1. Sustainable Agricultural Land Management (SALM) practices promoted and implemented in the Kenya Agricultural Carbon Project (KACP) (after [31]).
SALM CategoriesSALM Practices
Nutrient managementMulching, composting, cover crops, nitrogen-fixing crops, manure, restricted chemical fertilisers and chemical management
Soil and water conservationTerraces, contour bunds, broad beds and furrows, semi-circular bunds, trash lines, diversion ditches and cut-off drains, retention ditches, pitting, trenches, tied ridges, grass strips, irrigation, roof catchment, ground surfaces and rocks, irregular surfaces, tanks, birkas, pans, ponds, dams, wells and boreholes, ecological sanitation, kitchen water
Agronomic practicesCrop rotation, intercropping, green manure, contour strip cropping, relay cropping, use of improved crop varieties
AgroforestryPlant trees amongst crops, trees and livestock, trees, crops and livestock, trees and insects, trees and water animals, woodlots, boundary planting, dispersed interplanting, fruit orchards
Tillage and residue managementNo-tillage/zero-tillage, reduced tillage, pitting systems, stubble and residue mulch tillage, dibble stick planting, strip and spot tillage, ripping, ridge and furrow tillage, residue management
Land restoration and rehabilitationNatural regeneration, assisted natural regeneration, enrichment planting, fire management, agroforestry
Integrated livestock managementImproved feeding and watering, housing, stall management systems, improved waste management, pest and disease control, improved breeding practices
Sustainable energyBiomass, biogas, farm residues, energy-efficient stoves, sustainable charcoal production
Integrated pest managementBiological pest control, use of crop-resistant varieties, alternative agricultural practices (spraying, use of fertilisers, pruning), mechanical pest control, pesticides, cultural methods, pest management plan
Table A2. Characteristics of the Kenya Agricultural Carbon Project (KACP) sites at Kisumu and Bungoma.
ParameterKisumu SiteBungoma SiteData Source
CountiesSiaya, KisumuBungoma[83]
DivisionsWagai, Kombewa, MadianyBumula, Malakisi, Sirisia[83]
LocationSouth Gem, West Gem, North West Gem, North East Gem, South West Gem, South Central Seme, North Central Seme, South West Seme, West Seme, West Uyoma, Central Uyoma, East Uyoma, South UyomaBumula, Kabula, Mabusi, South Bukusu, Khasoko, Siboti, Mukwa Kimaeti, Napara, Kibuke, Malakisi, Namubila, Lwandanyi, Sirisia, Namwela[83]
Agro-ecological zones1LM1, LM2, LM3, LM4UM1, UM2, LM1, LM2, LM3[84]
SoilsClay content about 39%Clay content about 20%[85]
Altitude (m above sea level)1200–1500 m1200–1850 m[86]
Major cropsMaize & sorghumMaize & sugarcaneData from project farms n = 200
Average farm size0.7 ha1.1 haData from project farms n = 200
Average household size3.6 adults and 3.2 children3.7 adults and 4.4 childrenData from project farms n = 200
Mean temperature range and mean annual precipitation17.4 °C–29.8 °C; 1326 mm14 °C–27.6 °C; 1884 mm[83]
Project locations0°7’45.53" N, 34°23’38.56" E; 0°23’34.29" S; 34°17’58.55" E0°27’0.12" N, 34°31’14.87" E; 0°48’18.13" N, 34°24’54.61" E[83]
Population density (persons km−2)333 and 465 in Siaya and Kisumu County, respectively454 in Bungoma County[87]
1 LM1=Lower Midland 1; LM2=Lower Midland 2; LM3=Lower Midland 3; LM4=Lower Midland 4; UM1=Upper midland 1; UM2=Upper midland 2.
Figure A1. Monthly rainfall data in the study areas, 2009-2012; (a) Bungoma site (Kakamega meteorological station; total annual rainfall 2009-2012 = 1789, 2113, 1876 and 2287 mm, respectively). (b) Kisumu site (Kisumu meteorological station; total annual rainfall 2009-2012 = 1426, 1477, 1563, and 2036 mm, respectively).
Land 09 00389 g0a1

References

  1. Elliott, J.; Deryng, D.; Müller, C.; Frieler, K.; Konzmann, M.; Gerten, D.; Glotter, M.; Flörke, M.; Wada, Y.; Best, N.; et al. MConstraints and Potentials of Future Irrigation Water Availability on Agricultural Production under Climate Change. Proc. Natl. Acad. Sci. USA 2014, 111, 3239–3244. [Google Scholar] [CrossRef] [PubMed] [Green Version]
  2. Foley, B.J.; Melton, F.; Middleton, E.; Hain, C.; Anderson, M.; Allen, R.; McCabe, M.F.; Hook, S.; Baldocchi, D.; Townsend, P.A.; et al. The Future of Evapotranspiration: Global Requirements for Ecosystem Functioning, Carbon and Climate Feedbacks, Agricultural Management, and Water Resources. Water Resour. Res. 2017, 53, 2618–2626. [Google Scholar]
  3. Foley, J.A.; Ruth, D.; Gregory, P.; Asner, C.B.; Gordon, B.; Stephen, R.; Carpenter, F.; Stuart, C.; Michael, T.; Coe, G.; et al. Global Consequences of Land Use. Science 2005, 309, 570–574. [Google Scholar] [CrossRef] [Green Version]
  4. Godfray, H.; Charles, J.; Tara, G. Food Security and Sustainable Intensification. Philos. Trans. R. Soc. B 2014, 369, 20120273. [Google Scholar] [CrossRef]
  5. IPCC. Summary for Policymakers. In Climate Change 2014: Impacts, Adaptation, and Vulnerability. Part A: Global and Sectoral Aspects. Contribution of Working Group II to the Fifth Assessment Report of the Intergovernmental Panel on Climate Change; Field, C.B., Barros, V.R., Dokken, D.J., Mach, K.J., Mastrandrea, M.D., Bilir, T.E., Chatterjee, M., Ebi, K.L., Estrada, Y.O., Genova, R.C., et al., Eds.; Cambridge University Press: Cambridge, UK; New York, NY, USA, 2014; pp. 1–32. [Google Scholar]
  6. Johan, R.; Williams, J.; Daily, G.; Noble, A.; Matthews, N.; Gordon, L.; Wetterstrand, H.; DeClerck, F.; Shah, M.; Steduto, P. Sustainable Intensification of Agriculture for Human Prosperity and Global Sustainability. Ambio 2017, 46, 4–17. [Google Scholar]
  7. Bergström, L.; Bowman, B.T.; Sims, J.T. Definition of Sustainable and Unsustainable Issues in Nutrient Management of Modern Agriculture. Soil Use Manag. 2005, 21, 76–81. [Google Scholar] [CrossRef]
  8. Horrigan, L.; Robert, S.; Walker, P. How Sustainable Agriculture Can Address the Environmental and Human Health Harms of Industrial Agriculture. Environ. Health Persp. 2002, 110, 445–456. [Google Scholar] [CrossRef] [Green Version]
  9. Will, S.; Richardson, K.; Rockström, J.; Sarah, E.; Fetzer, C.I.; Bennett, M.E.; Biggs, R.; Carpenter, S.R.; de Vries, W.; de Cynthia, W. Planetary Boundaries: Guiding Human Development on a Changing Planet. Science 2015, 347. [Google Scholar] [CrossRef] [Green Version]
  10. Wivstad, M.; Dahlin, A.S.; Grant, C. Perspectives on Nutrient Management in Arable Farming Systems. Soil Use Manag. 2005, 21, 113–121. [Google Scholar] [CrossRef]
  11. Altieri, M.; Clara, A.; Nicholls, I.; Rene, M. Technological Approaches to Sustainable Agriculture at a Crossroads: An Agroecological Perspective. Sustainability 2017, 9, 349. [Google Scholar] [CrossRef] [Green Version]
  12. Buttel, F.H. Sustaining the Unsustainable. In Handbook of Rural Studies; Paul, C., Ed.; Terry Marsden and Patrick Mooney; SAGE Publications Ltd.: London, UK, 2006. [Google Scholar]
  13. IPCC. Summary for Policymakers. In Global Warming of 1.5 °C. An IPCC Special Report on the Impacts of Global Warming of 1.5 °C above Pre-Industrial Levels and Related Global Greenhouse Gas Emission Pathways, in the Context of Strengthening the Global Response to the Threat of Climate Change, Sustainable Development, and Efforts to Eradicate Poverty; Masson-Delmotte, P., Zhai, H.O., Pörtner, D., Roberts, J., Skea, P.R., Shukla, A., Pirani, W., Moufouma-Okia, C., Péan, R., Pidcock, S., et al., Eds.; World Meteorological Organization: Geneva, Switzerland, 2018. [Google Scholar]
  14. Abraha, M.; Hamilton, S.K.; Chen, J.; Robertson, G.P. Ecosystem Carbon Exchange on Conversion of Conservation Reserve Program Grasslands to Annual and Perennial Cropping Systems. Agric. For. Meteorol. 2018, 253, 151–160. [Google Scholar] [CrossRef]
  15. Lal, R. Soil Carbon Sequestration Impacts on Global Climate Change and Food Security. Science 2004, 304, 1623–1627. [Google Scholar] [CrossRef] [Green Version]
  16. Lal, R. Global Potential of Soil Carbon Sequestration to Mitigate the Greenhouse Effect. Crit. Rev. Plant. Sci. 2003, 22, 151–184. [Google Scholar] [CrossRef]
  17. Mueller, N.; James, D.; Gerber, S.; Matt, J.; Deepak, K.R.; Navin, R.; Jonathan, A.F. Closing Yield Gaps through Nutrient and Water Management. Nature 2012, 490, 254–257. [Google Scholar] [CrossRef] [PubMed]
  18. Öborn, I.; Vanlauwe, B.; Phillips, M.; Thomas, R.; Brooijmans, W.; Atta-Krah, K. Sustainable Intensification in Smallholder Agriculture: An. Integrated Systems Research Approach; Öborn, I., Vanlauwe, B., Phillips, M., Thomas, R., Brooijmans, W., Atta-Krah, K., Eds.; Earthscan Food and Agriculture Series: London, UK; Routledge Taylor and Francis Group: New York, NY, USA, 2017. [Google Scholar]
  19. Swallow, M.B.; Goddard, T.W. Value Chains for Bio-Carbon Sequestration Services: Lessons from Contrasting Cases in Canada, Kenya and Mozambique. Land Use Policy 2013, 31, 81–89. [Google Scholar] [CrossRef]
  20. Paris Agreement. Paper Presented at the Conference of the Parties to the United Nations Framework Convention on Climate Change; 21st Session; FCCC: Paris, France, 2015. [Google Scholar]
  21. Government, K. National Climate Change Action Plan 2018-2022; Ministry of Environment and Forestry: Nairobi, Kenya, 2018. [Google Scholar]
  22. Government, Kenya. National Climate Change Action Plan 2013–2017. 258; Ministry of Environment and Mineral Resources: Nairobi, Kenya, 2013.
  23. Ylva, N.; Jonsson, M.; Ambjörnsson, E.L.; Wetterlind, J.; Öborn, I. Smallholders’ Awareness of Adaptation and Coping Measures to Deal with Rainfall Variability in Western Kenya. Agroecol. Sustain. Food 2020, 44, 1–29. [Google Scholar]
  24. Sikstus, G.; Sumeni, S.; Sabodin, R.; Muqfi, I.H.; Nur, M.; Hairiah, K.; Useng, D.; van Noordwijk, M. Soil Organic Matter, Mitigation of and Adaptation to Climate Change in Cocoa–Based Agroforestry Systems. Land 2020, 9, 323. [Google Scholar]
  25. Elizabeth, B.; Ringler, C.; Okoba, B.; Roncoli, C.; Silvestri, S.; Herrero, M. Adapting Agriculture to Climate Change in Kenya: Household Strategies and Determinants. J. Environ. Manag. 2013, 114, 26–35. [Google Scholar]
  26. FAO. Adapting to Climate Change through Land and Water Management in Eastern Africa—Results of Pilot Projects in Ethiopia, Kenya and Tanzania; FAO, Ed.; FAO: Rome, Italy, 2014. [Google Scholar]
  27. Amy, Q.; Neufeldt, H.; McCabe, J.T. Building Livelihood Resilience: What Role Does Agroforestry Play? Clim. Dev. 2019, 11, 485–500. [Google Scholar]
  28. Vermeulen, S.J.; Aggarwal, P.K.; Ainslie, A.; Angelone, C.; Campbell, B.M.; Challinor, A.J.; Hansen, J.W.; Ingram, J.S.I.; Jarvis, A.; Kristjanson, P. Options for Support to Agriculture and Food Security under Climate Change. Environ. Sci. Policy 2012, 15, 136–144. [Google Scholar] [CrossRef]
  29. Nair, P.K.R.; Vimala, D.; Nair, M.; Kumar, B.; Solomon, G.H. Soil Carbon Sequestration in Tropical Agroforestry Systems: A Feasible Appraisal. Environ. Sci. Policy 2009, 12, 1099–1111. [Google Scholar] [CrossRef]
  30. UNFCCC. Nationally Determined Contributions (Ndcs). United Nations Framework Convention on Climate Change. Available online: https://unfccc.int/process-and-meetings/the-paris-agreement/nationally-determined-contributions-ndcs#eq-2 (accessed on 30 August 2019).
  31. Stefanie, E.; Muller, A. Payments for Environmental Services to Promote Climate-Smart Agriculture? Potential and Challenges. Agric. Econ. 2016, 47, 173–184. [Google Scholar]
  32. Kelley, H.; Goldstein, A. Ahead of the Curve—State of the Voluntary Carbon Markets 2015; Peters-Stanley, M., Gonzalez, G., Eds.; Ecosystem Marketplace—A Forest trends initiative: Washington, DC, USA, 2015. [Google Scholar]
  33. Stringer, L.C.; Dougill, A.J.; Thomas, A.D.; Spracklen, D.V.; Chesterman, S.; Speranza, C.I.; Rueff, H.; Riddell, M.; Williams, M.; Beedy, T.; et al. Challenges and Opportunities in Linking Carbon Sequestration, Livelihoods and Ecosystem Service Provision in Drylands. Environ. Sci. Policy 2012, 19–20, 121–135. [Google Scholar] [CrossRef] [Green Version]
  34. Kelley, H.; Goldstein, A. Raising Ambition: State of the Voluntary Carbon Markets 2016; Ecosystem Marketplace: Washington, DC, USA, 2016. [Google Scholar]
  35. Henry, M.H.; Tittonell, P.; Manlay, R.J.; Bernoux, M.; Albrecht, A.; Vanlauwe, B. Biodiversity, Carbon Stocks and Sequestration Potential in Aboveground Biomass in Smallholder Farming Systems of Western Kenya. Agr. Ecosyst. Environ. 2009, 129, 238–252. [Google Scholar] [CrossRef]
  36. Cheikh, M.; van Noordwijk, M.; Luedeling, E.; Neufeldt, H.; Minang, P.A.; Kowero, G. Agroforestry Solutions to Address Food Security and Climate Change Challenges in Africa. Curr. Opin. Environ. Sustain. 2014, 6, 61–67. [Google Scholar]
  37. Johannes, W. Project Information Document (Pid) Kenya Agricultural Carbon Project (Kacp); World Bank: Washington, DC, USA, 2010. [Google Scholar]
  38. Amos, W.; Jönsson, M. Sustainable Agriculture Land Management. A Training Material. Vi Agroforestry. Available online: http://www.viagroforestry.org/who-we-are/resources/publications/ (accessed on 8 January 2015).
  39. Bouman, F.J.A. Rotating and Accumulating Savings and Credit Associations: A Development Perspective. World Dev. 1995, 23, 371–384. [Google Scholar] [CrossRef]
  40. Atela, J.O. The Politics of Agricultural Carbon Finance: The Case of the Kenya Agricultural Carbon Project, STEPS Working Paper 49; STEPS Centre: Brighton, UK, 2012; 44p, Available online: www.steps-centre.org (accessed on 5 June 2017).
  41. Cavanagh, C.J.; Chemarum, A.K.; Vedeld, P.O.; Petursson, J.G. Old Wine, New Bottles? Investigating the Differential Adoption of ‘Climate-Smart’ Agricultural Practices in Western Kenya. J. Rural Stud. 2017, 56, 114–123. [Google Scholar] [CrossRef]
  42. Karl, H.; Morgan, S.; Baylis, K.; Oduol, J.; Smith-Dumont, E.; Vagen, T.; Mutemi, M.; LePage, C.; Kegode, H. Assessing the Downstream Socioeconomic Impacts of Agroforestry in Kenya. In ICRAF Working Paper No 291; World Agroforestry: Nairobi, Kenya, 2018. [Google Scholar]
  43. Lee, J. Farmer Participation in a Climate-Smart Future: Evidence from the Kenya Agricultural Carbon Market Project. Land Use Policy 2017, 68, 72–79. [Google Scholar] [CrossRef]
  44. Lee, J.L.; Martin, A.; Kristjanson, P.; Wollenberg, E. Implications on Equity in Agricultural Carbon Market Projects: A Gendered Analysis of Access, Decision Making, and Outcomes. Environ. Plan. A 2015, 47, 2080–2096. [Google Scholar] [CrossRef]
  45. Seth, S.; Heiner, K.; Kapukha, M.; Kiguli, L.; Masiga, M.; Kalunda, P.N.; Ssempala, A.; Recha, J.; Wekesa, A. Building Local Institutional Capacity to Implement Agricultural Carbon Projects: Participatory Action Research with Vi Agroforestry in Kenya and Ecotrust in Uganda. Agric. Food Sec. 2016, 5, 13. [Google Scholar]
  46. Öborn, I.; Wekesa, A.; Natongo, P.; Kiguli, L.; Wachiye, E.; Musee, C.; Kuyah, S.; Neves, B. Who Enjoys Smallholder Generated Carbon Benefits? In Co-Investment in Ecosystem Services: Global Lessons from Payment and Incentive Schemes; Namirembe, S., Leimona, B., van Noordwijk, M., Minang, P., Eds.; World Agroforestry Centre: Nairobi, Kenya, 2017; pp. 1–10. [Google Scholar]
  47. Mutua, W. Kenya Agricultural Carbon Project Monitoring Report. Vi Agroforestry. Available online: https://www.vcsprojectdatabase.org/#/project_details/12252012 (accessed on 12 December 2018).
  48. Matthias, S.; Tennigkeit, T.; Zanchi, G.; Bird, N. Technical Guidelines—Activity Baseline and Monitoring Survey Guideline for Sustainable Agricultural Land Management Practices (Salm); UNIQUE forestry consultants: Freiburg, Germany, 2010. [Google Scholar]
  49. Lager, B. Vcs Project Description Kenya Agricultural Carbon Project. Kisumu; Vi Agroforestry: Kisumu, Kenya, 2012. [Google Scholar]
  50. R: A Language and Environment for Statistical Computing. R Foundation for Statistical Computing, Vienna, Austria. Available online: http://www.r-project.org/index.html (accessed on 5 May 2019).
  51. Wei, W.; Feng, X.; Yang, L.; Chen, L.; Feng, T.; Chen, D. The Effects of Terracing and Vegetation on Soil Moisture Retention in a Dry Hilly Catchment in China. Sci. Total Environ. 2019, 647, 1323–1332. [Google Scholar] [CrossRef]
  52. Tejendra, C.; Raizada, M.N. Agronomic Challenges and Opportunities for Smallholder Terrace Agriculture in Developing Countries. Front. Plant. Sci. 2017, 8. [Google Scholar] [CrossRef] [Green Version]
  53. Ngome, A.F.E.; Becker, M.; Mtei, K.M. Leguminous Cover Crops Differentially Affect Maize Yields in Three Contrasting Soil Types of Kakamega, Western Kenya. J. Agric. Rural Dev. Trop. 2011, 112, 1–10. [Google Scholar]
  54. Sommer, R.; Mukalama, J.; Kihara, J.; Koala, S.; Winowiecki, L.; Bossio, D. Nitrogen Dynamics and Nitrous Oxide Emissions in a Long-Term Trial on Integrated Soil Fertility Management in Western Kenya. Nutr. Cycl. Agroecosyst. 2016, 105, 229–248. [Google Scholar] [CrossRef]
  55. Biamah, E.K.; Gichuki, F.N.; Kaumbutho, P.G. Tillage Method and Soil and Water Conservation in East Africa. Soil Till Res. 1993, 27, 105–123. [Google Scholar] [CrossRef]
  56. Ndoli, A.; Baudron, F.; Sida, T.S.; Schut, A.G.T.; van Heerwaarden, J.; Giller, K.E. Conservation Agriculture with Trees Amplifies Negative Effects of Reduced Tillage on Maize Performance in East Africa. Field Crop. Res. 2018, 221, 238–244. [Google Scholar] [CrossRef]
  57. Kiboi, M.N.; Ngetich, K.F.; Diels, J.; Mucheru-Muna, M.; Mugwe, J.; Mugendi, D.N. Minimum Tillage, Tied Ridging and Mulching for Better Maize Yield and Yield Stability in the Central Highlands of Kenya. Soil Till. Res. 2017, 170, 157–166. [Google Scholar] [CrossRef]
  58. Potma, G.; Carlos, D.R.J.; Mishra, U.; Furlan, F.J.F.; Ferreira, L.A.; Inagaki, T.M.; Romaniw, J.; Ferreira, A.; Briedis, C. Soil Carbon Inventory to Quantify the Impact of Land Use Change to Mitigate Greenhouse Gas Emissions and Ecosystem Services. Environ. Pollut. 2018, 243, 940–952. [Google Scholar] [CrossRef]
  59. Sommer, R.; Paul, B.K.; Mukalama, J.; Kihara, J. Reducing Losses but Failing to Sequester Carbon in Soils—the Case of Conservation Agriculture and Integrated Soil Fertility Management in the Humid Tropical Agro-Ecosystem of Western Kenya. Agric. Ecosyst. Environ. 2018, 254, 82–91. [Google Scholar] [CrossRef]
  60. Kamau, M.; Smale, M.; Mutua, M. Farmer Demand for Soil Fertility Management Practices in Kenya’s Grain Basket. Food Sec. 2014, 6, 793–806. [Google Scholar] [CrossRef]
  61. Phuong, L.T.H.; Biesbroek, G.R.; Sen, L.T.H.; Wals, A.E.J. Understanding Smallholder Farmers’ Capacity to Respond to Climate Change in a Coastal Community in Central Vietnam. Clim. Dev. 2018, 10, 701–716. [Google Scholar] [CrossRef]
  62. Shem, K.; Öborn, I.; Jonsson, M.; Dahlin, A.S.; Barrios, E.; Muthuri, C.; Malmer, A.; Nyaga, J.; Magaju, C.; Namirembe, S.; et al. Trees in Agricultural Landscapes Enhance Provision of Ecosystem Services in Sub-Saharan Africa. IJBESM 2016, 12, 255–273. [Google Scholar]
  63. Esteban, L.M.; Zema, D.A.; Carrà, B.G.; Cerdà, A.; Plaza-Alvarez, P.A.; Cózar, J.S.; Gonzalez-Romero, J.; Moya, D.; de las Heras, J. Short-Term Changes in Infiltration between Straw Mulched and Non-Mulched Soils after Wildfire in Mediterranean Forest Ecosystems. Ecol. Eng. 2018, 122, 27–31. [Google Scholar]
  64. Kihara, J.; Bationo, A.; Waswa, B.; Kimetu, J.M.; Vanlauwe, B.; Okeyo, J.; Mukalama, J.; Martius, C. Effect of Reduced Tillage and Mineral Fertilizer Application on Maize and Soybean Productivity. Exp. Agric. 2011, 48, 159–175. [Google Scholar] [CrossRef]
  65. Castellanos-Navarrete, A.; Tittonell, P.; Rufino, M.C.; Giller, K.E. Feeding, Crop Residue and Manure Management for Integrated Soil Fertility Management—A Case Study from Kenya. Agric. Syst. 2015, 134, 24–35. [Google Scholar] [CrossRef]
  66. Lagerkvist, C.J.; Shikuku, K.; Okello, J.; Karanja, N.; Ackello-Ogutu, C. A Conceptual Approach for Measuring Farmers’ Attitudes to Integrated Soil Fertility Management in Kenya. NJAS Wagen. J. Life Sci. 2015, 74–75, 17–26. [Google Scholar] [CrossRef] [Green Version]
  67. Ndoli, A.; Baudron, F.; Antonius, G.; Schut, T.; Athanase, M.; Giller, K.E. Disentangling the Positive and Negative Effects of Trees on Maize Performance in Smallholdings of Northern Rwanda. Field Crop. Res. 2017, 213, 1–11. [Google Scholar] [CrossRef]
  68. Abubeker, H.; Talore, D.G.; Tesfamariam, E.H.; Friend, M.A.; Mpanza, T.D.E. Potential Use of Forage-Legume Intercropping Technologies to Adapt to Climate-Change Impacts on Mixed Crop-Livestock Systems in Africa: A Review. Reg. Environ. Chang. 2017, 17, 1713–1724. [Google Scholar]
  69. Kurniatun, H.; Widianto, W.; Suprayogo, D.; van Noordwijk, M. Tree Roots Anchoring and Binding Soil: Reducing Landslide Risk in Indonesian Agroforestry. Land 2020, 9, 256. [Google Scholar]
  70. Ylva, N.; Wetterlind, J.; Jonsson, M.; Öborn, I. The Role of Trees and Livestock in Ecosystem Service Provision and Farm Priorities on Smallholder Farms in the Rift Valley, Kenya. Agric. Syst. 2020, 181, 102815. [Google Scholar]
  71. Diwani, T.N.; Asch, F.; Becker, M.; Mussgnug, F. Characterizing Farming Systems around Kakamega Forest, Western Kenya, for Targeting Soil Fertility-Enhancing Technologies. J. Plant. Nutr. Soil Sci. 2013, 176, 585–594. [Google Scholar] [CrossRef]
  72. FAO. Faostat—Maize Yields Kenya 2009–2012. In Food and Agriculture Data; FAOSTAT: Food and Agriculture Organization of the United Nations: Rome, Italy, 2013; Available online: http://www.fao.org/faostat/en/#data/QC (accessed on 17 May 2019).
  73. Yongshan, C.; Camps-Arbestain, M.; Shen, Q.; Singh, B.; Cayuela, M.L. The Long-Term Role of Organic Amendments in Building Soil Nutrient Fertility: A Meta-Analysis and Review. Nutr. Cycl. Agroecosyst. 2018, 111, 103–125. [Google Scholar]
  74. Vanlauwe, B.; Barrios, E.; Robinson, T.; van Asten, P.; Zingore, S.; Gérard, B. System Productivity and Natural Resource Integrity in Smallholder Farming: Friends or Foes? In Sustainable Intensification in Smallholder Agriculture: An. Integrated Systems Research Approach; Öborn, I., Vanlauwe, B., Phillips, M., Thomas, R., Brooijmans, W., Atta-Krah, K., Eds.; Routledge: London, UK, 2017; pp. 159–176. [Google Scholar]
  75. Erenstein, O. Smallholder Conservation Farming in the Tropics and Sub-Tropics: A Guide to the Development and Dissemination of Mulching with Crop Residues and Cover Crops. Agric. Ecosys. Environ. 2003, 100, 17–37. [Google Scholar] [CrossRef]
  76. Kalungu, J.W.; Filho, W.L. Adoption of Appropriate Technologies among Smallholder Farmers in Kenya. Clim. Dev. 2018, 10, 84–96. [Google Scholar] [CrossRef] [Green Version]
  77. Pramila, K.; Patnam, M. Neighbors and Extension Agents in Ethiopia: Who Matters More for Technology Adoption? Am. J. Agric. Econ. 2014, 96, 308–327. [Google Scholar]
  78. Stefanovic, J.O.; Yang, H.; Zhou, Y.; Kamali, B.; Ogalleh, S.A. Adaption to Climate Change: A Case Study of Two Agricultural Systems from Kenya. Clim. Dev. 2017, 11, 319–337. [Google Scholar] [CrossRef]
  79. Helth, L.J.; Rasmussen, O.D. Can Microfinance Reach the Poorest: Evidence from a Community-Managed Microfinance Intervention. World Dev. 2014, 64, 460–472. [Google Scholar]
  80. Brannen, C.F. An Impact Study of the Village Savings and Loan Association (Vsla) Program in Zanzibar, Tanzania. Bachelor’s Thesis, Wesleyan University, Middletown, CT, USA, 2010. [Google Scholar]
  81. Kearney, S.P.; Fonte, S.J.; García, E.; Siles, P.; Chan, K.M.A.; Smukler, S.M. Evaluating Ecosystem Service Trade-Offs and Synergies from Slash-and-Mulch Agroforestry Systems in El Salvador. Ecol. Indic. 2017, 105, 264–278. [Google Scholar] [CrossRef]
  82. Moushumi, C.; Ajayi, O.C.; Hellin, J.; Neufeldt, H. Climate Change Adaptation and Social Protection in Agroforestry Systems: Enhancing Adaptive Capacity and Minimizing Risk of Drought in Zambia and Honduras. In ICRAF Working Papers; World Agroforestry Centre: Nairobi, Kenya, 2011. [Google Scholar]
  83. Andersson, A. Kenya Agricultural Carbon Project Monitoring Report. Vi Agroforestry. 2016. Available online: https://www.vcsprojectdatabase.org/#/project_details/1225 (accessed on 1 September 2018).
  84. FAO. Agro-Ecological Zoning Guidelines; Food and Agriculture Organisation of the United Nations: Rome, Italy, 1996; Available online: http://www.fao.org/docrep/W2962E/W2962E00.htm (accessed on 13 September 2014).
  85. FAO/IIASA/ISRIC/ISSCAS/JRC. Harmonized World Soil Database (Version 1.1). FAO, Rome, Italy and IIASA, Luxenburg, Austria. Available online: http://www.iiasa.ac.at/Research/LUC/External-World-soil-database/HTML/ (accessed on 15 March 2018).
  86. USGS. Shuttle Radar Topography Mission (Srtm) 1 Arc-Second Global. Elevation Data. US Geological Survey. Available online: https://lta.cr.usgs.gov/SRTM1Arc (accessed on 3 February 2018).
  87. KNBS. Population Distribution by Sex, Number of Households, Area and Density by County and District. In 2009 Population and Housing Census; Kenya National Bureau of Statistics 5, Ed.; KNBS: Nairobi, Kenya. Available online: https://www.knbs.or.ke/download/population-distribution-by-sex-number-of-households-area-and-density-by-county-and-district/ (accessed on 14 August 2017).
Figure 1. Left: Kenya Agricultural Carbon Project (KACP) areas; the Bungoma sites in Bungoma County (green) and the Kisumu sites in Kisumu and Siaya Counties (purple). Right: The KACP areas within East Africa.
Land 09 00389 g001
Figure 2. Available data for project and control farms over the years analysed and the scale of the analysis. All data were compared between project and control farms when possible, except for the effects of SALM and trees on maize yield.
Land 09 00389 g002
Figure 3. Diagram showing SALM uptake and implementation in fields in the two areas of Kisumu and Bungoma by project farmers and control farmers between 2009 (project start) and 2012. Data for control groups only available for 2012. Data for project farms in Kisumu in 2009 were lost due to a computer malfunction. N = 183 for control 2012, n = 208 for project 2009, n = 481 for project 2010, n = 591 for project 2011 and n = 495 for project 2012.
Land 09 00389 g003
Figure 4. The average number of trees per farm on project and control farms in 2012, divided between fodder, fruit, medicine, timber and other tree types. In total, 65% of all trees were 10 cm or less in diameter at breast height, meaning that they were probably planted within the project period (since 2009). Eucalyptus comprised 4.6% of trees on control farms and 2.7% on project farms. Data from a tree survey in Kisumu (n = 37 control farms, n = 90 project farms) and Bungoma (n = 38 control farms, n = 60 project farms).
Land 09 00389 g004
Figure 5. First-season (a,b) and second-season (c,d) maize yield kg ha−1 on project (blue) and control (green) farms in Kisumu (a,c) and Bungoma (b,d), 2009–2012. The lines indicate mean values for each distribution and the dotted line shows the mean for each sub-plot.
Land 09 00389 g005
Figure 6. Diagrams showing the three significant interactions identified, between: (a) year and treatment (p < 0.0001), (b) year and season (p = 0.004) and (c) region and season (p = 0.005) on maize yield in kg ha−1 for project and control farms.
Land 09 00389 g006
Figure 7. (a) Percentage (y-axis) of project and control farm households saving money on different numbers of occasions per month in 2012. (b) Percentage of project and control farm households saving different amounts on every saving occasion in 2012.
Land 09 00389 g007
Table 1. Maize yield (kg ha−1) for all project and control farms (measured on field level) in Bungoma and Kisumu. Values are mean ± standard deviation for all four years (2009–2012) and both seasons (1 and 2); n = number of farms included in the analysis.
YearSeasonPROJECT Bungoma
N = 96
CONTROL Bungoma
N = 55
PROJECT Kisumu
N = 85
CONTROL Kisumu
N = 44
ALL FARMS
N = 280
200911572 ± 12111169 ± 741725 ± 572494 ± 3971069 ± 981
201011925 ± 13561141 ± 9341055 ± 1037266 ± 1661239 ± 1203
201112647 ± 17561222 ± 9941371 ± 907702 ± 3901724 ± 1479
201212675 ± 13842015 ± 12791661 ± 14061075 ± 8401939 ± 1397
200921094 ± 1206518 ± 411565 ± 532321 ± 249638 ± 781
201021416 ± 1431706 ± 469902 ± 1023152 ± 101900 ± 1105
201121646 ± 1052783 ± 526957 ± 757354 ± 297945 ± 862
201221563 ± 9411054 ± 714937 ± 744678 ± 567982 ± 784

