Typology of Climate Change Adaptation Measures in Polish Cities up to 2030


Abstract
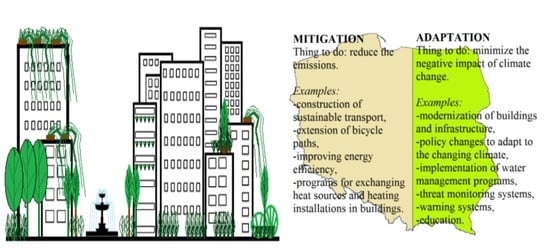
1. Introduction
2. Materials and Methods
3. Results
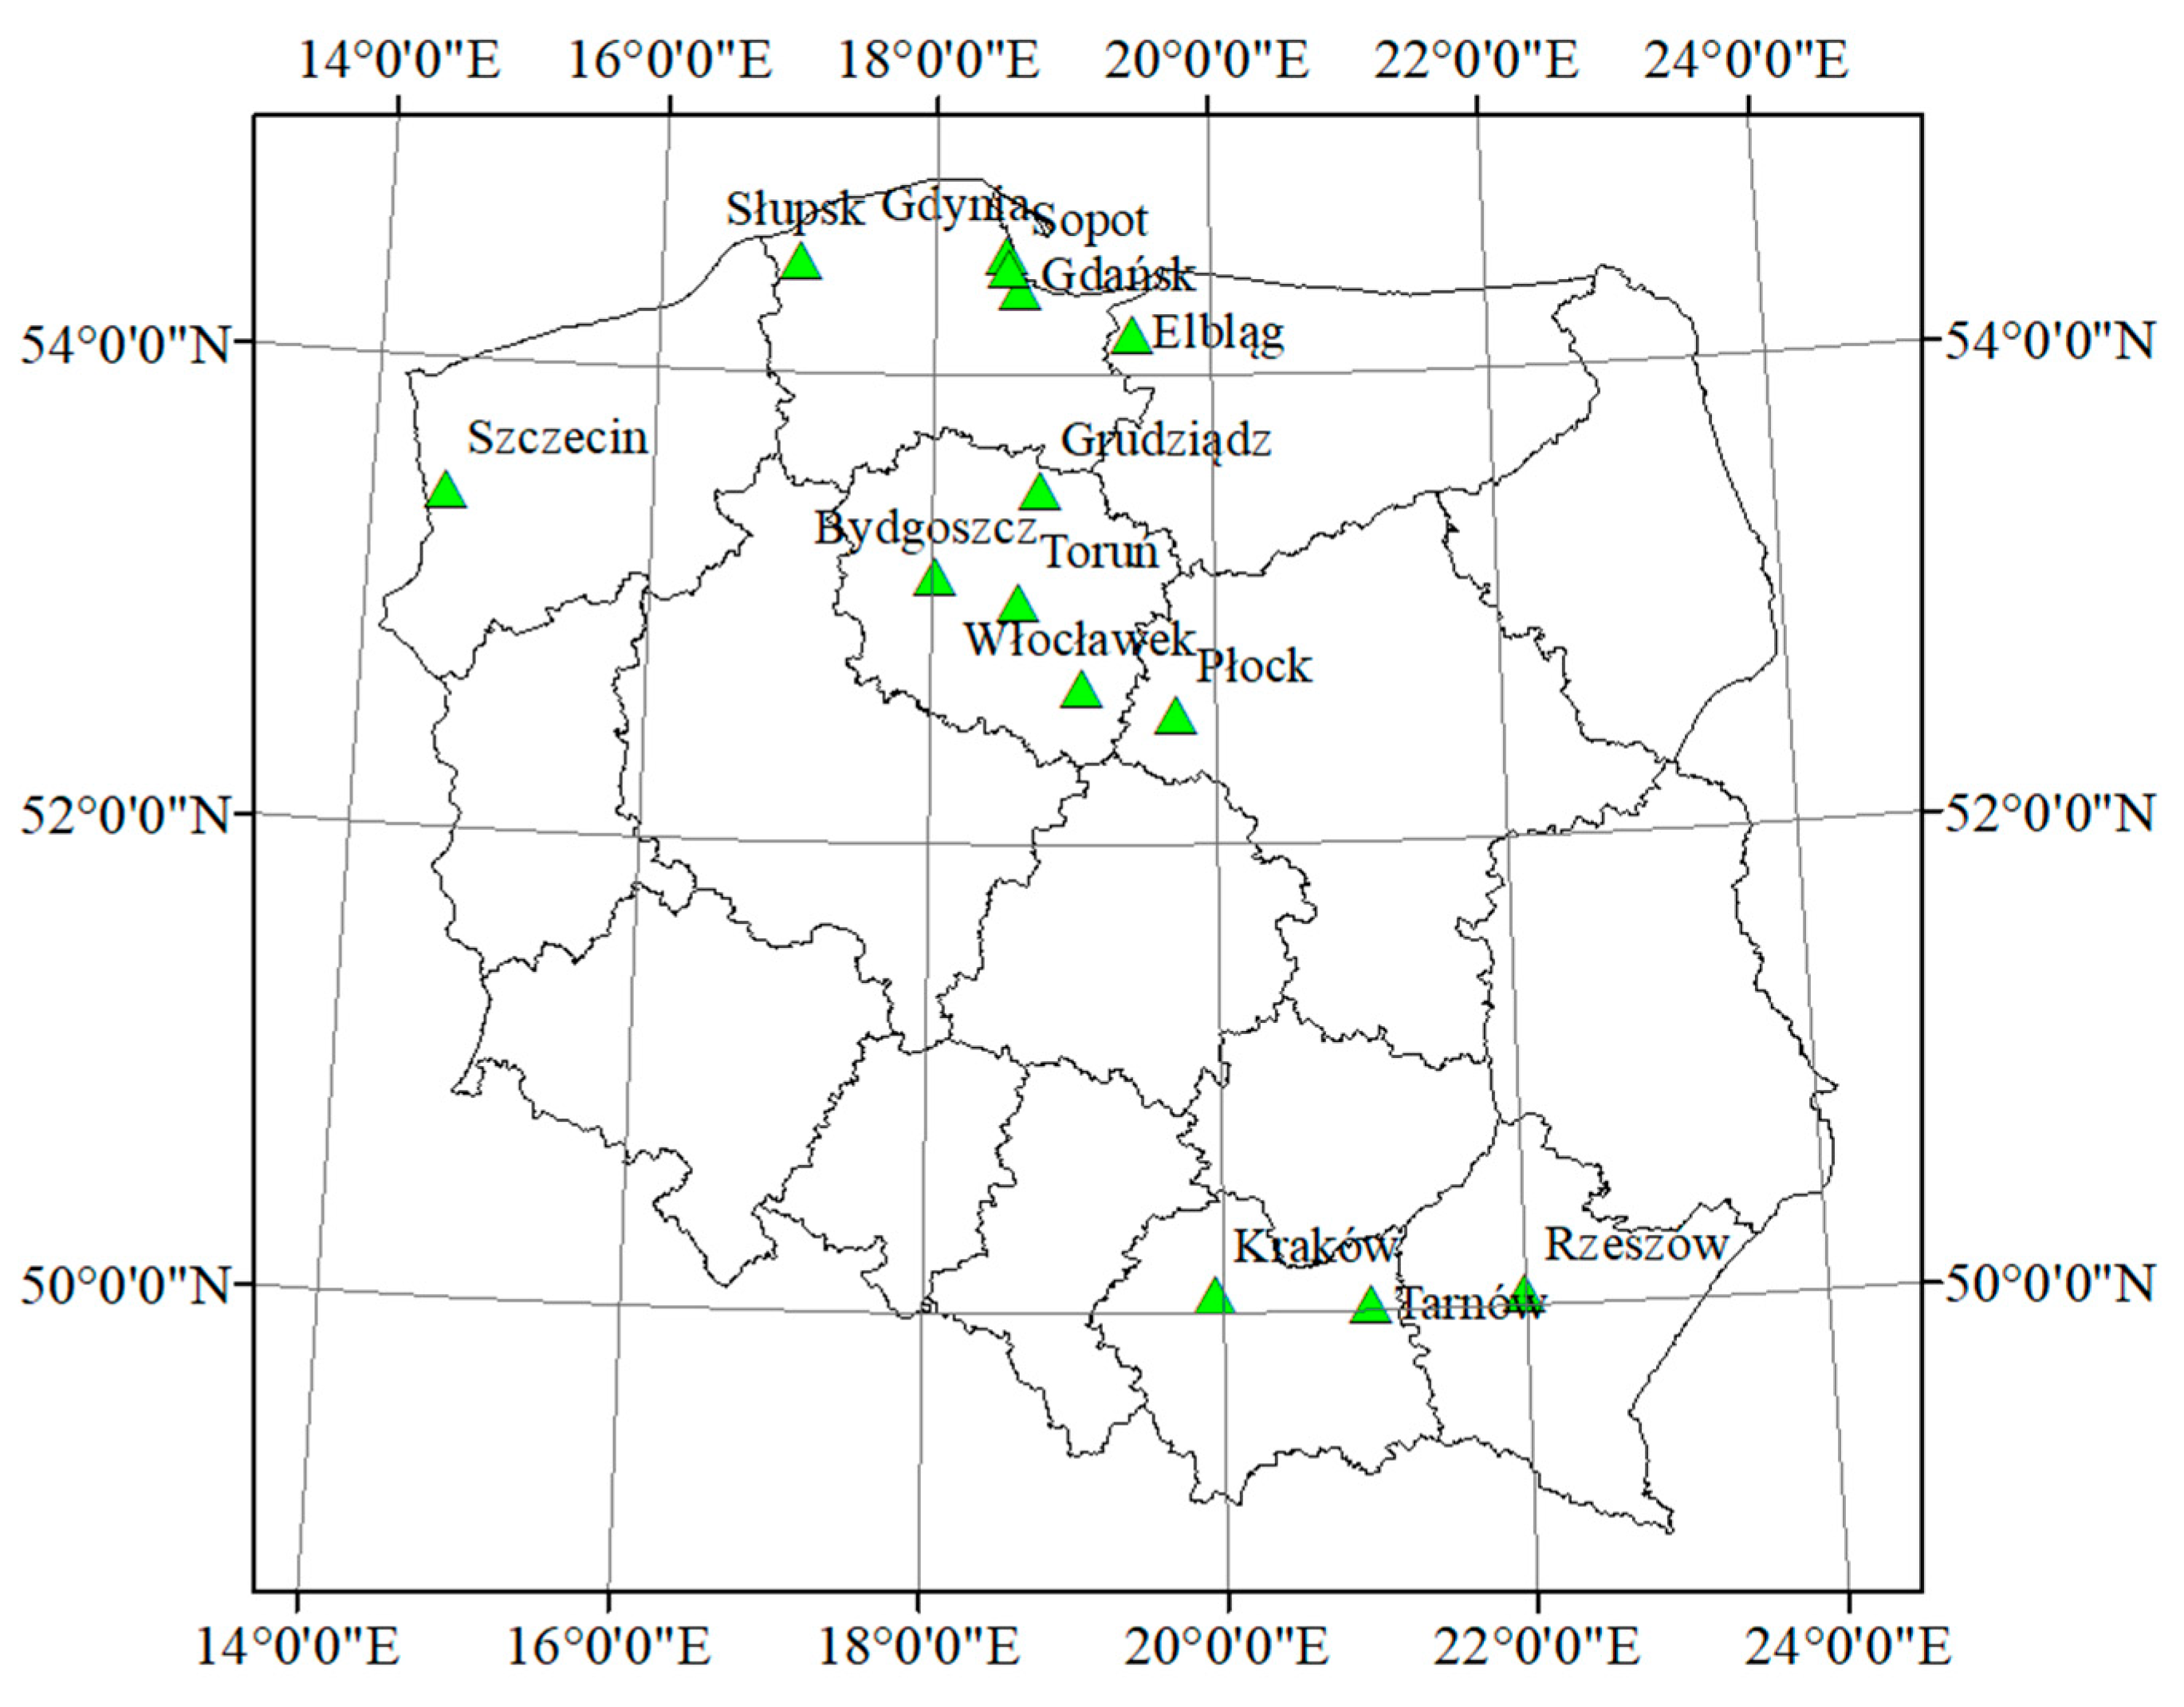
3.1. Identification of Climate Hazards in Selected Cities
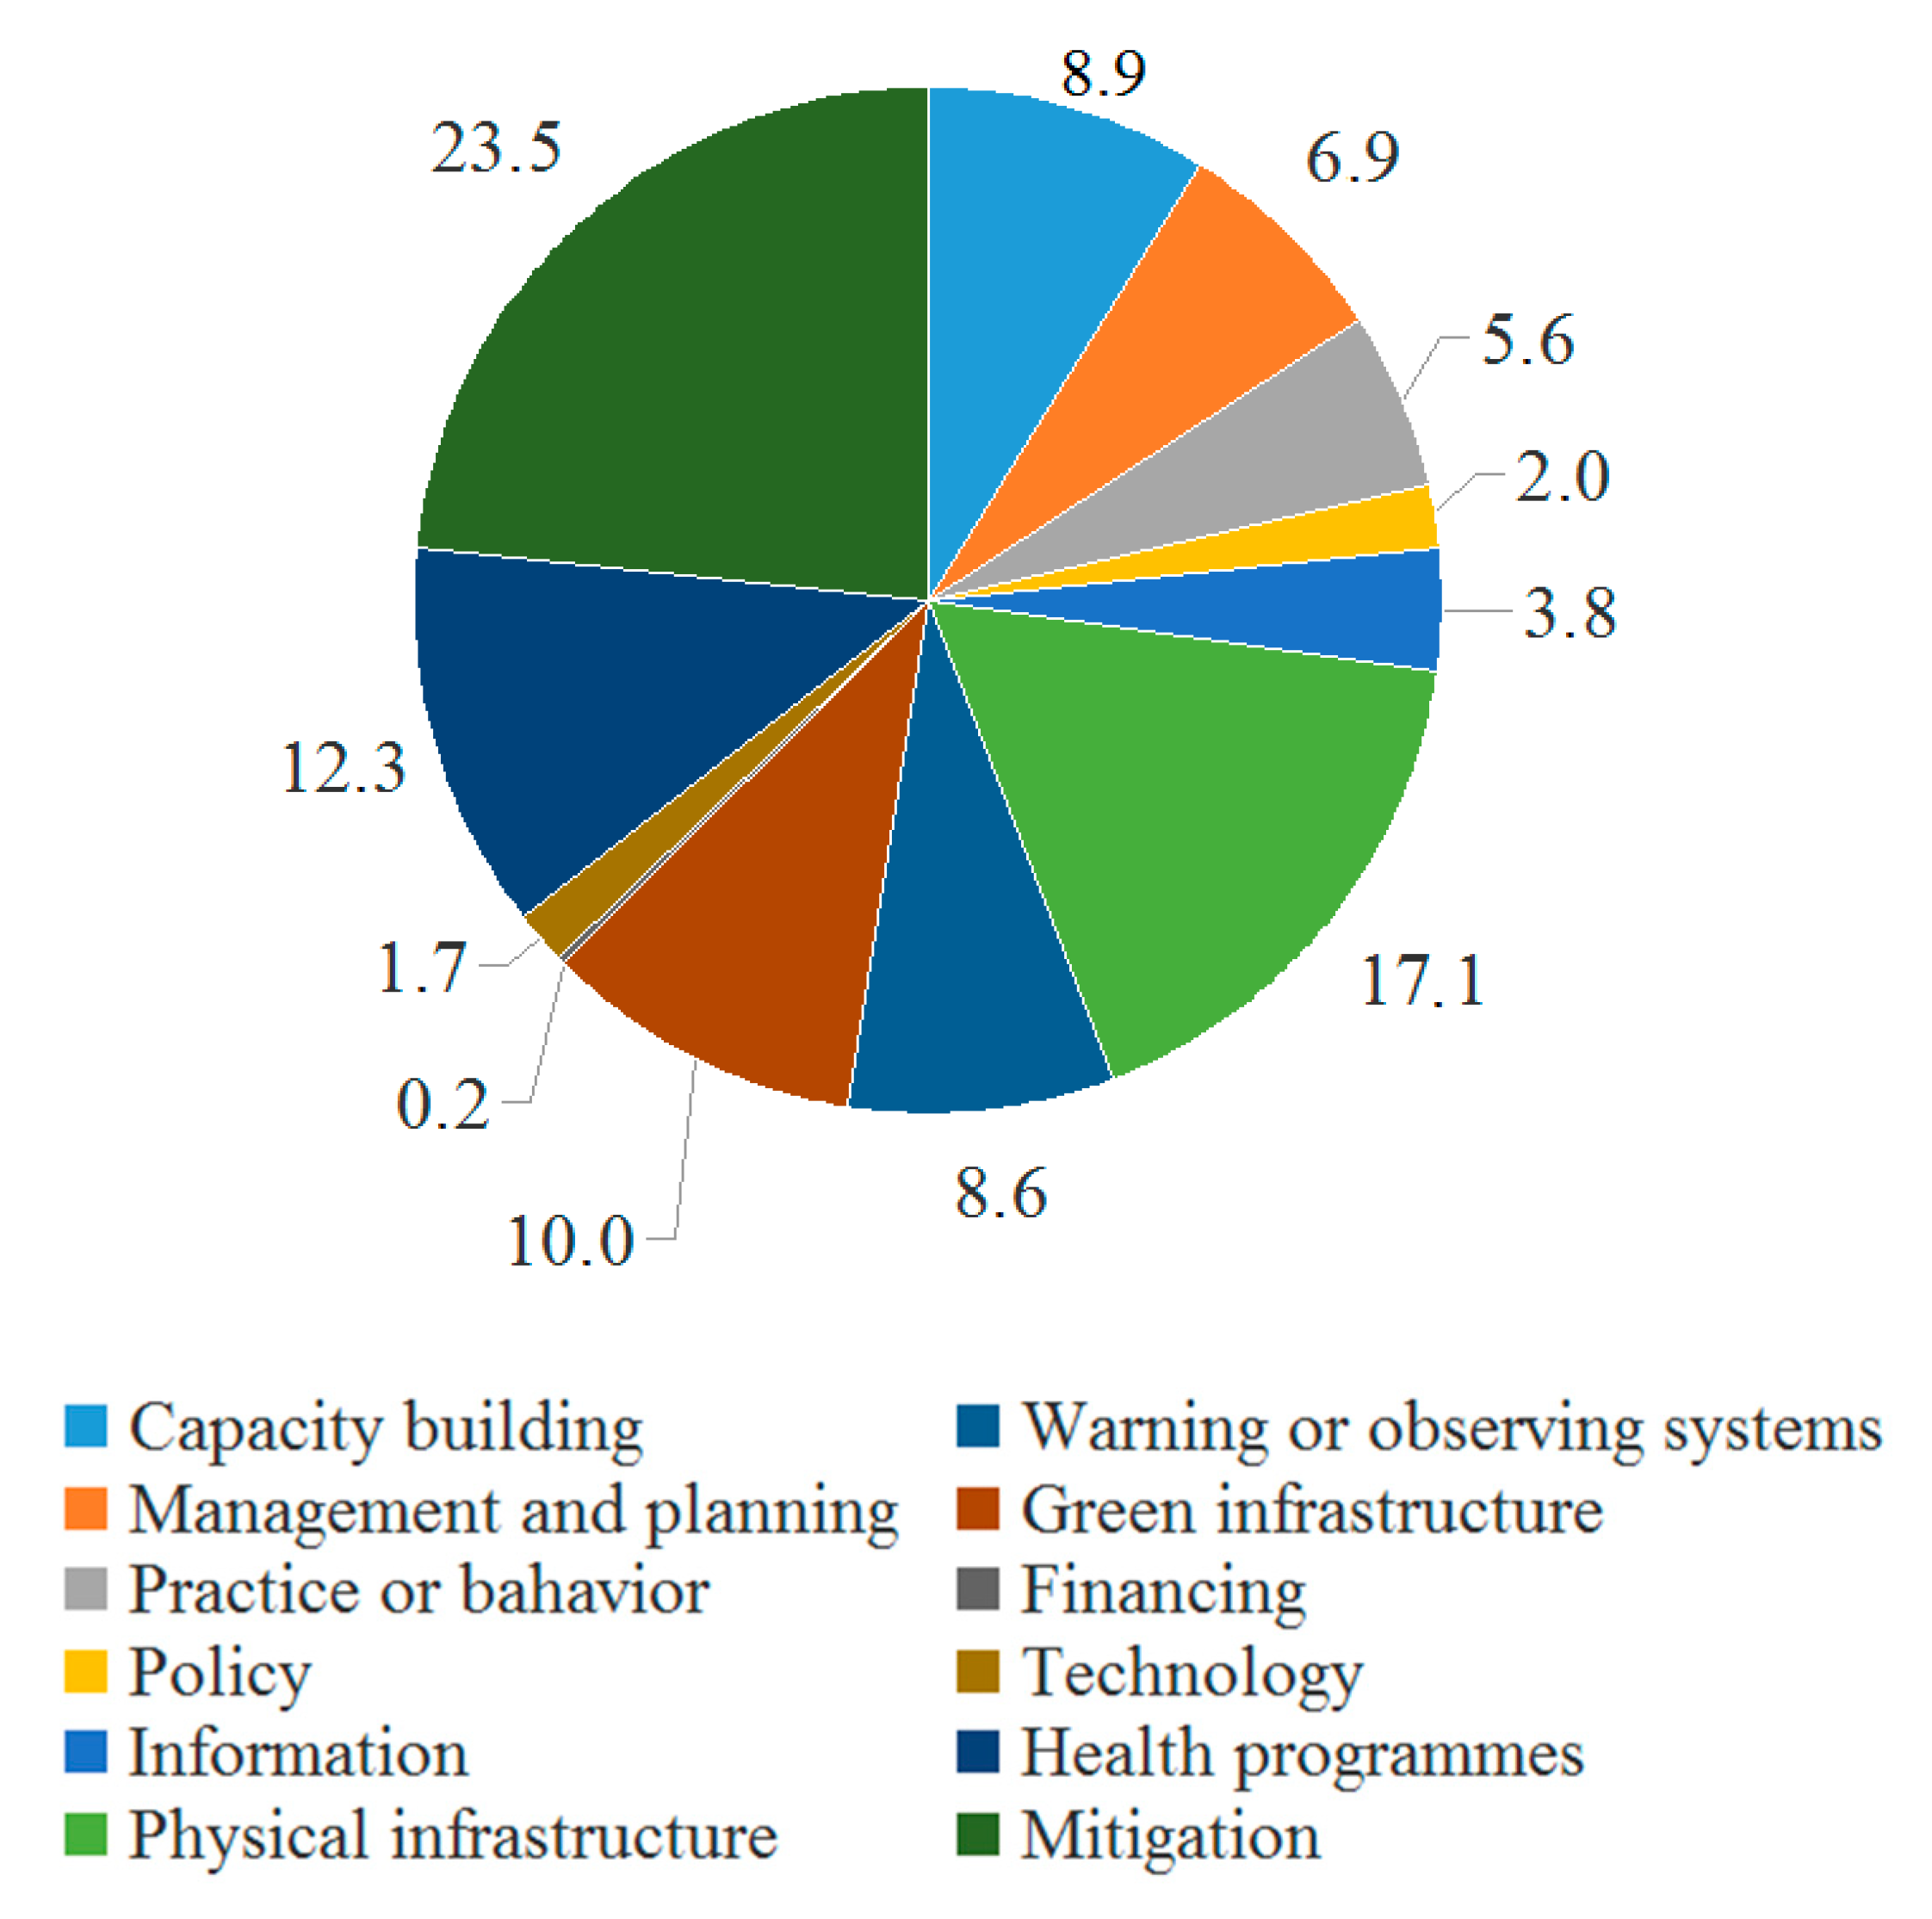
3.2. Quantitative Classification of Measures Projected for MAPs
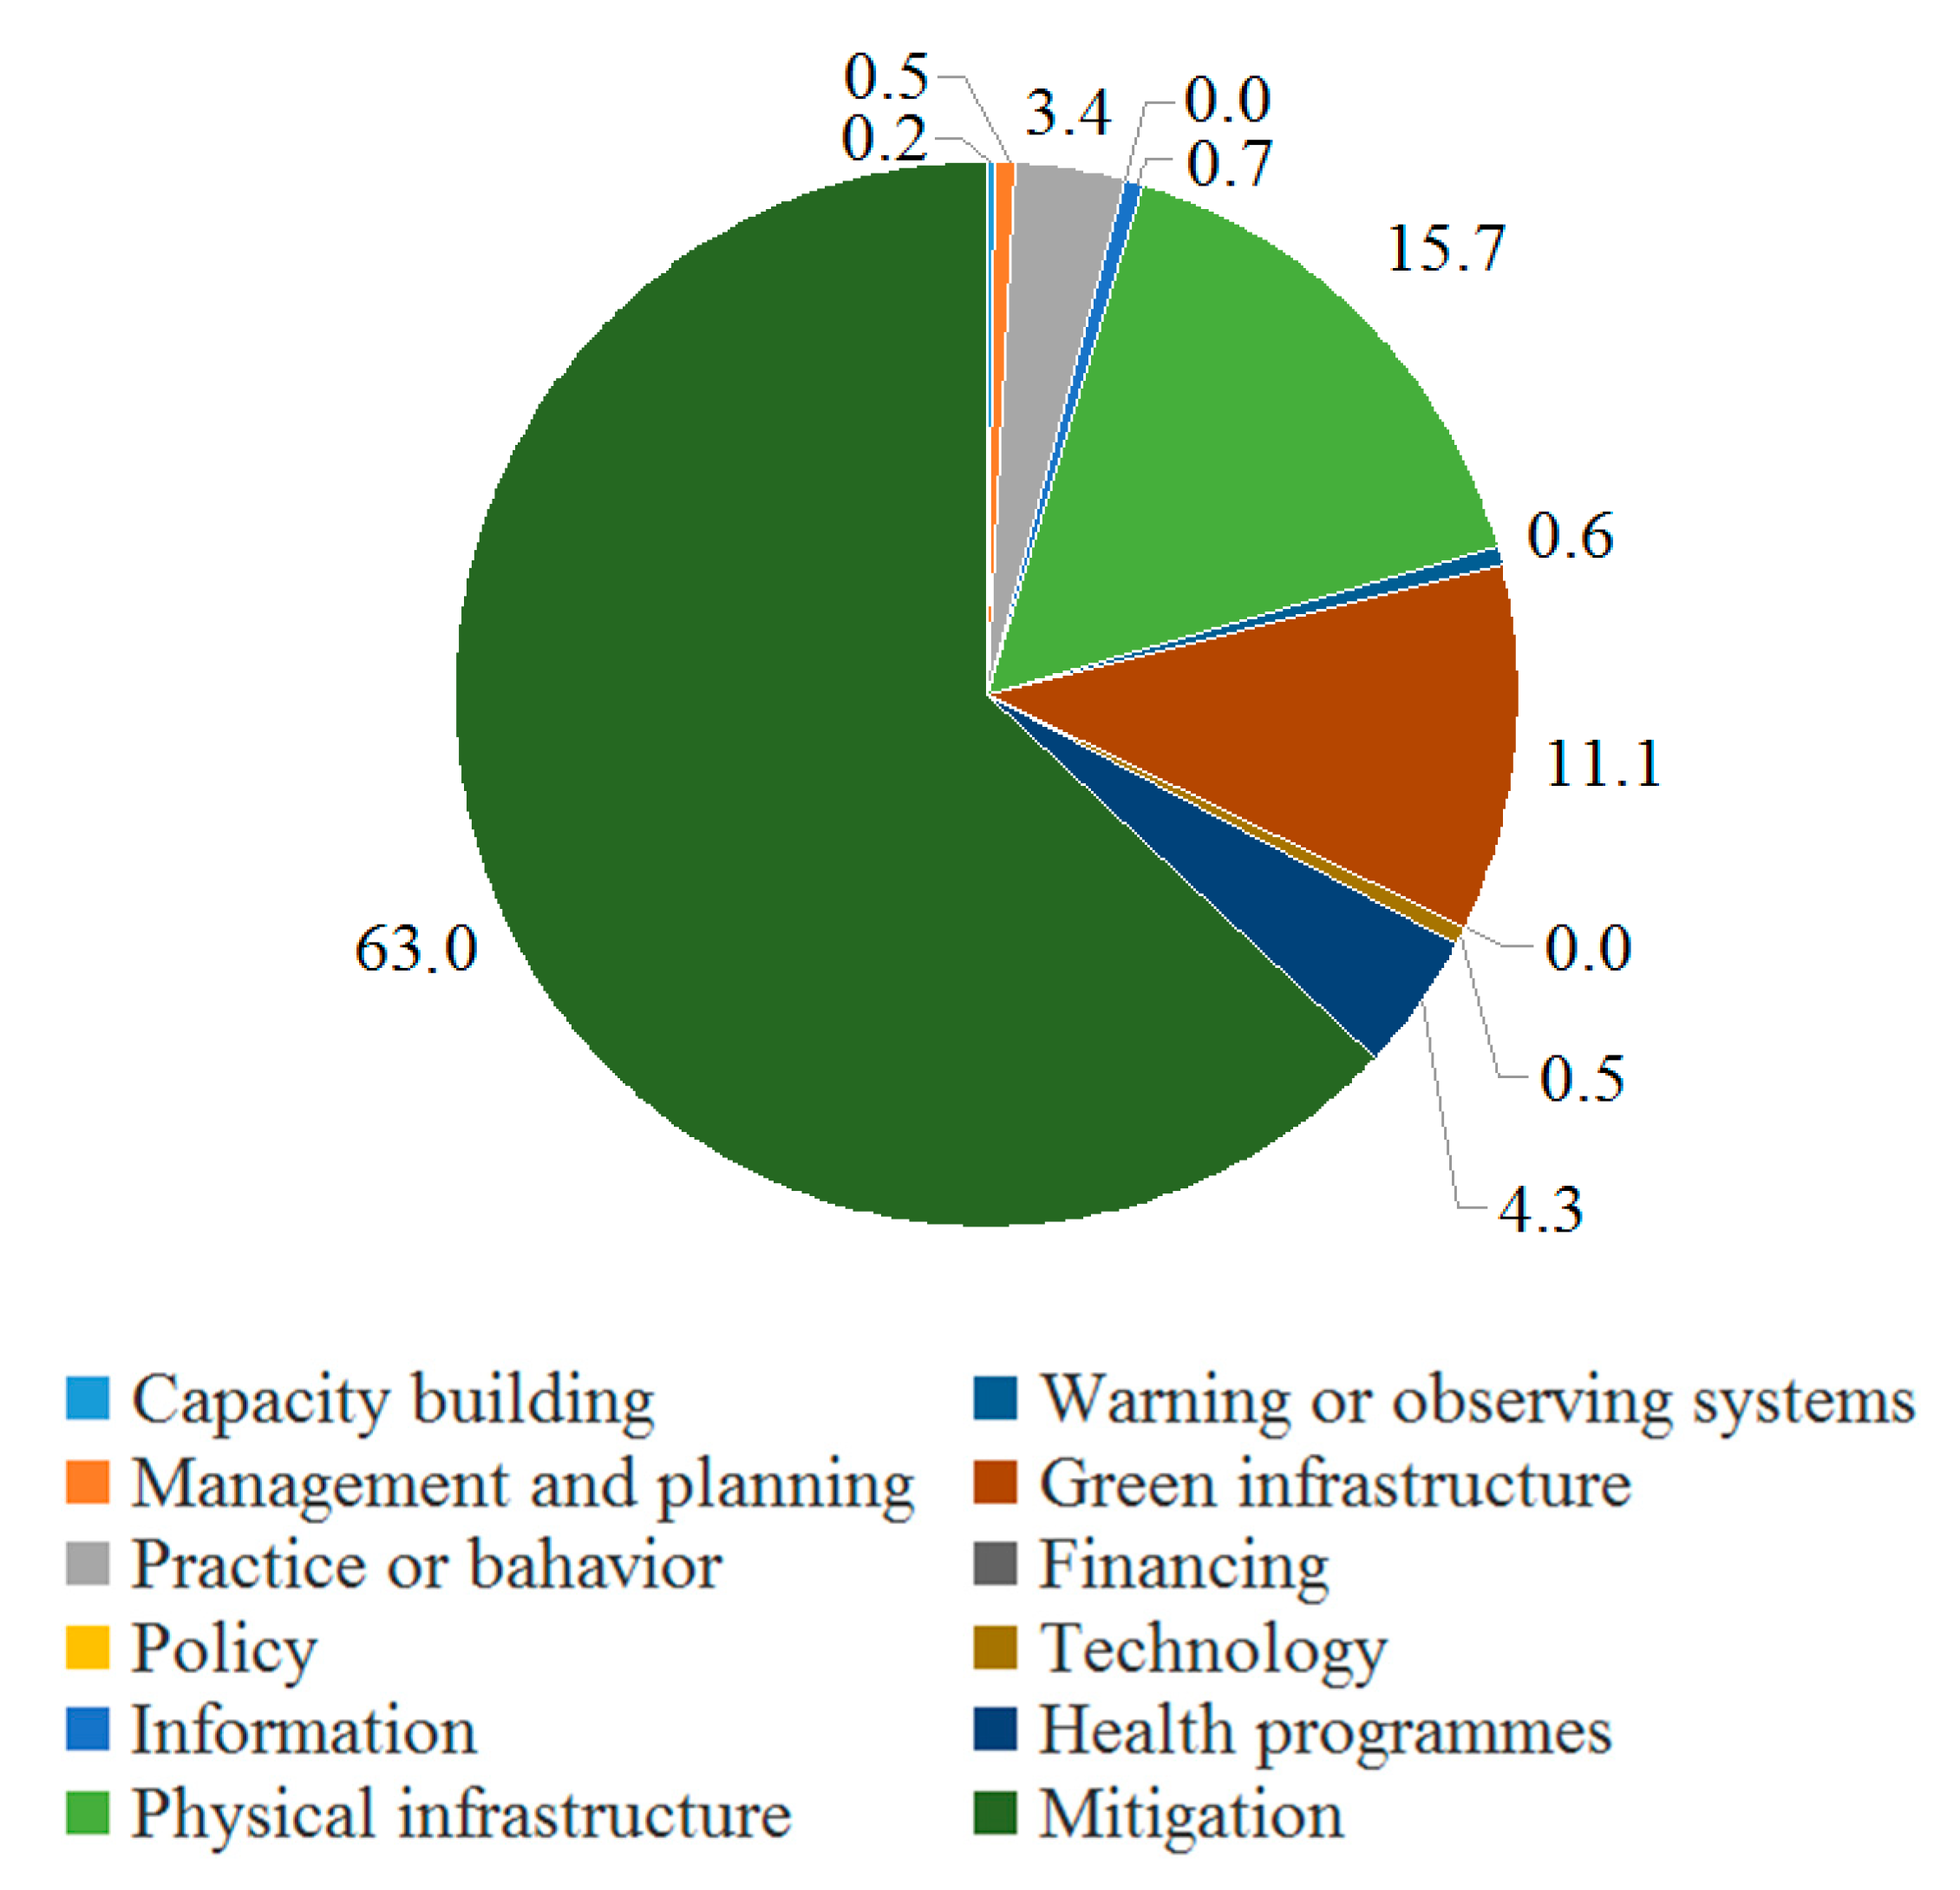
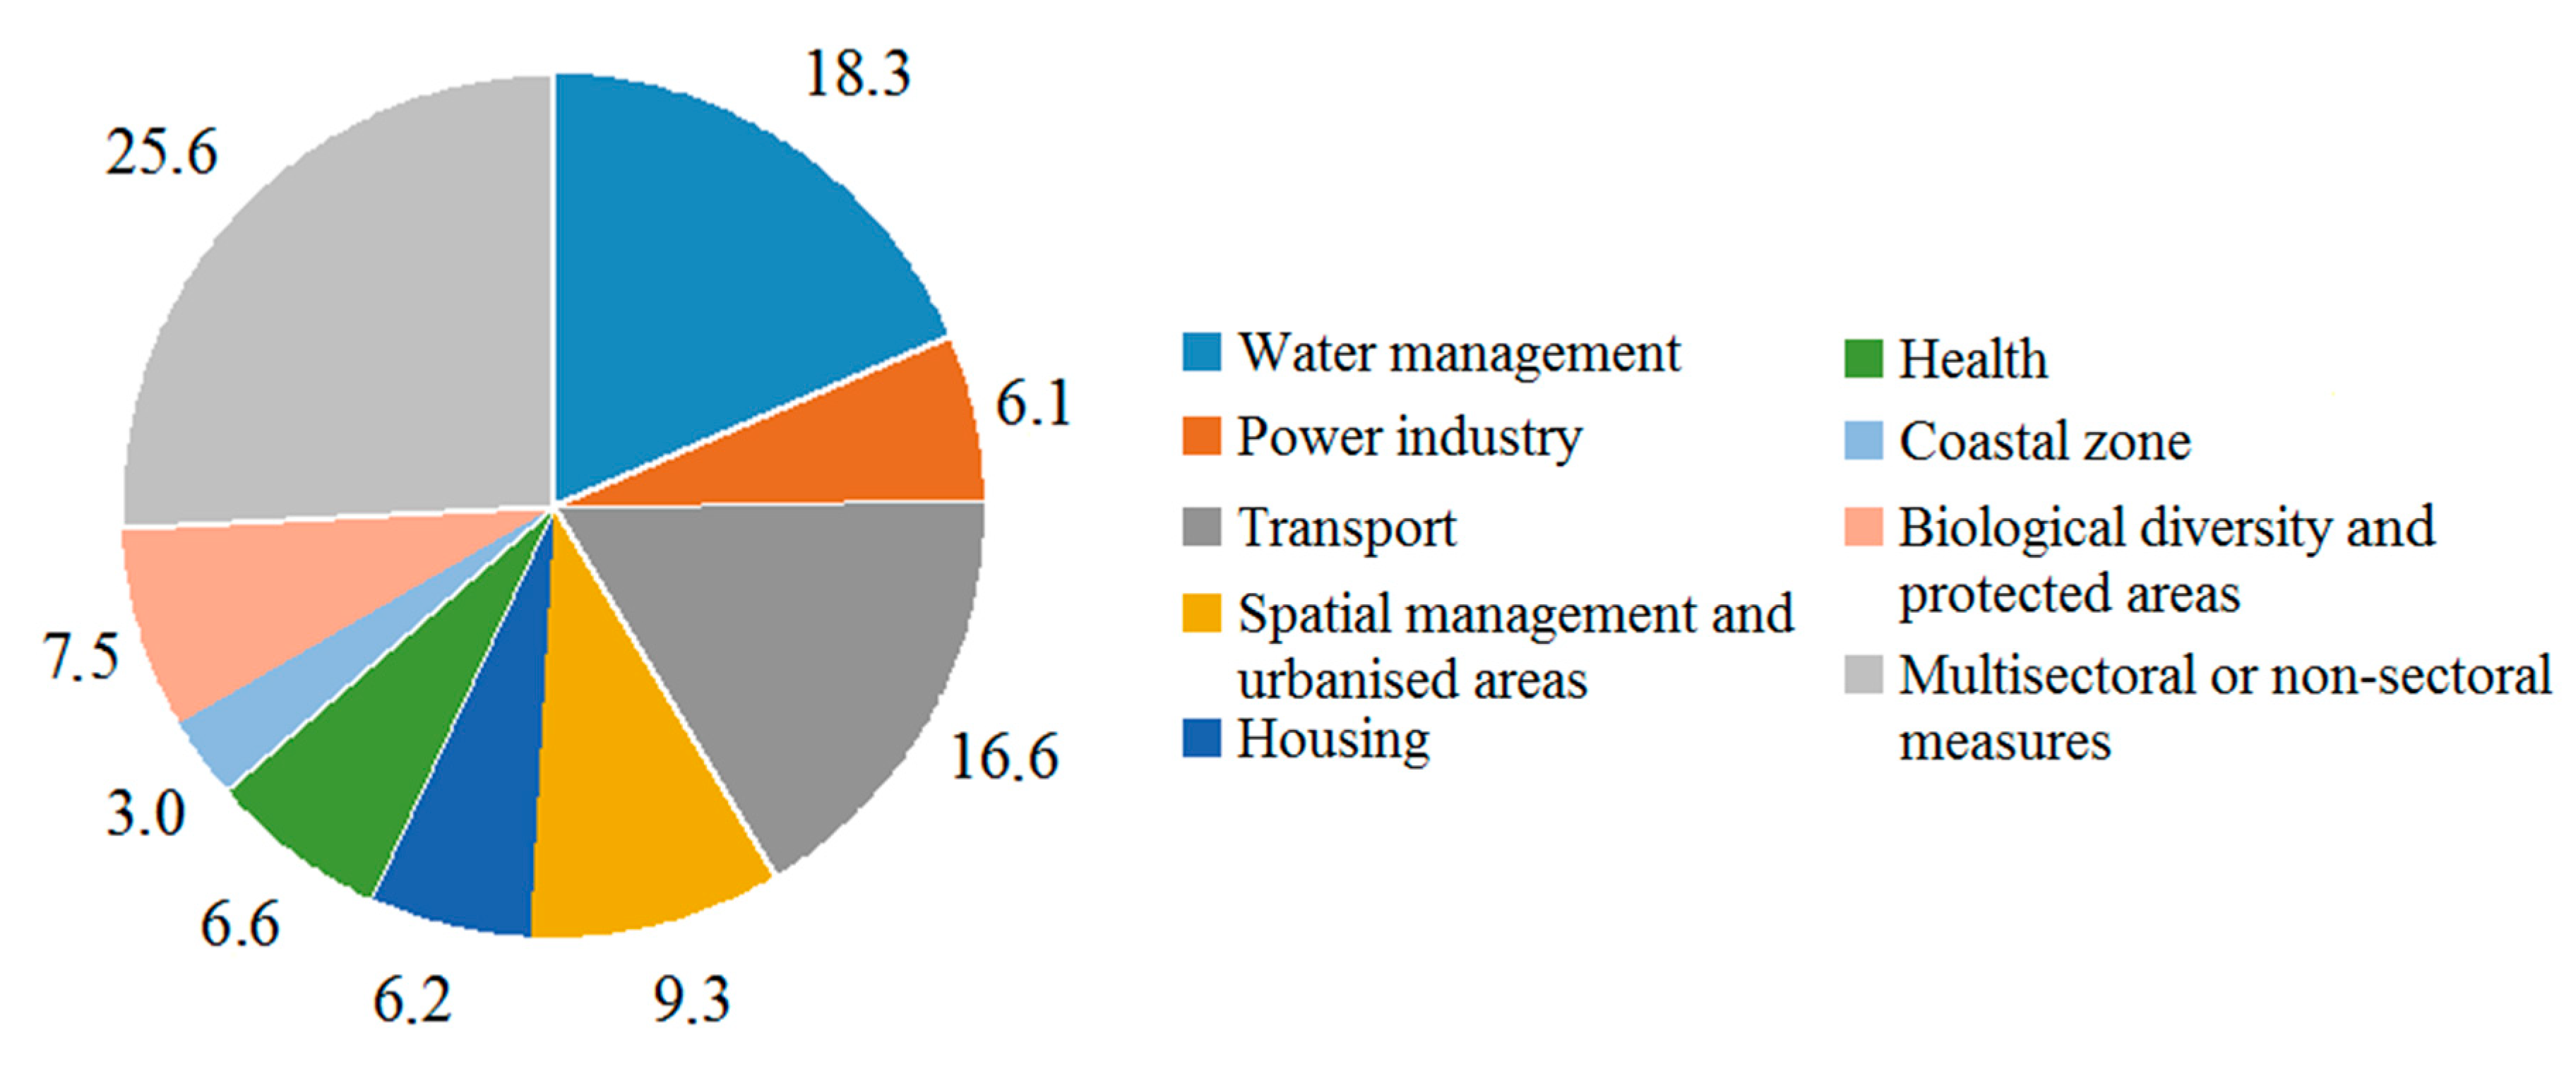
3.3. Classification of Finances Earmarked for Particular Types of Measures
3.4. Time of the Planned Implementation of Measures in Municipal Adaptation Plans
3.5. Measures by Vulnerable Sectors and Areas
4. Discussion
5. Conclusions
Author Contributions
Funding
Conflicts of Interest
Appendix A
Appendix B

| City | Maximum Temperature | Minimum Temperature | Heat Wave | Cold Wave | Inter-Day Temperature Change | Urban Heat Island | Air Pollution Concentration | Strong and Very Strong Wind | Thunderstorms, Hailstorms |
|---|---|---|---|---|---|---|---|---|---|
| Region: coastal zone | |||||||||
| Elbląg | + | + | + | + | |||||
| Gdańsk | + | + | + | + | |||||
| Gdynia | + | + | + | + | |||||
| Sopot | + | + | + | + | |||||
| Słupsk | ++ | ++ | + | ++ | ++ | ++ | |||
| Szczecin | + | + | + | + | + | + | + | + | + |
| Region: middle lowlands | |||||||||
| Bydgoszcz | ++ | ++ | ++ | ++ | ++ | ++ | |||
| Grudziądz | ++ | ++ | - | ++ | + | + | ++ | ++ | |
| Płock | ++ | ++ | ++ | ++ | |||||
| Toruń | ++ | ++ | ++ | ++ | ++ | ++ | ++ | ++ | |
| Włocławek | ++ | ++ | ++ | ++ | |||||
| Region: foothills | |||||||||
| Kraków | ++ | ++ | ++ | ++ | |||||
| Tarnów | ++ | ++ | ++ | ||||||
| Rzeszów | ++ | ++ | ++ | ++ | |||||
| City | Sea Level Rise | Heavy Downpours | Heavy Snowfalls in the Oct.-May Season | Long-Term Rain-Free Periods | Rain-Free Periods with a High Temperature | Water Shortage | River Floods | Flooding from the Sea | Flash/Urban Floods |
|---|---|---|---|---|---|---|---|---|---|
| Region: coastal zone | |||||||||
| Elbląg | ++ | + | - | + | ++ | ++ | ++ | ||
| Gdańsk | ++ | + | - | ++ | ++ | ++ | |||
| Gdynia | ++ | ++ | ++ | ++ | ++ | ||||
| Sopot | ++ | + | ++ | ++ | |||||
| Słupsk | ++ | ++ | ++ | ||||||
| Szczecin | + | + | + | + | + | + | |||
| Region: middle lowlands | |||||||||
| Bydgoszcz | ++ | ++ | ++ | ++ | |||||
| Grudziądz | ++ | - | ++ | + | + | ||||
| Płock | ++ | ++ | |||||||
| Toruń | ++ | ++ | ++ | ++ | |||||
| Włocławek | ++ | ||||||||
| Region: foothills | |||||||||
| Kraków | ++ | ++ | ++ | ++ | |||||
| Tarnów | ++ | ++ | ++ | ++ | |||||
| Rzeszów | ++ | ++ | ++ | ||||||
References
- Mills, G.; Cleugh, H.; Emmanuel, R.; Endlicher, W.; Erell, E.; McGranahan, G.; Ng, E.; Nickson, A.; Rosenthal, J.; Steemer, K. Climate information for improved planning and management of mega cities (Needs Perspective). Procedia Environ. Sci. 2010, 1, 228–246. [Google Scholar] [CrossRef]
- Sharma, D.; Tomar, S. Mainstreaming climate change adaptation in Indian cities. Environ. Urban. 2010, 22, 451–465. [Google Scholar] [CrossRef]
- Carter, J.G. Climate change adaptation in European cities. Curr. Opin. Environ. Sustain. 2011, 3, 193–198. [Google Scholar] [CrossRef]
- Bai, X.; Dawson, R.J.; Ürge-Vorsatz, D.; Delgado, G.C.; Barau, A.S.; Dhakal, S.; Dodman, D.; Leonardsen, L.; Masson-Delmotte, V.; Roberts, D.; et al. Six research priorities for cities and climate change. Nature 2018, 555, 23–25. [Google Scholar] [CrossRef]
- 2020 Climate & Energy Package. Available online: https://ec.europa.eu/clima/policies/strategies/2020_en (accessed on 6 September 2020).
- Polityka Energetyczna Polski Do 2030 Roku (Poland’s Energy Policy until 2030). Available online: https://www.gov.pl/web/klimat/polityka-energetyczna-polski-do-2030-roku (accessed on 6 September 2020).
- Polityka Energetyczna Polski do Roku 2040—Projekt (Poland’s Energy Policy until 2040—Draft). Available online: https://www.gov.pl/web/aktywa-panstwowe/zaktualizowany-projekt-polityki-energetycznej-polski-do-2040-r (accessed on 6 September 2020).
- Climate for Poland, Poland for Climate 1988–2018–2050. Available online: https://ios.edu.pl/wp-content/uploads/2019/03/Klimat-dla-Polski-Polska-dla-Klimatu_ANG-1.pdf (accessed on 6 September 2020).
- Intergovernmental Panel on Climate Change (IPCC). Climate Change 2014: Impacts, Adaptation, and Vulnerability. IPCC Working Group II Contribution to AR5 2014. Available online: http://ipcc-wg2.gov/AR5/ (accessed on 29 May 2020).
- Hughes, S. A meta-analysis of urban climate change adaptation planning in the U.S. Urban Clim. 2015, 14, 17–29. [Google Scholar] [CrossRef]
- Biagini, B.; Bierbaum, R.; Stults, M.; Dobardzic, S.; McNeeley, S.M. A typology of adaptation actions: A global look at climate adaptation actions financed through the Global Environment Facility. Glob. Environ. Chang. 2014, 25, 97–108. [Google Scholar] [CrossRef]
- Araos, M.; Berrang-Ford, L.; Ford, J.D.; Austin, S.E.; Biesbroek, R.; Lesnikowski, A. Climate change adaptation planning in large cities: A systematic global assessment. Environ. Sci. Policy 2016, 66, 375–382. [Google Scholar] [CrossRef]
- Mahammadzadeh, M.; Chrischilles, E.; Biebeler, H. Klimaanpassung in Unternehmen und Kommunen: Betroffenheiten, Verletzlichkeiten und Anpassungsbedarf; IW-Analysen; Institut der Deutschen Wirtschaft: Cologne, Germany, 2013. [Google Scholar]
- Reckien, D.; Flacke, J.; Dawson, R.J.; Heidrich, O.; Olazabal, M.; Foley, A.; Hamann, J.J.-P.; Orru, H.; Salvia, M.; De Gregorio Hurtado, S.; et al. Climate change response in Europe: What’s the reality? Analysis of adaptation and mitigation plans from 200 urban areas in 11 countries. Clim. Chang. 2014, 122, 331–340. [Google Scholar] [CrossRef]
- Reckien, D.; Flacke, J.; Olazabal, M.; Heidrich, O. The influence of drivers and barriers on urban adaptation and mitigation plans—an empirical analysis of European cities. PLoS ONE 2015, 10, e0135597. [Google Scholar] [CrossRef]
- EEA. Urban Adaptation to Climate Change in Europe2016: Transforming Cities in a Changing Climate; Report 12/2016; Publications Office of the European Union: Luxembourg, 2016. [Google Scholar] [CrossRef]
- Aylett, A. Progress and Challenges in the Urban Governance of Climate Change: Results of a Global Survey; Massachusetts Institute of Technology—Department of Urban Studies and Planning: Cambridge, MA, USA, 2014. [Google Scholar]
- Carmin, J.; Nadkarni, N.; Rhie, C. Progress and Challenges in Urban Climate Adaptation Planning: Results of a Global Survey; MIT: Cambridge, MA, USA, 2012. [Google Scholar]
- Liu, J.; Deng, X. Impacts and mitigation of climate change on Chinese cities. Curr. Opin. Environ. Sustain. 2011, 3, 188–192. [Google Scholar] [CrossRef]
- Heidrich, O.; Dawson, R.J.; Reckien, D.; Walsh, C.L. Assessment of the climate preparedness of 30 urban areas in the UK. Clim Chang. 2013, 120, 771–784. [Google Scholar] [CrossRef]
- Heidrich, O.; Reckien, D.; Olazabal, M.; Foley, A.; Salvia, M.; de Gregorio Hurtado, S.; Orru, H.; Flacke, J.; Geneletti, D.; Pietrapertosa, F.; et al. National climate policies across Europe and their impacts on cities strategies. J. Environ. Manag. 2016, 168, 36–45. [Google Scholar] [CrossRef] [PubMed]
- Canadell, J.G.; Raupach, M.R. Managing forests for climate change mitigation. Science 2008, 320, 1456–1457. [Google Scholar] [CrossRef] [PubMed]
- Knittel, N. Climate Change Adaptation: Options and Mechanisms under the UNFCCC”. Climate Policy Info Hub, 29 March 2016. Available online: http://climatepolicyinfohub.eu/climate-change-adaptation-options-and-mechanisms-under-unfccc (accessed on 6 September 2020).
- Castán Broto, V.; Bulkeley, H. A survey of urban climate change experiments in 100 cities. Glob. Environ. Chang. 2013, 23, 92–102. [Google Scholar] [CrossRef] [PubMed]
- Füsell, H.-M.; Klein, R.J.T. Climate change vulnerability assessments: An evolution of conceptual thinking. Clim. Chang. 2006, 75, 301–329. [Google Scholar] [CrossRef]
- Rosenzweig, C.; Solecki, W.; Romero-Lankao, P.; Mehrotra, S.; Dhakal, S.; Bowman, T.; Ibrahim, S.A. ARC3.2 Summary for city leaders. In Urban Climate Change Research Network; Columbia University: New York, NY, USA, 2015. [Google Scholar]
- Hunt, A.; Watkiss, P. Climate change impacts and adaptation in cities: A review of the literature. Clim. Chang. 2011, 104, 13–49. [Google Scholar] [CrossRef]
- Tompkins, E.L.; Adger, W.N.; Boyd, E.; Nicholson-Cole, S.; Weatherhead, K.; Arnel, N. Observed adaptation to climate change: UK evidence of transition to a well-adapting society. Glob. Environ. Chang. 2010, 20, 627–635. [Google Scholar] [CrossRef]
- Travis, W. Going to extremes: Propositions on the social response to severe climate change. Clim. Chang. 2010, 98, 1–19. [Google Scholar] [CrossRef]
- Eisenack, K.; Stecker, R.; Reckien, D.; Hoffmann, E. Adaptation to climate change in the transport sector: A review of actions and actors. Mitig. Adapt. Strat. Glob. Chang. 2012, 17, 451–469. [Google Scholar] [CrossRef]
- Fidelman, P.I.J.; Leitch, A.M.; Nelsond, D.R. Unpacking multilevel adaptation to climate change in the Great Barrier Reef, Australia. Glob. Environ. Chang. 2013, 23, 800–812. [Google Scholar] [CrossRef]
- Łabędzki, L. Actions and measures for mitigation drought and water scarcity in agriculture. J. Water Land Dev. 2016, 29, 3–10. [Google Scholar] [CrossRef]
- Tylkowski, J. Extreme weather events in Poland in the 21st century. J. Educ. Health Sport 2017, 7, 40–51. [Google Scholar] [CrossRef]
- Kalbarczyk, R.; Kalbarczyk, E.; Ziemiańska, M.; Raszka, B. Assessment of air thermal conditions in the lowland part of south-western Poland for agriculture development purposes. Atmosphere 2018, 9, 215. [Google Scholar] [CrossRef]
- MAP Bydgoszcz. Available online: https://bip.um.bydgoszcz.pl/binary/Planu%20adaptacji%20miasta%20Bydgoszczy%20do%20zmian%20klimatu%20do%20roku%202030_tcm30-258424.pdf (accessed on 29 May 2020).
- MAP Elbląg. Available online: http://www.marecki.home.pl/images/PLIKI/plan_adaptacji_do_zmian_klimatu.pdf (accessed on 29 May 2020).
- MAP Gdańsk. Available online: https://www.gdansk.pl/download/2018-11/117491.pdf (accessed on 29 May 2020).
- MAP Gdynia. Available online: https://bip.um.gdynia.pl/programy-w-2020-roku,8228/plan-adaptacji-miasta-gdyni-do-zmian-klimatu-do-roku-2030,541418 (accessed on 29 May 2020).
- MAP Grudziądz. Available online: http://bip.grudziadz.pl/strony/17312.dhtml (accessed on 29 May 2020).
- MAP Kraków. Available online: https://www.bip.krakow.pl/?dok_id=114317 (accessed on 29 May 2020).
- MAP Płock. Available online: http://dane.plock.eu/bip//dane/uchwaly/8%20kadencja%20RMP/4/Uchwała%8.20nr%2058.pdf (accessed on 29 May 2020).
- MAP Rzeszów. Available online: https://bip.erzeszow.pl/static/img/k02/SR/SR/Plan_adaptacji_miasta_Rzeszowa_do_zmian_klimatu_do_2030_roku.pdf (accessed on 29 May 2020).
- MAP Słupsk. Available online: www.bip.um.slupsk.pl/file/70125 (accessed on 29 May 2020).
- MAP Sopot (Project). Available online: https://bip.sopot.pl/Article/get/id,18916.html (accessed on 29 May 2020).
- MAP Szczecin. Available online: http://bip.um.szczecin.pl/files/1F59A64A3FE640B99C6349D70BA76DE5/MPA_SzczecinBIP_9_listopada18.pdf (accessed on 29 May 2020).
- MAP Tarnów. Available online: http://tarnow.esesja.pl/zalaczniki/58453/plan-adaptacji-miasta-tarnowa-do-zmian-klimatu_529938.pdf (accessed on 29 May 2020).
- MAP Toruń. Available online: https://www.torun.pl/sites/default/files/pliki/plan_adaptacji_miasta_torunia_do_zmian_klimatu_do_roku_2030.pdf (accessed on 29 May 2020).
- MAP Włocławek. Available online: http://www.bip.um.wlocl.pl/uchwala-w-sprawie-przyjecia-planu-adaptacji-miasta-wloclawek-do-zmian-klimatu-do-roku-2030/ (accessed on 29 May 2020).
- MAP 2012. Bydgoszcz. Available online: https://docplayer.pl/13601995-Plan-ochrony-klimatu-i-adaptacji-do-skutkow-zmian-klimatu-dla-miasta-bydgoszczy-na-lata-2012-2020.html (accessed on 29 May 2020).
- SPA 2013. Available online: https://bip.mos.gov.pl/strategie-plany-programy/strategiczny-plan-adaptacji-2020/ (accessed on 9 January 2020).
- Kalbarczyk, R.; Kalbarczyk, E.; Raszka, B. Temporal changes in concentration of PM10 dust in Poznań, middle-west Poland as dependent on meteorological conditions. Appl. Ecol. Environ. Res. 2018, 16, 1999–2014. [Google Scholar] [CrossRef]
- Kalbarczyk, R.; Kalbarczyk, E. Meteorological conditions of the winter-time distribution of nitrogen oxides in Poznań: A proposal for a catalog of the pollutants variation. Urban Clim. 2020, 33, 100649. [Google Scholar] [CrossRef]
- Li, S.; Juhász-Horváth, L.; Harrison, P.A.; Pintér, L.; Rounsevell, M.D.A. Relating farmer’s perceptions of climate change risk to adaptation behaviour in Hungary. J. Environ. Manag. 2017, 185, 21–30. [Google Scholar] [CrossRef]
- Zandvoort, M.; Campos, I.S.; Vizinho, A.; Penha-Lopes, G.; Krkoška Lorencová, E.; van der Brugge, R.; van der Vlist, M.J.; van den Brink, A.; Jeuken, A.B.M. Adaptation pathways in planning for uncertain climate change: Applications in Portugal, the Czech Republic and the Netherlands. Environ. Sci. Policy 2017, 78, 18–26. [Google Scholar] [CrossRef]
- Krkoška Lorencová, E.; Loučková, B.; Vačkářů, D. Perception of climate change risk and adaptation in the Czech Republic. Climate 2019, 7, 61. [Google Scholar] [CrossRef]
- Masson, V.; Marchadier, C.; Adolphe, L.; Aguejdad, R.; Avner, P.; Bonhomme, M.; Bretagne, G.; Briottet, X.; Bueno, B.; de Munck, C.; et al. Adapting cities to climate change: A systemic modelling approach. Urban Clim. 2014, 10, 407–429. [Google Scholar] [CrossRef]
- Walsh, C.L.; Dawson, R.J.; Hall, J.W.; Barr, S.L.; Batty, M.; Bristow, A.L.; Carney, S.; Dagoumas, A.S.; Ford, A.C.; Harpham, C.; et al. Assessment of climate change mitigation and adaptation in cities. Urban Des. Plan. 2011, 164, 75–84. [Google Scholar] [CrossRef]
- Hardoy, J.; Lankao, P.R. Latin American cities and climate change: Challenges and options to mitigation and adaptation responses. Curr. Opin. Environ. Sustain. 2011, 3, 158–163. [Google Scholar] [CrossRef]
- Bulkeley, H.; Castán Broto, V. Government by experiment? Global cities and the governing of climate change. Trans. Inst. Br. Geogr. 2013, 38, 361–375. [Google Scholar] [CrossRef]
- Szczuraszczek, T.; Chmielewski, J. Sustainable transport development and passenger transport demand in Poland. In Proceedings of the 3rd Scientific Conference Environmental Challenges in Civil Engineering (ECCE 2018) (MATEC Web of Conferences), Opole, Poland, 23–25 April 2018; Volume 174, p. 01021. [Google Scholar] [CrossRef]
- Taczanowski, J.; Kołoś, A.; Gwosdz, K.; Domański, B.; Guzik, R. The development of low-emission public urban transport in Poland. Bull. Geogr. Soc.-Econ. Ser. 2018, 41, 79–92. [Google Scholar] [CrossRef]
- Charlesworth, S.M. A review of the adaptation and mitigation of global climate change using sustainable drainage in cities. J. Water Clim. Chang. 2010, 1, 165–180. [Google Scholar] [CrossRef]
- Ayers, J.; Huq, S.; Wright, H.; Faisal, A.M.; Hussain, S.T. Mainstreaming climate change adaptation into development in Bangladesh. Clim. Dev. 2014, 6, 293–305. [Google Scholar] [CrossRef]
- Roberts, D.; O’Donoghue, S. Urban environmental challenges and climate change action in Durban, South Africa. Environ. Urban. 2013, 25, 299–319. [Google Scholar] [CrossRef]
- Official Journal of the Voivodeship 2016. Available online: http://edziennik.malopolska.uw.gov.pl/legalact/2016/812/ (accessed on 9 January 2020).
- BDL 2019. Statistics Poland. Available online: https://bdl.stat.gov.pl/BDL/dane/podgrup/tablica (accessed on 9 January 2020).
- Podręcznik adaptacji dla miast. Wytyczne do przygotowania Miejskiego Planu Adaptacji do zmian klimatu (Adaptation Handbook for Cities. Guidelines for the Preparation of the Municipal Plan of Adaptation to Climate Change). Available online: https://klimada.mos.gov.pl/wp-content/uploads/2015/09/Podr%C4%99cznik-adaptacji-dla-miast1.pdf (accessed on 6 September 2020).
- Kettle, N.P.; Dow, K. Cross-level differences and similarities in coastal climate change adaptation planning. Environ. Sci. Policy 2014, 44, 279–290. [Google Scholar] [CrossRef]


| City | Latitude and Longitude | Hs [m a.s.l.] | Area [km2] | Number of Residents | MAP Approval Date |
|---|---|---|---|---|---|
| Region: coastal zone | |||||
| Elbląg | 54°09′30″ N 19°24′10″ E | 1.8–92 | 79.82 | 120,895 | 2019-04-18 |
| Gdańsk | 54°20′51″ N 18°38′43″ E | −1.6–181 | 261.96 | 464,293 | 2019-08-29 |
| Gdynia | 54°31′09″ N 18°32′22″ E | 0–206 | 135.14 | 246,306 | 2019-04-24 |
| Sopot | 54°26′31″ N 18°33′35″ E | 0–153 | 17.28 | 37,089 | pending approval |
| Słupsk | 54°27′57″ N 17°01′45″ E | 22 | 43.15 | 92,869 | 2019-01-30 |
| Szczecin | 53°26′17″ N 14°32′32″ E | −0.1–131 | 300.55 | 404,403 | 2019-05-28 |
| Region: middle lowlands | |||||
| Bydgoszcz | 53°07′30″ N 18°00′40″ E | 28–107 | 175.98 | 353,215 | 2019-09-04 |
| Grudziądz | 53°29′13″ N 18°45′25″ E | 50 | 59.29 | 95,629 | 2019-06-19 |
| Płock | 52°32′50″ N 19°42′00″ E | 58–105 | 88.06 | 120,787 | 2019-01-31 |
| Toruń | 53°01′20″ N 18°36′40″ E | 34–95 | 115.72 | 202,482 | 2019-11-21 |
| Włocławek | 52°39′39″ N 19°04′07″ E | 90 | 84.32 | 111,752 | 2019-02-19 |
| Region: foothills | |||||
| Kraków | 50°03′41″ N 19°56′18″ E | 188–383 | 326.85 | 766,739 | pending approval |
| Tarnów | 50°01′45″ N 20°58′18″ E | 190–293 | 72.38 | 109,358 | 2019-09-12 |
| Rzeszów | 50°02′01″ N 22°00′17″ E | 197–384 | 126.57 | 190,849 | 2019-08-27 |
| Type of Measures | Description of the Measures | Examples of the Measures Recorded in the MAPs |
|---|---|---|
| Capacity building | Education programmes, workshops | - education/promotion/information about good practices - preparation of operational instructions for public services |
| Management and planning | Incorporating understanding of climate risk into government and institutional planning and management; developing an adaptation plan | - overview and correction of existing urban crisis management models - preparation of guidelines, analyses, conceptions considering the need to adapt a city for climate change |
| Practice or behaviour | Rainwater collection, land management techniques | - implementation of water management programmes - increasing the share of biologically active surfaces by reducing the impermeable surfaces in a city or unsealing them |
| Policy | Creations, revisions or regulations of policies to adapt to changing climate | - development of water management programmes |
| Information | Decision support tools, communication tools, digital databases | - gathering data on unfavourable implications of threats (including the loss of possessions) - an internet tool for sharing knowledge of adaptation |
| Physical infrastructure | Residential programmes, upgrades or hardening of building and infrastructure | - construction of water reservoirs with the elements of blue–green infrastructure - protection of shores exposed to the influence of waves |
| Warning or observing systems | Monitoring systems, upgrade weather services | - construction of a system providing information about threats in public space - expansion of urban air quality monitoring |
| Green infrastructure | Tree planting and care, green roofs | - creating flower meadows - construction and development of parks |
| Financing | New financing or insurance strategies | - “green” citizens’ budget |
| Technology | Develop climate-resilient technologies: to improve water use | - a project of thermovision research of buildings - an energy efficiency park |
| Health programmes | Cooling centres, Shade Policy, help for vulnerable people | - construction of the solution system to ensure a thermal comfort of inhabitants - strengthening rescue services in relation to climate change, exercises of rescue services and equipment supply |
| Mitigation | Sustainable transportation, energy efficiency, renewable energy | - expansion of bike paths and pedestrian routes (in the vicinity of transport systems) - programmes of heat source exchange and installation of heating in buildings, apartments and others |
| City | Heat | Frost | Heavy Rainfall and Storms | Urban Flood | Flood | Flood from the Sea | Drought | Gale | Landslide | Sea Level Rise |
|---|---|---|---|---|---|---|---|---|---|---|
| Region: coastal zone | ||||||||||
| Elbląg | + | + | + | ++ | ++ | ++ | + | + | + | |
| Gdańsk | + | + | ++ | ++ | + | + | + | ++ | ||
| Gdynia | + | + | ++ | ++ | + | ++ | + | + | ||
| Sopot | + | + | ++ | ++ | + | + | ||||
| Słupsk | + | ++ | ++ | ++ | + | + | ++ | |||
| Szczecin | + | + | + | + | + | |||||
| Region: middle lowlands | ||||||||||
| Bydgoszcz | ++ | ++ | ++ | |||||||
| Grudziądz | + | + | ++ | |||||||
| Płock | ++ | ++ | + | ++ | ||||||
| Toruń | ++ | ++ | ++ | ++ | ||||||
| Włocławek | ++ | + | ++ | |||||||
| Region: foothills | ||||||||||
| Kraków | ++ | ++ | ++ | ++ | ++ | |||||
| Tarnów | ++ | ++ | ++ | ++ | ||||||
| Rzeszów | ++ | ++ | ++ | ++ | + | |||||
© 2020 by the authors. Licensee MDPI, Basel, Switzerland. This article is an open access article distributed under the terms and conditions of the Creative Commons Attribution (CC BY) license (http://creativecommons.org/licenses/by/4.0/).
Share and Cite
Kalbarczyk, E.; Kalbarczyk, R. Typology of Climate Change Adaptation Measures in Polish Cities up to 2030. Land 2020, 9, 351. https://doi.org/10.3390/land9100351
Kalbarczyk E, Kalbarczyk R. Typology of Climate Change Adaptation Measures in Polish Cities up to 2030. Land. 2020; 9(10):351. https://doi.org/10.3390/land9100351
Chicago/Turabian StyleKalbarczyk, Eliza, and Robert Kalbarczyk. 2020. "Typology of Climate Change Adaptation Measures in Polish Cities up to 2030" Land 9, no. 10: 351. https://doi.org/10.3390/land9100351
APA StyleKalbarczyk, E., & Kalbarczyk, R. (2020). Typology of Climate Change Adaptation Measures in Polish Cities up to 2030. Land, 9(10), 351. https://doi.org/10.3390/land9100351